Abstract
SET domain group encoding proteins function as histone lysine methyltransferases. These proteins are involved in various biological processes, including plant development and adaption to the environment by modifying the chromatin structures. So far, the SET domain genes (SDGs) have not been systematically investigated in Brassica napus (B. napus). In the current study, through genome-wide analysis, a total of 122 SDGs were identified in the B. napus genome. These BnSDGs were subdivided into seven (I–VII) classes based on phylogeny analysis, domain configurations, and motif distribution. Segmental duplication was involved in the evolution of this family, and the duplicated genes were under strong purifying selection. The promoter sequence of BnSDGs consisted of various growth, hormones, and stress-related cis-acting elements along with transcription factor binding sites (TFBSs) for 20 TF families in 59 of the 122 BnSDGs. The gene ontology (GO) analysis revealed that BnSDGs were closely associated with histone and non-histone methylation and metal binding capacity localized mostly in the nucleus. The in silico expression analysis at four developmental stages in leaf, stem root, floral organ, silique, and seed tissues showed a broad range of tissue and stage-specific expression pattern. The expression analysis under four abiotic stresses (dehydration, cold, ABA, and salinity) also provided evidence for the importance of BnSDGs in stress environments. Based on expression analysis, we performed reverse transcription-quantitative PCR for 15 target BnSDGs in eight tissues (young leaf, mature leaf, root, stem, carpel, stamen, sepal, and petals). Our results were in accordance with the in silico expression data, suggesting the importance of these genes in plant development. In conclusion, this study lays a foundation for future functional studies on SDGs in B. napus.
1. Introduction
The nucleosome, which is made up of two DNA strands wrapped around histone proteins (octamer), is the most fundamental unit of eukaryotic chromatin material. The histone octamer consists of two copies of each H2A, H2B, H3, and H4 histone protein [1]. Various alterations to the N-terminus of these histone proteins, such as methylation, acetylation, phosphorylation, sumoylation, glycosylation, ubiquitination, and ADP-ribosylation, influence the gene expression epigenetically [2,3]. Besides the other modifications, methylation at the specific lysine residue of histone protein is one of the important epigenetic modifications that affect the transcriptional regulation process. A SET domain is found in most of the proteins involved in histone methylation and constitutes a SET domain methyltransferase family. All the histone lysine methyltransferases (HMKTases) contain a conserved SET domain except the HMKTase that catalyzes the methylation of H3K79 [4]. HMKTases, with the help of SET domains, facilitate the transfer of methyl group from cofactor S-adenosylmethionine (AdoMet) to histone 3 (H3) lysine residues at positions 4, 9, 27, and 36, and histone 4 (H4) at position 20 [5]. One, two, or three methyl groups can be found on each lysine. In plants and animals, dimethylation or/and trimethylation of H3K4 and H3K36 can lead to gene activation, whereas transcriptional inactivation is caused by dimethylation of H3K9 and trimethylation of H3K27 [5]. Non-histone proteins, such as the rubisco, are also methylated by these SET domain-containing methyltransferases [6].
The SET domain group (SDG) protein family is named after the conserved regions of three proteins, initially identified in Drosophila. These three proteins are SUPPRESSOR OF VARIEGATION (Suv), enhancer of zeste E(Z), and TRITHORAX (TRX). The underlined letters constitute the name “SET”. The SET domain consists of approximately 130 to 150 amino acids. There are two parts of the SET domain, designated as SET-N and SET-C. Along with SET-N and SET-C, the overall structure includes an insert region (SET-I) with substantial structural diversity in flanking regions [7]. The SET-N has nine cysteine residues and is known as pre-SET; Zn atoms bind to them and stabilize the structure, whereas the SET-C consists of three cysteine residues, known as post-SET, which also participate in the zinc-binding site. Both flanking N and C terminal sequences of the SET domain facilitate methyltransferase activity [8]. In Arabidopsis thaliana (A. thaliana), the SDG gene family is subdivided into seven classes based on the domain architecture, function, and the presence of other domains along with the SET domain. These classes are (I) enhancer of zeste E(Z) homologs that methylate H3K27, (II) ASH1 (trithorax group protein) homologs that methylate H3K36, (III) trithorax homologs and related proteins, methylate H3K4, (IV) proteins PHD domain along with SET, methylate H3K4, (V) suppressor of variegation (Su(var)) homologs and relatives that methylate H3K9, (VI) interrupted SET domain-containing proteins with SET and myeloid-Nervy-DEAF-1 (SYMD), methylate H3K36, and (VII) rubisco methyltransferase (RBCMT) and other SET-related proteins (SETD) involved in non-histone methylation. Four classes, E(z), Ash, Trx, and Suv, are considered to be the principal classes [9,10]. It has been observed that numerous processes have been implicated in determining the regulation and mode of action of these SET domain-containing proteins [10].
SDG gene family has been identified in many plant species including A. thaliana [11], Brassica rapa [12], Populus trichocarpa [13], Vitis vinifera [14], Zea mays [15], Oryza sativa [16], Solanum lycopersicum [17], Citrus sinensis [18], Litchi chinensis [19], Gossypium raimondii [20], Setaria italic [21], Triticum aestivum [22], and Dendrobium catenatum [23] with 49, 67, 59, 33, 43, 43, 52, 47, 48, 52, 53, 166, and 44 members, respectively.
Until now, several SDGs are functionally characterized in plants. During plant development, these SDGs were implicated in a variety of biological activities [24,25,26,27,28,29,30,31], such as MEA and SWN are required for the development, dormancy, and germination of Arabidopsis seeds [29,32,33]. ASHH2 participates in shoot branching, ashh2 mutants developed additional shoot branches than wild Arabidopsis plants due to reduced histone H3K4 and K36 methylation [34]. ATX1 maintains the root architecture system from regulating the cell production to cell elongation in root apical meristem [35], whereas the CLF is also involved in vegetative growth such as root and leaf development [36] in Arabidopsis plants. SDGs have a significant impact on reproductive development as well. ATXR3 controls the pollen development and female gametophyte development [37], while the overexpression of ASHR3 or ATXR5–6 leads to male sterility through methylation regulation of H3K4 and K36 [26,38]. SDGs influence flowering via altering the histone methylation levels of flowering time genes. For instance, ATX1 and ATXR3 are the repressor of FLC and deposit the H3K4me3 marks at the FLC locus to control flowering time in Arabidopsis [39,40,41]. Additionally, CLF also maintains the repressive mark at H3K27me by PRC-complex regulation and controls flowering through FLC inactivation [42]. The ashh2 mutant induced early flowering via FLC repression in A. thaliana and B. napus [30,43]. The SDGs take part in the activation of gene expression as well; for example, SUVH1, SUVH3, SUVH7, SUVH8 prevent the DNA hyper-methylation at approximately 1000 genomic places through the regulation of ROS1 gene expression [44]. The SETD genes cause trimethylation of rubisco and regulate the carbon fixation process during the Calvin cycle [45]. The SDGs are also involved in response to external cues, including both abiotic and biotic stresses [21,22,37,46,47,48,49]. ATX1 facilitates the H3K4me3 modification and activates the ABA biosynthesis gene named NCED3 to improve Arabidopsis drought tolerance [47]. ASHH2 activates the defense-related genes against P. syringae in tomato plants [50]. These findings indicate that the SDGs alter the histone methylation signals and affect the growth and adaptation of plants.
Brassica napus L. (B. napus) is one of the essential oilseed crops around the world and is formed by the recent hybridization of Brassica rapa and Brassica oleracea [51]. To date, the SDG gene family has not been reported in B. napus. In the current project, we identified 122 BnSDGs. In addition to physical mapping to chromosomes, evolutionary analysis, gene, and protein structure analysis, promoter cis elements along with transcription factor binding sites prediction and gene ontology (GO), we also analyzed their tissue and developmental stage-specific expression pattern behaviors from publically available RNA sequencing data and verified potential 15 candidate genes in eight tissues through quantitative reverse transcriptase PCR. The detailed characterization of these genes broadened our knowledge of SDGs in B. napus.
2. Results
2.1. Identification of SDGs in B. napus
In the current study, we identified 122 BnSDGs in the B. napus genome, and each gene was named after its homolog in A. thaliana [9,12]. The BnSDG homologs were given the same name and differentiated by using A and B, according to the localization of genes on the A or C subgenome, respectively. If more than one SDG homologs belonged to one AtSDG, they were differentiated by numbers 1, 2, 3... such as BnASHH3.1A, BnASHH3.1B, BnASHH3.2A, BnASHH3.2B. We also identified 65 and 37 homologs of BnSDGs in B. rapa and B. oleracea, respectively. These genes were also named in the same way, and more than one homolog for one A. thaliana gene was differentiated by using alphabets, a, b, c... such as for B. oleracea, BoASHH3a, BoASHH3b, and for B. rapa, BrASHH3a, and BrASHH3b. SET domain was present in all the identified SDGs.
The homologs for BnaA05g17880D, BnaCnng44980D, and BnaA09g52100D, BnaCnng01720D were not annotated as SDGs in A. thaliana (At1g33400, At1g43245), as reported in the previous report [12]. The detailed information of 122 BnSDGs is described in Table 1. A total of 64 genes belong to the A subgenome, whereas 58 genes belong to the C subgenome (Table 1). The gene length varied from 1149 (BnASHR2.1A) to 10,285 bp (BnATXR3.1A) with the presence of 1–26 exons per gene. The CDS length varied from 774 to 6897 bp, and the protein length varied from 257 to 2298 amino acids. The isoelectric points were ranged from 4.49 to 9.55 (Table 1). Moreover, the GRAVY (grand average of hydrophobicity) index was ranged from −0.876 to −0.027. The subcellular localization results revealed that 94 proteins were localized to nuclear regions, 15 proteins were localized in the cytoplasmic region of the cell, 7 proteins were found in the extracellular region, and the remaining fraction of proteins were specifically located in the mitochondrion, plasma membrane, endoplasmic reticulum (Table 1).

Table 1.
A summary of detailed characteristics of SDG in Brassica napus.
2.2. Phylogenetic Analysis of BnSDGs
To further characterize and find the evolutionary relationship of BnSDGs with A. thaliana and B. napus ancestral species (B. rapa and B. oleracea), we constructed a phylogenetic tree, using NJ (neighbor-joining) method with SET domain sequence of 122 BnSDGs, 49 AtSDGs, 65 BrSDGs, and 37 BoSDGs (Figure 1). The BnSDGs were assigned to I–VII classes based on their sequence homology with SDGs with A. thaliana, B. rapa, and B. oleracea with well-supported bootstraps indication. We found that 9, 15, 16, 8, 41, 11, and 22 BnSDGs belonged to Classes I–VII, respectively. The four principal groups (E(z)), Ash, Trx, and Suv contained a total of 40% (81/122) BnSDGs (Figure 1). Suv class comprised of largest group SET domain-containing SDGs among all the other groups. The homologs of newly identified AtSDGs At1g33400 and At1g43245 were evolutionarily related to Class VI members. All the identified classes were subcategorized into one (Class IV) to seven (Class V) orthology groups (Table S2).
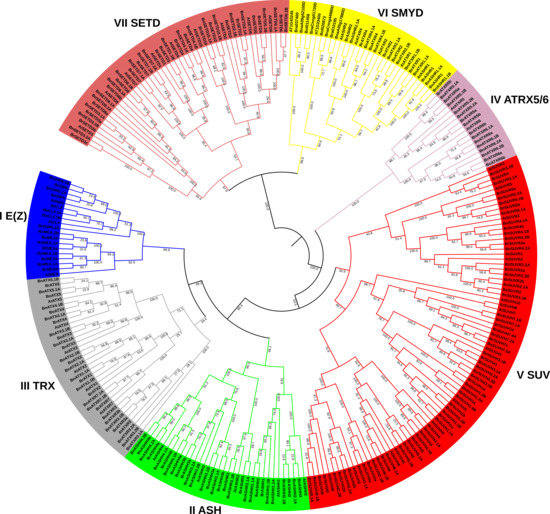
Figure 1.
A neighbor-joining (NJ) phylogenetic tree of SDG proteins based on SET domain sequence between Brassica napus (B. napus), Brassica rapa (B. rapa), Brassica oleracea (B. oleracea), and Arabidopsis thaliana (A. thaliana). The SDGs were grouped into seven classes (I–VII) with 1000 bootstrap replication. Each class is represented by a unique color code. All the nodes represent bootstrap values.
2.3. Assignment of BnSDGs to Chromosomes and Synteny Analysis
We investigated the physical location of SDGs by analyzing the distribution of the genes on the B. napus chromosomes (Figure 2). The results showed that 122 BnSDGs are distributed on all 19 chromosomes and the random fragment chromosomes. A total of 64 BnSDGs were located in the A subgenome whereas, 58 genes were located on the C subgenome. There was no special distribution arrangement on the chromosomes for all the I–VII classes of BnSDGs. Moreover, chromosome A09 showed a maximum number of genes (14), and chromosome Cnn displayed a maximum of eight genes in the C subgenome. Each of A01, A08, A09_random, A02_random, A08_random, C01, C01_random, C04_random chromosomes contained a single SDG gene. As Class V is the largest class, its members were distributed on all the chromosomes except chromosome A01, C01, and Cnn. Most of the genes were located at the terminal regions of the chromosomes; only a few were distributed near the centric regions (Figure 2).
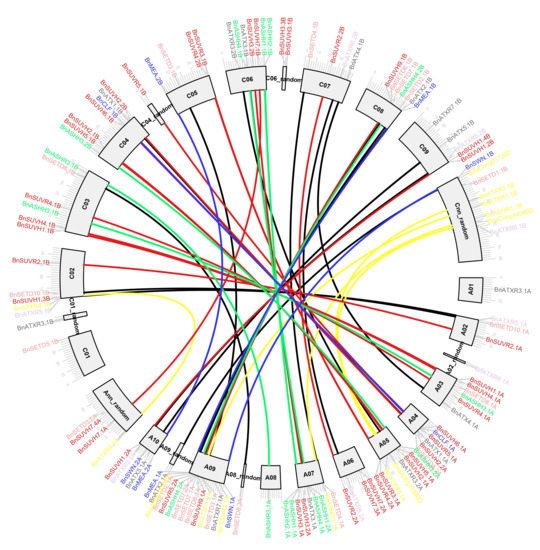
Figure 2.
Location of SDGs on B. napus chromosomes. The gene names are mentioned outward of each chromosome. The scale bar represents Mb. The Class I E(z), II Ash, III Trx, IV ATXR5/6, V Suv, VI SMYD, VII SETD BnSDGs are represented by blue, green, gray, purple, red, yellow, and rust color, respectively. The connected lines between the chromosomes represent the duplicated gene pairs.
The collinearity analysis releveled the strong orthologous relationship of SDG genes between B. napus and A. thaliana (Figure 3, Table S3). Our results showed that 20, 21, 16, 12, and 24 BnSDGs were collinear with chromosomes 1, 2, 3, 4, and 5 of A. thaliana, respectively. All the Class IV BnSDGs showed syntenic relation with chromosome 5 only, whereas Class III and Class VII BnSDGs had shown collinearity with all the five chromosomes of A. thaliana. These results suggest that BnSDGs have sustained the syntenic blocks with the ancestor plant (A. thaliana) and the expansion of the SDGs could be the result of duplication events in B. napus.
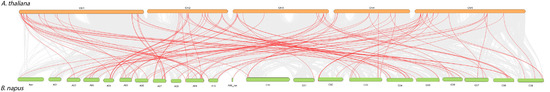
Figure 3.
Collinearity analysis of SDGs between B. napus and A. thaliana. Background gray lines show the collinear blocks within B. napus and A. thaliana genomes, whereas the red lines represent the syntenic SDG pairs.
Duplication events are one of the key evolutionary processes that can lead to structural and functional differentiation [52]. We performed a blast between the 122 BnSDGs CDS sequences and obtained a total of 49 duplicated pairs based on their sequence similarities (>80%) (Table S4). Our results demonstrated that segmental duplications have played an important role in the expansion of SDGs in the B. napus genome. Moreover, we detected nine dispersed duplication events, including in two gene pairs (BnASHR1.1A, BnASHR1.1B, and BnaA05g17880D, BnaCnng44980D), three tandem, one interspersed, and one proximal gene duplication type (Table S4). Ka (non-synonymous substitutions)/ Ks (synonymous substitutions) is a significant parameter that is used to determine the selection pressures during evolution [53]. To understand the evolutionary pressure on BnSDG duplicates, the Ka, Ks, and Ka/Ks ratios for all the 49 duplicated gene pairs were determined. Our results revealed that all of the duplicated BnSDGs duplicated genes had a Ka/Ks ratio of <1 except for two pairs BnATX5.1A, BnATX5.1B, BnASHH3.1A, and BnASHH3.1B, suggesting that the BnSDGs were under strong purifying selection during the evolution (Table S4).
2.4. Structural (Domain and Motif Conservation) and Functional Analysis (Gene Ontology (GO)) of BnSDGs Proteins
To characterize and analyze the structural variations in all BnSDGs, we performed a conserved domain analysis (Table S5). Our results revealed that BnSDG proteins contained other important domains along with the SET domain. These additional domains included CXC, AWS, pre-SET, post-SET, WIYLD, PWWP, PHD, FYRC, FYRN, Zf, TPR-like, and YDG/SRA (Table S5). Based on the presence of specific domain/s architecture, all the BnSDGs were distributed into seven classes (I–VII). Class I had a CXC domain to the N-terminus of the SET domain in all the proteins (Table S5). Class II showed the AWS domain to the N-terminus of the SET domain and a post-SET domain toward the C-terminus. BnASHR3.1A, BnASHR3.1B, BnASHH1.1A, BnASHH2.1A, and BnASHH2.1B had extra ZF domain to the N-terminus of the AWS domain (Table S5). Class III showed maximum domains in the proteins. ATX related protein BnATXR3.1A, BnATXR3.1B, BnATXR3.2A, BnATXR3.2B, BnATXR7.1A, BnATXR7.1B contained only SET and LRR and DUF/GYF_2 domains. BnATX1.1A, BnATX1.1B, BnATX2.1B, and BnATX2.1A contained PWWP, FYRN, FRNC, PHD, zf-HC5HC2H_2, SET and post-SET domains. BnATX3.1A, BnATX3.1B, and BnATX4.1A had PHD, PWWP, FYRN, FRNC PHD_2, zf-HC5HC2H_2, SET, post-SET in the direction of N- to C-terminus of the proteins. BnATX5.1B has a similar domain combination. Only the PHD domain was absent (Table S5). In Class IV, all the members contained the PHD domain to the N-terminus of the SET domain. The characteristic domains for SUV homologs were YDG/SRA, pre-SET, SET, and post-SET, whereas, in SUV-related proteins, instead of YDG/SRA, the WILD domain was present along with other above-mentioned domains. Only BnSUVR5.1A, BnSUVR5.2A, and BnSUVR5.1B have lost the WILD domain and acquired zf-TRM13_CCCH and zf-C2H2. The post-SET domain was lost in several members of this class (Table S5). The Class VI proteins contained the interrupted SET domain and additionally contained zf-MYND and TPR-like domain (Table S5). In Class VII, in a total of 20 genes, 15 SDGs (homologs of SETD1, SETD3, SETD4, SETD7, SETD8, SETD10) encoded for rubisco large sub-unit N-methyltransferases, whereas 5 BnSDGs (SETD2, SETD5, and SETD6) encoded for rubisco small sub-unit N-methyltransferases (Table S5).
We also performed the conserved motif analysis for each of the seven classes (I–VII) (Table S6). Based on the similarities in the sequences, the BnSDGs contained common motifs in each class and many unidentified motifs (Table S6). Overall, the conserved domains and motif within the BnSDGs proteins classes (I–VII) also supported their phylogenetic relationships.
We performed gene ontology (GO) annotation and enrichment analysis to predict the functions of the SDGs in B. napus. The identified several GO terms were classified into three categories: molecular function (MF), biological process (BP), and cellular component (CC) (Figure 4). The molecular function (MF) included mainly the histone lysine methyltransferase activity. The remaining GO terms broadly predicted the non-histone (RUBISCO) methylation, Zn binding capacity, and DNA/protein binding functions (Figure 4). The diverse biological processes (BP) were identified in this analysis, that included vegetative growth (shoot formation, leaf morphogenesis, seed dormancy, embryo sac development), reproductive growth (floral organogenesis, stamen development, carpel development, ovule development), stress responses (DNA repair, response to chitin, light stimulus), programmed cell death, cell differentiation, and organelle organization of chloroplasts and ribosomes. The GO cellular component (CC) terms demonstrated that BnSDGs were mainly part of nuclear regions. The remaining proteins were related to the chloroplast, endoplasmic reticulum, PcG protein complex, cytoplasm, plasma membrane, and plasmodesmata. The CC GO terms were consistent with subcellular localization information of BnSDG proteins (Table 1).
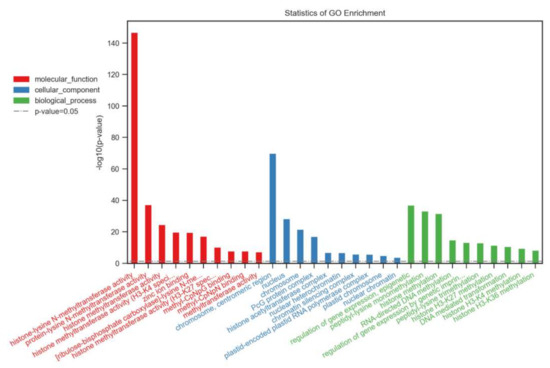
Figure 4.
Gene ontology enrichment analysis of BnSDG proteins based on biological processes, molecular function, and cellular component.
2.5. Gene Structure and Promoter Analysis of BnSDGs
The exon-intron structures of BnSDGs were investigated to determine the structural evolution in the BnSDG gene family. The findings suggested that there was considerable variation in the number of exons (1–26) and introns (0–25) in individual BnSDGs. The numbers of introns and exons were relatively variable within the same class as well (Figure 5, Table 1) except Class I, which consisted of 16–18 exons and 15–17 introns. A total of 11 out of 41 BnSDGs in Class V and 3 BnSDGs in Class VI were intronless, whereas Class III had the maximum number of exons and introns (Figure 5, Table 1). Among all the introns in the BnSDGs, the distribution of phases was 56.17%, 22.3%, and 21.3% for phases 0, 2, and 1, respectively (Figure 5).
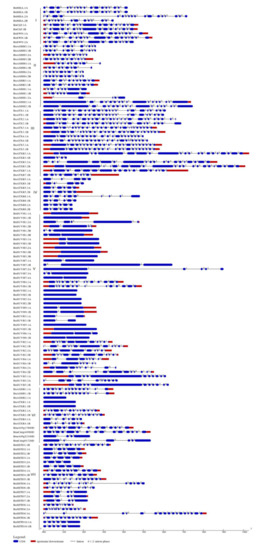
Figure 5.
Exon-intron architecture of the BnSDGs. The genes are ordered according to classes (I–VII). Red boxes and blue boxes represent the untranslated region (UTR) and exons, respectively. The introns are shown by the black lines. The introns phases (0, 1, 2) are mentioned above each intron. A value of 0 means intron is between the two codons, 1 means intron is located after the first base of a codon, 2 means the intron location after the second base of a codon. The scale bar represents the gene size.
We identified the potential cis-regulatory elements in the 2 kb upstream coding region of BnSDGs by using the PlantCARE database. The promoters of two BnSDGs (BnATXR3.1B and BnATXR3.2A) were excluded from this analysis because the sequences of these promoters were undetermined. We obtained several kinds of cis-regulatory elements, including basic transcription regulators (TATA box, CAAT box) and condition-specific elements related to development, hormone, and stress response (Table S8). Moreover, some elements were present in multiple numbers in one promoter sequence. We broadly categorized them into three groups, i.e., growth/development, hormone-responsive, and stress-responsive elements (Figure 6, Table S9). Interestingly, there were 19 types of light-responsive elements, and the most commonly present light elements were box, G-box, and TCT elements. B-Box was found in 94 (78%) of all the gene promoters. The other growth-related elements included the AACA motif, AAGAA-motif, CAT-box, CCAAT-box, HD-Zip, O2-site, RY-element, and circadian (Tables S9 and S10) that are important during endosperm development, palisade mesophyll cells differentiation, seed, meristem, compound metabolism, and circadian clock regulation. These elements were randomly distributed in BnSDGs (Figure 6, Tables S9 and S10). The hormonal responsive elements included ABRE (abscisic acid-responsive element), AuxRR (auxin-responsive element), ERE (ethylene response element), CGTCA-motif (methyl jasmonic acid-responsive), GARE-motif, P-box and TATC-box (gibberellin-responsive element), TCA-element (salicylic acid-responsive element), TGA-element (auxin-responsive element). The abscisic acid-responsive elements were found in maximum copies and detected in 95 (78%) gene promoters, followed by methyl jasmonic acid-responsive elements in 86 (72%) BnSDG promoters (Figure 6, Tables S9 and S10). The stress-responsive elements included ARE (anaerobic induction), DRE (dehydration stress-responsive elements), MBS (MYB binding site involved in drought inducibility), LTR (low-temperature response), GC-motif (anoxic specific), WUN-motif (wound-responsive element), TC-rich repeats (defense and stress-responsive elements) and as−1 (pathogenic related) (Figure 6, Tables S9 and S10). Among all the stress elements, anoxic-specific elements were present in 110 (92%) BnSDG promoters. The most abundant potential cis elements were anoxic specific followed by light specific B-box and abscisic acid-responsive elements (Figure 6, Tables S9 and S10). These results suggest the importance of BnSDGs in development and stress conditions.
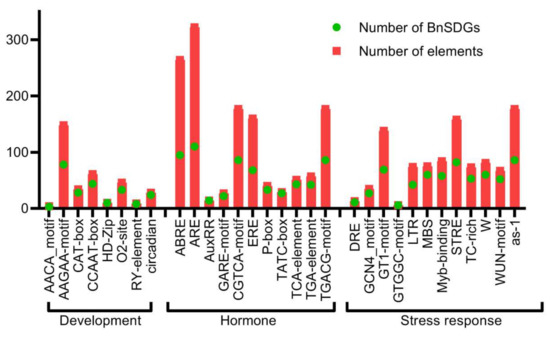
Figure 6.
Cis-acting regulatory elements in the promoters of BnSDGs. The cis-acting elements were mainly categorized into developmental, hormonal, and stress-responsive elements. The bar graph indicates the total number of each cis-acting element found in BnSDG promoters (red box), as well as the number of BnSDG promoters that include a specific cis-regulatory element (green circle). Table S10 contains detailed information.
We analyzed the transcription factor binding sites (TFBSs) in the promoter (2 kb upstream of coding region) of 120 BnSDGs and identified 59 BnSDGs with TFBSs corresponding to 20 transcription factor families (Table S11). These transcription factors included GATA, MYB, C2H2, MIKC_MADS, Dof, Trihelix, BBR-BPC, AP2, B3, bZIP, ERF, bHLH, G2-like, CPP, MYB related, SRS, NAC, E2F/DP, ARF. Among all, 28 and 31 promoter sequences had single and multiple TFBSs, respectively. Furthermore, 12 promoter sequences showed two while the remaining promoters showed up to five TFBSs (Table S11).
2.6. In Silico Differential Expression Analysis
The recently launched, comprehensive Brassica Expression DataBase (BrassicaEDB) was used to extract the expression data at four developmental stages (bolting stage, full bloom stage, podding, and maturation) in different tissues to analyze the importance of BnSDGs during the development in B. napus. The tissues included were (a) young leaf, mature leaf, inflorescence tip, stem and root at the bolting stage, (b) young leaf, mature leaves, stem, root, inflorescence tip, petal, sepal, stamen, carpel, and pedicel at the full bloom stage, (c) and (d) seed and silique at podding and maturation stage, the time for seed and siliques collection was 5, 10, 19, 30, 40 and 46 days after flowering (Figure 7, Table S12). Our results demonstrated that BnASHH4.1A of Class II displayed the highest FPKM value (127) in the mature leaf at the bolting stage. The other Class II BnSDGs showed comparatively high FPKM values and stage-specific gene expression (ASHH3. 1A, ASHH4. 2A, ASHH3. 1B, ASHH4. 2) in stamen at the full bloom stage. Class V SUVH homologs 1, 2, 3, and 9 showed high FPKM and differential expression at all developmental stages, whereas the SUVH7 homologs were not active (threshold FPKM 0.5) except SUVH7. 4A in carpel and seed at the podding stage. Generally, in the case of Class I, CLF and SWN homologs were active at all developmental stages, except BnSWN.2A. Among all the MEA homologs, only BnMEA. IB was active in bolting, bloom, and podding stages. Class III and VI ATX and related homologs showed seed-specific expression at the maturation stage. Class III BnSDGs were expressed differentially at all the stages except BnATX2.1B. Class IV BnSDGs were predominantly expressed in podding stage (Figure 7, Table S12). Class VI proteins with interrupted SET domain were predominantly expressed in carpel and inflorescence tip at bolting and bloom stage and seed in maturation stage. In Class VII, BnSETD5.1B displayed the highest FPKM in the young, mature leaf and siliques at podding and maturation stage, whereas BnSET7.2A, BnSET7.1B, and BnSET8.1A were inactive in all the data. Due to the diverse range of expression patterns, the FPKM values were transformed to log2 fold for better visualization of differential expression across all the BnSDGs through heatmap (Figure 7). Our expression analysis revealed that BnSDGs might be involved in several stages and tissue-specific developmental processes.
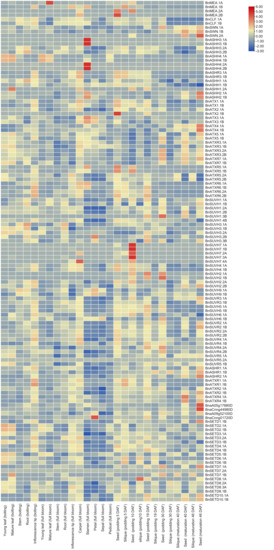
Figure 7.
In silico expression analysis of BnSDGs in various tissues at bolting, full bloom, podding, and maturation stages of B. napus. DAF indicates days after flowering. The heatmap was generated based on row scale and by taking log2 fold of fragments per kilobase million (FPKM).
2.7. In Silico Abiotic Stress Expression Analysis
During the stress conditions, the growth and development of B. napus have been greatly influenced. To determine the importance of BnSDGs in abiotic stresses, we used the transcriptome data of dehydration, cold, ABA, and NaCl treatments. Our results showed that the expression pattern of a total of 36 BnSDGs was changed by ± two-fold under the above-mentioned stresses (Figure S1, Table S13). Fewer genes showed greater fold change in response to ABA and NaCl treatments, whereas more genes showed significant change with response to cold treatment at 24-h. Among all these 36 genes, most of the genes were downregulated. A total of 22 BnSDGs were significantly responsive at 24 h cold stress (−6.3 to –2.8), and among these genes, 8 genes were upregulated. Only two BnSDGs showed a response (upregulated; 2.8 and 2.9) at only 4 h ABA treatment. A total of 5 BnSDGs were downregulated at 24 h NaCl treatment (−7.3 to –2.3). At 8 h dehydration, 7 genes (6 genes; downregulated), while at 1-hr dehydration, 11 genes (8 genes; downregulated) showed significant fold change expression. We did not find any BnSDGs response at 24 h ABA and 4 h NaCl treatment. Only two homologs BnASHH4.IA and BnASHH4.1B were responsive during dehydration, cold, and NaCl treatment (Figure S1, Table S13)
2.8. The Expression Validation by Reverse Transcription-Quantitative PCR
To validate the in silico expression, we selected 15 BnSDGs, two from each class and three from Class V members.1A, BnSWN.1A, BnASHH4.1A, BnASHH1.1B, BnATXR3.1A, BnATXR3.2B, BnATXR5.2B, BnATXR6.2A, BnSUVH1.1B, BnSUVH9.1A, BnSUVH6.1B, BnASHR2.1A, BnSETD2.1B, and BnSETD5.1B), based on the highest FPKM in each class using reverse transcription-quantitative PCR. The primers used in this analysis are mentioned in Table S1. The target genes expression was investigated in young leaf, mature leaf, stem, root, petal, sepal, carpel, and stamen at the full bloom stage. All the genes showed variable expression patterns in the tissues used (Figure 8). Seven genes (BnCLF.1A, BnASHH1.1B, BnATRXR5.2B, BnATRXR6.2A, BnSUVH9.IA, BnSUVH6.1B, BnASHR2.1A) were highly expressed in the carpel, whereas the BnSWN.1A, BnSETD2.1B, BnSETD5.1B, and BnASHH4.1A in young and mature leaf than in other tissues, and there was a variation of expression pattern within the members of the same class. For example, in Class II, the expression of BnASHH4.1A was predominant in leaf tissues with the least expression in flower tissues, but BnASHH1.1B was highly expressed in the carpel. We also isolated the cis-regulatory elements for these candidate genes (Figure S2) to find evidence for their variable expression pattern. The cis-regulatory elements included hormone-responsive elements, light-responsive elements, circadian control elements, meristem and seed-specific elements, ethylene, abscisic acid, and salicylic acid-responsive elements, and Meja responsive elements (Figure S2). We extracted the potential function and cellular components information of these predominantly expressed candidate genes by GO analysis (Table S7). The results revealed that the potential molecular function of the two SETD candidate genes is a non-histone methylation process, while the remaining genes displayed histone methyl transferase activity. The cellular component for SETD. 1B was chloroplast while nucleus and chromosome showed five and seven candidate genes, respectively (Table S7). These results showed that these candidate genes might have a functional role in the growth and developmental processes.
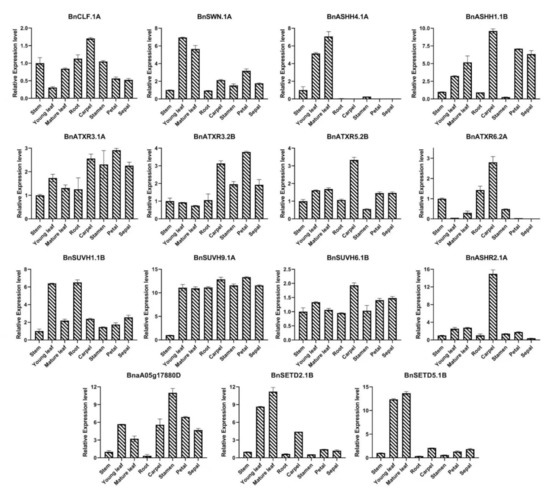
Figure 8.
Expression profiling of 15 BnSDGs in eight tissues by quantitative reverse transcriptase PCR. The results were analyzed by using the 2−ΔΔCT method. The error bars represent the standard deviation among the three biological replicates for each tissue.
3. Discussions
The SET domain-containing proteins (SDGs) are the known histone lysine methyltransferases and participate in several developmental and physiological processes [11,31]. So far, there is no detailed genome-wide investigation of SDGs in B. napus; therefore, the current study will facilitate new insights into this gene family and predict the potential function in plant growth and stress conditions.
In the present study, we identified 122 SDGs in the B. napus by using the Darmor-bzh v4.1 genome sequence information. The brassica lineage has gone through whole-genome triplication after the separation from A. thaliana. Moreover, the B. napus is an allopolypolypliod that is a product of the hybridization of B. rapa and B. oleracea [51,54]. Therefore, the six times increase was expected in BnSDGs. However, the identified BnSDGs were lower in number. We also found that almost all of the AtSDGs have one to two homologs in both A and C subgenomes, suggesting that many SDGs are lost due to diploidization events in the genome. It is noteworthy to mention that AtSUVH8, AtSUVH10, AtSUVR1, and AtSETD9 had no orthologs in the B. napus. Their orthologs were also not found in B. rapa and B. olerecea except for AtSETD9, which had one ortholog in the B. rapa (Table S2). These results showed that the loss of these genes occurred after the separation of brassica lineage. However, the number of SDGs is greater in B. napus as compared to previously identified SDGs in species such as Arabidopsis (49), rice (34), maize (43), foxtail millet (53) [10,15,21]. Until now, the maximum number of SDGs (166) are detected in hexapolyploid wheat crop [22], suggesting that duplication events within the polyploid crops played a crucial role in the expansion of SDGs during evolution. Our results showed that segmental gene duplication played a significant role in the evolution of BnSDG genes (Table S4). The Ka/Ks analysis showed that the duplicated gene pairs were under strong positive selection (Table S4). These duplication events led to genome expansion and functional diversity in the organisms [52].
According to phylogenetic analysis, the identified BnSDGs were placed into seven classes (I–VII), and the names were assigned according to the previous nomenclature used in A. thaliana and other species [9,12]. Thus, the BnSDGs were classified into seven classes along with AtSDGs, BrSDGs, and BoSDGs genes (Figure 1, Table S2), suggesting the close evolutionary relationship between four related plants species. These classes (I–VII) also possessed one to several orthology groups as per the previous studies [12,22]. Notably, the homologs BnaA05g17880D and BnaCnng44980D; BnaA09g52100D and BnaCnng01720D of unannotated AtSDGs (At1g33400 and At1g33400) were placed in Class VI that contained interrupted SET domain. The arrangement of BnSDGs in the phylogenetic tree was further verified by the gene and protein/domain structure analysis. The domain analysis verified the arrangement of these BnSDGs in the phylogenetic tree. The characteristic domains of each class were conserved (Table S5) [12,22]. A total of 102 BnSDGs were histone methyltranferases whereas, the remaining 20 out of 122 were SET-related proteins that might be involved in the methylation of non-histone proteins such as rubisco. All the homologs of SETD1, 3, 4, 7, 8, and SETD10 were rubisco large sub-unit N-methyltransferases encoding genes, whereas SETD2, 5, and SETD6 were rubisco small sub-unit N-methyltransferases encoding genes. Except for BnSETD3.2A and BnSETD7.1A, all BnSETD proteins had a complete SET domain, in contrast to A. thaliana, which possessed a truncated SET domain in these SDGs, showing that the evolution of this polyploid crop enabled the structural variations in these BnSDGs [10]. The structural analysis of BnSDGs has provided information about gene length variation, ranging from 1.149 to 10.285 kb. Their corresponding proteins vary in length from 257 to 2298 amino acids. These results are also validated by SDGs in other plants species [15,21,22] and maize has the longest gene length (44 kb) [15] known among all the SDGS detected. However, the high percentage occurrence of 0 intron phase (56.17%) in BnSDGs signifies the conservation of coding sequences, as described previously [12]. The introns were absent in all the homologs of SUVH2, SUVH3, SUVH5, and two homologs of SUVH1. These results are consistent with A. thaliana-respective SDGs homologs [55] except for one SUVH1 homolog in B. napus that has four introns (Table 1).
Almost all the BnSDGs were localized in the nuclear region, and only a few were localized in cytosol endoplasmic reticulum, chloroplast, mitochondrion, and plasma membrane (Table 1). The previous studies also validated their presence in the nuclear region due to their involvement in epigenetic regulation [21]. These findings were also consistent with the gene ontology (GO) analysis (Figure 4). The GO analysis also predicted that the main function of BnSDGs was the addition of methyl group to histones, particularly and few non-histone proteins. Histone methylation plays a wide variety of roles in plant life, including vegetative growth, root and shoot development, reproductive organ development, and responses to external stresses [31]. However, the functional studies of BnSDGs are still lacking in B. napus except a few [30]. Therefore, their possible functions could be identified by analyzing the expressions profile of these BnSDGs in various tissue at several developmental stages. Our expression data analysis illustrated the spatiotemporal expression of SDGs at four developmental stages in various tissues (Figure 7, Table S12) of B. napus. Generally, the genes showed predominant expression in young and mature leaves followed by the reproductive organs such as carpel and stamen and a few genes with predominant expression in the maturation stage (Figure 7, Table S12). There was also the expression variation within the members of a class. The Class I and V (SUV) SDGs were expressed comparatively higher at many stages in several tissues but with the variable FPKM values, showing the differential expression pattern throughout the studied stages. In a previous report, the clf mutant plant showed curled-up leaves, abnormal root growth, and floral development in A. thaliana [31]. Similar expression variations were observed in leaf, root, and inflorescence of BnCLF homologs. BnCLF.1A showed relatively high expression in leaf and root as compared with BnCLF.1B at the bolting stage, which also shows the expressional divergence between the homolog genes. Moreover, the previous studies in A. thaliana showed that the over expression of ATXR5 caused male sterility, and the effect of ATXR6 overexpression was lethal for stamen development [38]; similarly, in our results, the homologs of BnATXR5/6 expressions were lower in stamen tissues as compared to other tissues studied. ASHH2 consisted of two homologs, BnASHH2.1A and BnASHH2.1B. Their comparative expressions were high in stamen tissue at the full bloom stage. The previous study also revealed that the mutant ashh2 showed abnormal pollen growth in A. thaliana [25]. Both homologs of ATX1 showed higher expression in the carpel as compared to other tissues studied at the full bloom stage. It validated that the loss of the ATX gene resulted in abnormal carpel growth [56]. Likewise, the expression of ATXR3 homologs was higher in stamen, carpel, and seed tissues except for one homolog ATXR3. 1B, and these results were consistent with the previous report in A. thaliana [57]. The previous studies also showed that several SDGs were involved in expression regulation during biotic and abiotic stress [47,50]. We also analyzed the transcriptome data of several abiotic stresses, including dehydration, cold, ABA, and salinity (NaCl) treatments in B. napus, which revealed the differential expression of BnSDGs under these external cues (Figure S1, Table S13). Our expression analysis showed that 36 BnSDGs showed gene expression change by ± two-fold under the selected stresses (Figure S1, Table S13). This evidence suggests that BnSDGs can not only play a role in tissue and developmental stage-specific time but also during stress management. We selected 15 BnSDGs genes (two from each class and three from Class V) on the basis of predominant expression within a class. We observed their expression pattern in young leaf, mature leaf, stem, root, stamen, carpel, sepals, and petals through reverse transcription-quantitative PCR. Our results verified the variable expression pattern in various tissues (Figure 8).
The promoters of BnSDGs were also studied for the presence of growth, development, and stress-related cis elements (Figure 6 and Figure S2). We identified plant growth hormone (such as abscisic acid, ethylene, gibberellin, auxin, and MeJA responsive elements), several types of light-responsive elements (for example; G-box and circadian elements), seed-specific elements (for example; O2-site and Ry elements), and meristem-specific elements in the candidate genes (Figure S2, Tables S8 and S9). The previous studies also showed that these cis elements are of functional importance in plant growth and development. The light-dependent expression of GRP7 was controlled by the circadian cis element in the promoter sequence [58]. Deletion of the G-box element reduces the promoter activity toward several stimuli’s including light and hormone responses [59]. The mutation in abscisic acid response elements not only lessens the ABA response but also can inhibit the leucine zipper proteins binding that might affect many biological responses [60]. The Ry and gibberellin elements are investigated grain quality in rice [61]. The occurrence of these cis-regulatory elements provided evidence of BnSDGs’s role in growth and development.
4. Materials and Methods
4.1. Identification of SET Domain-Containing Genes (SDGs) in Brassica napus (B. napus)
To identify the SET domain-containing genes (SDGs) in Brassica napus (B. napus), we performed BLASTP (blast protein) and hidden Markov model (HMM) analysis. For BLASTP search in B. napus proteome available at BnaOmics database (https://www.bnaomics.xyz/blast, accessed on 9 October 2021), we used A. thaliana SET domain-containing protein sequences as a query and set the e-value 1e−5. The protein sequences of AtSDGs were retrieved from The Arabidopsis Information Resource-10 (http://www.arabidopsis.org/, accessed on 9 October 2021). For HMM analysis, the local HMMER 3.1 webserver (http://www.hmmer.org/, accessed on 9 October 2021) was used to search the putative SDGs with default parameters, and SET domain PF00856 was used as a query from the Pfam database (http://pfam.xfam.org/, accessed on 9 October 2021).
We further confirmed the presence of the SET domain in predicted SDGs by using the Pfam database (http://pfam.xfam.org/, accessed on 9 October 2021), SMART (http://smart.embl-heidelberg.de/, accessed on 9 October 2021), and conserved domain database (CDD)-Batch search tool (https://www.ncbi.nlm.nih.gov/Structure/bwrpsb/bwrpsb.cgi, accessed on 9 October 2021). The redundant SDGs were excluded manually.
The identified BnSDGs in B. napus were used to find their homologs in its parental species, i.e., Brassica rapa; BrSDGs and Brassica oleracea; BoSDGs through Brassicaceae Database (BRAD) (http://brassicadb.cn/, accessed on 9 October 2021) by using the above-mentioned methods and were further confirmed for the presence of SET domain by the same above-mentioned method.
All the BnSDGs sequences, i.e., gene, CDS, proteins, and promoters, were collected from genome data files of B. napus genome available at BnaOmics database (https://www.bnaomics.xyz/, accessed on 9 October 2021), and for BrSDGs, BolSDGs, and AtSDGs, all the sequences information was retrieved from respective genomes data files available at Brassicaceae Database (BRAD) (http://brassicadb.cn/, accessed on 9 October 2021).
4.2. Phylogenetic Analysis
The SET domain amino acid sequence was used to perform the phylogenetic analysis of SDGs in B. napus, B. oleracea, B. rapa, and A. thaliana. The multiple sequence alignment was carried out using CLUSTAL W with default parameters and some custom alignment in the MEGA version 7 program. MEGA7 was also used to generate the phylogenetic tree using the neighbor-joining (NJ) technique and pairwise deletion with 1000 bootstrap replicates. iTOL v6 (https://itol.embl.de/, accessed on 12 October 2021) was used for the final phylogenetic tree display.
4.3. Chromosomal Location, Synteny Analysis, and Ka/Ks Ratio
To physically map the BnSDGs on the B. napus genome, the location of genes and length of chromosomes were retrieved from the gff3 annotation file in the TBtools software, v1.098 [62]. Then the chromosomal location of BnSDGs was performed by advanced CIRCOS Tool in TBtools version 1.098 [62].
MCScanX was used to examine the collinearity correlations between the B. napus and A. thaliana genomes. The syntenic analysis of SDGs in B. napus was carried out against A. thaliana and visualized by using the dual synteny visualization tool in TBtools, v1.098 [62].
The ratios of synonymous substitution rate (ks) and non-synonymous substitution rate (ka) of homologous gene pairs were evaluated using TBtools, v1.098 [62] to assess if the BnSDGs encoding sequences are under selection pressure during the evolution. A Ka/Ks ratio of less than one indicated purifying selection, a Ka/Ks ratio of more than one indicated positive selection, and a Ka/Ks ratio of zero indicated neutral selection. T = Ks/2R, where R is 1.5 10−8 synonymous substitutions per site per year, was used to calculate divergence time 10−6 million years ago (MYA) [63].
4.4. The Biophysical, Structural and Functional Analysis of BnSDG Proteins
The biophysical properties of BnSDGs, such as molecular weight (MW), isoelectric points (IP), and GRAVY were determined by ExPASy-ProtParam tool (http://us.expasy.org/tools/protparam.html, accessed on 9 October 2021). The subcellular localization of BnSDG proteins was predicted CELLO v2.5 (http://cello.life.nctu.edu.tw/, accessed on 9 October 2021) [64].
The detailed domain structures, their start and end location in every protein were examined by using the Pfam database (http://pfam.xfam.org/, accessed on 9 October 2021), CDD-Batch search in NCBI (https://www.ncbi.nlm.nih.gov/Structure/bwrpsb/bwrpsb.cgi, accessed on 9 October 2021) and Interpro database (https://www.ebi.ac.uk/interpro/search/sequence/, accessed on 9 October 2021).
The conserved motifs of every class of BnSDG encoding proteins were scanned using the local MEME Suite v5.0.3 (https://meme-suite.org/tools/meme, accessed on 9 October 2021). For this objective, the following parameters were calibrated: maximum 10 motifs, with an optimal width of 6–50 amino acids. The remaining parameters were set to their default values. The identified motifs were annotated by using the Interpro database (https://www.ebi.ac.uk/interpro/search/sequence/, accessed on 9 October 2021).
The BnSDGs were functionally annotated using the Web server (https://cloud.oebiotech.cn/task/, accessed on 9 October 2021). Gene ontology (GO) terms were classified into biological process cellular component and molecular function.
The exon-intron structure and the intron phase (0,1,2) identification analysis were carried out by Gene Structure Display Server (GSDS 2.0) (http://gsds.cbi.pku.edu.cn, accessed on 9 October 2021).
4.5. The Identification of Cis-Regulatory Elements and Transcription Binding Sites in Promoter Regions
For the cis-elements analysis, 2 Kb upstream regions of the coding region of BnSDGs were examined by using the PlantCARE database (https://bioinformatics.psb.ugent.be/webtools/plantcare/html/, accessed on 12 October 2021). We also predicted the transcription factor binding sites (TFBSs) in the promoter region of BnSDGs by using the PlantRegMap/PlantTFDB v5.0 (http://plantregmap.gao-lab.org/binding_site_prediction.php, accessed on 12 October 2021).
4.6. In Silico Expression Analysis of BnSDGs
Brassica Expression DataBase (BrassicaEDB), v1.0 (https://brassica.biodb.org/, accessed on 12 October 2021) was used to analyze the expression data of BnSDGs at bolting (tissues used were; inflorescence tip, stem, root, young leaf and mature leaf), full bloom developmental stage (tissues used were; young and mature leaves, stem, root, inflorescence tip, stamen, petal, carpel, pistil, and pedicel), podding and maturation stage (tissues used were; seed and silique tissues at 5, 10,19 and 30 days after flowering). The FPKM values are converted to log2 fold, and heatmap was generated by using TBtools v1.098 [62]. For abiotic gene expression, data of dehydration, cold, ABA, and salinity [65] was used to calculate the log2 fold change, and later, a heatmap was generated.
4.7. Plant Material, RNA Extraction, and Reverse Transcription-Quantitative PCR
The B. napus v. ZS11 was grown in the field of Oil Crop Research Institute (OCRI) Wuhan, China. The samples of tissues were collected at the blooming stage. The tissues included young and mature leaves, stem, root, petal, sepal, carpel, and stamen. The samples were immediately put in liquid nitrogen and stored at −80 °C. Later, total RNA was isolated from the tissue samples using TRIZOL reagent (Invitrogen). Complementary DNA was synthesized using the PrimeScript RT Reagent Kit with genomic DNA Eraser (Takara) according to company instructions. The reverse transcription-quantitative PCR (RT-qPCR) reactions were carried out in three replicates using the SYBR green super mix (Bio-Rad). The reaction was set as 95 °C for 3 min, next 40 cycles of 95 °C for 10 s, ~58–60 °C for 30 s, and melt curve analysis at 65–95 °C, increment 0.5 °C for 0.5 s. β-Actin gene was used as an internal control, and Primer Premier v5.0 was used to synthesize the primers. The list of all the primers used in this study is included in Table S1. The results were analyzed using the 2−ΔΔCT method as described previously [66]. The graphs were generated by using GraphPad Prism v8.0 [67].
5. Conclusions
Several publications have been documented in recent years, revealing that SET domain proteins are encoded by a vast multigene family in plants. In this study, we identified 122 SDGs in B. napus by using genome-wide analysis. Based on the evolutionary closeness and structural similarities, these BnSDGs were classified into I–VII classes. To understand their potential functional role, their evolutionary history, structure, cis-regulatory elements in the promoters, gene ontology (GO), and expression at various developmental stages were analyzed. Our results explained that gene loss and gene duplication both played a key role in the evolution of SDGs in B. napus. In silico expression analysis of BnSDGs revealed differential expression in different developmental stages, indicating that these genes play a role in plant development. Predominantly expressing 15 genes selected from each class were analyzed by RT-qPCR also revealed spatiotemporal expression. Cis-regulatory elements of these methyltransferases have growth, development, and stress-related elements. Overall, this study will help to better understand the complexity of BnSDGs and is beneficial for future experimental research on epigenetic regulation in B. napus.
Supplementary Materials
The following are available online at https://www.mdpi.com/article/10.3390/ijms23041936/s1.
Author Contributions
Conceptualization, F.G., S.S. and W.S.; Formal analysis, M.X., S.S. and W.S.; Funding acquisition, S.L.; Investigation, S.S. and W.S.; Data curation, R.Z.; Resources, C.Z. writing—original draft preparation, S.S. and W.S.; writing—review and editing, S.L., F.G., M.X., S.S., W.S. and C.Z.; Project administration, F.G. All authors have read and agreed to the published version of the manuscript.
Funding
This research was funded by the National Key Research and Development Program of China, grant number U20A2034; Central Public-interest Scientific Institution Basal Research Fund, grant number 2021-2060302-061-027 no: 2021-2060302-061-029; the Agricultural Science and Technology Innovation Program of the Chinese Academy of Agricultural Sciences, grant number CAAS-ASTIP-2013-OCRI; and China Agriculture Research System of MOF and MARA, grant number CARS-12.
Institutional Review Board Statement
Not applicable.
Informed Consent Statement
Not applicable.
Data Availability Statement
The corresponding data have been shown in Supplementary Materials.
Conflicts of Interest
The authors declare no conflict of interest.
References
- Kornberg, R.D. Chromatin structure: A repeating unit of histones and DNA. Science 1974, 184, 868–871. [Google Scholar] [CrossRef] [PubMed]
- Jenuwein, T.; Allis, C.D. Translating the histone code. Science 2001, 293, 1074–1080. [Google Scholar] [CrossRef] [PubMed] [Green Version]
- Strahl, B.D.; Allis, C.D. The language of covalent histone modifications. Nature 2000, 403, 41–45. [Google Scholar] [CrossRef]
- Feng, Q.; Wang, H.; Ng, H.H.; Erdjument-bromage, H.; Tempst, P.; Struhl, K.; Zhang, Y.; Hill, C.; Carolina, N. Methylation of H3-Lysine 79 Is Mediated by a New Family of HMTases without a SET Domain University of North Carolina at Chapel Hill. Current 2002, 12, 1052–1058. [Google Scholar] [CrossRef] [Green Version]
- Liu, C.; Lu, F.; Cui, X.; Cao, X. Histone methylation in higher plants. Annu. Rev. Plant Biol. 2010, 61, 395–420. [Google Scholar] [CrossRef]
- Trievel, R.C.; Flynn, E.M.; Houtz, R.L.; Hurley, J.H. Mechanism of multiple lysine methylation by the SET domain enzyme Rubisco LSMT. Nat. Struct. Biol. 2003, 10, 545–552. [Google Scholar] [CrossRef] [PubMed]
- Marmorstein, R. Structure of SET domain proteins: A new twist on histone methylation. Trends Biochem. Sci. 2003, 28, 59–62. [Google Scholar] [CrossRef]
- Rea, S.; Eisenhaber, F.; O’Carroll, D.; Strahl, B.D.; Sun, Z.W.; Schmid, M.; Opravil, S.; Mechtier, K.; Ponting, C.P.; Allis, C.D.; et al. Regulation of chromatin structure by site-specific histone H3 methyltransferases. Nature 2000, 406, 593–599. [Google Scholar] [CrossRef]
- Baumbusch, L.O.; Thorstensen, T.; Krauss, V.; Fischer, A.; Naumann, K.; Assalkhou, R.; Schulz, I.; Reuter, G.; Aalen, R.B. The Arabidopsis thaliana genome contains at least 29 active genes encoding SET domain proteins that can be assigned to four evolutionarily conserved classes. Nucleic. Acids. Res. 2001, 29, 4319–4333. [Google Scholar] [CrossRef]
- Ng, D.W.K.; Wang, T.; Chandrasekharan, M.B.; Aramayo, R.; Kertbundit, S.; Hall, T.C. Plant SET domain-containing proteins: Structure, function and regulation. Biochim. Biophys. Acta (BBA)-Gene Struct. Expr. 2007, 1769, 316–329. [Google Scholar] [CrossRef] [Green Version]
- Pontvianne, F.; Blevins, T.; Pikaard, C.S. Arabidopsis histone lysine methyltransferases. Adv. Bot. Res. 2010, 53, 1–22. [Google Scholar]
- Dong, H.; Liu, D.; Han, T.; Zhao, Y.; Sun, J.; Lin, S.; Cao, J.; Chen, Z.H.; Huang, L. Diversification and evolution of the SDG gene family in Brassica rapa after the whole genome triplication. Sci. Rep. 2015, 5, 16851. [Google Scholar] [CrossRef] [PubMed] [Green Version]
- Lei, L.; Zhou, S.-L.; Ma, H.; Zhang, L.-S. Expansion and diversification of the SET domain gene family following whole-genome duplications in Populus trichocarpa. BMC Evol. Biol. 2012, 12, 51. [Google Scholar] [CrossRef] [Green Version]
- Aquea, F.; Vega, A.; Timmermann, T.; Poupin, M.J.; Arce-Johnson, P. Genome-wide analysis of the SET DOMAIN GROUP family in grapevine. Plant Cell Rep. 2011, 30, 1087–1097. [Google Scholar] [CrossRef] [PubMed]
- Qian, Y.; Xi, Y.; Cheng, B.; Zhu, S.; Kan, X. Identification and characterization of the SET domain gene family in maize. Mol. Biol. Rep. 2014, 41, 1341–1354. [Google Scholar] [CrossRef] [PubMed]
- Lu, Z.; Huang, X.; Ouyang, Y.; Yao, J. Genome-Wide Identification, Phylogenetic and Co-Expression Analysis of OsSET Gene Family in Rice. PLoS ONE 2013, 8, E0065426. [Google Scholar] [CrossRef] [PubMed] [Green Version]
- Cigliano, R.A.; Sanseverino, W.; Cremona, G.; Ercolano, M.R.; Conicella, C.; Consiglio, F.M. Genome-wide analysis of histone modifiers in tomato: Gaining an insight into their developmental roles. BMC Genomics 2013, 14, 57. [Google Scholar] [CrossRef] [Green Version]
- Xu, J.; Xu, H.; Liu, Y.; Wang, X.; Xu, Q.; Deng, X. Genome-wide identification of sweet orange (Citrus sinensis) histone modification gene families and their expression analysis during the fruit development and fruit-blue mold infection process. Front. Plant Sci. 2015, 6, 607. [Google Scholar] [CrossRef] [Green Version]
- Peng, M.; Ying, P.; Liu, X.; Li, C.; Xia, R.; Li, J.; Zhao, M. Genome-wide identification of histone modifiers and their expression patterns during fruit abscission in litchi. Front. Plant Sci. 2017, 8, 639. [Google Scholar] [CrossRef]
- Huang, Y.; Mo, Y.; Chen, P.; Yuan, X.; Meng, F.; Zhu, S.; Liu, Z. Identification of SET Domain-Containing Proteins in Gossypium raimondii and Their Response to High Temperature Stress. Sci. Rep. 2016, 6, 32729. [Google Scholar] [CrossRef] [Green Version]
- Yadav, C.B.; Muthamilarasan, M.; Dangi, A.; Shweta, S.; Prasad, M. Comprehensive analysis of SET domain gene family in foxtail millet identifies the putative role of SiSET14 in abiotic stress tolerance. Sci. Rep. 2016, 6, 32621. [Google Scholar] [CrossRef] [PubMed] [Green Version]
- Batra, R.; Gautam, T.; Pal, S.; Chaturvedi, D.; Rakhi; Jan, I.; Balyan, H.S.; Gupta, P.K. Identification and characterization of SET domain family genes in bread wheat (Triticum aestivum L.). Sci. Rep. 2020, 10, 14624. [Google Scholar] [CrossRef] [PubMed]
- Chen, D.-H.; Qiu, H.-L.; Huang, Y.; Zhang, L.; Si, J.-P. Genome-wide identification and expression profiling of SET DOMAIN GROUP family in Dendrobium catenatum. BMC Plant Biol. 2020, 20, 40. [Google Scholar] [CrossRef] [PubMed] [Green Version]
- Cazzonelli, C.I.; Cuttriss, A.J.; Cossetto, S.B.; Pye, W.; Crisp, P.; Whelan, J.; Finnegan, E.J.; Turnbull, C.; Pogson, B.J. Regulation of carotenoid composition and shoot branching in Arabidopsis by a chromatin modifying histone methyltransferase, SDG8. Plant Cell 2009, 21, 39–53. [Google Scholar] [CrossRef] [Green Version]
- Grini, P.E.; Thorstensen, T.; Alm, V.; Vizcay-Barrena, G.; Windju, S.S.; Jørstad, T.S.; Wilson, Z.A.; Aalen, R.B. The ASH1 HOMOLOG 2 (ASHH2) histone H3 methyltransferase is required for ovule and anther development in Arabidopsis. PLoS ONE 2009, 4, e7817. [Google Scholar] [CrossRef] [Green Version]
- Cartagena, J.A.; Matsunaga, S.; Seki, M.; Kurihara, D.; Yokoyama, M.; Shinozaki, K.; Fujimoto, S.; Azumi, Y.; Uchiyama, S.; Fukui, K. The Arabidopsis SDG4 contributes to the regulation of pollen tube growth by methylation of histone H3 lysines 4 and 36 in mature pollen. Dev. Biol. 2008, 315, 355–368. [Google Scholar] [CrossRef] [Green Version]
- Berr, A.; McCallum, E.J.; Ménard, R.; Meyer, D.; Fuchs, J.; Dong, A.; Shen, W.-H. Arabidopsis SET DOMAIN GROUP2 is required for H3K4 trimethylation and is crucial for both sporophyte and gametophyte development. Plant Cell 2010, 22, 3232–3248. [Google Scholar] [CrossRef] [Green Version]
- Yao, X.; Shen, W. Crucial function of histone lysine methylation in plant reproduction. Chin. Sci. Bull. 2011, 56, 3493–3499. [Google Scholar] [CrossRef] [Green Version]
- Wang, D.; Tyson, M.D.; Jackson, S.S.; Yadegari, R. Partially redundant functions of two SET-domain polycomb-group proteins in controlling initiation of seed development in Arabidopsis. Proc. Natl. Acad. Sci. USA 2006, 103, 13244–13249. [Google Scholar] [CrossRef] [Green Version]
- Jiang, L.; Li, D.; Jin, L.; Ruan, Y.; Shen, W.H.; Liu, C. Histone lysine methyltransferases BnaSDG8.A and BnaSDG8.C are involved in the floral transition in Brassica napus. Plant J. 2018, 95, 672–685. [Google Scholar] [CrossRef]
- Zhou, H.; Liu, Y.; Liang, Y.; Zhou, D.; Li, S.; Lin, S.; Dong, H.; Huang, L. The function of histone lysine methylation related SET domain group proteins in plants. Protein Sci. 2020, 29, 1120–1137. [Google Scholar] [CrossRef] [PubMed]
- Cheng, K.; Xu, Y.; Yang, C.; Ouellette, L.; Niu, L.; Zhou, X.; Chu, L.; Zhuang, F.; Liu, J.; Wu, H. Histone tales: Lysine methylation, a protagonist in Arabidopsis development. J. Exp. Bot. 2020, 71, 793–807. [Google Scholar] [CrossRef] [PubMed]
- Schmidt, A.; Wöhrmann, H.J.P.; Raissig, M.T.; Arand, J.; Gheyselinck, J.; Gagliardini, V.; Heichinger, C.; Walter, J.; Grossniklaus, U. The P olycomb group protein MEDEA and the DNA methyltransferase MET 1 interact to repress autonomous endosperm development in A rabidopsis. Plant J. 2013, 73, 776–787. [Google Scholar] [CrossRef] [PubMed]
- Dong, G.; Ma, D.-P.; Li, J. The histone methyltransferase SDG8 regulates shoot branching in Arabidopsis. Biochem. Biophys. Res. Commun. 2008, 373, 659–664. [Google Scholar] [CrossRef]
- Napsucialy-Mendivil, S.; Alvarez-Venegas, R.; Shishkova, S.; Dubrovsky, J.G. Arabidopsis homolog of trithorax1 (ATX1) is required for cell production, patterning, and morphogenesis in root development. J. Exp. Bot. 2014, 65, 6373–6384. [Google Scholar] [CrossRef] [Green Version]
- Chanvivattana, Y.; Bishopp, A.; Schubert, D.; Stock, C.; Moon, Y.-H.; Sung, Z.R.; Goodrich, J. Interaction of Polycomb-group proteins controlling flowering in Arabidopsis. Plant Cell 2004, 1, 117–133. [Google Scholar]
- Berr, A.; McCallum, E.J.; Alioua, A.; Heintz, D.; Heitz, T.; Shen, W.-H. Arabidopsis histone methyltransferase SET DOMAIN GROUP8 mediates induction of the jasmonate/ethylene pathway genes in plant defense response to necrotrophic fungi. Plant Physiol. 2010, 154, 1403–1414. [Google Scholar] [CrossRef] [Green Version]
- Raynaud, C.; Sozzani, R.; Glab, N.; Domenichini, S.; Perennes, C.; Cella, R.; Kondorosi, E.; Bergounioux, C. Two cell-cycle regulated SET-domain proteins interact with proliferating cell nuclear antigen (PCNA) in Arabidopsis. Plant J. 2006, 47, 395–407. [Google Scholar] [CrossRef]
- Pien, S.; Fleury, D.; Mylne, J.S.; Crevillen, P.; Inzé, D.; Avramova, Z.; Dean, C.; Grossniklaus, U. ARABIDOPSIS TRITHORAX1 dynamically regulates FLOWERING LOCUS C activation via histone 3 lysine 4 trimethylation. Plant Cell 2008, 20, 580–588. [Google Scholar] [CrossRef] [Green Version]
- Saleh, A.; Alvarez-Venegas, R.; Yilmaz, M.; Le, O.; Hou, G.; Sadder, M.; Al-Abdallat, A.; Xia, Y.; Lu, G.; Ladunga, I. The highly similar Arabidopsis homologs of trithorax ATX1 and ATX2 encode proteins with divergent biochemical functions. Plant Cell 2008, 20, 568–579. [Google Scholar] [CrossRef] [Green Version]
- Tamada, Y.; Yun, J.-Y.; Woo, S.C.; Amasino, R.M. ARABIDOPSIS TRITHORAX-RELATED7 is required for methylation of lysine 4 of histone H3 and for transcriptional activation of FLOWERING LOCUS C. Plant Cell 2009, 21, 3257–3269. [Google Scholar] [CrossRef] [PubMed] [Green Version]
- Krichevsky, A.; Gutgarts, H.; Kozlovsky, S.V.; Tzfira, T.; Sutton, A.; Sternglanz, R.; Mandel, G.; Citovsky, V. C2H2 zinc finger-SET histone methyltransferase is a plant-specific chromatin modifier. Dev. Biol. 2007, 303, 259–269. [Google Scholar] [CrossRef] [PubMed] [Green Version]
- Zhao, Z.; Yu, Y.; Meyer, D.; Wu, C.; Shen, W.-H. Prevention of early flowering by expression of FLOWERING LOCUS C requires methylation of histone H3 K36. Nat. Cell Biol. 2005, 7, 1256–1260. [Google Scholar] [CrossRef] [PubMed]
- Xiao, X.; Zhang, J.; Li, T.; Fu, X.; Satheesh, V.; Niu, Q.; Lang, Z.; Zhu, J.; Lei, M. A group of SUVH methyl-DNA binding proteins regulate expression of the DNA demethylase ROS1 in Arabidopsis. J. Integr. Plant Biol. 2019, 61, 110–119. [Google Scholar] [CrossRef]
- Serre, N.B.C.; Alban, C.; Bourguignon, J.; Ravanel, S. An outlook on lysine methylation of non-histone proteins in plants. J. Exp. Bot. 2018, 69, 4569–4581. [Google Scholar] [CrossRef]
- Cazzonelli, C.I.; Nisar, N.; Roberts, A.C.; Murray, K.D.; Borevitz, J.O.; Pogson, B.J. A chromatin modifying enzyme, SDG8, is involved in morphological, gene expression, and epigenetic responses to mechanical stimulation. Front. Plant Sci. 2014, 5, 533. [Google Scholar] [CrossRef] [Green Version]
- Ding, Y.; Avramova, Z.; Fromm, M. The Arabidopsis trithorax-like factor ATX1 functions in dehydration stress responses via ABA-dependent and ABA-independent pathways. Plant J. 2011, 66, 735–744. [Google Scholar] [CrossRef] [Green Version]
- Ding, Y.; Fromm, M.; Avramova, Z. Multiple exposures to drought’train’transcriptional responses in Arabidopsis. Nat. Commun. 2012, 3, 740. [Google Scholar] [CrossRef]
- Liu, N.; Fromm, M.; Avramova, Z. H3K27me3 and H3K4me3 chromatin environment at super-induced dehydration stress memory genes of Arabidopsis thaliana. Mol. Plant 2014, 7, 502–513. [Google Scholar] [CrossRef] [Green Version]
- Palma, K.; Thorgrimsen, S.; Malinovsky, F.G.; Fiil, B.K.; Nielsen, H.B.; Brodersen, P.; Hofius, D.; Petersen, M.; Mundy, J. Autoimmunity in Arabidopsis acd11 is mediated by epigenetic regulation of an immune receptor. PLoS Pathog. 2010, 6, e1001137. [Google Scholar] [CrossRef]
- Chalhoub, B.; Denoeud, F.; Liu, S.; Parkin, I.A.P.; Tang, H.; Wang, X.; Chiquet, J.; Belcram, H.; Tong, C.; Samans, B.; et al. Early allopolyploid evolution in the post-neolithic Brassica napus oilseed genome. Science 2014, 345, 950–953. [Google Scholar] [CrossRef] [Green Version]
- Flagel, L.E.; Wendel, J.F. Gene duplication and evolutionary novelty in plants. New Phytol. 2009, 183, 557–564. [Google Scholar] [CrossRef]
- Hurst, L.D. The Ka/Ks ratio: Diagnosing the form of sequence evolution. Trends Genet. TIG 2002, 18, 486. [Google Scholar] [CrossRef]
- Song, X.; Wei, Y.; Xiao, D.; Gong, K.; Sun, P.; Ren, Y.; Yuan, J.; Wu, T.; Yang, Q.; Li, X. Brassica carinata genome characterization clarifies U’s triangle model of evolution and polyploidy in Brassica. Plant Physiol. 2021, 186, 388–406. [Google Scholar] [CrossRef]
- Springer, N.M.; Napoli, C.A.; Selinger, D.A.; Pandey, R.; Cone, K.C.; Chandler, V.L.; Kaeppler, H.F.; Kaeppler, S.M. Comparative analysis of SET domain proteins in maize and Arabidopsis reveals multiple duplications preceding the divergence of monocots and dicots. Plant Physiol. 2003, 132, 907–925. [Google Scholar] [CrossRef] [Green Version]
- Alvarez-Venegas, R.; Pien, S.; Sadder, M.; Witmer, X.; Grossniklaus, U.; Avramova, Z. ATX-1, an Arabidopsis homolog of trithorax, activates flower homeotic genes. Curr. Biol. 2003, 13, 627–637. [Google Scholar] [CrossRef] [Green Version]
- Guo, L.; Yu, Y.; Law, J.A.; Zhang, X. SET DOMAIN GROUP2 is the major histone H3 lysine 4 trimethyltransferase in Arabidopsis. Proc. Natl. Acad. Sci. USA 2010, 107, 18557–18562. [Google Scholar] [CrossRef] [PubMed] [Green Version]
- Staiger, D.; Apel, K. Circadian clock-regulated expression of an RNA-binding protein in Arabidopsis: Characterisation of a minimal promoter element. Mol. Gen. Genet. 1999, 261, 811–819. [Google Scholar] [CrossRef]
- Menkens, A.E.; Schindler, U.; Cashmore, A.R. The G-box: A ubiquitous regulatory DNA element in plants bound by the GBF family of bZIP proteins. Trends Biochem. Sci. 1995, 20, 506–510. [Google Scholar] [CrossRef]
- Guiltinan, M.J. Erratum: A plant leucine zipper protein that recognizes an abscisic acid element (Science (267–269)). Science 1990, 250, 612. [Google Scholar] [CrossRef]
- Ding, Y.; Zhu, J.; Zhao, D.; Liu, Q.; Yang, Q.; Zhang, T. Targeting cis-regulatory elements for rice grain quality improvement. Front. Plant Sci. 2021, 12, 705834. [Google Scholar] [CrossRef]
- Chen, C.; Xia, R.; Chen, H.; He, Y. TBtools, a toolkit for biologists integrating various biological data handling tools with a user-friendly interface 289660. bioRxiv 2018, 13, 1194–1202. [Google Scholar]
- Wei, L.; Zhu, Y.; Liu, R.; Zhang, A.; Zhu, M.; Xu, W.; Lin, A.; Lu, K.; Li, J. Genome wide identification and comparative analysis of glutathione transferases (GST) family genes in Brassica napus. Sci. Rep. 2019, 9, 9196. [Google Scholar] [CrossRef] [PubMed] [Green Version]
- Yu, C.; Chen, Y.; Lu, C.; Hwang, J. Prediction of protein subcellular localization. Proteins Struct. Funct. Bioinforma. 2006, 64, 643–651. [Google Scholar] [CrossRef] [PubMed]
- Zhang, Y.; Ali, U.; Zhang, G.; Yu, L.; Fang, S.; Iqbal, S.; Li, H.; Lu, S.; Guo, L. Transcriptome analysis reveals genes commonly responding to multiple abiotic stresses in rapeseed. Mol. Breed. 2019, 39, 158. [Google Scholar] [CrossRef]
- Raza, A.; Su, W.; Gao, A.; Mehmood, S.S.; Hussain, M.A.; Nie, W.; Lv, Y.; Zou, X.; Zhang, X. Catalase (CAT) Gene Family in Rapeseed (Brassica napus L.): Genome-Wide Analysis, Identification, and Expression Pattern in Response to Multiple Hormones and Abiotic Stress Conditions. Int. J. Mol. Sci. 2021, 22, 4281. [Google Scholar] [CrossRef] [PubMed]
- Swift, M.L. GraphPad prism, data analysis, and scientific graphing. J. Chem. Inf. Comput. Sci. 1997, 37, 411–412. [Google Scholar] [CrossRef]
Publisher’s Note: MDPI stays neutral with regard to jurisdictional claims in published maps and institutional affiliations. |
© 2022 by the authors. Licensee MDPI, Basel, Switzerland. This article is an open access article distributed under the terms and conditions of the Creative Commons Attribution (CC BY) license (https://creativecommons.org/licenses/by/4.0/).