Article

Identification of a Negative Regulator for Salt Tolerance at Seedling Stage via a Genome-Wide Association Study of Thai Rice Populations

by
Thammaporn Kojonna
1,2,
Thiti Suttiyut
2,
Nopphakhun Khunpolwattana
2,
Monnat Pongpanich
3,4,
Duangjai Suriya-arunroj
5,
Luca Comai
6,
Teerapong Buaboocha
4,7 and
Supachitra Chadchawan
2,4,*
1
Biotechnology Program, Faculty of Science, Chulalongkorn University, Bangkok 10330, Thailand
2
Center of Excellence in Environment and Plant Physiology (CEEPP), Department of Botany, Faculty of Science, Chulalongkorn University, Bangkok 10330, Thailand
3
Department of Mathematics and Computer Science, Faculty of Science, Chulalongkorn University, Bangkok 10330, Thailand
4
Omics Sciences and Bioinformatics Center, Faculty of Science, Chulalongkorn University, Bangkok 10330, Thailand
5
Rice Department, Ministry of Agriculture and Cooperatives, Bangkok 10900, Thailand
6
Department of Plant Biology and Genome Center, University of California Davis, Davis, CA 95616, USA
7
Molecular Crop Research Unit, Department of Biochemistry, Faculty of Science, Chulalongkorn University, Bangkok 10330, Thailand
*
Author to whom correspondence should be addressed.
Int. J. Mol. Sci. 2022, 23(3), 1842; https://doi.org/10.3390/ijms23031842
Submission received: 21 December 2021 / Revised: 2 February 2022 / Accepted: 3 February 2022 / Published: 6 February 2022
(This article belongs to the Special Issue Molecular Research in Rice)

Abstract

:
Salt stress is a major limiting factor in crop production and yield in many regions of the world. The objective of this study was to identify the genes responsible for salt tolerance in Thai rice populations. We performed a genome-wide association study with growth traits, relative water content, and cell membrane stability at the seedling stage, and predicted 25 putative genes. Eleven of them were located within previously reported salt-tolerant QTLs (ST-QTLs). OsCRN, located outside the ST-QTLs, was selected for gene characterization using the Arabidopsis mutant line with T-DNA insertion in the orthologous gene. Mutations in the AtCRN gene led to the enhancement of salt tolerance by increasing the ability to maintain photosynthetic pigment content and relative water content, while the complemented lines with ectopic expression of OsCRN showed more susceptibility to salt stress detected by photosynthesis performance. Moreover, the salt-tolerant rice varieties showed lower expression of this gene than the susceptible rice varieties under salt stress conditions. The study concludes that by acting as a negative regulator, OsCRN plays an important role in salt tolerance in rice.

1. Introduction

Rice is a staple food for more than half of the world’s population. It is grown in more than a hundred countries; however, rice production has been lower than the consumption demand due to the rapidly growing population and the limited water availability [1]. Salt stress is a major limiting factor responsible for reduced crop yield and productivity in many regions of the world [2]. Salinity tolerance is a complex trait whose expression depends on the action and interaction of different morphological, physiological, and biochemical characteristics of plants, including growth, photosynthesis, and grain yield [3,4].
Genome-wide association studies (GWAS) based on single nucleotide polymorphism (SNP) markers have been widely used in rice and other plants [5]. Huang et al. [6] successfully performed GWAS in a rice landrace collection in China for 14 agronomic traits and identified a substantial number of loci with high resolution. A total of 950 rice varieties were used to apply GWAS to discover the associate loci underlying flowering time and grain yield traits, and 32 novel loci were identified [7]. Recently, GWAS has been used to determine the loci with salt tolerance in rice [8,9,10,11,12,13]. Kong et al. (2021) [8] identified LOC_Os06g01250 and LOC_Os06g37300, both of which encode cytochrome P450, and LOC_Os05g14880, encoding proline-rich family protein as candidate genes for salt tolerance, while Nayyeripasand et al. (2021) [9] reported several candidate genes, such as the genes encoding cation chloride cotransporter, WRKY transcription factor (WRKY 12), a transcriptional activator of α-amylase, and high affinity K+ transporter (HAK). Moreover, GWAS has also been carried out in other crops such as barley [14,15], wheat [16,17], sorghum [18], lettuce [19] maize [20,21], and Arabidopsis [22].
Thailand has more than 17,000 local rice varieties, conserved at the National Rice Gene Bank of Thailand and these are valuable genetic resources for GWAS [23]. The SNP data obtained from local Thai rice populations can be used to identify the causative genes for the traits of interest. Lekklar et al. [24] performed GWAS to identify salinity-responsive genes at the flowering stage of the rice population from Thailand and reported 73% of the identified loci located with previously reported salt tolerance QTLs. Therefore, this study aimed to use GWAS to predict salt-responsive genes in local Thai rice populations at the seedling stage and to understand the function of genes by studying homolog genes in Arabidopsis mutant lines.

2. Results

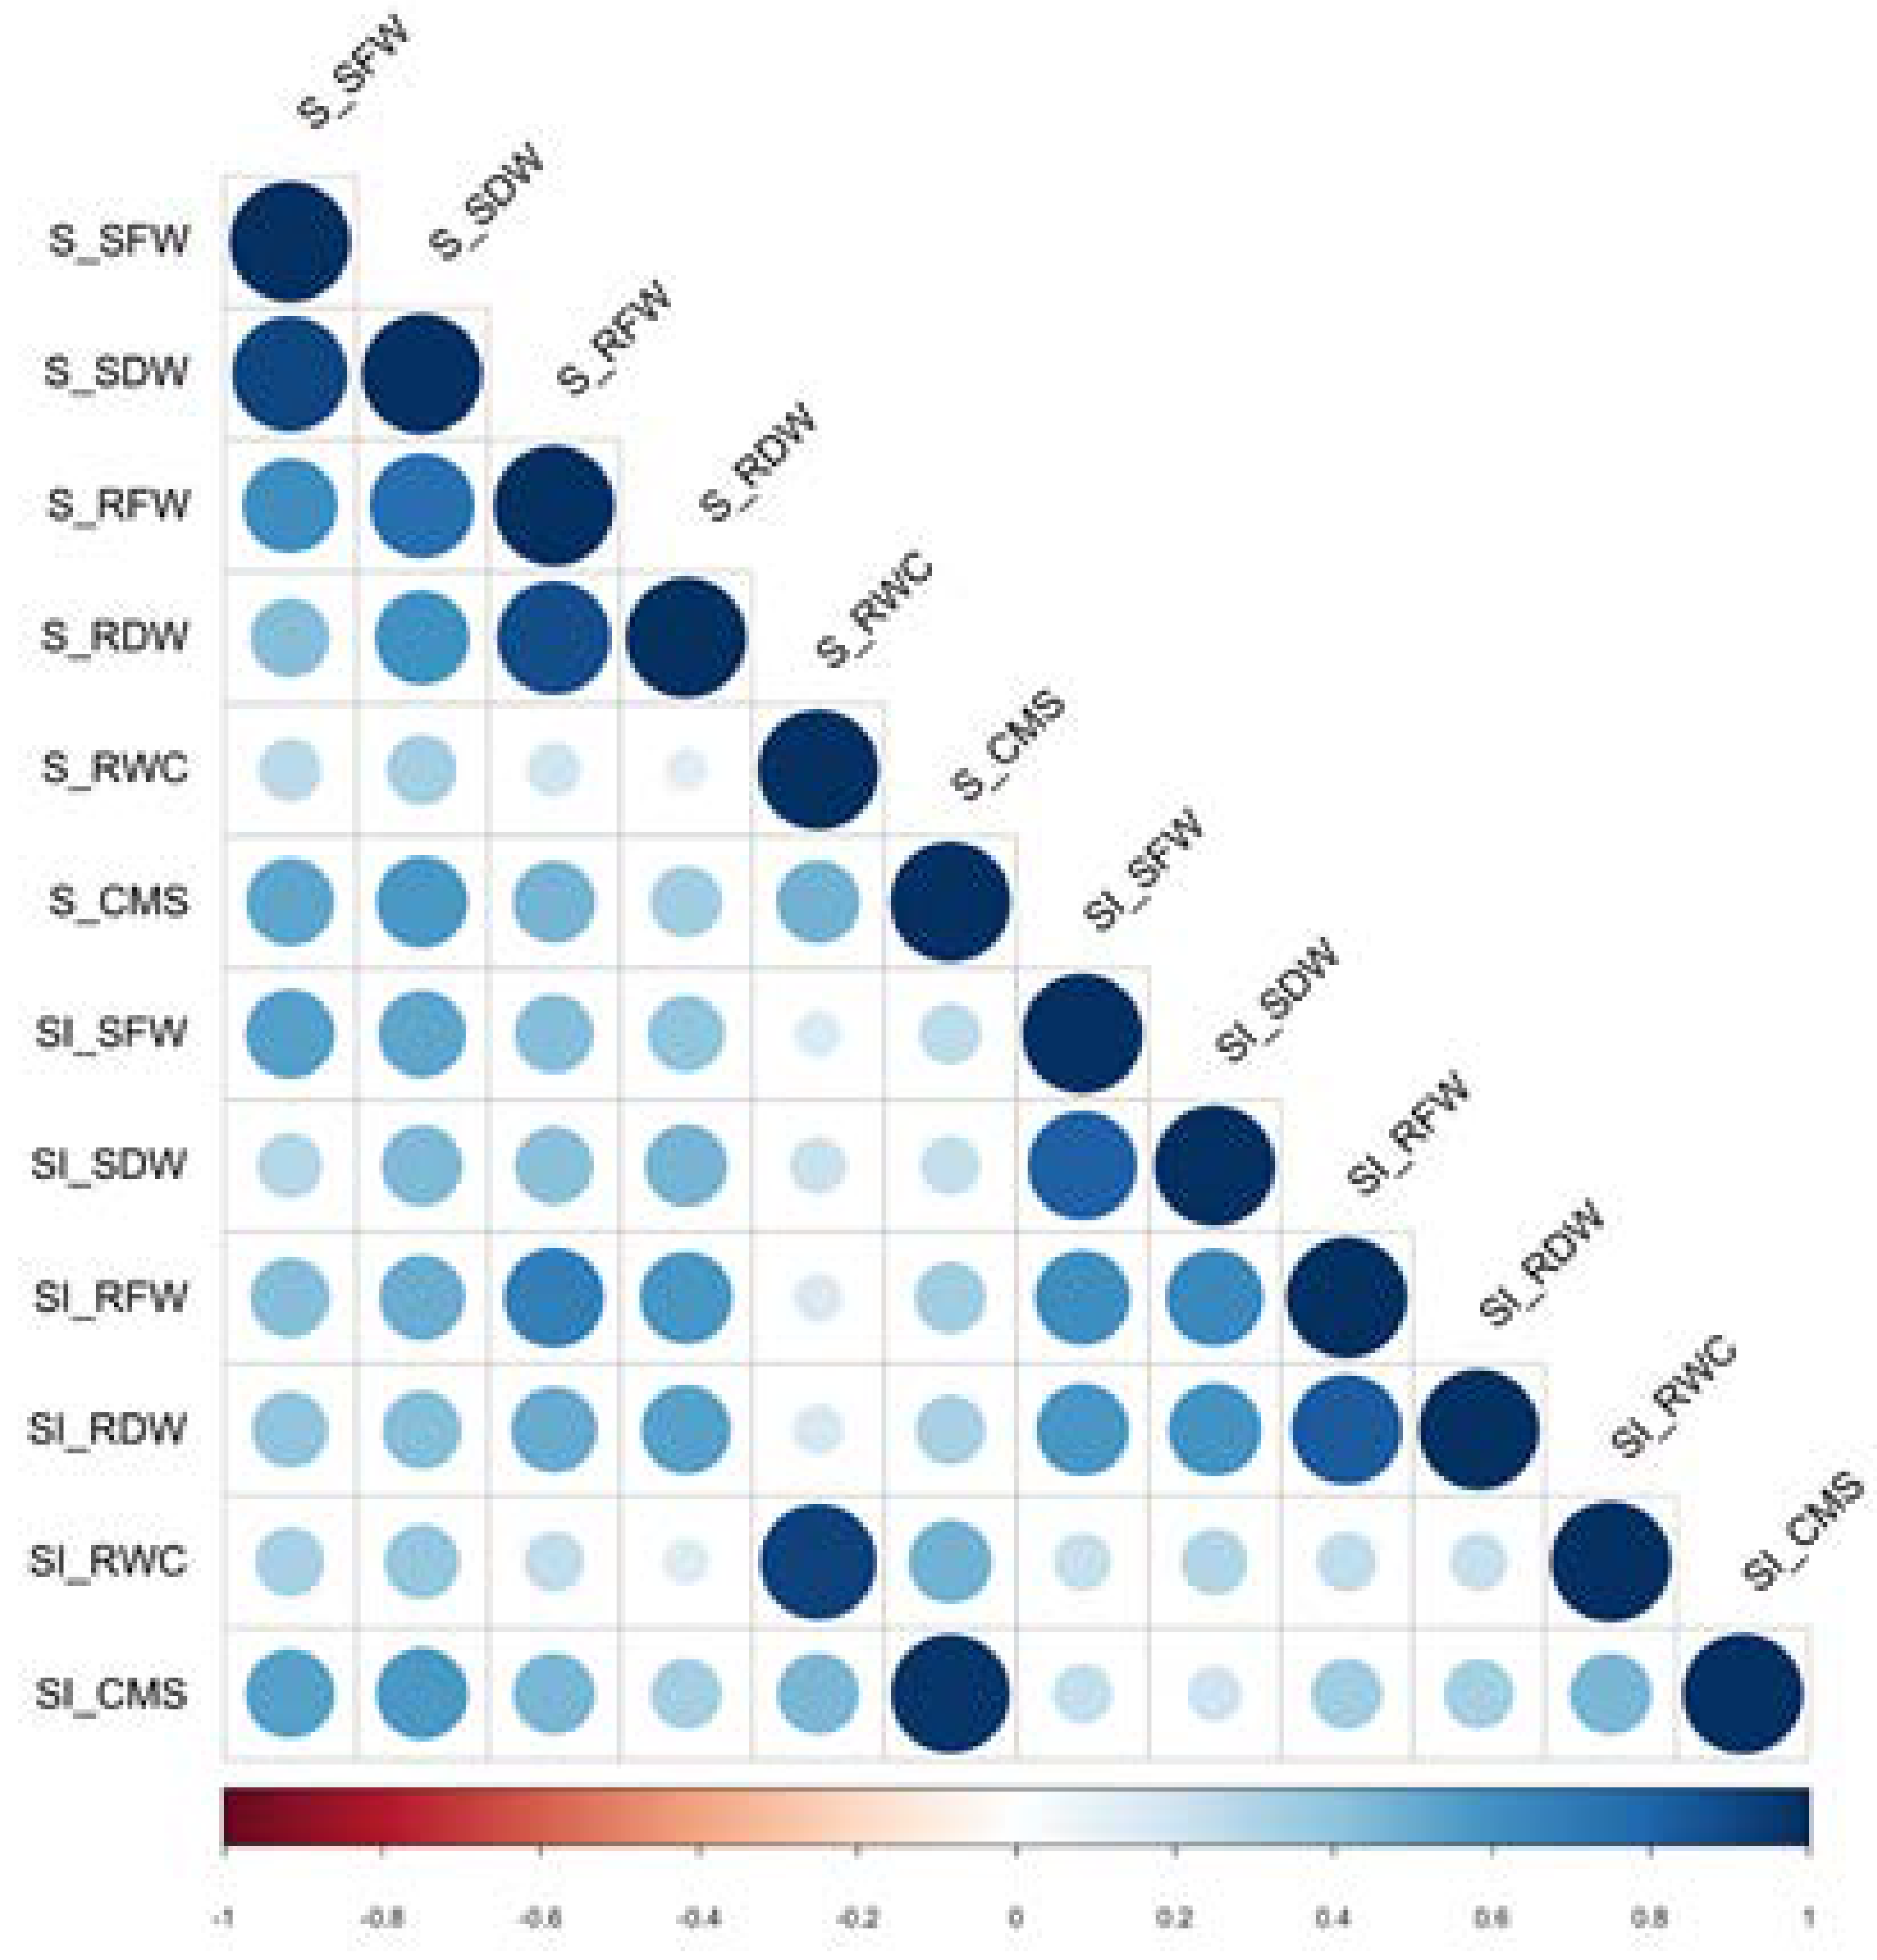
2.1. Phenotypic Variation in Local Thai Rice Seedlings under Salinity Stress

The average values of growth parameters, relative water content, and cell membrane stability are shown in Table 1. There was variation for all phenotypic traits under both control and salt stress conditions in local Thai rice population. To determine the effect of genotypic variation on salt-stress responses, the salt stability index and percentage change of each rice accession were calculated (Supplementary data Tables S1–S3). The local Thai rice cultivars in this experiment showed different salt-stress responses, presumably consistent with the level of salt tolerance of each cultivar. The sensitive cultivars displayed a low stability index, while the more salt-tolerant cultivars had a stability index close to 1 or more. A stability index higher than 1 indicated that salinity conditions in soil at EC 9–10 dSm−1 could enhance the growth of certain varieties. Examples of these varieties were ‘Pratahn Ban Bung’, ‘Leuang Puang Tawng’, and ‘Khiaw Hahng Mah’ (Supplementary Data, Tables S1 and S2).
Correlation coefficients of all phenotypic traits and their stability indices were calculated (Figure 1). There were positive correlations between biomass parameters (SFW, SDW, RFW, and RDW), cell membrane stability (CMS), and relative water content (RWC). RWC under salt stress (S_RWC) showed a low correlation (0.2–0.4) with growth parameters obtained from the same plants, while CMS under salt stress (S_CMS) had a higher correlation with shoot growth (S_SFW and S_SDW) than with root growth (S_RFW and S_RDW). Interestingly, the stability index of RWC (SI-RWC) was correlated with RWC under salt stress (S_RWC), and the stability index of CMS (SI-CMS) was highly correlated with CMS under salt stress (S_CMS), suggesting that RWC and CMS under salt stress conditions, without comparison with the value under normal-grown conditions, are appropriate for determining salt tolerance in rice.

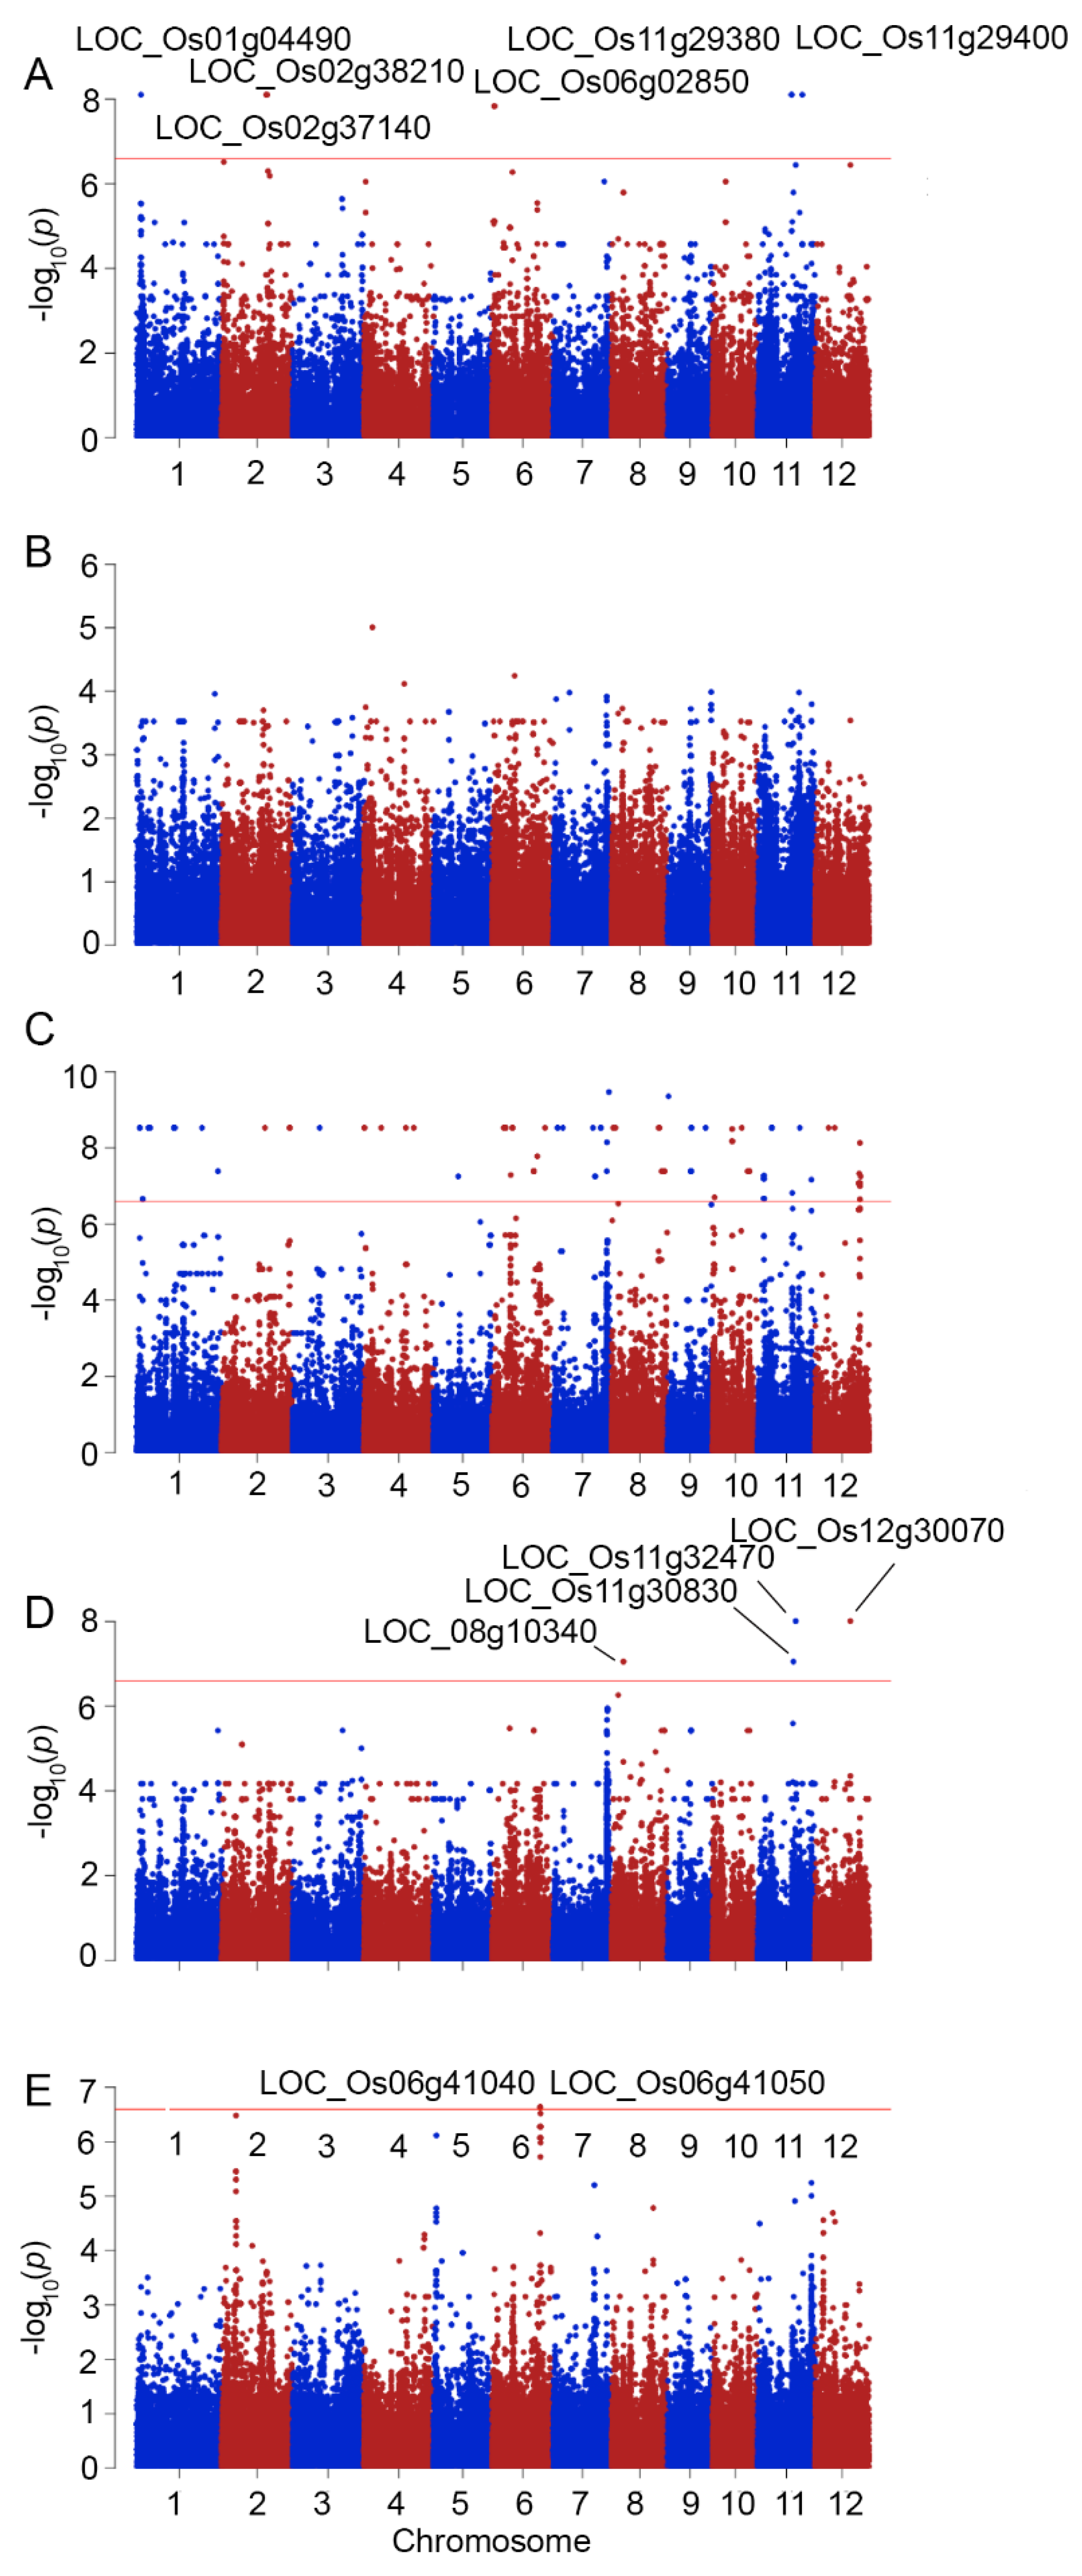
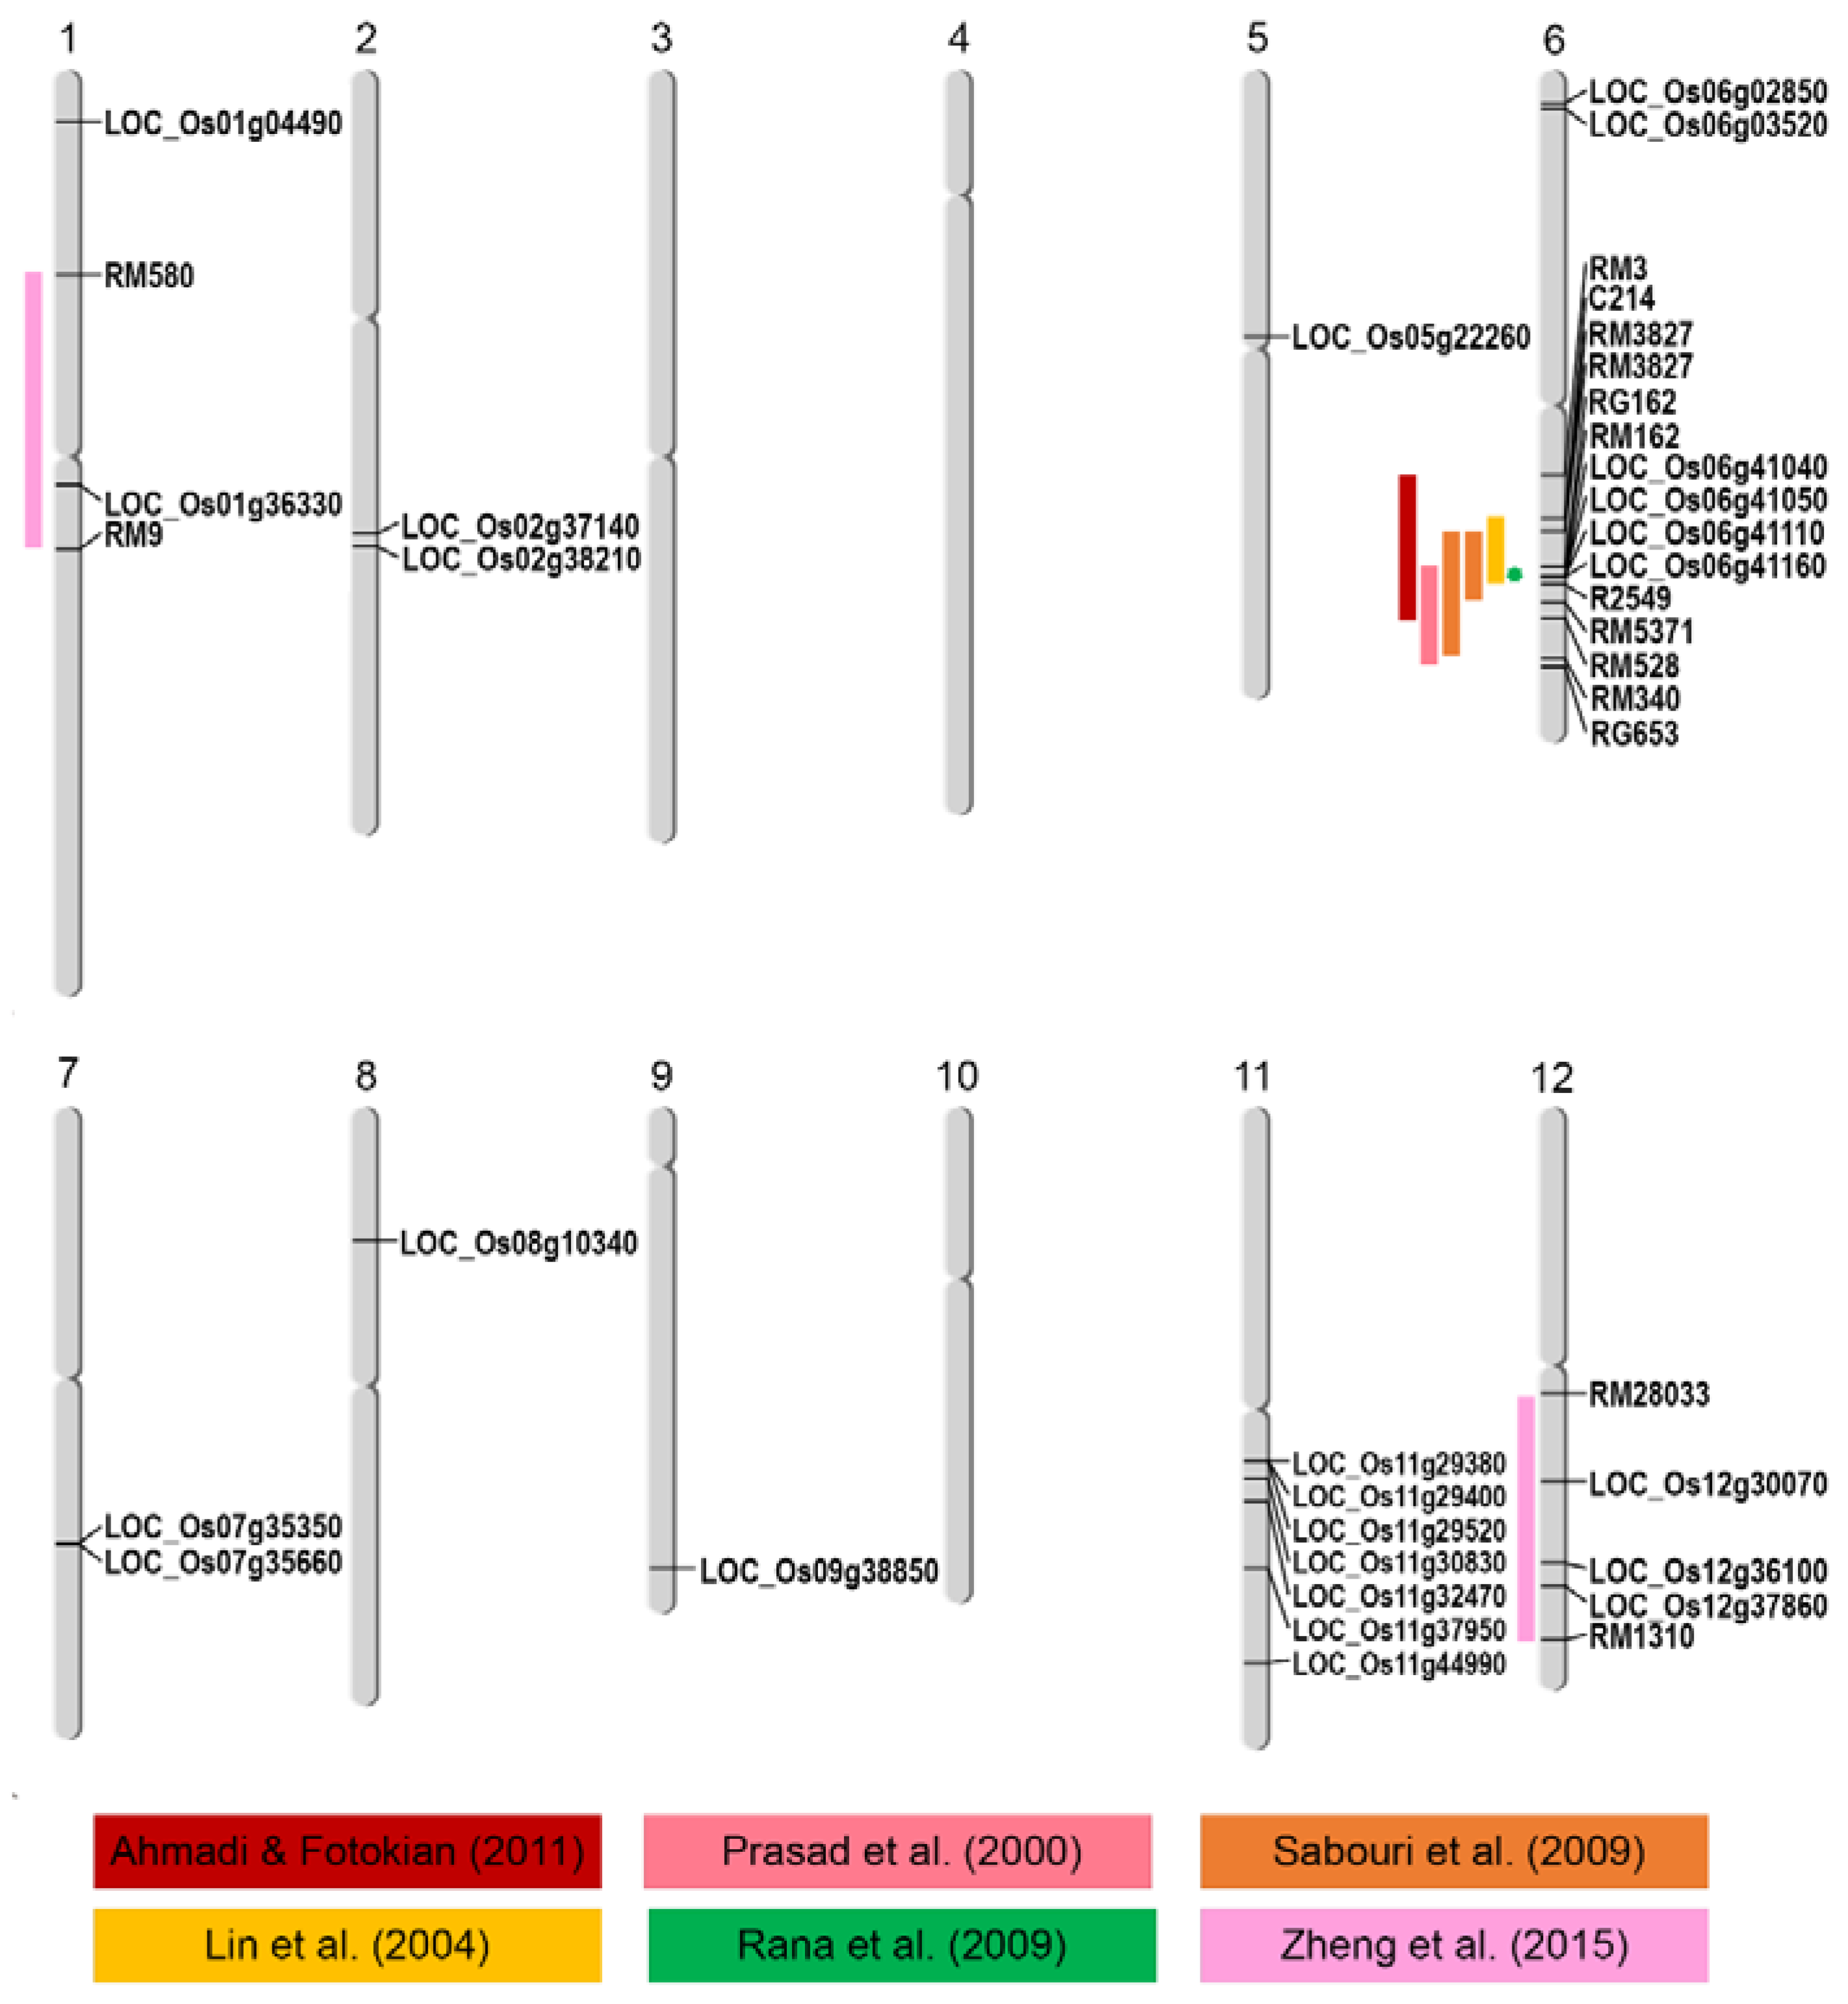
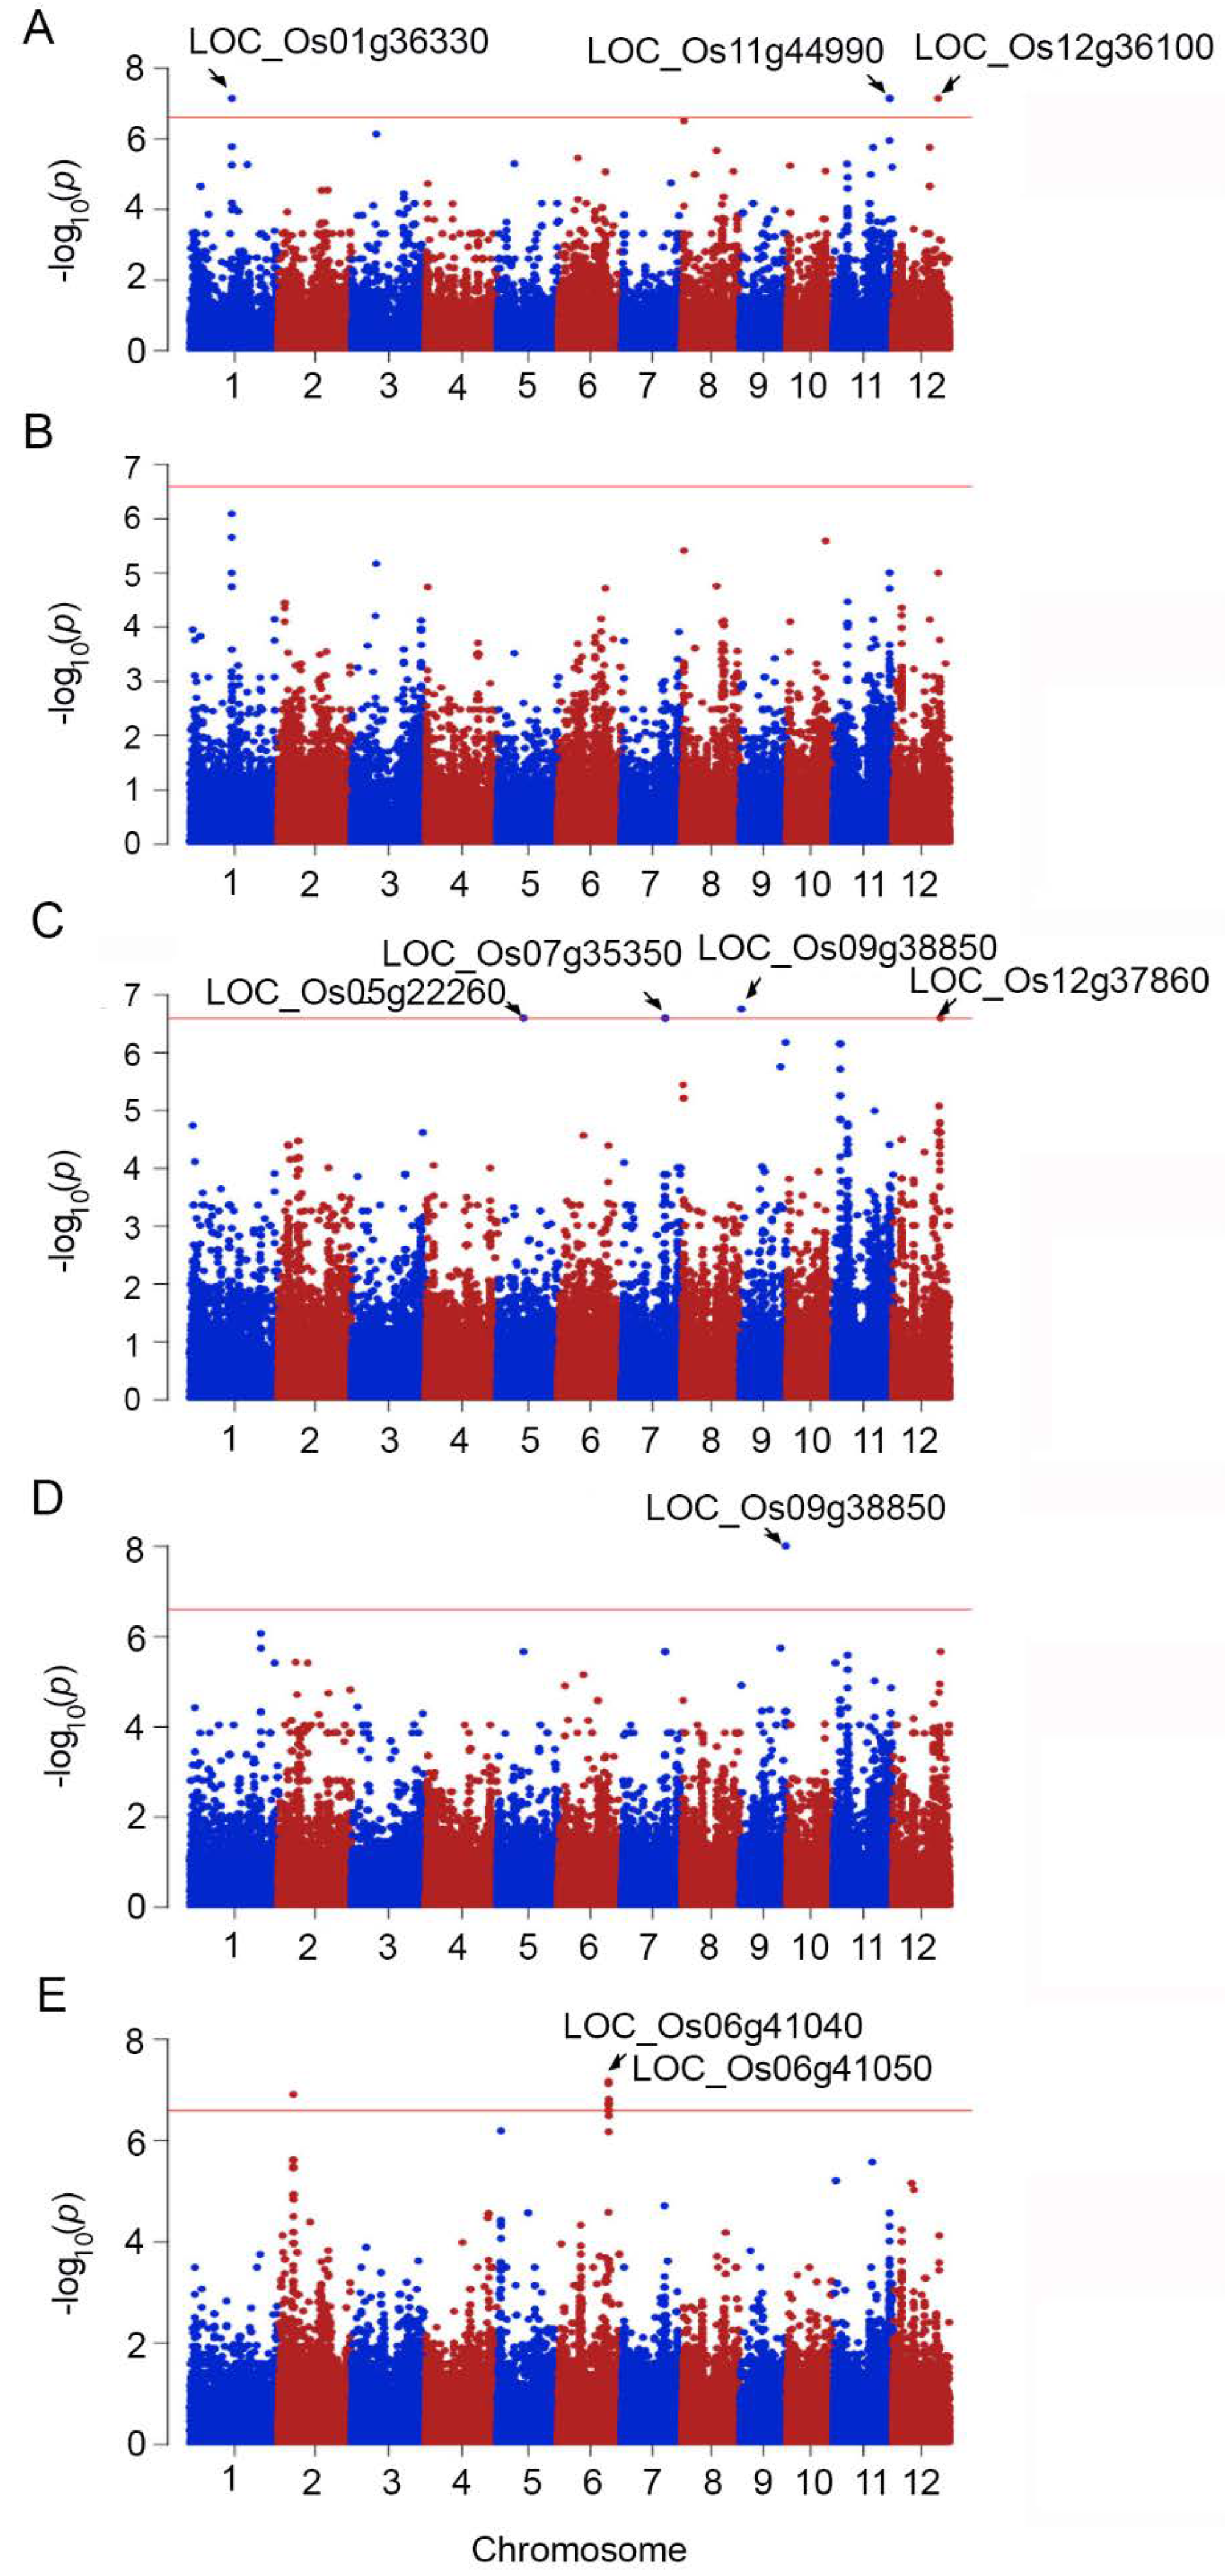
2.2. Genome-Wide Association between Phenotypic Traits under Salt Stress and SNPs

The average values of shoot fresh weight, shoot dry weight, root fresh weight, root dry weight, and cell membrane stability under salt stress conditions were used to perform a genome-wide association study based on SNP markers obtained from exome sequencing. GWAS of SFW revealed significant SNPs in three loci, LOC_Os01g36630, LOC_Os11g44990, and LOC_Os12g36100, which encode the expressed proteins, NB-ARC domain-containing protein, and kinesin-4, respectively (Figure 2A). The association of SDW and SNPs in the exomes did not result in significant causative SNPs (Figure 2B). Four causative genes predicted for RFW were LOC_Os05g22260, LOC_Os07g35350, LOC_Os09g38850, and LOC_Os12g37860, which encoded crooked neck (CRN) protein, glucan endo-1,3-beta-glucosidase precursor, DUF26 kinases, and expressed protein, respectively (Figure 2C). The association between SNPs and RDW exhibited a single causative gene, LOC_Os09g38850 encoding OsWAK91–OsWAK receptor-like protein kinase (Figure 2D). Two chromosomes, chromosome 2 and chromosome 6, contained causative regions for CMS traits. The predicted region on chromosome 2 was not associated with any annotated genes, whereas SNPs were located in a gene cluster consisting of LOC_Os06g41040, LOC_Os06g41050, LOC_Os06g41060, and LOC_Os06g41110. The details of these genes are listed in Table 2.
The stability indices of SFW, SDW, RFW, RDW, and CMS were associated with SNPs in exomes, revealing the causative genes in the salt-tolerant response, as shown in Figure 3 and Table 2. The association with stability indices resulted in the different patterns of qq-plots (Supplementary Figures S1 and S2) when compared to GWAS performed with the phenotypic traits of the salt-stressed plants, which reflected more causative SNPs. However, these may contain more false-positive results. A large number of false positive signals were also detected in the GWAS using RWC from salt-stressed plants and SI_RWC (data not shown).
GWAS revealed different causative regions associated with SFW. Six regions were located on chromosomes 1, 2, 6, and 11 (Figure 3A). This was different from the GWAS of SI_SDW, which revealed no significant SNPs (Figure 3B). GWAS of SI_RFW resulted in more than 40 significant SNPs and with a pattern of qq-plot, which may contain a number of false positive predictions (Figure 3C). GWAS for SI_RDW revealed four positive SNPs located on chromosomes 8, 11, and 12 (Figure 3D). Two significant SNPs were located on LOC_Os08g10340, encoding OsFBX278–F-box domain-containing protein, while the significant SNPs found on chromosome 11 were located in LOC_Os11g30830 and LOC_Os11g32470, encoding the expressed protein and no exine formation 1 (NEF1) gene, respectively. The predicted SNPs on chromosome 12 were located on LOC_Os12g30070 (Table 2), encoding the disease resistance protein RPM1, whose ortholog in Arabidopsis was reported to be responsible for the rapid increase in cytosolic Ca2+ required for the oxidative burst during the hypersensitive response, leading to cell death [25]. There were two significant SNPs for SI_CMS at LOC_Os06g41040 and LOC_Os06g41050, which were the same loci detected by GWAS with CMS values obtained from plants under salt stress (Figure 3E, Table 2).
Based on GWAS with various parameters obtained from salt-stressed rice seedlings, a total of 25 causative genes were predicted. These were located on chromosomes 1, 2, 5, 6, 7, 8, 9, 11, and 12. The map of all predicted genes in comparison with the reported salt-tolerant QTLs (ST-QTLs) is shown in Figure 4.

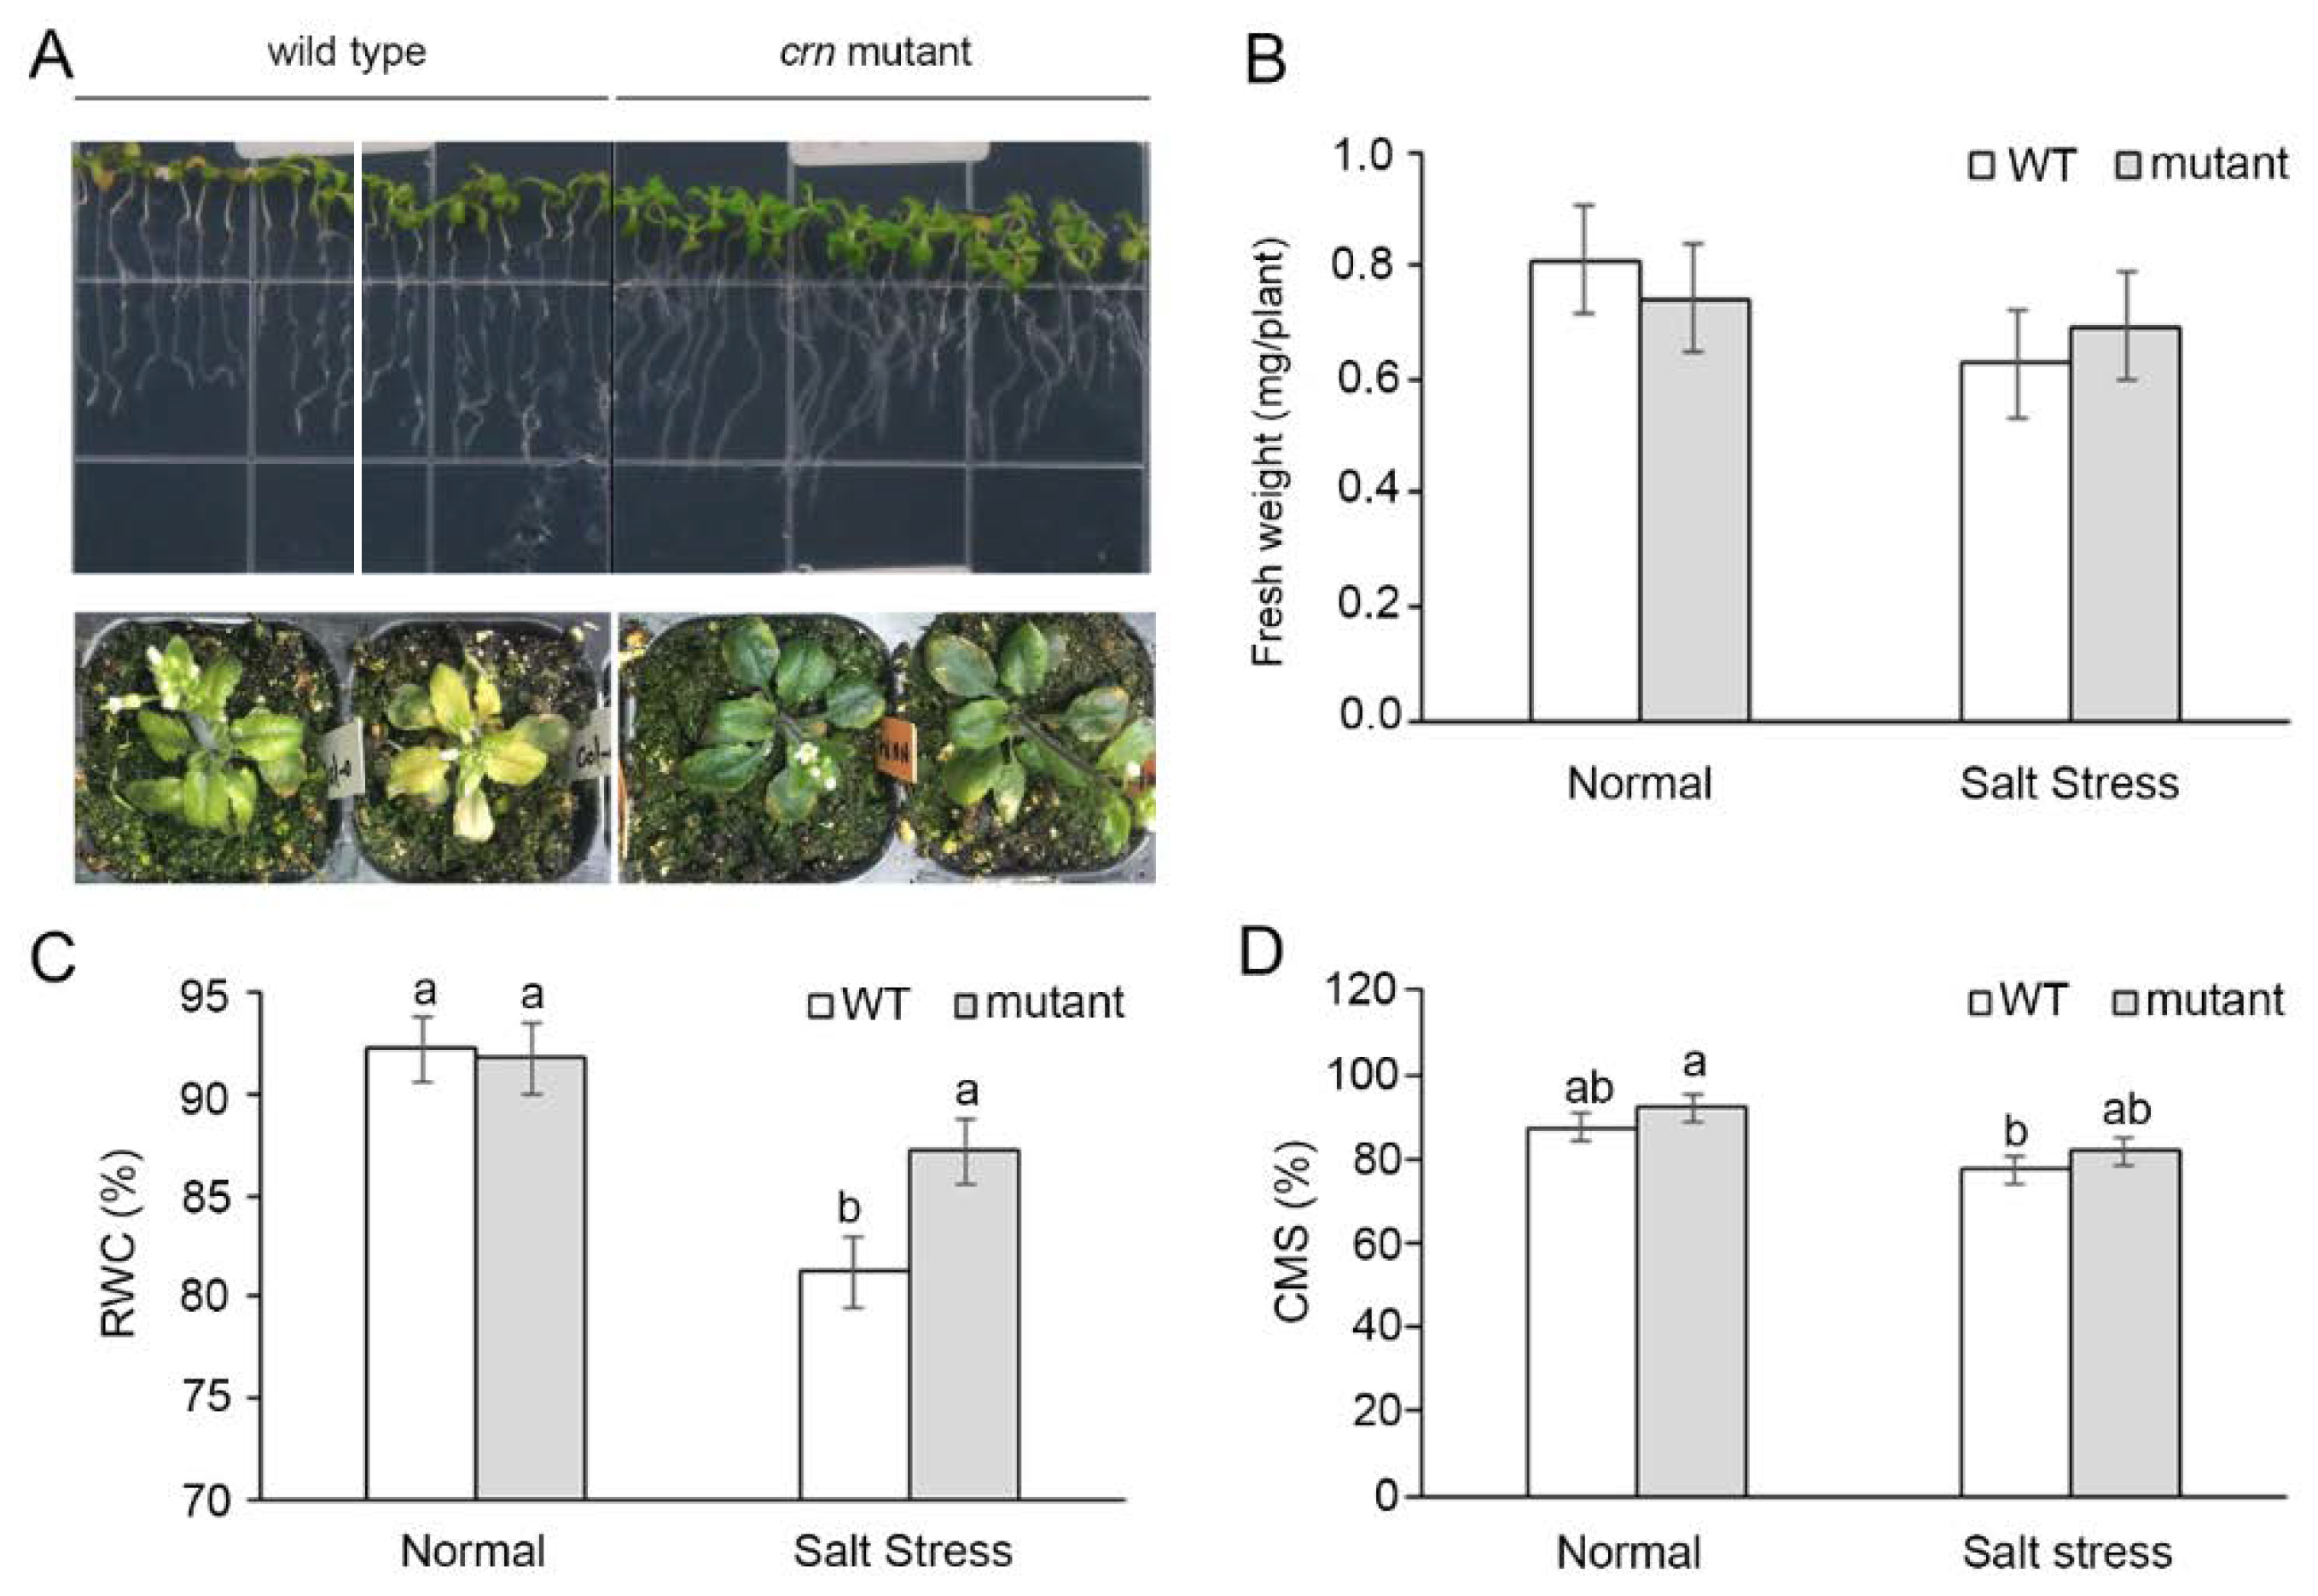
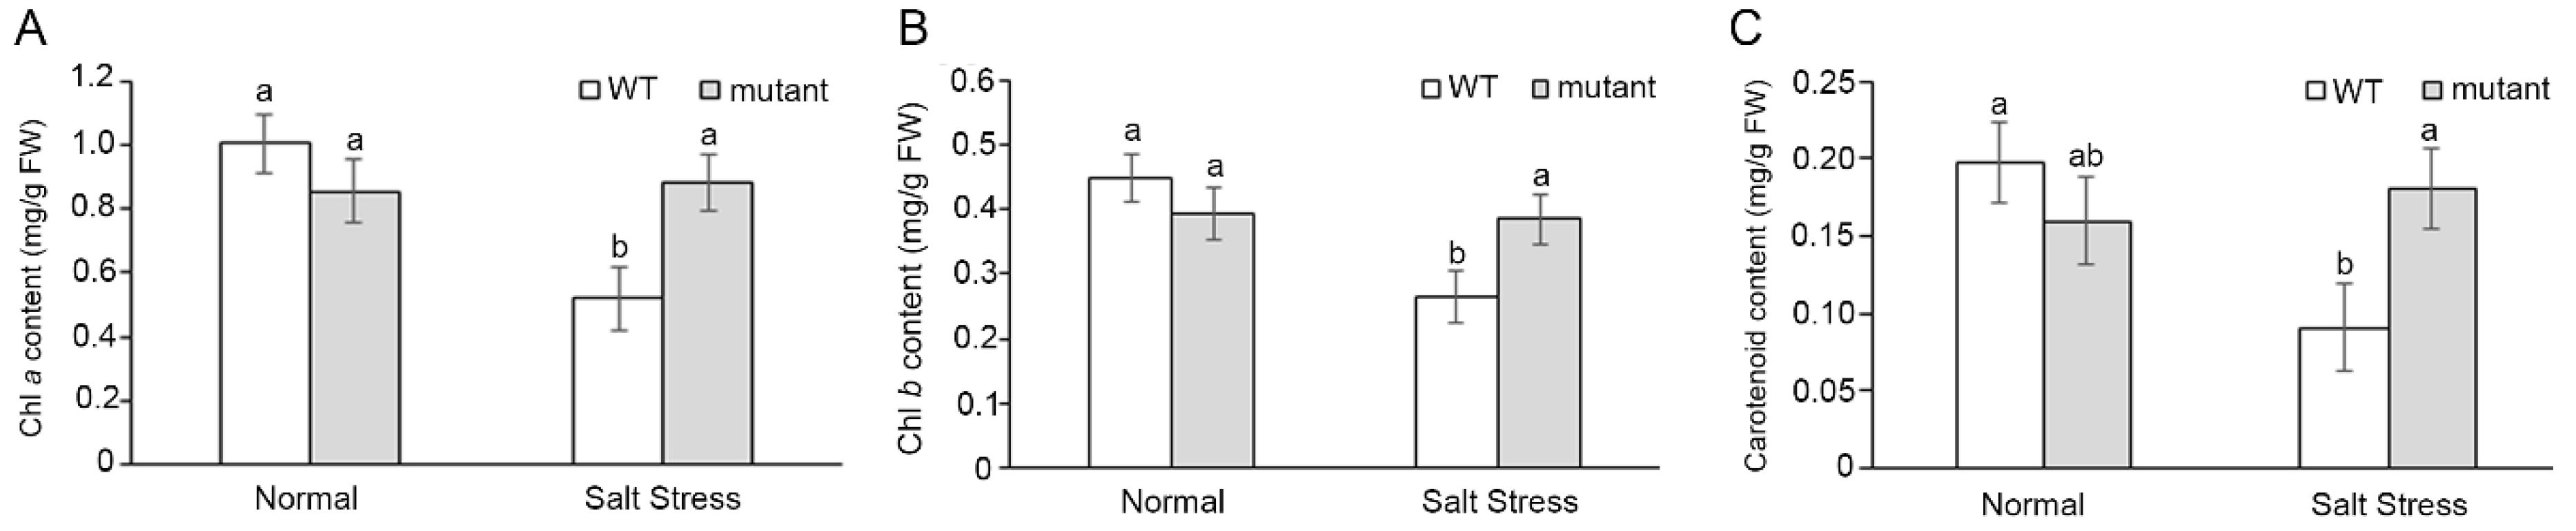
2.3. Characterization of a Gene Putative Associated with Salt Tolerance Using an Arabidopsis Mutant

LOC_Os05g22260 (OsCRN) was selected for further characterization of salt tolerance based on its interaction with other proteins predicted by the STRING database (Supplementary Figure S3), especially the AtSKIP gene, which has been reported to confer osmotic tolerance during salt stress [26]. AtCRN (AT5G41770) is a homologous gene of OsCRN in Arabidopsis. Therefore, an Arabidopsis mutant line with T-DNA insertion at the AtCRN gene, a crn mutant, from the Arabidopsis Biological Resource Center (ABRC), was selected to study the role of the AtCRN gene in salt tolerance.
When 7-day-old seedings were planted on MS medium supplemented with 100 mM NaCl for 7 days, there was no significant difference in biomass between the wild-type (WT) and mutant lines (Figure 5A). Therefore, we monitored the effects of salt stress on the soil-grown plants. When flower buds emerged (4- to 5-week-old plants), 350 mM NaCl was applied as salt stress treatment, while water was applied to the normal grown plants. After 6 to 9 days, salt stress caused fresh weight reduction in both the WT and crn mutants. However, no significant differences were detected (Figure 5B). Salt stress caused a significant reduction in the RWC of WT, but less reduction was detected in the mutant line (Figure 5C). Salt stress also caused a reduction in the CMS. However, there was no significant difference between the WT and mutant strains (Figure 5D). It is worth mentioning that CMS reduction occurred after 9 days of salt stress, while a reduction in RWC could be detected after 6 days of salt stress.
The crn mutant had the ability to maintain photosynthetic pigment content under salt stress conditions (Figure 5A and Figure 6). Salt stress caused photosynthetic pigment degradation in WT plants after 6 days under stress. In WT, Chl a (Figure 6A), Chl b (Figure 6B), and carotenoid were decreased by 48%, 41%, and 54%, respectively, while in the mutant line, a slight reduction in Chl b (2%) and a slight increase in Chl a (4%) (Figure 6A) and carotenoid (14%) (Figure 6C) were detected. However, there was no significant difference in photosynthetic pigment content between the salt-stressed and non-stressed crn mutant (Figure 6).

2.4. Ectopic Expression of the OsCRN Gene in crn Mutant and WT Increased the Susceptibility to Salt Stress

In order to validate OsCRN gene involvement in the salt tolerance response, it was expressed in the crn Arabidopsis mutant and WT. Two complemented lines, rev-B and rev-D, and two ectopic expression lines, Ox-R and Ox-L, were generated. After the screening of homozygous plants in the T2 generation, the homozygous lines were used to evaluate the photosynthetic responses under normal and salt stress conditions, as the crn mutant line showed the ability to maintain photosynthetic pigments. Therefore, evaluation of the photosynthetic response is a sensitive method for monitoring the response of these lines under salt stress.
Four-week-old plants were treated with 350 mM NaCl for salt stress and plain water was added under normal conditions. At the beginning of the experiment, no significant differences were found in the photosynthetic parameters among these lines. After 7 days, salt stress decreased net photosynthesis rate (Pn) in all lines (Figure 7A). The Pn of the crn mutant was slightly higher than that of the WT, while the Pn of one of the complemented lines, Rev-D, was less than 0, resulting in a significant difference from the crn mutant. The Pn of Rev-B and Ox-L was also lower than that of the crn mutant (Figure 7A). A significant difference in stomatal conductance (gs) was not detected in salt-stressed plants. However, crn mutants tended to have lower gs than WT, while gs of the complemented lines and ectopic expression lines tended to have higher gs than the crn mutant. Salt stress caused an increase in internal CO2 concentration (Ci) in all lines. The highest Ci was detected in Rev-D, which was consistent with the greatest decline in the A (Figure 7C). The transpiration rate (E) was consistent with that of gs. Rev-D and Ox-L had the highest transpiration rate (Figure 7D).
Expression of OsCRN inhibited electron transport in photosynthesis and decreased the quantum yield of φPSII. In general, salt stress decreased the electron transport rate (ETR) and quantum yield of φPSII. This phenomenon was observed in all lines. However, the ETRs of Rev-B, Rev-D, and Ox-L were significantly lower than their respective ETRs under normal growth conditions, suggesting a greater susceptibility to salt stress in these lines. Only a 16% reduction in ETR was detected in the crn mutant, whereas WT had a 21% reduction in ETR. In contrast, a 59% and 37% decrease in ETR was found in Rev-B and Rev-D, respectively, while 17% and 65% of ETR reduction was found in the ectopic expression lines, Ox-R and Ox-L (Figure 7E).
The quantum yield of photosystem II (φPSII) was investigated under normal and salt-stressed conditions. The ectopic expression of Ox-L had significantly higher φPSII than WT under normal growth conditions, while other lines showed similar levels of φPSII under normal conditions. Salt stress caused a decline in φPSII in all the lines. Ox-L was the most susceptible to salt stress, with the highest reduction in φPSII, while the crn mutant had the least reduction in φPSII (Figure 7F).

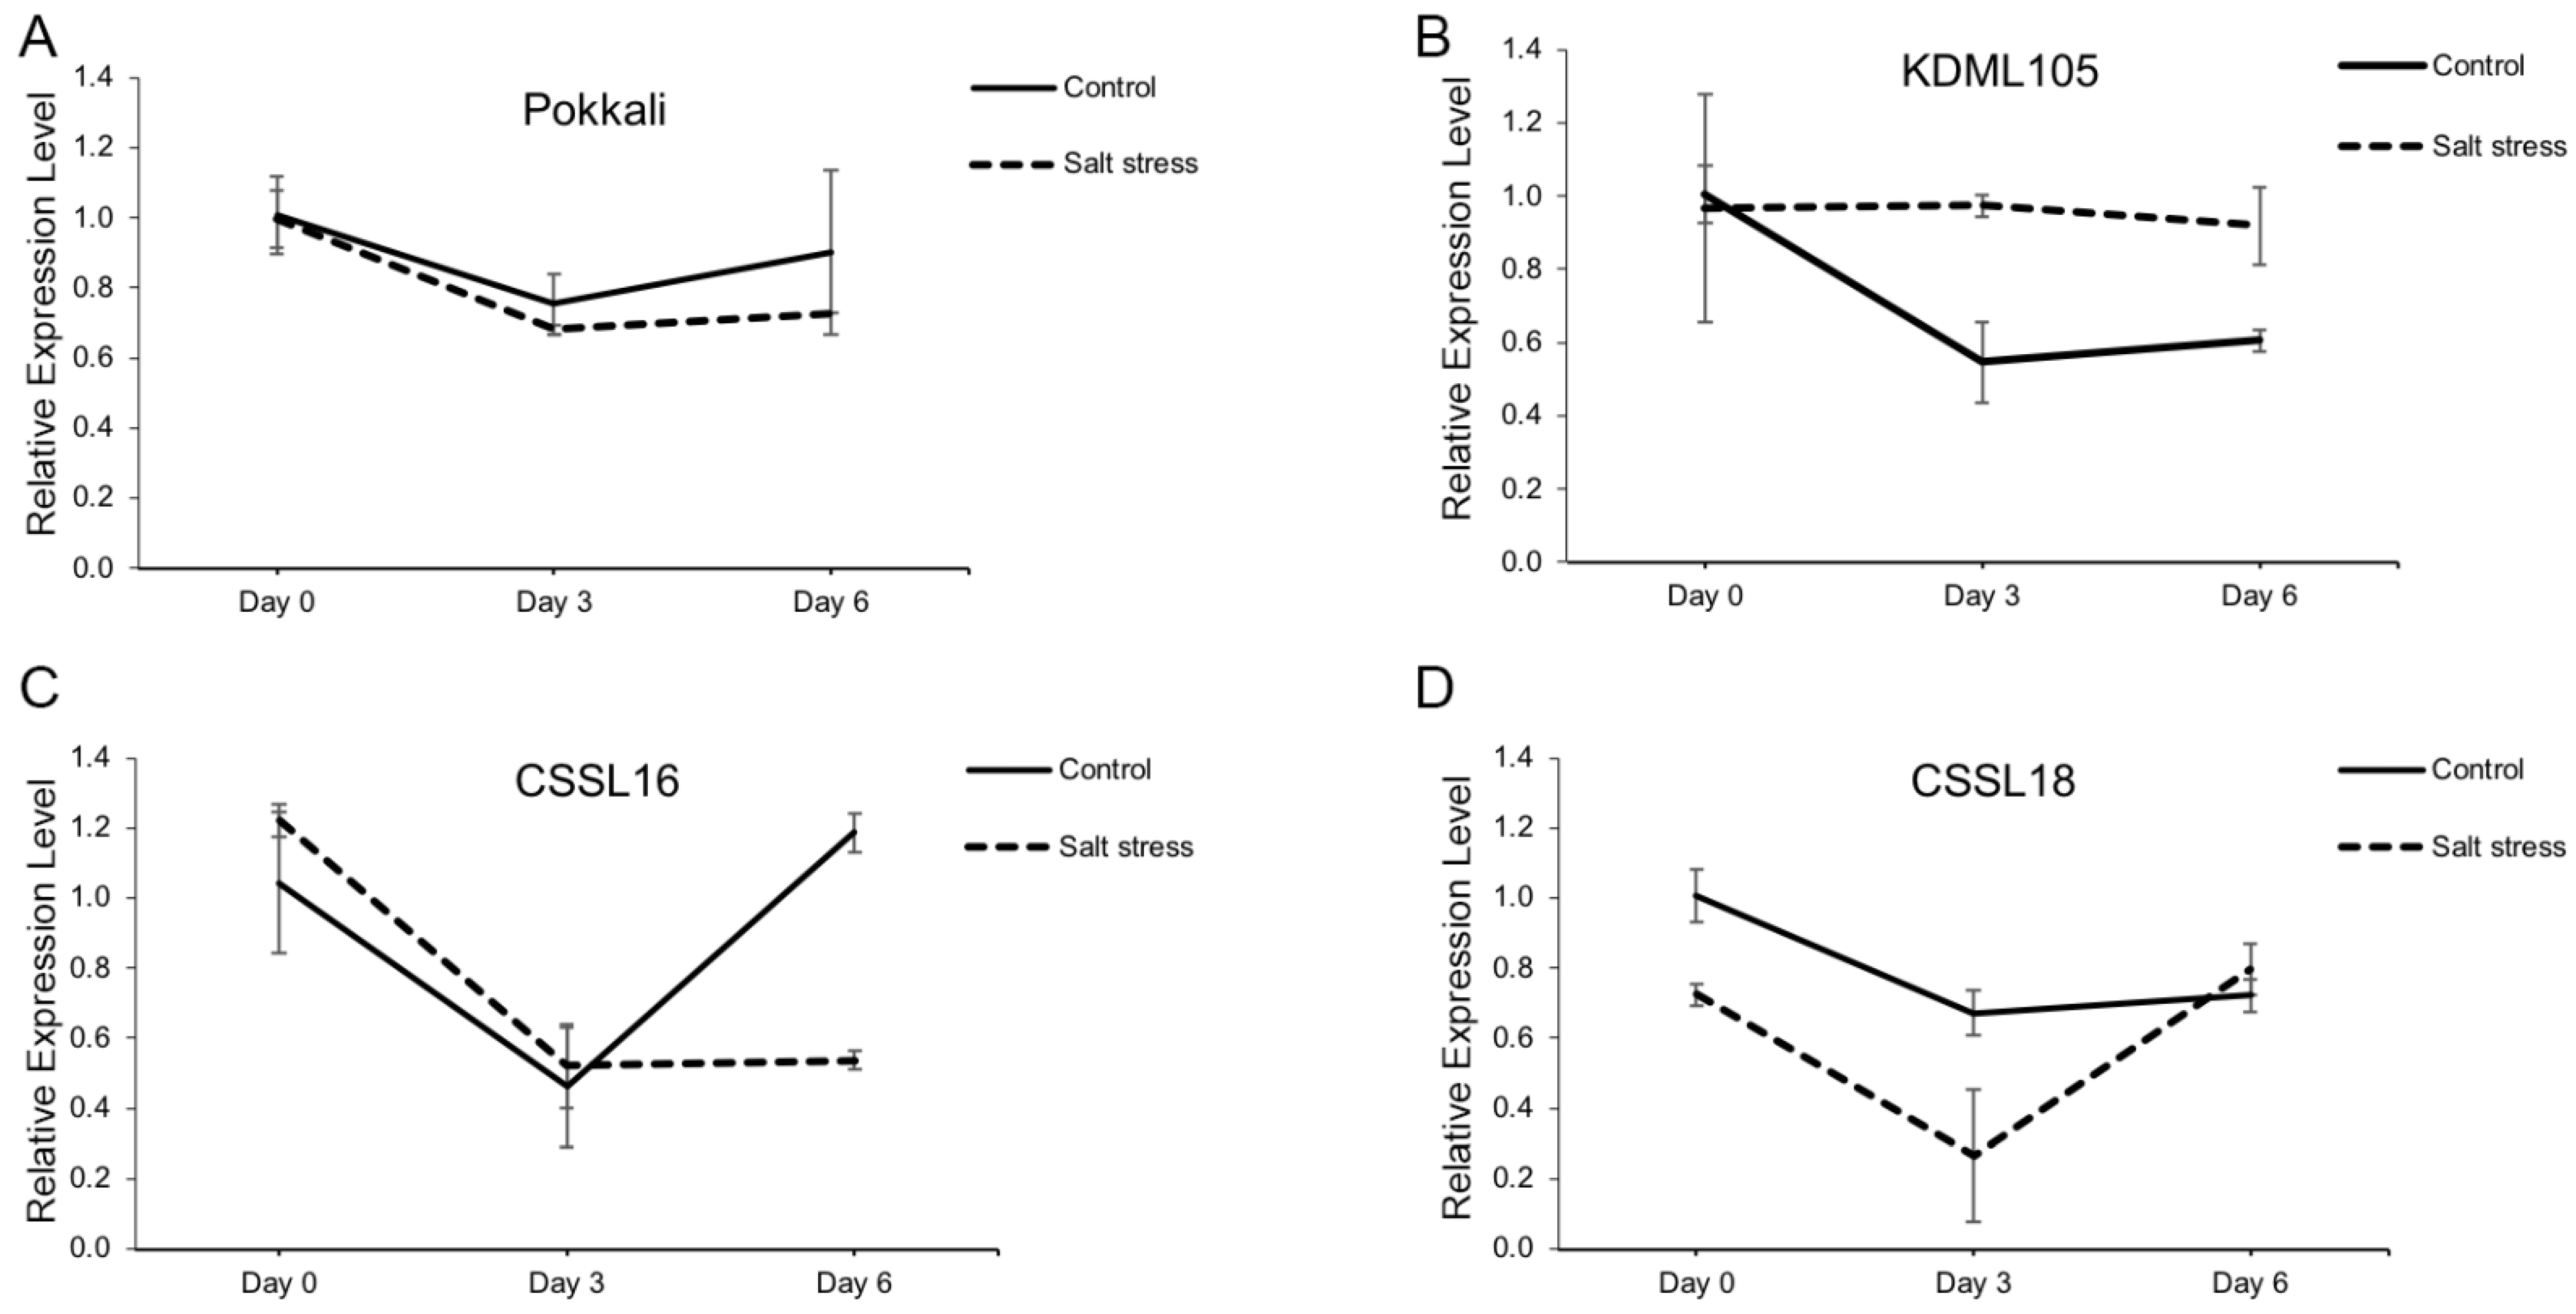
2.5. The Salt-Tolerant Rice Varieties Lowered OsCRN Gene Expression under Salt Stress Condition

OsCRN gene expression was investigated in four rice varieties, namely the salt-tolerant rice variety ’Pokkali’, the salt-susceptible Thai rice variety ‘KDML105’, and two salt-tolerant lines with ‘KDML105’ genetic background, CSSL16 [27,28,29] and CSSL18 [30]. A similar level of OsCRN gene expression was detected in ‘Pokkali’ when it was grown in normal (control) and salt stress condition (Figure 8A), while the opposite pattern was found in ‘KDML105’. Under salt stress, ‘KDML105’ had a higher level of OsCRN gene expression than that observed under normal conditions (Figure 8B). On the other hand, in the CSSL16, OsCRN gene expression was lower than in the normal grown plants after 6 days of treatment (Figure 8C), while OsCRN expression of CSSL18 was lower than that in normal grown plants after 3 days of treatment (Figure 8D). These results support the role of OsCRN as a negative regulator of salt tolerance in rice.

3. Discussion

Growth parameters, such as SRW, SDW, RFW, and RDW, have been used to determine salt stress responses and tolerance in various species, such as cotton [31], maize [32,33], tomato [34], wheat [35], eggplant [36], and rice [9]. RWC and CMS have also been used to assess salt tolerance. CMS was used to screen for salt-tolerant wheat. CMS was shown to have a positive correlation with Na+ and a negative correlation with K+ and grain yield. However, the correlation between CMS and RWC depended on the variety tested [37]. In our study, the correlation between CMS and shoot weight (SFW and SDW) was higher than the correlation between RWC and shoot weight. A moderate correlation between CMS and RWC was found, suggesting that different genes contribute to these traits in rice. This was consistent with the GWAS results showing that the regions predicted by GWAS of the growth traits were different from the genes/regions predicted by CMS and RWC.
The genes predicted by GWAS were consistent with the previously reported ST-QTLs. Eight genes predicted by GWAS on chromosomes 1, 6, and 12 were located within the previously reported ST-QTLs [38] (Figure 4). The functions of some predicted candidate genes were characterized. LOC_Os01g59560 encodes OsRLCK46 protein, which is a protein in the superfamily of receptor-like kinases (RLKs). RLK is a transmembrane protein with an extracellular receptor domain and an intracellular kinase domain that perceives and sends signals [39]. Some RLCKs play a role in the development and stress responses in plants. AtCRCK1 responds to abiotic stresses, including salt stress [40]. Moreover, OsRLCK46 was down-regulated in 7-day-old seedlings under salt stress conditions [41]. Based on this GWAS analysis, LOC_Os08g10340, encoding OsFBX278–F-box domain-containing protein was identified as the candidate gene. An F-box domain-containing protein gene on chromosome 11 was also identified to be involved with salt tolerance in rice [9]. A transcription factor of gibberellin-dependent alpha-amylase (GAMyb) was suggested to regulate carbohydrate metabolism, leading to salt tolerance response. In our GWAS experiment, two candidate genes with the functions in carbohydrate metabolism were predicted, LOC_Os06g41160 and LOC_Os07g35350 (Table 2). This supports the role of carbohydrate metabolism in salt tolerance. The gene co-expression network of ‘Luang Pratahn’ rice, which is one of the local Thai rice cultivars used in this GWAS, also detected the involvement in carbohydrate metabolism via the expression of OsGAPDH. This gene was reported to be in the same network with LOC_Os05g43310 (Photosystem II reaction center W protein) and LOC_Os10g25030 (red chlorophyll catabolite reductase; OsRCCR1), and have a function in chloroplasts [42].
LOC_Os05g22260 was selected for further characterization. It encodes the OsCRN protein, a putative mRNA splicing factor. The crn Arabidopsis mutant line showed a higher salt tolerance phenotype by increasing the ability to maintain RWC, CMS (Figure 5), and photosynthetic pigment content (Figure 6) during salt stress. Since the crn Arabidopsis mutant line was able to maintain chlorophyll and carotenoid pigments under salt stress, and previous reports suggested the importance of carbohydrate metabolism balance under abiotic stresses [42,43], we investigated the photosynthesis responses of the mutant, complemented lines, and the ectopically expressed lines to validate the function of CRN gene under salt stress. The complemented lines with the expression of OsCRN, Rev-B, and Rev-D, including the ectopically expressed line of OsCRN in the WT background, exhibited decreased photosynthesis performance (Figure 7A) without the negative effect of stomatal conductance (Figure 7B). This indicated that the reduction in the net photosynthesis rate was not due to stomatal closure. Under salt stress, the ETR (Figure 7E) and φPSII (Figure 7F) of the complemented and ectopic expression lines, Rev-B, Rev-D, and Ox-L, were lower than those of the crn mutant. Therefore, under salt stress conditions, OsCRN expression affected the light reaction process rather than stomatal responses. This was consistent with GWAS for the Fv’/Fm’ trait under drought stress performed using a rice panel of 221 lines collected from USDA ARS Dale Bumpers National Rice Research Center, Stuttgart, Arkansas, USA [44]. With the negative effect of OsCRN gene expression in Arabidopsis during salt stress, we propose that OsCRN is a negative regulator of salt tolerance.
In order to investigate the relation between OsCRN gene expression and salt tolerance in selected rice cultivars, we compared the salt-tolerant standard cultivar, ‘Pokkali’, the salt-susceptible variety, ‘KDML105’, and the latter’s chromosome substitution lines with salt-tolerant phenotypes, CSSL16 [27,28,29] and CSSL18 [30,45]. ‘KDML105’ rice (Figure 8B) and its salt-tolerant CSSLs displayed opposite OsCRN expression responses (Figure 8C,D). The decline in OsCRN expression after 3–6 days of salt stress is consistent with the salt-tolerant phenotype of CSSL16 at seedling stages [28,29]. For CSSL18, lower OsCRN expression during the first 3 days of salt stress may be enough to contribute to salt tolerance. This supports the role of OsCRN as a negative regulator in rice.
Reduced expression of OsCRN helps explaining CSSL16 salt tolerance at the seedling, tillering, and flowering stages [28,29,46], making it an attractive breeding line for the further development of salt-tolerant rice cultivar. Furthermore, validated genomic regions of local Thai rice cultivars with high stability index under salt stress can contribute to the breeding of salt-tolerant rice.

4. Materials and Methods

4.1. Plant Materials, Growth Conditions, and Phenotypic Data Collection

The 89 local Thai rice seedlings were germinated in water for 5 days and grown in smectitic clay soil in pots three inches in diameter, supplemented with 13-13-13 osmocote fertilizer. The experiment was conducted in a randomized complete block design (RCBD) with four replicates (one plant/replicate). Due to the large number of rice cultivars, RCBD was used in order to have a similar environment for all cultivars in each block. After that, all 14-day-old seedlings were treated with 115 mM NaCl solution for 6 days (EC 9–10 dSm−2, using an EC meter [SevenCompact™ conductivity S230; Metler, USA]). Phenotypic traits, such as shoot fresh weight, shoot dry weight, root fresh weight, root dry weight, relative water content (RWC), and cell membrane stability (CMS) were measured at 0 and 6 days after treatment.
For the RWC parameter, the youngest fully-expanded leaves were cut into two pieces of approximately 1 cm and weighed for fresh weight (FW). After that, the leaves were soaked in 10 mL of distilled water in a cup closed with a cap at room temperature for 4 h to allow the leaves to reach full hydration; the turgid weight (TW) was then measured. Finally, the leaves were incubated at 60 °C for 3 days and weighed for dry weight (DW). RWC was calculated according to the formula [47]:
(FW-DW)/(TW-DW) × 100.
For CMS, the youngest fully-expanded leaves (100 mg) were chopped into approximately 0.5-cm pieces and soaked in 10 mL of distilled water in a closed centrifuge tube at room temperature for 4 h. The first electrical conductivity (EC0) of the sample solutions was measured using an EC meter (SevenCompact™ conductivity S230; Mettler Toledo, USA). Then, the leaf tissue in the centrifuge tube was boiled for 15–30 min. Sample solutions at room temperature was measured for final electrical conductivity value (EC1). CMS was calculated according to the formula [48]:
100 − [(EC0/EC1) × 100].
The stability index was calculated as the salt stress value divided by the control as (Vstress/Vcontrol).
Percentage change (% change) was calculated as the percentage of difference in value divided by the control value as ((Vstress-Vcontrol)/Vcontrol) × 100.
Correlation test was performed by JMP ver. 9 (SAS Institute Inc., Cary, NC, USA) and figures were generated by the R ‘corrplot’ package.

4.2. Genome-Wide Association Analysis

Association analysis was performed following Lekklar et al. (2019) [24] using genome-wide efficient mixed model association (GEMMA) software [49,50]. The minor/alternate allele frequency (MAF) that was less than 5% was filtered out of SNP data by PLINK 1.07 and left with 197,454 SNPs. The quantile–quantile plot (Q-Q plot) and Manhattan plot in each trait were conducted by R ‘qqman’ package [51]. Manhattan plots were created with chromosome position on the X-axis and -log p-value of all SNPs on the Y-axis. Bonferroni correction was used for multiple testing correction and significant SNPs were selected with p-values less than 0.05/ total number of SNPs (p < 2.53 × 10⁻⁷).

4.3. Validation of Salt Responses in Arabidopsis

4.3.1. Phenotypic Comparison between crn Mutant and Arabidopsis WT

The crn mutant line (SALK_030126C) of Arabidopsis at the AT5G41770 gene (AtCRN1), which is the orthologous genes of LOC_Os05g22260, and wild-type (Col-0) were cultured on MS media, supplemented with 1% sucrose and 0.8% agar in a 120-mm square petri dish under 16/8-h light/dark period at 22 °C with three replications. After 7 days of germination, 20 seedlings of each line were transferred to MS medium (containing the same concentration of sucrose and agar as mentioned above) with or without 100 mM NaCl. After 7 days of treatment, the mutant seedlings were photographed in comparison with the WT.
To evaluate the phenotypes of soil-grown Arabidopsis, seeds were germinated on MS medium, as indicated above. The comparison of the phenotypes was designed in a randomized complete block design (RCBD) with three replications, with five samples per replications in each line. Then, 7-day-old seedlings were transferred to growing medium in 5-cm diameter pots under a 16/8-h light/dark period with 100 mmol.m−2. s−1 light intensity at 21–23 °C. Arabidopsis lines in this experiment took 4–5 weeks after germination until flowering depending on the lines. At first visible flower buds, Arabidopsis plants were treated with (salt stress) or without (control) 350 mM NaCl. After 6 days of treatment, fresh weight, relative water content (RWC), and photosynthetic pigment contents were measured, while the cell membrane stability index (CMS) was measured after 9 days of treatment.
For photosynthetic pigment content measurement, fresh weight of five seedlings were recorded followed by pigment extraction with 80% acetone and storage at 4 °C overnight. The absorbance at 470.0, 646.8, and 663.2 nm was determined using a spectrophotometer (Agilent 8453 UV-visible Spectroscopy System). Chlorophyll a, chlorophyll b, and carotenoid content were calculated according to Alan [52] using the following formula:
Chlorophyll a content = 12.25A663 − 2.79A646
Chlorophyll b content = 21.5A646 − 5.1A663
Carotenoid content = [(1000A470 − 1.82 Chl a − 85.02 Chl b)] / 198
For RWC, two or three rosette leaves were collected to obtain the minimum fresh weight of 50 mg, and the fresh weight (FW) was determined. Leaves were then placed in 10 mL of distilled water in cups with a lid and kept in the dark at room temperature for 18 h. The turgid weight (TW) was then determined. The leaves were dried at 60 °C for 3 days and weighed for dry weight (DW). The RWC was calculated as (FW-DW)/ (TW-DW) × 100 [47].
For the CMS parameter, two or three rosette leaves from a single plant for one sample were cut and transferred to a centrifuge tube with 10 mL of deionized water in a closed centrifuge tube and shaken overnight at room temperature. The conductivity of the sample solutions (EC0) was measured using an EC meter, and cooled sample solutions were measured again after the leaf tissue was autoclaved (EC1). CMS was calculated according to the formula [48]:
100 − [(EC0/EC1) × 100].

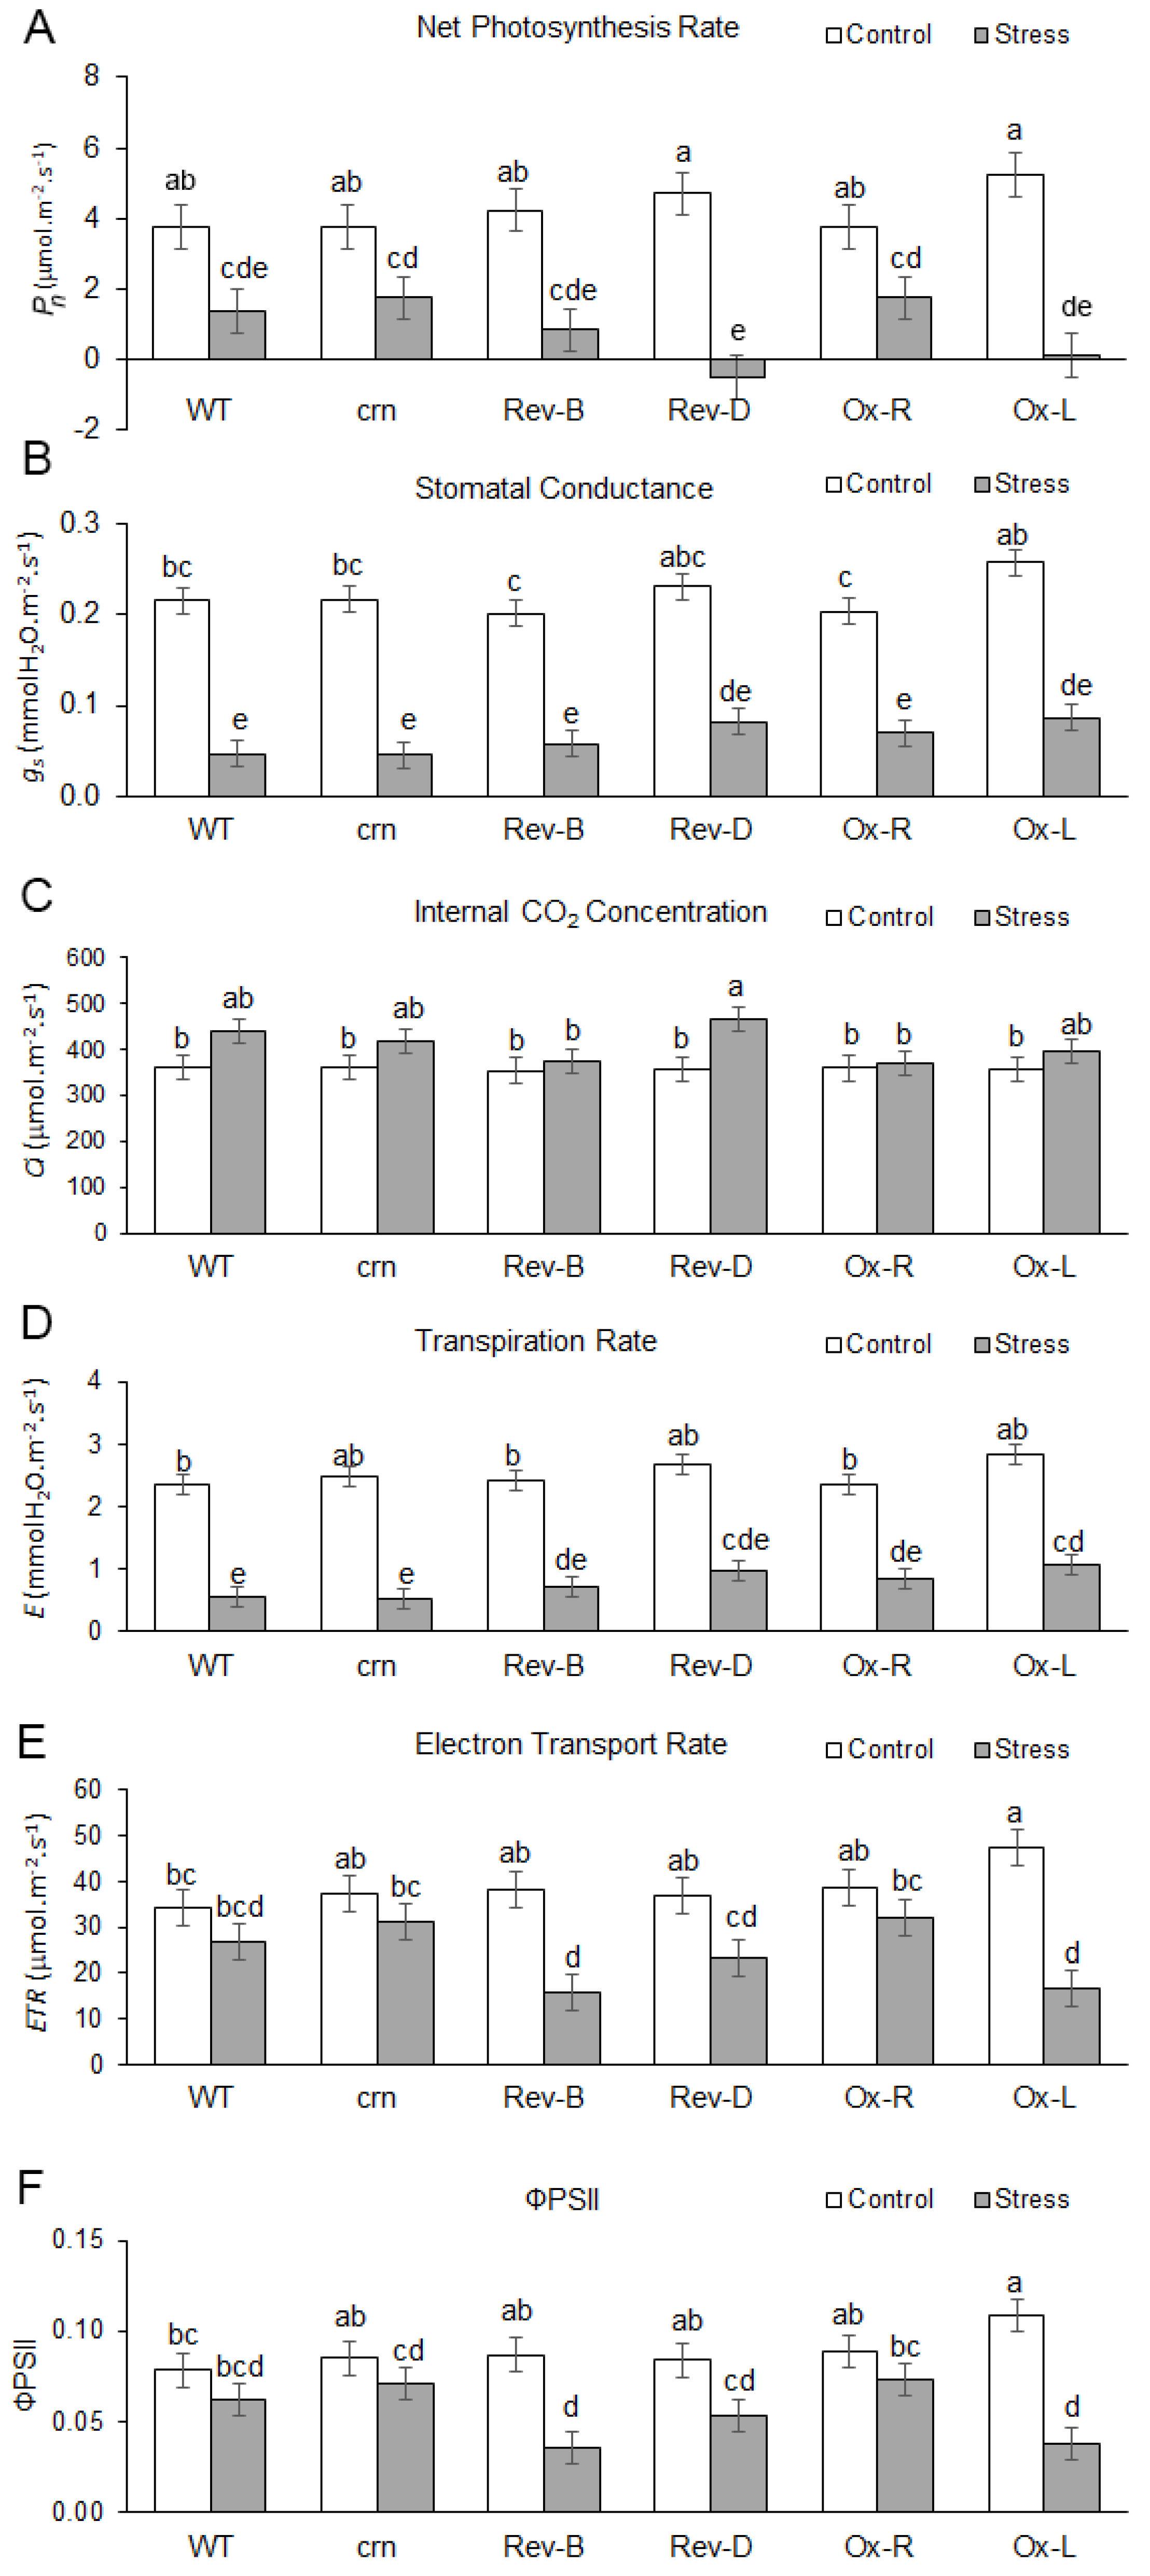
4.3.2. Photosynthesis Performance Comparison of Wild Type (WT), crn Mutant, Complemented Lines, Rev-B and Rev-D, and Ectopic Expression Lines, Ox-R and Ox-L

Wild type (Col-0), mutant line (SALK_030126C), two complemented lines (Rev-B and Rev-D), and two overexpression lines (Ox-R and Ox-L) were used to investigate photosynthesis performance. A randomized complete block design (RCBD) was designed with three replications for control and salt stress conditions with two samples per replicate in each line. Individual plants were grown in 7.5-cm diameter pots for ~4–5 weeks under a 16/8-h light/dark period with 100 mmol.m−2.s−1 light intensity at 21–23 °C. At first visible flower buds, all Arabidopsis plants were treated with or without 350 mM NaCl.
Photosynthetic parameters, net photosynthetic rate (Pn), stomatal conductance (gs), intercellular CO2 concentration (Ci), transpiration rate (E), effective quantum yield of PSII photochemistry (ϕ PSII), and electron transport rate (ETR) were determined in the seventh leaf from the base of the plant after 7 days of treatment using LI-6400XT Portable Photosynthesis (Licor Inc., Lincoln, NE, USA) with a 6400-40 fluorometer (Licor Inc., Lincoln, NE, USA) under conditions of saturated light at 1000 µmol m−2 s−1 with 10% blue light, air CO2 concentration (Ca) at 400 µmol mol−1, chamber block temperature at 23 °C, and relative humidity between 55% and 60%.

4.4. Vector Construction and Transformation

The full-length cDNA of OsCRN from NIAS DNA Bank was amplified using primers containing the restriction sites of NcoI and BstEII (Supplementary Table S4). The PCR reaction conditions were set according to the manufacturer’s protocol (New England Biolabs, USA). The PCR product was purified using a TIANGEN Universal DNA Purification Kit (Tiangen, China). Both PCR products and pCAMBIA1300 vectors were digested with NcoI and BstEII according to the manufacturer’s protocol (New England Biolabs) and then ligated together using T4 ligase (New England Biolab) to obtain the expression vector (pCAMBIA1301_OsCRN).
One hundred nanograms of pCAMBIA1301_OsCRN plasmids were transferred to 50 µL Escherichia coli DH5α by heat shock transformation [53]. The positive clones were submitted for sequencing to obtain the correct sequences of the construct before use in Agrobacterium transformation.

4.5. Agrobacterium Transformation by Freeze Thaw Method

Five hundred nanograms of pCAMBIA1301_OsCRN plasmids were transformed into 50 µL competent Agrobacterium tumefaciens cells by the freeze-thaw method according to Höfgen and Willmitzer [54], and selected on LB agar containing 40 µg/mL gentamycin, 20 µg/mL rifampicin, and 50 µg/mL kanamycin. The positive clones were checked for the presence of plasmids by colony PCR.

4.6. Construction of Transgenic Arabidopsis and Screening of Homozygous T3 Plants

Wild type Arabidopsis and the mutant line were used to generate ectopic expression line(s) and complemented line(s) using the floral dipping method [55] with Agrobacterium tumefaciens conforming to the pCAMBIA1301_OsCRN plasmid. T1 seeds were selected according to the method of Harrison et al. [56]. The existence of the inserted genes was determined using the primers for the hygromycin resistance gene (HygR) and OsCRN, as shown in Supplementary Table S4. All phenotyping experiments were performed using the homozygous T3 plants.

4.7. Gene Expression Analysis of OsCRN under Salt Stress Condition in Rice

4.7.1. Plant Materials and Growth Conditions

Four rice genotypes, ‘Pokkali’, CSSL 16, CSSL 18, and ‘KDML 105′, were grown in WP N0.2 nutrient solution [57]. After germination, 14-day-old seedlings were transplanted into WP N0.2 nutrient solution with and without 75 mM NaCl as salt stress condition and control, respectively. Leaf tissues were collected on days 0, 3, and 6 after treatment for RNA extraction.

4.7.2. RNA Extraction and Gene Expression Analysis

RNA was extracted from leaf tissue using GENEzol™ reagent following the manufacturer’s protocol (Geneaid, Taiwan) and treated with DNase I according to the manufacturer’s protocol (Invitrogen, USA). cDNA synthesis was performed using a cDNA synthesis kit according to the manufacturer’s protocol (Bioneer, Korea). Quantitative RT-PCR was performed using Luna Universal qPCR Master Mix (New England Biolab, USA). The OsCRN gene expression in leaf tissues was determined and OsEF1α was used as a reference gene; the specific primers are listed in Supplementary Table S4. The expression ratio was calculated according to the method by Pfaffl [58]. The formula is given as:
R a t i o = ( E t a r g e t ) Δ C P t a r g e t ( c o n t r o l s a m p l e ) ( E r e f ) Δ C P r e f ( c o n t r o l s a m p l e )

4.8. Statistical Analysis

Statistical analyses in this work were performed using ANOVA analysis of variance test by IBP SPSS ver. 22 (IBM Corp., Armonk, NY, USA), and the mean values were compared by Duncan’s multiple range test at 95% confidence level.

5. Conclusions

We predicted 25 salt-tolerant genes from GWAS of SFW, SDW, RFW, RDW, RWC, and CMS traits in 89 Thai rice cultivars. These genes are located on chromosomes 1, 2, 5, 6, 7, 8, 9, 11, and 12. The OsCRN gene, which is involved in the RNA splicing process, was selected to validate its role in salt tolerance. It was demonstrated that the expression of OsCRN in either WT Arabidopsis or crn mutant line led to the effects on light reaction by the decrease in electron transport rate and quantum yield of PSII. Moreover, OsCRN gene expression in the salt-tolerant cultivars was lower when the plants were subjected to salt stress, which was not detected in the salt-susceptible cultivars. This suggests the role of OsCRN as a negative regulator of salt tolerance in rice.

Supplementary Materials

The following are available online at https://www.mdpi.com/article/10.3390/ijms23031842/s1.

Author Contributions

T.K., T.S., and N.K. performed the experiments and analysis; Rice materials were provided by D.S.-a.; T.K. wrote the original draft and prepared the figures and tables; S.C., T.B., L.C., M.P., and T.K. participated in the database searches and data analyses; S.C., T.B., and L.C. reviewed and edited the manuscript. All authors have read and agreed to the published version of the manuscript.

Funding

This research was funded by an ARDA grant (grant number 2556NRCT51954). T.K. was supported by the 100th Anniversary Chulalongkorn University Fund for Doctoral Scholarship and an Overseas Research Experience Scholarship for Graduate Student, Graduate School, Chulalongkorn University. T.S. was funded by a scholarship from the Graduate school, Chulalongkorn University to commemorate the 72nd anniversary of his Majesty King Bhumibol Adulyadej. N.K. was funded by DPST, Thailand. The collaboration between CEEPP and L.C. is supported by Network Strengthening Fund, PMU B (B16F640103), Thailand.

Institutional Review Board Statement

Not applicable.

Informed Consent Statement

Not applicable.

Data Availability Statement

The authors confirm that data supporting the findings of this study are available in the article and its supplementary materials (Supplementary Tables S1–S4, Supplementary Figures S1–S3). The exome sequence raw data and code used to execute the GWAS are available through direct contact with the corresponding author.

Acknowledgments

We thank Luca Comai’s laboratory and CEEPP members, namely Chakkree Lekklar, Nattaya Tantipirom, Worawat Yuenyong, Thanikarn Udomchalothorn, and Nungruthai Kananont, for their technical support.

Conflicts of Interest

The authors declare no conflict of interest.

References

  1. Papademetriou, M.K. Rice production in the Asia-Pacific region: Issues and perspectives. In Bridging the Rice Yield Gap in the Asia-Pacific Region; Papademetriou, M.K., Dent, F.J., Herath, E.M., Eds.; RAP PUBLICATION: Bangkok, Thailand, 2000; Volume 220, pp. 4–25. [Google Scholar]
  2. Gupta, B.; Huang, B. Mechanism of salinity tolerance in plants: Physiological, biochemical, and molecular characterization. Int. J. Genom. 2014, 2014, 18. [Google Scholar] [CrossRef] [PubMed]
  3. Das, P.; Nutan, K.K.; Singla-Pareek, S.L.; Pareek, A. Understanding salinity responses and adopting ‘omics-based’ approaches to generate salinity tolerant cultivars of rice. Front. Plant Sci. 2015, 6, 712. [Google Scholar] [CrossRef] [PubMed] [Green Version]
  4. Kamran, M.; Parveen, A.; Ahmar, S.; Malik, Z.; Hussain, S.; Chattha, M.S.; Saleem, M.H.; Adil, M.; Heidari, P.; Chen, J.T. An overview of hazardous impacts of soil salinity in crops, tolerance mechanisms, and amelioration through selenium supplementation. Int. J. Mol. Sci. 2019, 21, 148. [Google Scholar] [CrossRef] [PubMed] [Green Version]
  5. Wu, J.; Feng, F.; Lian, X.; Teng, X.; Wei, H.; Yu, H.; Xie, W.; Yan, M.; Fan, P.; Li, Y. Genome-wide association study (GWAS) of mesocotyl elongation based on re-sequencing approach in rice. BMC Plant Biol. 2015, 15, 218. [Google Scholar] [CrossRef] [PubMed] [Green Version]
  6. Huang, X.; Sang, T.; Zhao, Q.; Feng, Q.; Zhao, Y.; Li, C.; Zhu, C.; Lu, T.; Zhang, Z.; Li, M. Genome-wide association studies of 14 agronomic traits in rice landraces. Nat. Genet. 2010, 42, 961–967. [Google Scholar] [CrossRef] [PubMed]
  7. Huang, X.; Zhao, Y.; Li, C.; Wang, A.; Zhao, Q.; Li, W.; Guo, Y.; Deng, L.; Zhu, C.; Fan, D. Genome-wide association study of flowering time and grain yield traits in a worldwide collection of rice germplasm. Nat. Genet. 2012, 44, 32–39. [Google Scholar] [CrossRef] [PubMed]
  8. Kong, W.; Zhang, C.; Zhang, S.; Qiang, Y.; Zhang, Y.; Zhong, H.; Li, Y. Uncovering the novel QTLs and candidate genes of salt tolerance in rice with linkage mapping, RTM-GWAS, and RNA-seq. Rice 2021, 14, 93. [Google Scholar] [CrossRef] [PubMed]
  9. Nayyeripasand, L.; Garoosi, G.A.; Ahmadikhah, A. Genome-wide association study (GWAS) to identify salt-tolerance QTLs carrying novel candidate genes in rice during early vegetative stage. Rice 2021, 14, 9. [Google Scholar] [CrossRef]
  10. Lar, S.M.; Seo, J.; Jang, S.G.; Zhang, H.; Lee, A.R.; Cao, F.Y.; Lee, J.H.; Kim, N.E.; Lee, Y.; Park, Y.J. Genome-wide association study for detecting salt-tolerance loci and candidate genes in rice. Agriculture 2021, 11, 1174. [Google Scholar] [CrossRef]
  11. Le, T.D.; Gathignol, F.; Vu, H.T.; Nguyen, K.L.; Tran, L.H.; Vu, H.T.T.; Dinh, T.X.; Lazennec, F.; Pham, X.H.; Véry, A.A. Genome-wide association mapping of salinity tolerance at the seedling stage in a panel of vietnamese landraces reveals new valuable qtls for salinity stress tolerance breeding in rice. Plants 2021, 10, 1088. [Google Scholar] [CrossRef]
  12. Yadav, A.K.; Kumar, A.; Grover, N.; Ellur, R.K.; Bollinedi, H.; Krishnan, S.G.; Bhowmick, P.K.; Vinod, K.K.; Nagarajan, M.; Singh, A.K. Genome-wide association study reveals marker–trait associations for early vegetative stage salinity tolerance in rice. Plants 2021, 10, 559. [Google Scholar] [CrossRef]
  13. Yuan, J.; Wang, X.; Zhao, Y.; Khan, N.U.; Zhao, Z.; Zhang, Y.; Wen, X.; Tang, F.; Wang, F.; Li, Z. Genetic basis and identification of candidate genes for salt tolerance in rice by GWAS. Sci. Rep. 2020, 10, 9958. [Google Scholar] [CrossRef] [PubMed]
  14. Wang, M.; Jiang, N.; Jia, T.; Leach, L.; Cockram, J.; Waugh, R.; Ramsay, L.; Thomas, B.; Luo, Z. Genome-wide association mapping of agronomic and morphologic traits in highly structured populations of barley cultivars. Theor. Appl. Genet. 2012, 124, 233–246. [Google Scholar] [CrossRef]
  15. Cockram, J.; White, J.; Zuluaga, D.L.; Smith, D.; Comadran, J.; Macaulay, M.; Luo, Z.; Kearsey, M.J.; Werner, P.; Harrap, D. Genome-wide association mapping to candidate polymorphism resolution in the unsequenced barley genome. PNAS 2010, 107, 21611–21616. [Google Scholar] [CrossRef] [Green Version]
  16. Liu, L.; Wang, L.; Yao, J.; Zheng, Y.; Zhao, C. Association mapping of six agronomic traits on chromosome 4A of wheat (Triticum aestivum L.). Mol. Plant Breed. 2010, 1. [Google Scholar] [CrossRef]
  17. Cavanagh, C.R.; Chao, S.; Wang, S.; Huang, B.E.; Stephen, S.; Kiani, S.; Forrest, K.; Saintenac, C.; Brown-Guedira, G.L.; Akhunova, A. Genome-wide comparative diversity uncovers multiple targets of selection for improvement in hexaploid wheat landraces and cultivars. PNAS 2013, 110, 8057–8062. [Google Scholar] [CrossRef] [PubMed] [Green Version]
  18. Shehzad, T.; Iwata, H.; Okuno, K. Genome-wide association mapping of quantitative traits in sorghum (Sorghum bicolor (L.) Moench) by using multiple models. Breed. Sci. 2009, 59, 217–227. [Google Scholar] [CrossRef] [Green Version]
  19. Simko, I.; Pechenick, D.A.; McHale, L.K.; Truco, M.J.; Ochoa, O.E.; Michelmore, R.W.; Scheffler, B.E. Association mapping and marker-assisted selection of the lettuce dieback resistance gene Tvr1. BMC Plant Biol. 2009, 9, 135. [Google Scholar] [CrossRef] [Green Version]
  20. Yan, J.; Warburton, M.; Crouch, J. Association mapping for enhancing maize (Zea mays L.) genetic improvement. Crop Sci. 2011, 51, 433–449. [Google Scholar] [CrossRef]
  21. Li, H.; Peng, Z.; Yang, X.; Wang, W.; Fu, J.; Wang, J.; Han, Y.; Chai, Y.; Guo, T.; Yang, N. Genome-wide association study dissects the genetic architecture of oil biosynthesis in maize kernels. Nat. Genet. 2013, 45, 43–50. [Google Scholar] [CrossRef]
  22. Atwell, S.; Huang, Y.S.; Vilhjálmsson, B.J.; Willems, G.; Horton, M.; Li, Y.; Meng, D.; Platt, A.; Tarone, A.M.; Hu, T.T. Genome-wide association study of 107 phenotypes in Arabidopsis thaliana inbred lines. Nature 2010, 465, 627–631. [Google Scholar] [CrossRef]
  23. Aesomnuk, W.; Ruengphayak, S.; Ruanjaichon, V.; Sreewongchai, T.; Malumpong, C.; Vanavichit, A.; Toojinda, T.; Wanchana, S.; Arikit, S. Estimation of the genetic diversity and population structure of Thailand’s rice landraces using SNP markers. Agronomy 2021, 11, 995. [Google Scholar] [CrossRef]
  24. Lekklar, C.; Pongpanich, M.; Suriya-Arunroj, D.; Chinpongpanich, A.; Tsai, H.; Comai, L.; Chadchawan, S.; Buaboocha, T. Genome-wide association study for salinity tolerance at the flowering stage in a panel of rice accessions from Thailand. BMC Genom. 2019, 20, 76. [Google Scholar] [CrossRef] [PubMed] [Green Version]
  25. Grant, M.; Brown, I.; Adams, S.; Knight, M.; Ainslie, A.; Mansfield, J. The RPM1 plant disease resistance gene facilitates a rapid and sustained increase in cytosolic calcium that is necessary for the oxidative burst and hypersensitive cell death. Plant J. 2000, 23, 441–450. [Google Scholar] [CrossRef]
  26. Feng, J.; Li, J.; Gao, Z.; Lu, Y.; Yu, J.; Zheng, Q.; Yan, S.; Zhang, W.; He, H.; Ma, L. SKIP confers osmotic tolerance during salt stress by controlling alternative gene splicing in Arabidopsis. Mol. Plant 2015, 8, 1038–1052. [Google Scholar] [CrossRef] [Green Version]
  27. Chutimanukul, P.; Kositsup, B.; Plaimas, K.; Buaboocha, T.; Siangliw, M.; Toojinda, T.; Comai, L.; Chadchawan, S. Photosynthetic responses and identification of salt tolerance genes in a chromosome segment substitution line of ‘Khao Dawk Mali 105′ rice. Environ. Exp. Bot. 2018, 155, 497–508. [Google Scholar] [CrossRef]
  28. Chutimanukul, P.; Kositsup, B.; Plaimas, K.; Buaboocha, T.; Siangliw, M.; Toojinda, T.; Comai, L.; Chadchawan, S. Data in support of photosynthetic responses in a chromosome segment substitution line of ‘Khao Dawk Mali 105′rice at seedling stage. Data Brief 2018, 21, 307–312. [Google Scholar] [CrossRef] [PubMed]
  29. Chutimanukul, P.; Kositsup, B.; Plaimas, K.; Siangliw, M.; Toojinda, T. Effect of salt stress on antioxidant enzyme activity and hydrogen peroxide content in chromosome segment substitution line of ‘Khao Dawk Mali 105′rice. ANRES 2019, 53, 465–471. [Google Scholar]
  30. Khrueasan, N.; Chutimanukul, P.; Plaimas, K.; Buaboocha, T.; Siangliw, M.; Toojinda, T.; Comai, L.; Chadchawan, S. Comparison between the transcriptomes of ‘KDML105’rice and a salt-tolerant chromosome segment substitution line. Genes 2019, 10, 742. [Google Scholar] [CrossRef] [Green Version]
  31. Xu, P.; Guo, Q.; Meng, S.; Zhang, X.; Xu, Z.; Guo, W.; Shen, X. Genome-wide association analysis reveals genetic variations and candidate genes associated with salt tolerance related traits in Gossypium hirsutum. BMC Genom. 2021, 22, 26. [Google Scholar] [CrossRef]
  32. Li, H.; Yue, H.; Li, L.; Liu, Y.; Zhang, H.; Wang, J.; Jiang, X. Seed biostimulant Bacillus sp. MGW9 improves the salt tolerance of maize during seed germination. AMB Express 2021, 11, 74. [Google Scholar] [CrossRef] [PubMed]
  33. Huqe, M.A.S.; Haque, M.S.; Sagar, A.; Uddin, M.N.; Hossain, M.A.; Hossain, A.; Rahman, M.M.; Wang, X.; Al-Ashkar, I.; Ueda, A. Characterization of maize hybrids (Zea mays L.) for detecting salt tolerance based on morpho-physiological characteristics, ion accumulation and genetic variability at early vegetative stage. Plants 2021, 10, 2549. [Google Scholar] [CrossRef] [PubMed]
  34. Ur Rahman, S.; Basit, A.; Ara, N.; Ullah, I. Morpho-physiological responses of tomato genotypes under saline conditions. Gesunde Pflanz 2021, 73, 541–553. [Google Scholar] [CrossRef]
  35. Quan, X.; Liang, X.; Li, H.; Xie, C.; He, W.; Qin, Y. Identification and characterization of wheat germplasm for salt tolerance. Plants 2021, 10, 268. [Google Scholar] [CrossRef] [PubMed]
  36. Hannachi, S.; Werbrouck, S.; Bahrini, I.; Abdelgadir, A.; Siddiqui, H.A.; Van Labeke, M.C. Obtaining salt stress-tolerant eggplant somaclonal variants from in vitro selection. Plants 2021, 10, 2539. [Google Scholar] [CrossRef]
  37. Farooq, S.; Azam, F. The use of cell membrane stability (CMS) technique to screen for salt tolerant wheat varieties. J. Plant Physiol. 2006, 163, 629–637. [Google Scholar] [CrossRef] [PubMed]
  38. Ahamadi, J.; Fotokian, M.H. Identification and mapping of quantitative trait loci associated with salinity tolerance in rice (Oryza sativa) using ssr markers. Iran. J. Biotechnol. 2011, 9, 1. [Google Scholar]
  39. Shiu, S.H.; Karlowski, W.M.; Pan, R.; Tzeng, Y.H.; Mayer, K.F.; Li, W.H. Comparative analysis of the receptor-like kinase family in Arabidopsis and rice. Plant Cell 2004, 16, 1220–1234. [Google Scholar] [CrossRef] [Green Version]
  40. Yang, T.; Chaudhuri, S.; Yang, L.; Chen, Y.; Poovaiah, B.W. Calcium/calmodulin up-regulates a cytoplasmic receptor-like kinase in plants. J. Biol. Chem. 2004, 279, 42552–42559. [Google Scholar] [CrossRef] [Green Version]
  41. Vij, S.; Giri, J.; Dansana, P.K.; Kapoor, S.; Tyagi, A.K. The receptor-like cytoplasmic kinase (OsRLCK) gene family in rice: Organization, phylogenetic relationship, and expression during development and stress. Mol. Plant 2008, 1, 732–750. [Google Scholar] [CrossRef]
  42. Sonsungsan, P.; Chantanakool, P.; Suratanee, A.; Buaboocha, T.; Comai, L.; Chadchawan, S.; Plaimas, K. Identification of key genes in ‘Luang Pratahn’, thai salt-tolerant rice, based on time-course data and weighted co-expression networks. Front. Plant Sci. 2021, 12, 744654. [Google Scholar] [CrossRef] [PubMed]
  43. Chintakovid, N.; Maipoka, M.; Phaonakrop, N.; Mickelbart, M.V.; Roytrakul, S.; Chadchawan, S. Proteomic analysis of drought-responsive proteins in rice reveals photosynthesis-related adaptations to drought stress. Acta Physiol. Plant. 2017, 39, 240. [Google Scholar] [CrossRef]
  44. Kumar, A. Development and characterization of rice genotypes for water use effciency and drought resistance. Doctoral Dissertation, University of Arkansas, Fayetteville, AR, USA, 2017. [Google Scholar]
  45. Khrueasan, N.; Siangliw, M.; Toojinda, T.; Imyim, A.; Buaboocha, T.; Chadchawan, S. Physiological mechanisms of the seedling stage salt tolerance of near isogenic rice lines with the’KDML105’genetic background. Int. J. Agric. Biol. 2020, 23, 927–934. [Google Scholar]
  46. Chutimanukul, P.; Saputro, T.B.; Mahaprom, P.; Plaimas, K.; Comai, L.; Buaboocha, T.; Siangliw, M.; Toojinda, T.; Chadchawan, S. Combining genome and gene co-expression network analyses for the identification of genes potentially regulating salt tolerance in rice. Front. Plant Sci. 2021, 12, 704549. [Google Scholar] [CrossRef]
  47. Pieczynski, M.; Marczewski, W.; Hennig, J.; Dolata, J.; Bielewicz, D.; Piontek, P.; Wyrzykowska, A.; Krusiewicz, D.; Strzelczyk-Zyta, D.; Konopka-Postupolska, D. Down-regulation of CBP 80 gene expression as a strategy to engineer a drought-tolerant potato. Plant Biotechnol. J. 2013, 11, 459–469. [Google Scholar] [CrossRef] [PubMed]
  48. Blum, A.; Ebercon, A. Cell membrane stability as a measure of drought and heat tolerance in wheat. Crop Sci. 1981, 21, 43–47. [Google Scholar] [CrossRef]
  49. Zhou, X.; Stephens, M. Genome-wide efficient mixed-model analysis for association studies. Nat. Genet. 2012, 44, 821–824. [Google Scholar] [CrossRef] [Green Version]
  50. Zhou, X.; Stephens, M. Efficient multivariate linear mixed model algorithms for genome-wide association studies. Nat. Methods 2014, 11, 407–409. [Google Scholar] [CrossRef]
  51. Turner, S.D. qqman: An R package for visualizing GWAS results using QQ and manhattan plots. Biorxiv 2014, 005165. [Google Scholar]
  52. Alan, R. The spectral determination of chlorophyll a and b, as well as total carotenoids, using various solvents with spectrophotometers of different resolution. Plant Physiol. 1994, 144, 307–313. [Google Scholar]
  53. Froger, A.; Hall, J.E. Transformation of plasmid DNA into E. coli using the heat shock method. J. Vis. Exp. 2007, 6, 253. [Google Scholar] [CrossRef] [PubMed]
  54. Höfgen, R.; Willmitzer, L. Storage of competent cells for Agrobacterium transformation. Nucleic Acids Res. 1988, 16, 9877. [Google Scholar] [CrossRef] [Green Version]
  55. Clough, S.J.; Bent, A.F. Floral dip: A simplified method for Agrobacterium-mediated transformation of Arabidopsis thaliana. Plant J. 1998, 16, 735–743. [Google Scholar] [CrossRef] [PubMed] [Green Version]
  56. Harrison, S.J.; Mott, E.K.; Parsley, K.; Aspinall, S.; Gray, J.C.; Cottage, A. A rapid and robust method of identifying transformed Arabidopsis thaliana seedlings following floral dip transformation. Plant Methods 2006, 2, 19. [Google Scholar] [CrossRef] [PubMed] [Green Version]
  57. Vajrabhaya, M.; Vajrabhaya, T. Somaclonal variation for salt tolerance in rice. In Rice; Springer: Berlin/Heidelberg, Germany, 1991; pp. 368–382. [Google Scholar]
  58. Pfaffl, M.W. A new mathematical model for relative quantification in real-time RT–PCR. Nucleic Acids Res. 2001, 29, e45. [Google Scholar] [CrossRef] [PubMed]
Figure 1. Correlations among phenotypic traits, such as shoot fresh weight (S_SFW), shoot dry weight (S_SDW), root fresh weight (S_RFW), root dry weight (S_RDW), relative water content (S_RWC), and cell membrane stability (S_CMS) under salt stress condition, including the stability index (SI).
Ijms 23 01842 g001
Figure 2. Manhattan plots demonstrating the genome-wide association between SNPs and salt responsive phenotypes based on shoot fresh weight (SFW) (A), shoot dry weight (SDW) (B), root fresh weight (RFW) (C), root dry weight (RDW) (D), and cell membrane stability (CMS) (E). Some loci with significant SNPs were indicated in Manhattan plots.
Ijms 23 01842 g002
Figure 3. Manhattan plots demonstrating the genome-wide association between SNPs and stability index of salt responsive phenotypes based on shoot fresh weight (SI_SFW) (A), shoot dry weight (SI_SDW) (B), root fresh weight (SI_RFW) (C), root dry weight (SI_RDW) (D), and cell membrane stability (SI_CMS) (E). Some loci with significant SNPs are indicated in Manhattan plots.
Ijms 23 01842 g003
Figure 4. The location of the causative genes predicted by GWAS in a Thai rice seedling population. For comparison, known salt-tolerant quantitative trait loci (ST-QTLs) are indicated by the colored bands on the left of the chromosomes with the associated chromosomal markers.
Ijms 23 01842 g004
Figure 5. The phenotypes of crn mutant compared with wild type (WT). Seven-day-old seedlings were grown in MS medium supplemented with 100 mM NaCl for 7 days or 4-week-old soil-grown plants supplemented with 350 mM NaCl for 6 days (A). Fresh weight (B), relative water content (RWC) percentage (6 days after salt stress treatment) (C), and cell membrane stability (CMS) (9 days after salt stress treatment) (D) were compared between plants grown in the normal condition and salt stress (350 mM NaCl) condition. Error bars represent standard error. The different letters above the bar graph indicate the significant difference between means by DMRT analysis at p < 0.05.
Ijms 23 01842 g005
Figure 6. Photosynthetic pigment content, Chl a (A), Chl b (B), and carotenoid (C) in 4-week-old soil-grown WT and crn mutant, treated for 6 days. Error bars represent standard error. The different letters above the bar graph indicate the significant difference between mean by DMRT analysis at p < 0.05.
Ijms 23 01842 g006
Figure 7. Photosynthesis performance of WT, crn mutant, the complemented lines by the expression of OsCRN gene, Rev-B and Rev-D, and the ectopic expression line of OsCRN gene in the WT genetic background, Ox-R and Ox-L. The photosynthesis performance is shown with the net photosynthesis rate or Pn (A), stomatal conductance or gs (B), internal CO2 concentration or Ci (C), transpiration rate or E (D), electron transport rate or ETR (E), and quantum yield of PSII or φPSII (F). The different letters above the bar graph indicate the significant difference between mean by DMRT analysis at p < 0.05.
Ijms 23 01842 g007
Figure 8. OsCRN gene expression in salt-tolerant standard cultivar, ‘Pokkali’ (A), Thai elite cultivar (more susceptible to salt stress), ‘KDML105’ (B), and the two chromosome substitution lines with ‘KDML105’ genetic background, CSSL16 (C) and CSSL18 (D). OsEF1α was used as the internal control.
Ijms 23 01842 g008
Table 1. Phenotypic values of growth parameters: shoot fresh weight (SFW), shoot dry weight (SDW), root fresh weight (RFW), root dry weight (RDW), relative water content (RWC), and cell membrane stability (CMS) under normal and salt stress conditions. The stability index (SI) and % changes due to salt stress are also shown.
TraitsNormalSalt StressStability Index% Change
SFW (g/plant)1.07 ± 0.470.80 ± 0.360.77 ± 0.22−23.43 ± 21.90
SDW (g/plant)0.15 ± 0.060.11 ± 0.040.73 ± 0.20−45.38 ± 19.77
RFW (g/plant)0.91 ± 0.270.48 ± 0.180.55 ± 0.20−27.42 ± 19.67
RDW (g/plant)0.11 ± 0.040.06 ± 0.020.53 ± 0.19−46.55 ± 19.24
RWC (%)90.48 ± 4.2283.91 ± 10.480.93 ± 0.12−7.13 ± 11.95
CMS (%)94.96 ± 2.2978.40 ± 10.550.83 ± 0.11−17.39 ± 11.40
Table 2. List of causative genes obtained from GWAS.
TraitSNPs
Position
p_WaldLocusGene NameDescription
1SI_SFW19993907.86 × 10−9LOC_Os01g04490Ser/Thr protein kinaseprotein modification process, kinase activity
2S_SFW201460317.08 × 10−8LOC_Os01g36330expressed protein-
3SI_SFW224551277.86 × 10−9LOC_Os02g37140expressed protein-
4SI_SFW231133567.86 × 10−9LOC_Os02g38210elongation factor Tutranslation factor activity and hydrolase activity
5S_RFW126019582.52 × 10−7LOC_Os05g22260crooked neck, putativenucleic acid metabolic process, binding
6SI_SFW10484621.46 × 10−8LOC_Os06g02850expressed protein-
10484631.46 × 10−8
7SI_SFW13616871.46 × 10−8LOC_Os06g03520DUF581 domain-containing protein-
8S_CMS245105737.54 × 10−8LOC_Os06g41040pentatricopeptide-
SI_CMS245105732.3 × 10−7
9S_CMS245169776.75 × 10−8LOC_Os06g41050expressed proteinresponse to abiotic stimulus, DNA metabolic process, cell cycle, reproduction
S_CMS245170762.51 × 10−7
SI_CMS245169772.4 × 10−7
10S_CMS245772872.51 × 10−7LOC_Os06g41110tubulin binding cofactor Cinvolve in the folding and assembly of α- and β-tubulin monomers
11S_CMS246280132.51 × 10−7LOC_Os06g41160expressed proteincarbohydrate metabolic process, metabolic process
246284942.51 × 10−7
12S_RFW211511872.52 × 10−7LOC_Os07g35350glucan endo-1,3-beta-glucosidase precursorcarbohydrate metabolic process, hydrolase activity
13S_RFW213651532.52 × 10−7LOC_Os07g35660DUF26 kinaseskinase activity, protein modification process
14SI_RDW60568978.8 × 10−8LOC_Os08g10340OsFBX278–F-box domain-containing protein-
60569628.8 × 10−8
15RDW223176509.82 × 10−9LOC_Os09g38850OsWAK91–OsWAK receptor-like protein kinasekinase activity, protein binding
16SI_SFW170491267.86 × 10−9LOC_Os11g29380MCM2–Putative minichromosome maintenance MCM complex subunit 2multicellular organismal development and embryo development
17SI_SFW170654817.86 × 10−9LOC_Os11g294006-phosphogluconate dehydrogenasecatalytic activity
18SI_SFW171308887.86 × 10−9LOC_Os11g29520NBS-LRR disease resistance proteinprotein binding, response to stress
19SI_RDW179533228.8 × 10−8LOC_Os11g30830expressed proteintransferase activity, response to endogenous stimulus
20SI_RDW191670049.7 × 10−9LOC_Os11g32470NEF1response to water deprivation
21SI_SFW225023317.86 × 10−9LOC_Os11g37950WIP3–Wound-induced protein precursorprotein and carbohydrate binding, response to abiotic and biotic stress
22SFW272450407.08 × 10−9LOC_Os11g44990NB-ARC domain-containing proteinprotein binding, response to stress
272450517.08 × 10−8
23SI_RDW180097879.7 × 10−9LOC_Os12g30070disease resistance protein RPM1trigger plants defense systems against biotic stress
24SFW221276337.08 × 10−8LOC_Os12g36100kinesin-4nucleotide binding, motor activity
25RFW232678372.52 × 10−7LOC_Os12g37860expressed proteinregulation of gene expression, epigenetic
Publisher’s Note: MDPI stays neutral with regard to jurisdictional claims in published maps and institutional affiliations.

