
Fluoxetine Enhances Synaptic Vesicle Trafficking and Energy Metabolism in the Hippocampus of Socially Isolated Rats

Abstract
:1. Introduction
2. Results
2.1. Differential Proteomics Analysis
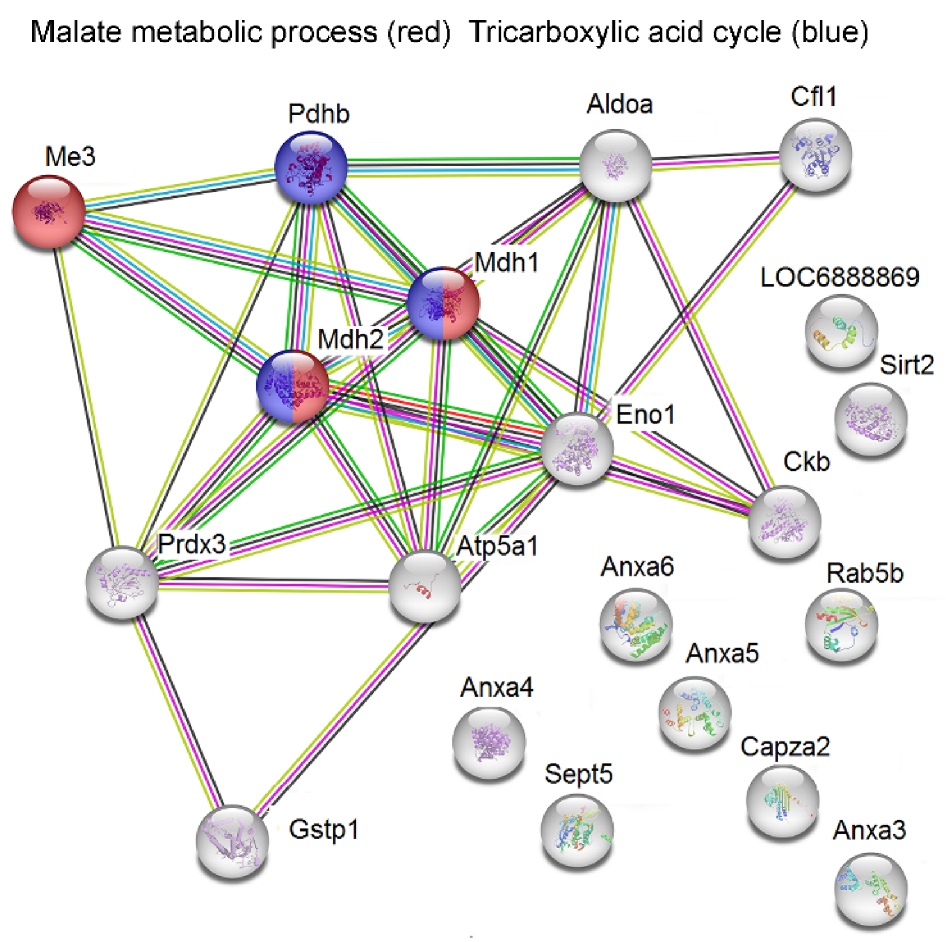
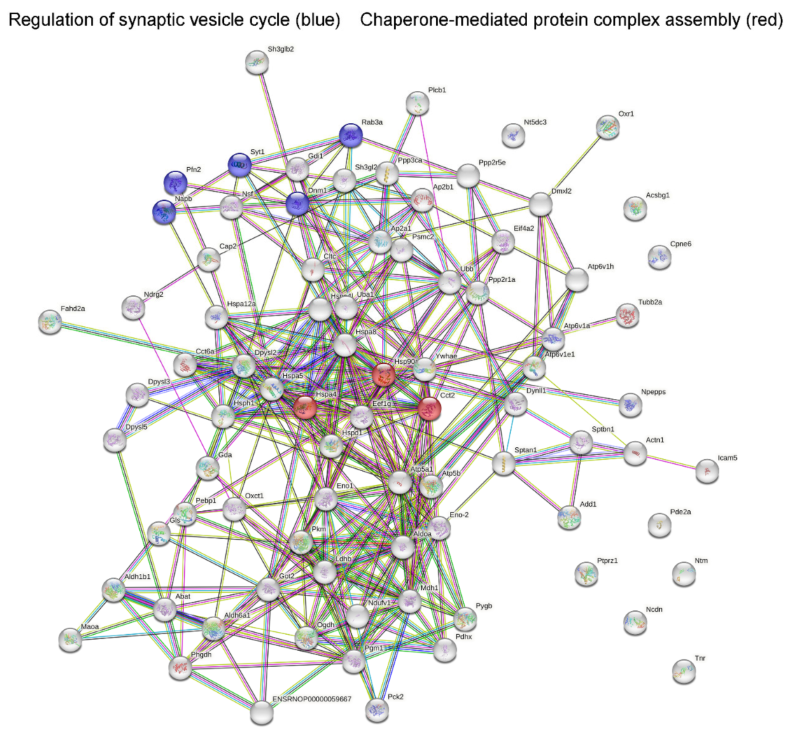
2.2. Analysis of Protein–Protein Network Interaction by STRING
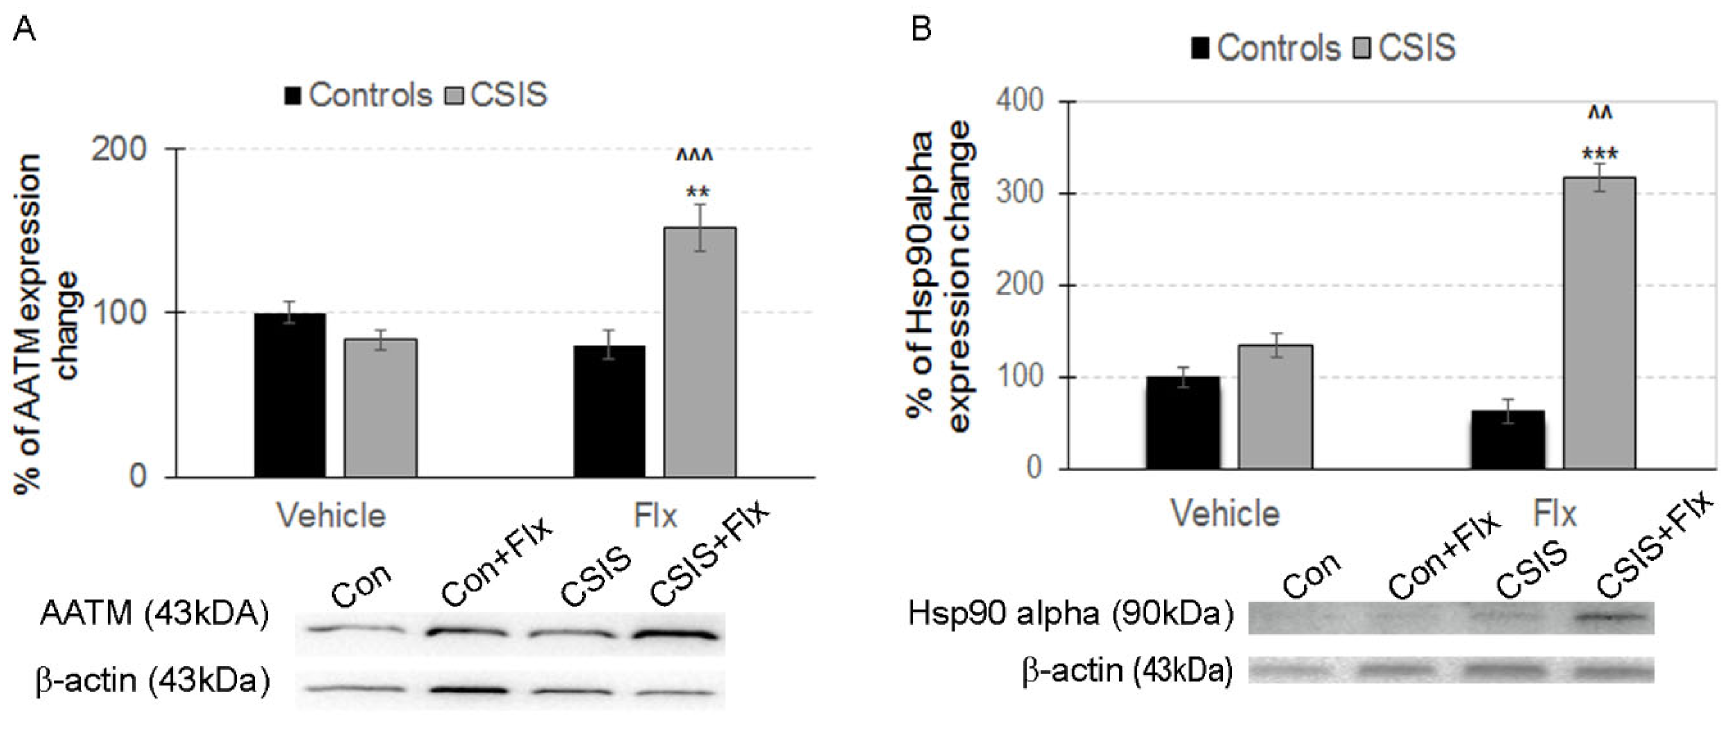
2.3. Western Blot Analysis
3. Discussion
Limitation
4. Materials and Methods
4.1. Animals
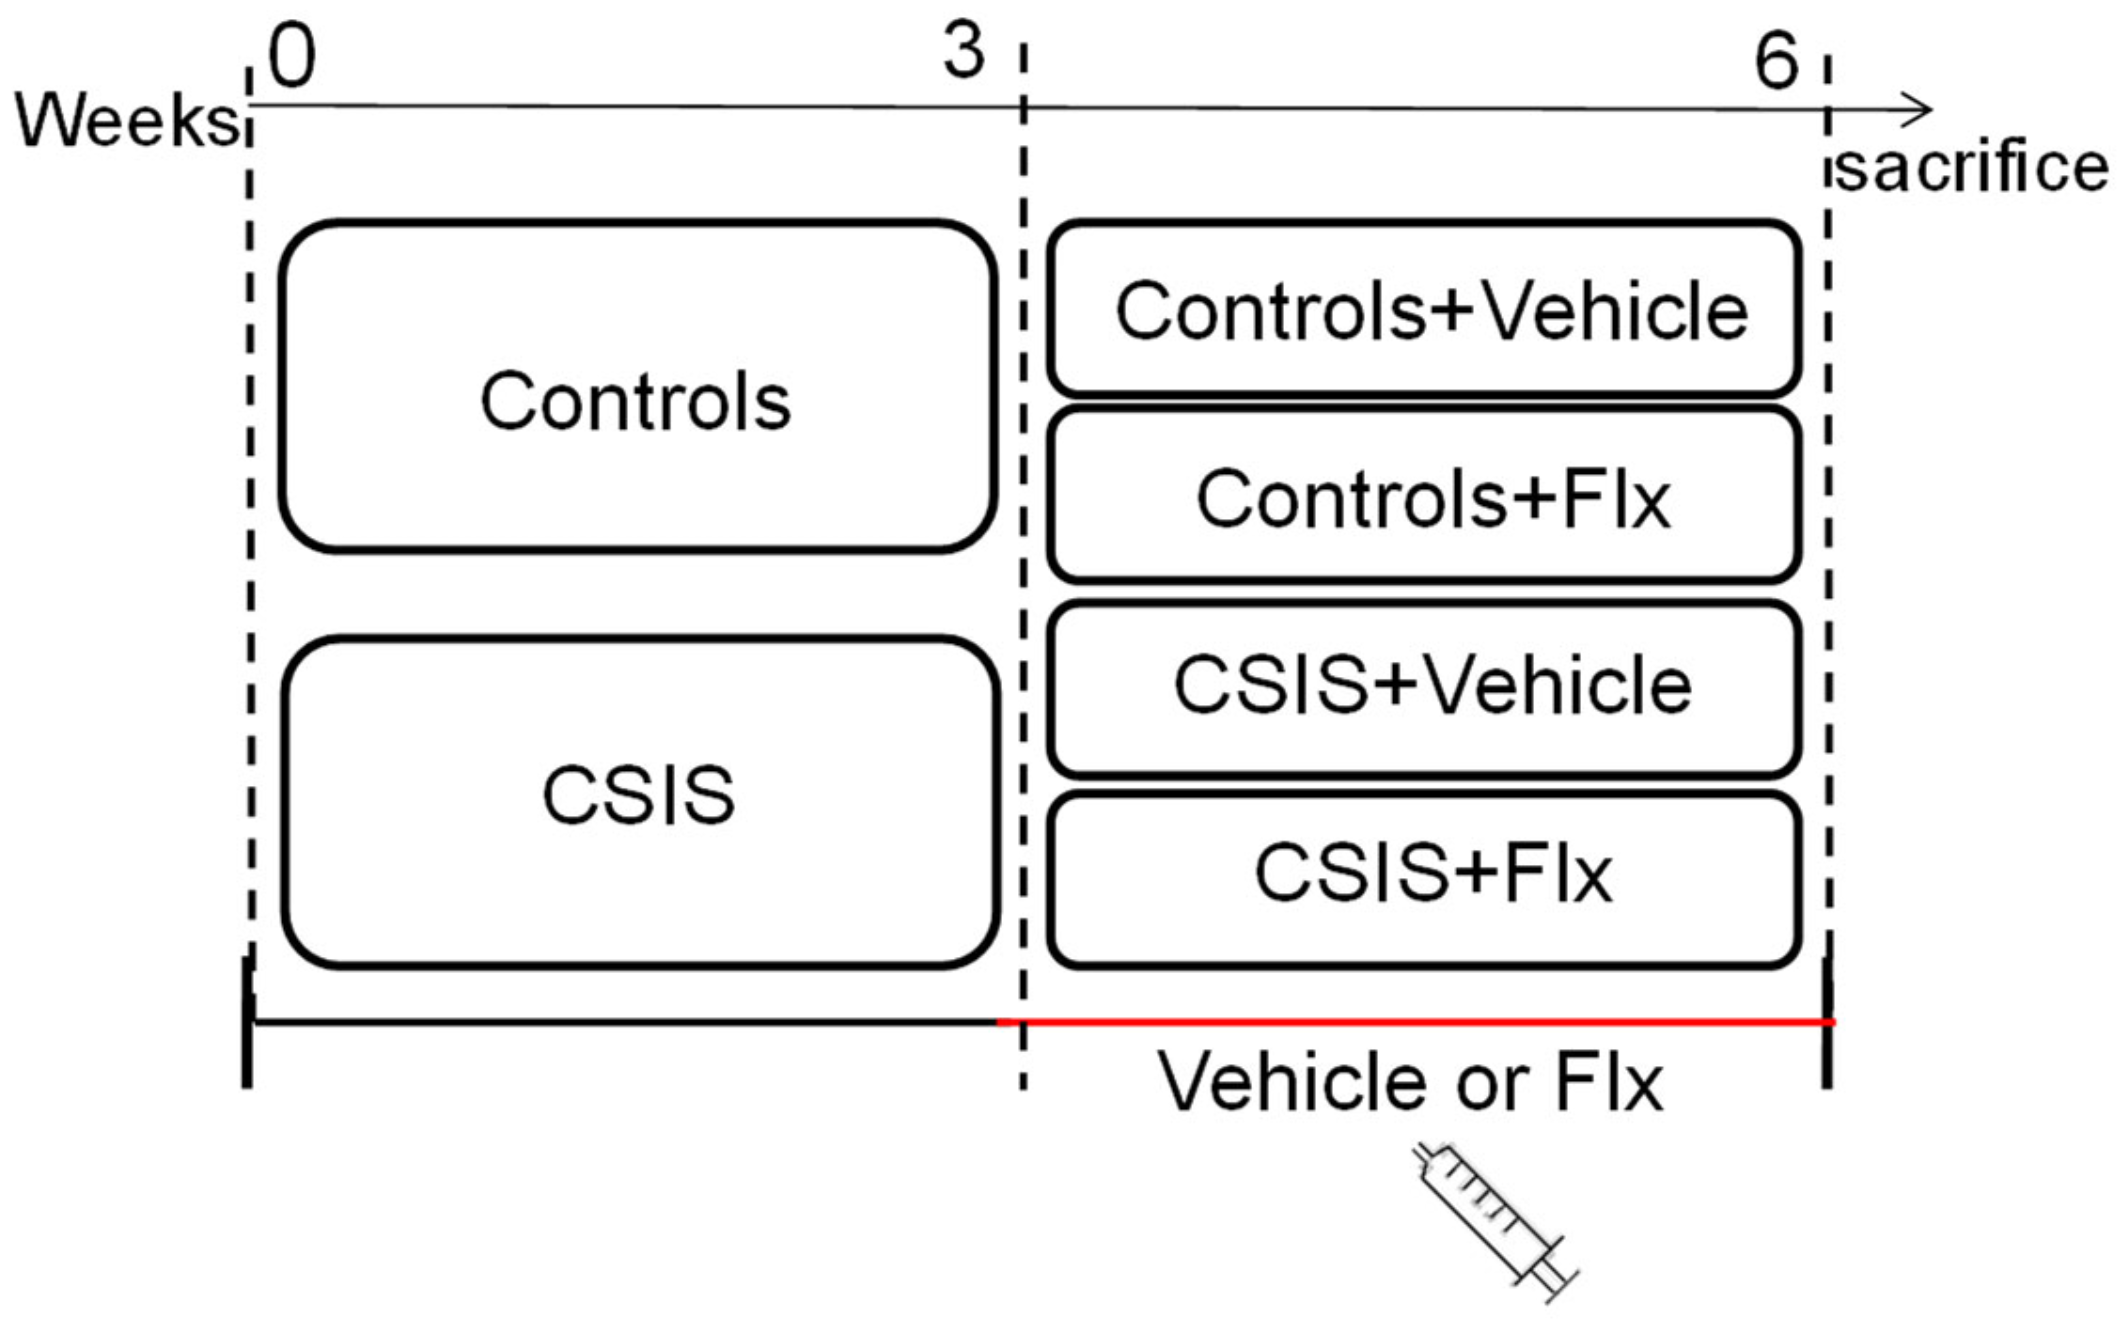
4.2. Study Design
4.3. Fluoxetine-Hydrochloride Administration
4.4. Preparation of Synaptosomal Fractions from the Rat Hippocampus
4.5. Electrophoresis, In-Gel Digestion and LC-MS/MS
4.6. Western Blot Validation of the Proteomic Results
4.7. Bioinformatics and Statistical Analysis
5. Conclusions
Supplementary Materials
Author Contributions
Funding
Institutional Review Board Statement
Informed Consent Statement
Data Availability Statement
Acknowledgments
Conflicts of Interest
References
- Bansal, Y.; Kuhad, A. Mitochondrial Dysfunction in Depression. Curr. Neuropharmacol. 2016, 14, 610–618. [Google Scholar] [CrossRef] [PubMed] [Green Version]
- Duman, R.S.; Aghajanian, G.K. Synaptic Dysfunction in Depression: Potential Therapeutic Targets. Science 2012, 338, 68–72. [Google Scholar] [CrossRef] [PubMed] [Green Version]
- Morgese, M.G.; Trabace, L. Monoaminergic System Modulation in Depression and Alzheimer’s Disease: A New Standpoint? Front. Pharmacol. 2019, 10, 483. [Google Scholar] [CrossRef] [PubMed] [Green Version]
- Zou, W.J.; Song, Y.L.; Wu, M.Y.; Chen, X.T.; You, Q.L.; Yang, Q.; Luo, Z.Y.; Huang, L.; Kong, Y.; Feng, J.; et al. A Discrete Serotonergic Circuit Regulates Vulnerability to Social Stress. Nat. Commun. 2020, 11, 4218. [Google Scholar] [CrossRef] [PubMed]
- Luscher, B.; Shen, Q.; Sahir, N. The GABAergic Deficit Hypothesis of Major Depressive Disorder. Mol. Psychiatry 2011, 16, 383–406. [Google Scholar] [CrossRef] [Green Version]
- Perić, I.; Stanisavljević, A.; Gass, P.; Filipović, D. Fluoxetine Exerts Subregion/Layer Specific Effects on Parvalbumin/GAD67 Protein Expression in the Dorsal Hippocampus of Male Rats Showing Social Isolation-Induced Depressive-like Behaviour. Brain Res. Bull. 2021, 173, 174–183. [Google Scholar] [CrossRef]
- Tornese, P.; Sala, N.; Bonini, D.; Bonifacino, T.; La Via, L.; Milanese, M.; Treccani, G.; Seguini, M.; Ieraci, A.; Mingardi, J.; et al. Chronic Mild Stress Induces Anhedonic Behavior and Changes in Glutamate Release, BDNF Trafficking and Dendrite Morphology Only in Stress Vulnerable Rats. The Rapid Restorative Action of Ketamine. Neurobiol. Stress 2019, 10, 100160. [Google Scholar] [CrossRef]
- Eisch, A.J.; Petrik, D. Depression and Hippocampal Neurogenesis: A Road to Remission? Science 2012, 338, 72–75. [Google Scholar] [CrossRef] [Green Version]
- Allen, J.; Romay-Tallon, R.; Brymer, K.J.; Caruncho, H.J.; Kalynchuk, L.E. Mitochondria and Mood: Mitochondrial Dysfunction as a Key Player in the Manifestation of Depression. Front. Neurosci. 2018, 12, 386. [Google Scholar] [CrossRef]
- Zuccoli, G.S.; Saia-Cereda, V.M.; Nascimento, J.M.; Martins-de-Souza, D. The Energy Metabolism Dysfunction in Psychiatric Disorders Postmortem Brains: Focus on Proteomic Evidence. Front. Neurosci. 2017, 11, 493. [Google Scholar] [CrossRef]
- Vos, M.; Lauwers, E.; Verstreken, P. Synaptic Mitochondria in Synaptic Transmission and Organization of Vesicle Pools in Health and Disease. Front. Synaptic Neurosci. 2010, 2, 139. [Google Scholar] [CrossRef] [Green Version]
- Wagner, G.A. Treatment of Depression in Older Adults beyond Fluoxetine. Rev. Saude Publica 2015, 49, 20. [Google Scholar] [CrossRef]
- Casarotto, P.C.; Girych, M.; Fred, S.M.; Kovaleva, V.; Moliner, R.; Enkavi, G.; Biojone, C.; Cannarozzo, C.; Sahu, M.P.; Kaurinkoski, K.; et al. Antidepressant Drugs Act by Directly Binding to TRKB Neurotrophin Receptors. Cell 2021, 184, 1299–1313.e19. [Google Scholar] [CrossRef]
- Park, H.; Poo, M.M. Neurotrophin Regulation of Neural Circuit Development and Function. Nat. Rev. Neurosci. 2013, 14, 7–23. [Google Scholar] [CrossRef]
- Popova, D.; Castr En, E.; Taira, T. Chronic Fluoxetine Administration Enhances Synaptic Plasticity and Increases Functional Dynamics in Hippocampal CA3-CA1 Synapses. Neuropharmacology 2017, 126, 250–256. [Google Scholar] [CrossRef] [Green Version]
- Filipović, D.; Costina, V.; Perić, I.; Stanisavljević, A.; Findeisen, P. Chronic Fluoxetine Treatment Directs Energy Metabolism towards the Citric Acid Cycle and Oxidative Phosphorylation in Rat Hippocampal Nonsynaptic Mitochondria. Brain Res. 2017, 1659, 41–54. [Google Scholar] [CrossRef]
- Khawaja, X.; Xu, J.; Liang, J.-J.; Barrett, J.E. Proteomic Analysis of Protein Changes Developing in Rat Hippocampus after Chronic Antidepressant Treatment: Implications for Depressive Disorders and Future Therapies. J. Neurosci. Res. 2004, 75, 451–460. [Google Scholar] [CrossRef]
- Racagni, G.; Popoli, M. Cellular and Molecular Mechanisms in the Long-Term Action of Antidepressants. Dialogues Clin. Neurosci. 2008, 10, 385–400. [Google Scholar] [CrossRef]
- Famitafreshi, H.; Karimian, M.; Fanaei, H.; Attari, F.; Fatima, S. Social Isolation Is Associated with Reduced Neurogenesis, Impaired Spatial Working Memory Performance, and Altered Anxiety Levels in Male Rats. Open Access Anim. Physiol. 2015, 7, 87–95. [Google Scholar] [CrossRef] [Green Version]
- Zlatković, J.; Todorović, N.; Bošković, M.; Pajović, S.B.; Demajo, M.; Filipović, D. Different Susceptibility of Prefrontal Cortex and Hippocampus to Oxidative Stress Following Chronic Social Isolation Stress. Mol. Cell. Biochem. 2014, 393, 43–57. [Google Scholar] [CrossRef]
- Filipović, D.; Todorović, N.; Bernardi, R.E.; Gass, P. Oxidative and Nitrosative Stress Pathways in the Brain of Socially Isolated Adult Male Rats Demonstrating Depressive- and Anxiety-like Symptoms. Brain Struct. Funct. 2017, 222, 1–20. [Google Scholar] [CrossRef] [PubMed]
- Mumtaz, F.; Khan, M.I.; Zubair, M.; Dehpour, A.R. Neurobiology and Consequences of Social Isolation Stress in Animal Model-A Comprehensive Review. Biomed. Pharmacother. 2018, 105, 1205–1222. [Google Scholar] [CrossRef]
- Perić, I.; Stanisavljević, A.; Gass, P.; Filipović, D. Fluoxetine Reverses Behavior Changes in Socially Isolated Rats: Role of the Hippocampal GSH-Dependent Defense System and Proinflammatory Cytokines. Eur. Arch. Psychiatry Clin. Neurosci. 2017, 267, 737–749. [Google Scholar] [CrossRef] [PubMed]
- Perić, I.; Costina, V.; Stanisavljević, A.; Findeisen, P.; Filipović, D. Proteomic Characterization of Hippocampus of Chronically Socially Isolated Rats Treated with Fluoxetine: Depression-like Behaviour and Fluoxetine Mechanism of Action. Neuropharmacology 2018, 135, 268–283. [Google Scholar] [CrossRef] [PubMed]
- Filipović, D.; Novak, B.; Xiao, J.; Yan, Y.; Yeoh, K.; Turck, C.W. Chronic Fluoxetine Treatment of Socially Isolated Rats Modulates Prefrontal Cortex Proteome. Neuroscience 2022, 501, 52–71. [Google Scholar] [CrossRef] [PubMed]
- Bai, F.; Witzmann, F.A. Synaptosome Proteomics. Subcell. Biochem. 2007, 43, 77–98. [Google Scholar] [CrossRef] [Green Version]
- Marsden, W.N. Synaptic Plasticity in Depression: Molecular, Cellular and Functional Correlates. Prog. Neuro-Psychopharmacol. Biol. Psychiatry 2013, 43, 168–184. [Google Scholar] [CrossRef]
- Duman, R.S.; Aghajanian, G.K.; Sanacora, G.; Krystal, J.H. Synaptic Plasticity and Depression: New Insights from Stress and Rapid-Acting Antidepressants. Nat. Med. 2016, 22, 238–249. [Google Scholar] [CrossRef] [Green Version]
- Hensler, J.G. Serotonergic Modulation of the Limbic System. Neurosci. Biobehav. Rev. 2006, 30, 203–214. [Google Scholar] [CrossRef]
- Rossetti, T.; Banerjee, S.; Kim, C.; Leubner, M.; Lamar, C.; Gupta, P.; Lee, B.; Neve, R.; Lisman, J. Memory Erasure Experiments Indicate a Critical Role of CaMKII in Memory Storage. Neuron 2017, 96, 207.e2–216.e2. [Google Scholar] [CrossRef]
- Barria, A.; Muller, D.; Derkach, V.; Griffith, L.C.; Soderling, T.R. Regulatory Phosphorylation of AMPA-Type Glutamate Receptors by CaM-KII during Long-Term Potentiation. Science 1997, 276, 2042–2045. [Google Scholar] [CrossRef] [Green Version]
- Lee, H.K.; Takamiya, K.; He, K.; Song, L.; Huganir, R.L. Specific Roles of AMPA Receptor Subunit GluR1 (GluA1) Phosphorylation Sites in Regulating Synaptic Plasticity in the CA1 Region of Hippocampus. J. Neurophysiol. 2010, 103, 479–489. [Google Scholar] [CrossRef] [Green Version]
- Morava, É.; Kozicz, T. Mitochondria and the Economy of Stress (Mal)Adaptation. Neurosci. Biobehav. Rev. 2013, 37, 668–680. [Google Scholar] [CrossRef]
- Hegde, A.N. Proteolysis, Synaptic Plasticity and Memory. Neurobiol. Learn. Mem. 2017, 138, 98–110. [Google Scholar] [CrossRef] [Green Version]
- Südhof, T.C. The Synaptic Vesicle Cycle. Annu. Rev. Neurosci. 2004, 27, 509–547. [Google Scholar] [CrossRef] [Green Version]
- Yao, J.; Kwon, S.E.; Gaffaney, J.D.; Dunning, F.M.; Chapman, E.R. Uncoupling the Roles of Synaptotagmin I during Endo- and Exocytosis of Synaptic Vesicles. Nat. Neurosci. 2011, 15, 243–249. [Google Scholar] [CrossRef]
- Park, Y.; Ryu, J.K. Models of Synaptotagmin-1 to Trigger Ca2+-Dependent Vesicle Fusion. FEBS Lett. 2018, 592, 3480–3492. [Google Scholar] [CrossRef] [Green Version]
- Binotti, B.; Jahn, R.; Chua, J. Functions of Rab Proteins at Presynaptic Sites. Cells 2016, 5, 7. [Google Scholar] [CrossRef] [Green Version]
- Tolar, L.A.; Pallanck, L. NSF Function in Neurotransmitter Release Involves Rearrangement of the SNARE Complex Downstream of Synaptic Vesicle Docking. J. Neurosci. 1998, 18, 10250–10256. [Google Scholar] [CrossRef] [Green Version]
- Collins, B.M.; McCoy, A.J.; Kent, H.M.; Evans, P.R.; Owen, D.J. Molecular Architecture and Functional Model of the Endocytic AP2 Complex. Cell 2002, 109, 523–535. [Google Scholar] [CrossRef]
- Liu, J.; Kaksonen, M.; Drubin, D.G.; Oster, G. Endocytic Vesicle Scission by Lipid Phase Boundary Forces. Proc. Natl. Acad. Sci. USA 2006, 103, 10277–10282. [Google Scholar] [CrossRef] [PubMed] [Green Version]
- Pivovarova, N.B.; Andrews, S.B. Calcium-Dependent Mitochondrial Function and Dysfunction in Neurons. FEBS J. 2010, 277, 3622–3636. [Google Scholar] [CrossRef] [PubMed] [Green Version]
- Morel, N.; Poëa-Guyon, S. The Membrane Domain of Vacuolar H+ATPase: A Crucial Player in Neurotransmitter Exocytotic Release. Cell. Mol. Life Sci. 2015, 72, 2561–2573. [Google Scholar] [CrossRef] [PubMed]
- Bodzęta, A.; Kahms, M.; Klingauf, J. The Presynaptic V-ATPase Reversibly Disassembles and Thereby Modulates Exocytosis but Is Not Part of the Fusion Machinery. Cell Rep. 2017, 20, 1348–1359. [Google Scholar] [CrossRef] [PubMed] [Green Version]
- McKenna, M.C.; Waagepetersen, H.S.; Schousboe, A.; Sonnewald, U. Neuronal and Astrocytic Shuttle Mechanisms for Cytosolic-Mitochondrial Transfer of Reducing Equivalents: Current Evidence and Pharmacological Tools. Biochem. Pharmacol. 2006, 71, 399–407. [Google Scholar] [CrossRef] [PubMed]
- Guidetti, P.; Amori, L.; Sapko, M.T.; Okuno, E.; Schwarcz, R. Mitochondrial Aspartate Aminotransferase: A Third Kynurenate-Producing Enzyme in the Mammalian Brain. J. Neurochem. 2007, 102, 103–111. [Google Scholar] [CrossRef]
- Saibil, H. Chaperone Machines for Protein Folding, Unfolding and Disaggregation. Nat. Rev. Mol. Cell Biol. 2013, 14, 630–642. [Google Scholar] [CrossRef] [Green Version]
- Diz, A.P.; Truebano, M.; Skibinski, D.O.F. The Consequences of Sample Pooling in Proteomics: An Empirical Study. Electrophoresis 2009, 30, 2967–2975. [Google Scholar] [CrossRef]
- Willner, P.; Muscat, R.; Papp, M. Chronic Mild Stress-Induced Anhedonia: A Realistic Animal Model of Depression. Neurosci. Biobehav. Rev. 1992, 16, 525–534. [Google Scholar] [CrossRef]
- Ho, Y.-J.; Eichendorff, J.; Schwarting, R.K.W. Individual Response Profiles of Male Wistar Rats in Animal Models for Anxiety and Depression. Behav. Brain Res. 2002, 136, 1–12. [Google Scholar] [CrossRef]
- Porsolt, R.D.; Le Pichon, M.; Jalfre, M. Depression: A New Animal Model Sensitive to Antidepressant Treatments. Nature 1977, 266, 730–732. [Google Scholar] [CrossRef]
- Dulawa, S.C.; Holick, K.A.; Gundersen, B.; Hen, R. Effects of Chronic Fluoxetine in Animal Models of Anxiety and Depression. Neuropsychopharmacology 2004, 29, 1321–1330. [Google Scholar] [CrossRef] [Green Version]
- Kristian, T. Isolation of Mitochondria from the CNS. Curr. Protoc. Neurosci. 2010, 52, 7.22.1–7.22.12. [Google Scholar] [CrossRef] [Green Version]
- Lowry, O.H.; Rosenbrough, N.J.; Farr, A.L.; Randall, R.J. Protein Measurement with the Folin Phenol Reagent. J. Biol. Chem. 1951, 193, 265–275. [Google Scholar] [CrossRef]
- Perez-Riverol, Y.; Csordas, A.; Bai, J.; Bernal-Llinares, M.; Hewapathirana, S.; Kundu, D.J.; Inuganti, A.; Griss, J.; Mayer, G.; Eisenacher, M.; et al. The PRIDE Database and Related Tools and Resources in 2019: Improving Support for Quantification Data. Nucleic Acids Res. 2019, 47, D442–D450. [Google Scholar] [CrossRef]


| Name | Accession No | Gene | Ratio | Matched Peptides | Unique Peptides |
|---|---|---|---|---|---|
| ATP synthase subunit alpha, mitochondrial | P15999 | Atp5f1a | 0.80 | 11 | 10 |
| Malic enzyme | A0A0G2K4C6 | Me3 | 0.79 | 2 | 2 |
| RAB5B, member RAS oncogene family | A1L1J8 | Rab5b | 0.79 | 3 | 2 |
| Enolase 1, (Alpha) | Q5EB49 | Eno1 | 0.78 | 18 | 16 |
| Annexin | O70371 | N/A | 0.77 | 15 | 15 |
| Septin 5 | D3ZDH8 | Sep5 | 0.77 | 5 | 5 |
| Malate dehydrogenase, cytoplasmic | O88989 | Mdh1 | 0.76 | 13 | 13 |
| F-actin-capping protein subunit alpha-2 | Q3T1K5 | Capza2 | 0.76 | 3 | 3 |
| Fructose-bisphosphate aldolase A | P05065 | Aldoa | 0.75 | 22 | 18 |
| NAD-dependent protein deacetylase sirtuin-2 | Q5RJQ4 | Sirt2 | 0.75 | 3 | 3 |
| Pyruvate dehydrogenase E1 component subunit beta | A0A0G2KAM3 | Pdhb | 0.74 | 18 | 16 |
| Cofilin-1 | P45592 | Cfl1 | 0.74 | 2 | 2 |
| Annexin | Q5U362 | Anxa4 | 0.72 | 6 | 6 |
| Creatine kinase B-type | P07335 | Ckb | 0.70 | 27 | 25 |
| Annexin | Q6IMZ3 | Anxa6 | 0.70 | 17 | 15 |
| Malate dehydrogenase, mitochondrial | P04636 | Mdh2 | 0.68 | 31 | 30 |
| Peroxiredoxin 3 | G3V7I0 | Prdx3 | 0.65 | 3 | 3 |
| Glutathione S-transferase P | P04906 | Gstp1 | 0.63 | 4 | 4 |
| Annexin A3 | P14669 | Anxa3 | 0.62 | 11 | 11 |
| Cytochrome c oxidase subunit | D3ZD09 | Cox6b1 | 0.50 | 2 | 2 |
| Name | Accession No | Gene | Ratio | Matched Peptides | Unique Peptides |
|---|---|---|---|---|---|
| ATP synthase protein 8 | Q5UAJ5 | ATP8 | 5.77 | 2 | 2 |
| Protein phosphatase 2 (Formerly 2A), regulatory subunit A (PR 65), alpha isoform, isoform CRA_a | Q5XI34 | Ppp2r1a | 2.25 | 2 | 2 |
| Tropomyosin alpha-3 chain | Q63610 | Tpm3 | 2.11 | 5 | 3 |
| 10 kDa heat shock protein, mitochondrial | P26772 | Hspe1 | 2.10 | 8 | 8 |
| Calcium/calmodulin-dependent protein kinase type II subunit alpha | P11275 | Camk2a | 1.72 | 5 | 3 |
| Polyubiquitin | Q63654 | UBC | 1.68 | 6 | 2 |
| Isoform Non-brain of Clathrin light chain | P08082-2 | Cltb | 1.64 | 2 | 2 |
| Elongation factor 1-gamma | Q68FR6 | Eef1g | 1.52 | 3 | 3 |
| Name | Accession No | Gene | Ratio | Matched Peptides | Unique Peptides |
|---|---|---|---|---|---|
| Serine/threonine-protein phosphatase 2A 56 kDa regulatory subunit | A0A0G2JTA1 | Ppp2r5e | 2.31 | 3 | 2 |
| Tubulin beta-2A chain | P85108 | Tubb2a | 2.27 | 15 | 5 |
| ATP synthase subunit beta | G3V6D3 | Atp5f1b | 2.21 | 26 | 24 |
| V-type proton ATPase subunit H | A0A0G2K9J2 | Atp6v1h | 2.20 | 6 | 5 |
| AP-2 complex subunit beta | P62944 | Ap2b1 | 2.20 | 11 | 5 |
| T-complex protein 1 subunit beta | Q5XIM9 | Cct2 | 2.17 | 3 | 3 |
| Serine/threonine-protein phosphatase 2B catalytic subunit alpha isoform | P63329 | Ppp3ca | 2.15 | 8 | 6 |
| Alpha-actinin-1 | Q9Z1P2 | Actn1 | 2.03 | 14 | 8 |
| ATP synthase subunit alpha, mitochondrial | P15999 | Atp5f1a | 2.03 | 14 | 14 |
| 26S proteasome regulatory subunit 7 | Q63347 | Psmc2 | 2.00 | 2 | 2 |
| Beta-soluble NSF attachment protein | F8WFM2 | Napb | 1.97 | 7 | 6 |
| Neurochondrin | O35095 | Ncdn | 1.92 | 8 | 6 |
| Long-chain-fatty-acid--CoA ligase ACSBG1 | Q924N5 | Acsbg1 | 1.89 | 5 | 3 |
| Dynamin-1 | P21575 | Dnm1 | 1.89 | 32 | 29 |
| Clathrin heavy chain 1 | P11442 | Cltc | 1.88 | 75 | 71 |
| Clathrin heavy chain | F1M779 | Cltc | 1.88 | 75 | 72 |
| Phosphoglucomutase 1 | Q499Q4 | Pgm1 | 1.87 | 5 | 5 |
| 4-aminobutyrate aminotransferase, mitochondrial | P50554 | Abat | 1.87 | 17 | 16 |
| Heat shock 70kDa protein 12A (Predicted), isoform CRA_a | D3ZC55 | Hspa12a | 1.86 | 3 | 3 |
| Kynurenine--oxoglutarate transaminase 3 | Q58FK9 | Kyat3 | 1.86 | 3 | 3 |
| Adducin 1 (Alpha), isoform CRA_b | A0A0G2JSM7 | Add1 | 1.86 | 5 | 4 |
| Synaptotagmin-1 | P21707 | Syt1 | 1.85 | 4 | 3 |
| Dihydropyrimidinase-related protein | Q9JMG8 | N/A | 1.83 | 3 | 3 |
| Glutaminase kidney isoform, mitochondrial | P13264 | Gls | 1.83 | 14 | 10 |
| Dmx-like 2 | F1M3W5 | Dmxl2 | 1.82 | 2 | 2 |
| Phosphodiesterase | F8WFW5 | Pde2a | 1.82 | 2 | 2 |
| Fumarylacetoacetate hydrolase domain-containing protein 2 | B2RYW9 | Fahd2 | 1.79 | 5 | 5 |
| Polyubiquitin-C | F1LML2 | Ubc | 1.79 | 7 | 6 |
| Guanine deaminase | Q9JKB7 | Gda | 1.79 | 11 | 11 |
| Copine 6 protein | H1UBM5 | Cpne6 | 1.78 | 6 | 5 |
| Heat shock protein 105 kDa | Q66HA8 | Hsph1 | 1.78 | 12 | 8 |
| Aspartate aminotransferase, mitochondrial | P00507 | Got2 | 1.76 | 5 | 2 |
| AP-2 complex subunit alpha | D3ZUY8 | Ap2a1 | 1.76 | 14 | 7 |
| Endophilin-B2 | Q5PPJ9 | Sh3glb2 | 1.72 | 3 | 2 |
| Eukaryotic initiation factor 4A-II | Q5RKI1 | Eif4a2 | 1.72 | 4 | 4 |
| Chaperonin containing Tcp1, subunit 6A (Zeta 1) | Q3MHS9 | Cct6a | 1.70 | 3 | 2 |
| Gamma-enolase | P07323 | Eno2 | 1.69 | 10 | 7 |
| 2-oxoglutarate dehydrogenase, mitochondrial | Q5XI78 | Ogdh | 1.69 | 12 | 8 |
| Endophilin-A1 | O35179 | Sh3gl2 | 1.69 | 11 | 10 |
| Rab GDP dissociation inhibitor alpha | P50398 | Gdi1 | 1.67 | 29 | 21 |
| Adenylyl cyclase-associated protein 2 | P52481 | Cap2 | 1.67 | 7 | 5 |
| Aldehyde dehydrogenase X, mitochondrial | G3V7I5 | Aldh1b1 | 1.66 | 7 | 5 |
| Oxidation resistance protein 1 | A0A0G2K7Y2 | Oxr1 | 1.64 | 6 | 5 |
| Protein NDRG2 | Q8VBU2 | Ndrg2 | 1.64 | 9 | 9 |
| Spectrin beta chain | A0A0G2K8W9 | Sptbn1 | 1.64 | 23 | 19 |
| Amine oxidase | B2GV33 | Maoa | 1.63 | 3 | 3 |
| 1-phosphatidylinositol 4,5-bisphosphate phosphodiesterase beta-1 | P10687 | Plcb1 | 1.62 | 2 | 2 |
| ATPase, H+ transporting, V1 subunit E isoform 1, isoform CRA_a | G3V7L8 | Atp6v1e1 | 1.62 | 9 | 8 |
| Endoplasmic reticulum chaperone BiP | P06761 | Hspa5 | 1.62 | 13 | 10 |
| Pyruvate kinase PKM | P11980 | Pkm | 1.61 | 34 | 4 |
| NADH dehydrogenase [ubiquinone] flavoprotein 1, mitochondrial | Q5XIH3 | Ndufv1 | 1.60 | 4 | 4 |
| Pck2 protein | B2RYG2 | Pck2 | 1.60 | 12 | 12 |
| Ubiquitin-like modifier-activating enzyme 1 | Q5U300 | Uba1 | 1.60 | 16 | 14 |
| 14-3-3 protein epsilon | P62260 | Ywhae | 1.60 | 18 | 15 |
| Heat shock 70kDa protein 4-like (Predicted), isoform CRA_b | B4F772 | Hspa4l | 1.59 | 9 | 7 |
| Dihydropyrimidinase-related protein 3 | Q62952 | Dpysl3 | 1.58 | 10 | 5 |
| Dihydrolipoamide acetyltransferase component of pyruvate dehydrogenase complex | A0A0G2JZH8 | Pdhx | 1.58 | 9 | 7 |
| Alpha-1,4 glucan phosphorylase | G3V6Y6 | Pygb | 1.58 | 12 | 8 |
| Protein phosphatase 2 (Formerly 2A), regulatory subunit A (PR 65), alpha isoform, isoform CRA_a | Q5XI34 | Ppp2r1a | 1.58 | 10 | 10 |
| D-3-phosphoglycerate dehydrogenase | O08651 | Phgdh | 1.57 | 4 | 3 |
| N-ethylmaleimide sensitive fusion protein, isoform CRA_b | F1LQ81 | Nsf | 1.57 | 22 | 21 |
| Heat shock cognate 71 kDa protein | P63018 | Hspa8 | 1.57 | 44 | 36 |
| Heat shock 70 kDa protein 4 | F1LRV4 | Hspa4 | 1.56 | 16 | 12 |
| Heat shock protein HSP 90-alpha | P82995 | Hsp90aa1 | 1.56 | 27 | 20 |
| Dynein light chain 1, cytoplasmic | P63170 | Dynll1 | 1.55 | 2 | 2 |
| Elongation factor 1-gamma | Q68FR6 | Eef1g | 1.55 | 2 | 2 |
| Methylmalonate-semialdehyde dehydrogenase [acylating], mitochondrial | Q02253 | Aldh6a1 | 1.55 | 3 | 3 |
| Tenascin R, isoform CRA_b | A0A096MJE6 | Tnr | 1.55 | 12 | 10 |
| ATPase H+-transporting V1 subunit A | D4A133 | Atp6v1a | 1.55 | 39 | 38 |
| 5′-nucleotidase domain-containing 3 | D3ZAI6 | Nt5dc3 | 1.54 | 8 | 7 |
| Aminopeptidase | F1M9V7 | Npepps | 1.54 | 8 | 7 |
| L-lactate dehydrogenase B chain | P42123 | Ldhb | 1.54 | 15 | 12 |
| 60 kDa heat shock protein, mitochondrial | P63039 | Hspd1 | 1.54 | 39 | 36 |
| Phosphatidylethanolamine-binding protein 1 | P31044 | Pebp1 | 1.53 | 3 | 3 |
| Malate dehydrogenase, cytoplasmic | O88989 | Mdh1 | 1.53 | 12 | 12 |
| Intercellular adhesion molecule 5 | D4A435 | Icam5 | 1.52 | 4 | 4 |
| Fructose-bisphosphate aldolase A | P05065 | Aldoa | 1.52 | 5 | 4 |
| Ras-related protein Rab-3A | P63012 | Rab3a | 1.52 | 11 | 10 |
| Spectrin alpha chain, nonerythrocytic 1 | A0A0G2JZ69 | Sptan1 | 1.52 | 44 | 35 |
| Receptor-type tyrosine-protein phosphatase zeta | F1LMY3 | Ptprz1 | 1.51 | 2 | 2 |
| Opioid-binding protein/cell adhesion molecule | P32736 | Opcml | 1.51 | 4 | 3 |
| Succinyl-CoA:3-ketoacid coenzyme A transferase 1, mitochondrial | B2GV06 | Oxct1 | 1.51 | 16 | 15 |
| Enolase 1, (Alpha) | Q5EB49 | Eno1 | 1.51 | 22 | 19 |
| Dihydropyrimidinase-related protein 2 | P47942 | Dpysl2 | 1.51 | 49 | 41 |
| Profilin-2 | Q9EPC6 | Pfn2 | 1.50 | 2 | 2 |
| Microtubule-associated protein 6 | Q63560 | Map6 | 0.79 | 3 | 3 |
| 10 kDa heat shock protein, mitochondrial | P26772 | Hspe1 | 0.79 | 6 | 6 |
| NADH dehydrogenase [ubiquinone] 1 alpha subcomplex subunit 2 | D3ZS58 | Ndufa2 | 0.73 | 2 | 2 |
| Isoform Excitatory amino acid transporter 2 | P31596-2 | Slc1a2 | 0.73 | 7 | 7 |
| Myelin proteolipid protein | P60203 | Plp1 | 0.69 | 6 | 5 |
| ATP synthase subunit e, mitochondrial | P29419 | Atp5me | 0.36 | 4 | 3 |
Publisher’s Note: MDPI stays neutral with regard to jurisdictional claims in published maps and institutional affiliations. |
© 2022 by the authors. Licensee MDPI, Basel, Switzerland. This article is an open access article distributed under the terms and conditions of the Creative Commons Attribution (CC BY) license (https://creativecommons.org/licenses/by/4.0/).
Share and Cite
Filipović, D.; Costina, V.; Findeisen, P.; Inta, D. Fluoxetine Enhances Synaptic Vesicle Trafficking and Energy Metabolism in the Hippocampus of Socially Isolated Rats. Int. J. Mol. Sci. 2022, 23, 15351. https://doi.org/10.3390/ijms232315351
Filipović D, Costina V, Findeisen P, Inta D. Fluoxetine Enhances Synaptic Vesicle Trafficking and Energy Metabolism in the Hippocampus of Socially Isolated Rats. International Journal of Molecular Sciences. 2022; 23(23):15351. https://doi.org/10.3390/ijms232315351
Chicago/Turabian StyleFilipović, Dragana, Victor Costina, Peter Findeisen, and Dragos Inta. 2022. "Fluoxetine Enhances Synaptic Vesicle Trafficking and Energy Metabolism in the Hippocampus of Socially Isolated Rats" International Journal of Molecular Sciences 23, no. 23: 15351. https://doi.org/10.3390/ijms232315351
APA StyleFilipović, D., Costina, V., Findeisen, P., & Inta, D. (2022). Fluoxetine Enhances Synaptic Vesicle Trafficking and Energy Metabolism in the Hippocampus of Socially Isolated Rats. International Journal of Molecular Sciences, 23(23), 15351. https://doi.org/10.3390/ijms232315351