Article

Rapid Detection of Brettanomyces bruxellensis in Wine by Polychromatic Flow Cytometry

1
Department of Medicine and Aging Sciences, University “G. d’Annunzio” of Chieti-Pescara, 66100 Chieti, Italy
2
Center for Advanced Studies and Technology (CAST), University “G. d’Annunzio” of Chieti-Pescara, 66100 Chieti, Italy
3
FlowForLife Lab, Spin-Off, Center for Advanced Studies and Technology (CAST), University “G. d’Annunzio” of Chieti-Pescara, 66100 Chieti, Italy
4
Department of Agronomy, Food, Environmental and Forestry, University of Florence, Piazzale delle Cascine 18, 50144 Firenze, Italy
5
Department of Innovative Technologies in Medicine and Dentistry, University “G. d’Annunzio” of Chieti-Pescara, 66100 Chieti, Italy
6
Advanced Computing Core, Center for Advanced Studies and Technology (CAST), University “G. d’Annunzio” of Chieti–Pescara, Via Luigi Polacchi 11, 66100 Chieti, Italy
7
Department of Bioscience and Technology for Food, Agriculture and Environment, University of Teramo, Via R. Balzarini 1, 64100 Teramo, Italy
*
Author to whom correspondence should be addressed.
Int. J. Mol. Sci. 2022, 23(23), 15091; https://doi.org/10.3390/ijms232315091
Submission received: 7 October 2022 / Revised: 21 November 2022 / Accepted: 24 November 2022 / Published: 1 December 2022
(This article belongs to the Special Issue Stress Response Effectors and Strategies in Probiotics)

Abstract

:
Brettanomyces bruxellensis is found in several fermented matrices and produces relevant alterations to the wine quality. The methods usually used to identify B. bruxellensis contamination are based on conventional microbiological techniques that require long procedures (15 days), causing the yeast to spread in the meantime. Recently, a flow cytometry kit for the rapid detection (1–2 h) of B. bruxellensis in wine has been developed. The feasibility of the method was assessed in a synthetic medium as well as in wine samples by detecting B. bruxellensis in the presence of other yeast species (Saccharomyces cerevisiae and Pichia spp.) and at the concentrations that produce natural contaminations (up to 105 cells/mL), as well as at lower concentrations (103–102 cells/mL). Wine samples naturally contaminated by B. bruxellensis or inoculated with four different strains of B. bruxellensis species together with Saccharomyces cerevisiae and Pichia spp., were analyzed by flow cytometry. Plate counts were carried out in parallel to flow cytometry. We provide evidence that flow cytometry allows the rapid detection of B. bruxellensis in simple and complex mixtures. Therefore, this technique has great potential for the detection of B. bruxellensis and could allow preventive actions to reduce wine spoilage.

1. Introduction

Brettanomyces bruxellensis is an oval/ellipsoidal yeast 2–7 µm in diameter [1], growing in fermented beverages, such as wine, beer, and cider [1,2]. Dekkera/Brettanomyces genus, belonging to the Pichiaceae family, comprises five anamorphic species (B. custersianus, B. naardenesis, B. nanus, B. anomalous, and B. bruxellensis) and two teleomorphic forms (D. anomala and D. bruxellensis) [3]. Its genus was recognized in the 1920s, when it was isolated from a pool of yeasts obtained from the Belgian “Lambic ale” beer [4]. In the 1950s and 1960s, the yeast was identified in wine, for the first time in France, Italy, and South Africa, and further in other countries. However, studies on B. bruxellensis increased later, over the 1980s and 1990s [4,5]. Only B. bruxellensis strains are able to release detrimental compounds, e.g., volatile phenols (e.g., 4-ethyl phenol and 4-ethyl guaiacol) derived from the sequential conversion of hydroxycinnamic acids and p-coumarate. These molecules confer to wines the so-called “Brett-character”, linked to a bad smell aroma, which leads to consequent qualitative and economic problems [6,7,8]. Frequently, B. bruxellensis is also found in cellar equipment, often when the cleaning processes are not effective [6]. B. bruxellensis survives even for a long time, especially in wooden barrels [9]. In these cases, B. bruxellensis penetrates into the barrique staves (up to 8 mm of depth) [10], making the sanitization procedures useless. Of note, B. bruxellensis tolerates ethanol, as well as low pH levels and its growth is stimulated by oxygen [11,12]. Therefore, the oxygen penetration through the wood and the practice of micro-oxygenation, which allows for ethanol oxidation and the formation of a more stable bond between tannins and anthocyanins, crucial for the stabilization of the red wine color [13], are conditions that promote B. bruxellensis development. It has been demonstrated that B. bruxellensis also affects the wine color [14], hydrolyzing the anthocyanins and producing a color loss [6,9]. Overall, the presence of B. bruxellensis during the fermentation processes produces relevant alterations to the wine sensory profile. B. bruxellensis is able to produce 4-vinyl phenol and 4-ethyl phenol, which can contribute to wine bouquet complexity when present in a low concentration. However, above the sensory threshold they confer off-flavors described as “horse sweat”, “medicinal”, “smoke”, “phenolic”, “barnyard”, “rancid”, and “sweaty”. Moreover, these yeasts can have other detrimental effects, such as the production of biogenic amines, tetrahydropyridines from lysine (responsible for a mousy “off-flavor”), acetic acid, nonenal, guaiacol and several ethyl-esters from short-chain fatty acids [15]. For these reasons, the possibility to identify B. bruxellensis contaminations within the barrels or during the first fermentation phases may allow for the adoption of appropriate strategies to avoid the production of altered wines. The methods traditionally used to detect such yeast during wine production are mainly based on the application of conventional microbiological techniques and need up to 15 days [1,16]. In addition, before identifying the contamination, the yeast can grow and spread, causing significant spoilage in wines. Moreover, PCR-based methods (e.g., Real-Time PCR protocols) have been developed [17]. The reverse transcriptase PCR (RT-PCR) allows for discriminating between viable and non-viable cells, while nested-PCR allows for the direct detection of B. bruxellensis in wines without strain isolation [9,18,19]. Even if these molecular methods are faster than plate count techniques, they do not allow for yeast count and are particularly expensive. Impedance has also been used for the detection of B. bruxellensis [20]. Besides the rapidity of the execution of this method, it is not specific. Recently, a flow cytometry kit for the identification and quantification of viable Brettanomyces yeasts in wines (Kit Bretta Test 80 tests, B80, Amarok Biotechnologies, Saint-Malo, France) in a short time (1–2 h) was developed. There are no reports in the literature evidencing the suitability and effectiveness of this method. For this reason, the kit was validated, for the first time using wine samples artificially inoculated or naturally contaminated by B. bruxellensis.

2. Results

2.1. Specificity of the Flow Cytometry Measurements

The Bretta Test (Kit Bretta Test 80 tests, B80, Amarok Biotechnologies, Saint-Malo, France) consists of a probe, the fluorescein diacetate (FDA), able to stain viable and metabolically active cells [21,22], as well as a rabbit polyclonal antibody, recognizing Brettanomyces antigens. As a first step, we tested the ability of the antibody to recognize different B. bruxellensis strains (Bb1, Bb2, Bb3, Bb4) in pure cultures and at different concentrations. As shown in Figure 1, when cells were analyzed by flow cytometry, a morphologically homogeneous population of yeasts was identified with respect to the scatter parameters (FSC-A/SSC-A, Figure 1a–d, left) for all the tested strains. This population was analyzed for the expression of B. bruxellensis antigens, and, as it is shown in the histograms (Figure 1a–d, right), 100% of all B. bruxellensis analyzed strains were recognized by the anti-Bretta antibody. Of note, when a sample of S. cerevisiae was analyzed, no fluorescence was evidenced in the channel used for the detection of specific B. bruxellensis antigens (Figure 1e, right). When higher concentrations of B. bruxellensis were analyzed (108, 107 and 106 cells/mL), the staining resulted weaker than with lower concentrations, suggesting that the kit was developed to stain B. bruxellensis at concentrations that produce natural contaminations (up to 105 cells/mL). Therefore, when samples containing higher B. bruxellensis concentrations are analyzed (106–108 cells/mL), the primary antibody must be titrated under the assay conditions, as recommended [23].

2.2. Sensitivity of B. bruxellensis Flow Cytometry Measurements

To verify the ability of the flow cytometry method to identify B. bruxellensis levels compatible with those detectable in cellars, samples of B. bruxellensis at lower concentrations (103 and 102 cells/mL) were analyzed (Figure 2). As shown, for all analyzed B. bruxellensis strains, a population of yeasts was identified on the dot-plot displaying the morphological parameters (FSC-A/SSC-A dot-plots) that stained positive for the FDA and showed a significant expression of B. bruxellensis antigens. As evidenced in Figure 2, both 102 and103 concentrations of all analyzed B. bruxellensis strains were detected.

2.3. Flow Cytometry Analyses of S. cerevisiae and B. bruxellensis Mixed Cultures

Given that wines are complex mixtures containing different types of micro-organisms, we also tested the ability of such a flow cytometry method to identify B. bruxellensis (Kit Bretta Test 80 tests, B80, Amarok Biotechnologies, Saint-Malo, France) in samples where different concentrations of S. cerevisiae were also inoculated. Figure 3 shows that B. bruxellensis was identified by the flow cytometry positivity to the anti-Brettanomyces. antibody provided by the kit. Here, the whole population of yeasts was first identified by their morphological parameters (FSC-A/SSC-A), then FDA+ cells were selected and finally analyzed for the positivity to the anti- Brettanomycesantibody. As evidenced, a subpopulation positive to the anti-Brettanomyces antibody was identified. The anti-Brettanomyces negative population represents the S. cerevisiae subset. It is interesting to note that the population identified with the anti-Brettanomyces antibody displayed FSC values lower than those observed for anti-Brettanomyces antibody negative yeasts, that, being S. cerevisiae cells, confirm the specificity of such a test (Figure 3b).

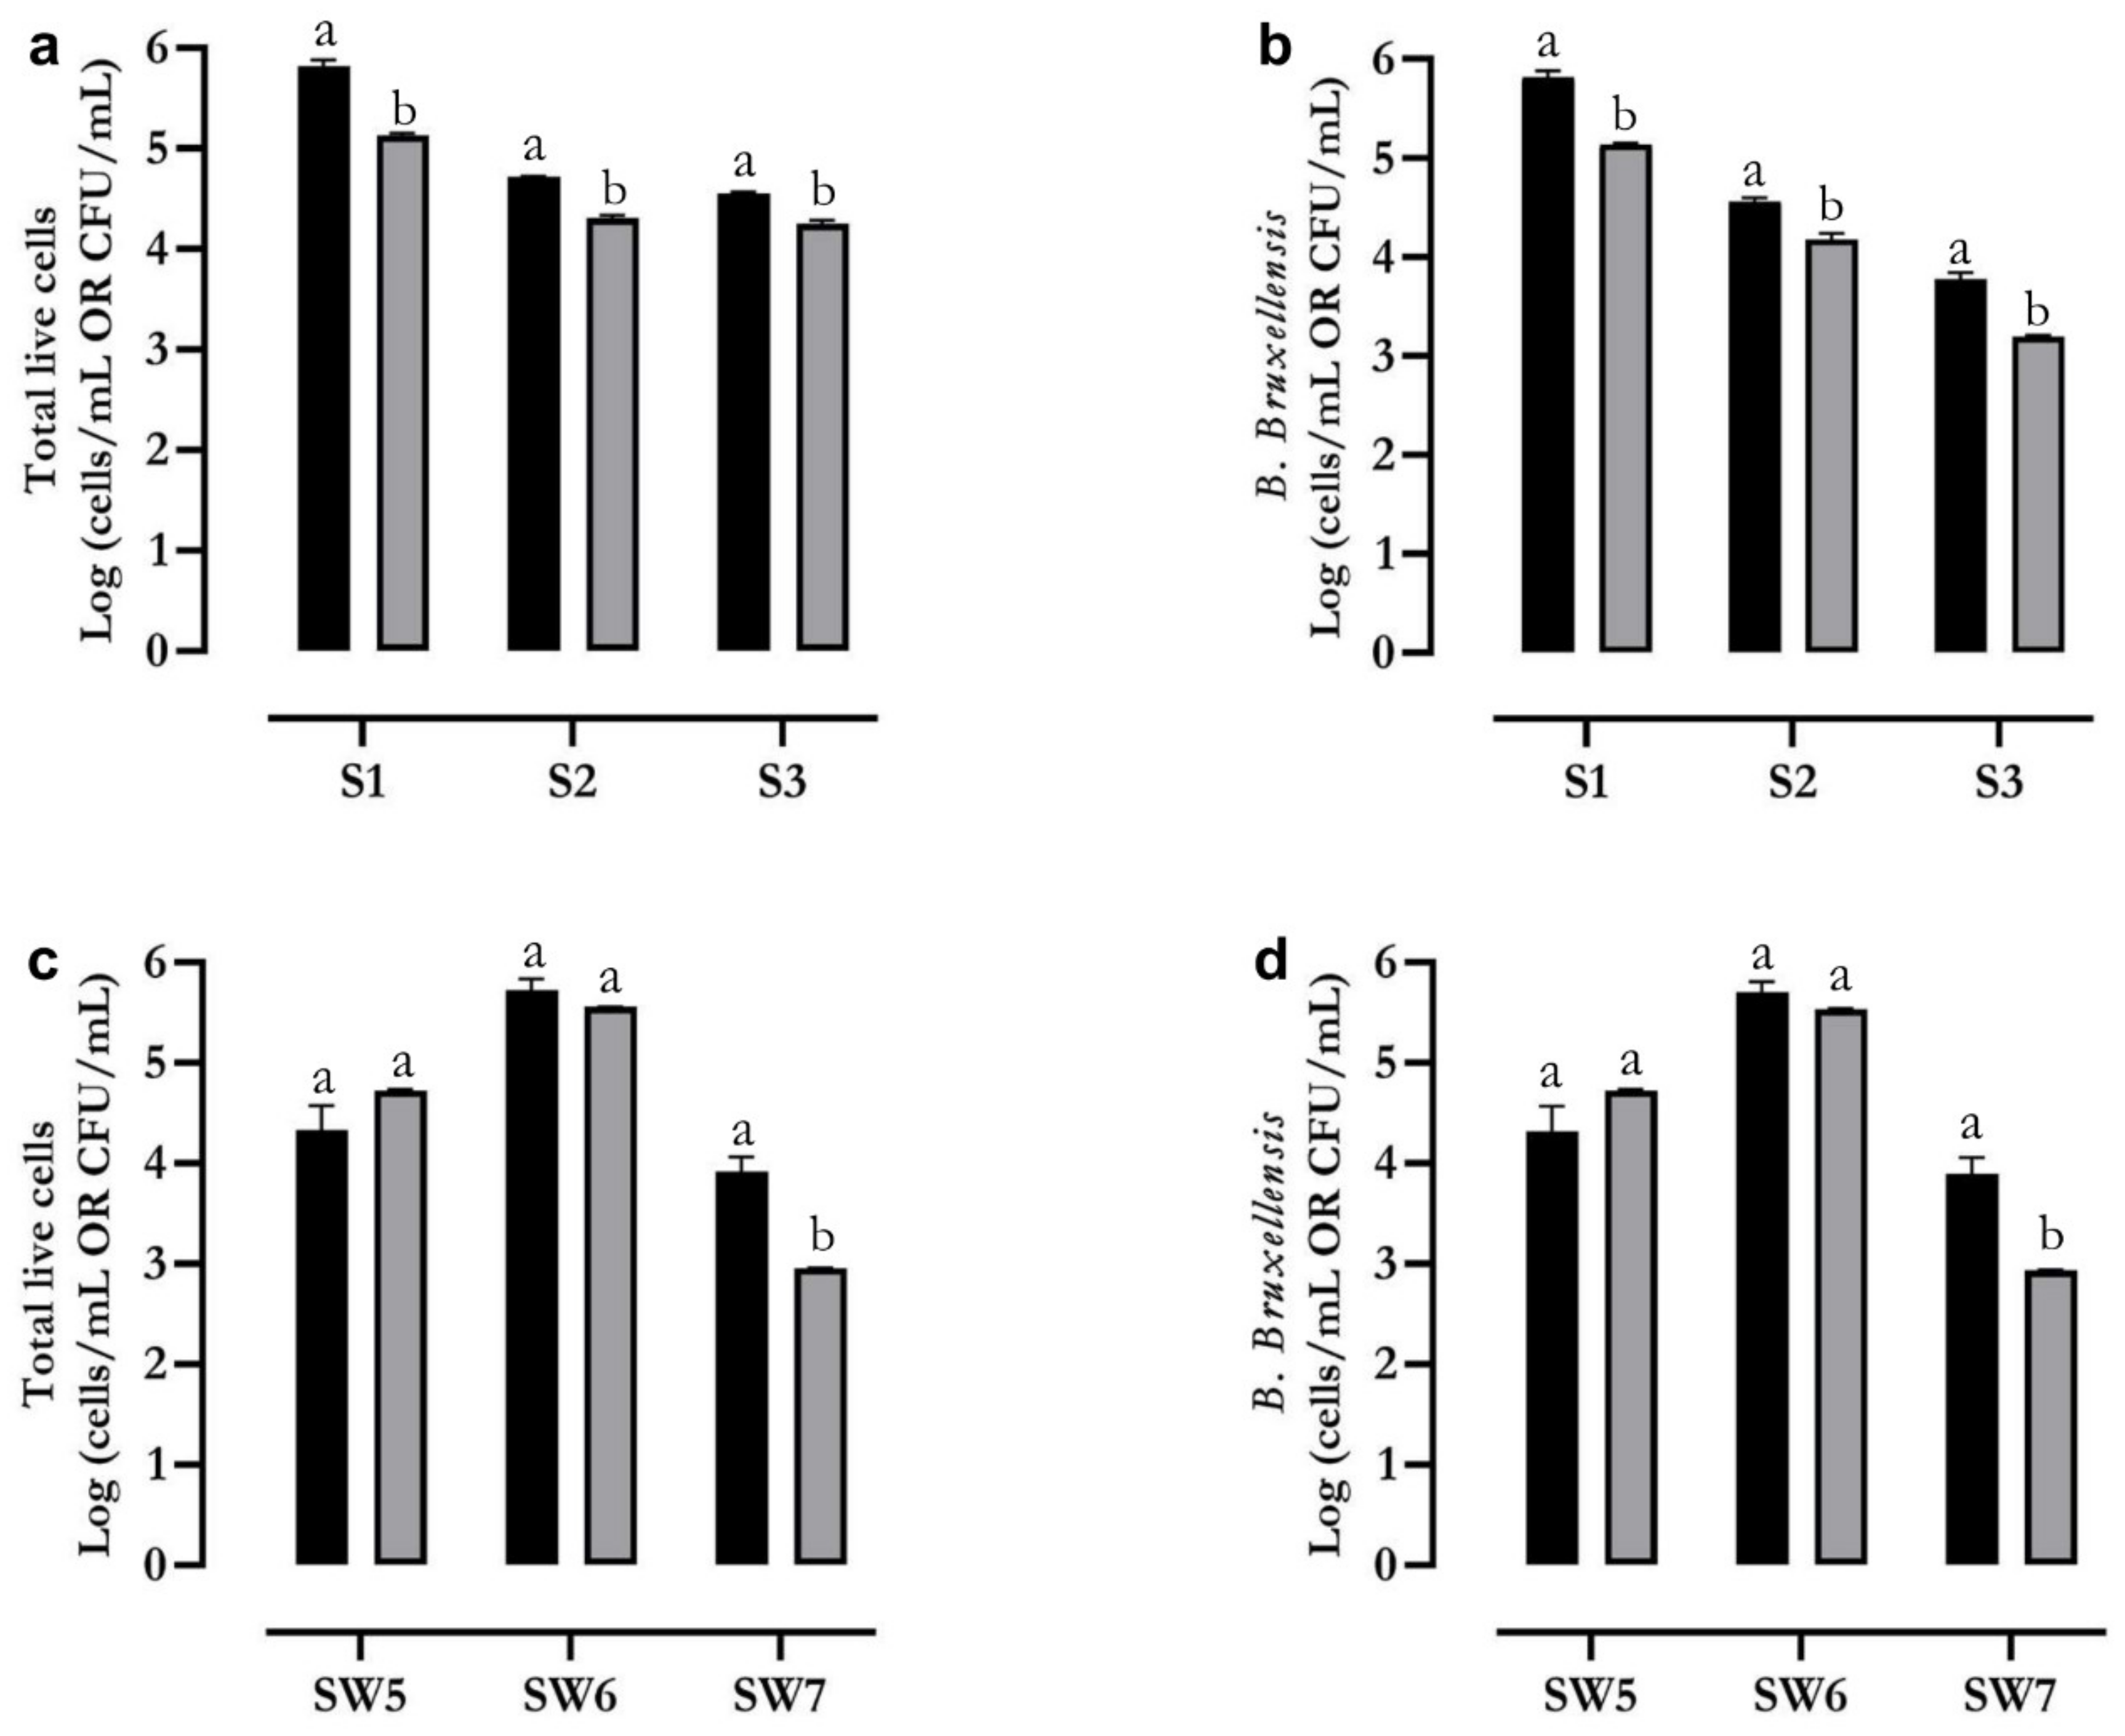
2.4. Flow Cytometry Identification and Count of B. bruxellensis in Wine Samples

Once demonstrating the sensitivity and specificity of this method, we also analyzed three B. bruxellensis artificially contaminated and three naturally contaminated wine samples, using a sterile wine sample as a control. Figure 4b shows that, in a sample containing only B. bruxellensis, the whole yeast population stained positive to the anti-B. bruxellensis antibody (sample SW5). B. bruxellensis can be identified even in a mixed population of B. bruxellensis and S. cerevisiae (Figure 4a, sample S2), while when sterile wine is analyzed, no population of yeasts is stained by the kit (Figure 4c). Furthermore, by analyzing the scatter parameters, the yeast population can be distinguished from the bacteria (i.e., Oenococcus oeni, Figure 4d, sample SW6).
The concentrations of B. bruxellensis in wine samples was carried out by flow cytometry and paralleled to those obtained on the same samples (artificially or naturally contaminated) by plate counts (Figure 5a–d). The values obtained by plate counts were generally lower than those revealed by flow cytometry, confirming reported data showing that plate counts underestimate the concentrations of viable yeasts with respect to flow cytometry measurements, given that flow cytometry also allows the identification of viable, non-cultivable cells.

3. Discussion

B. bruxellensis contamination represents a problem for the wine industry [6,7,8]. For this reason, the rapid detection of B. bruxellensis contamination may be particularly useful for the adoption of appropriate strategies to avoid altered wine productions. The methods generally applied for B. bruxellensis detection are based on microbiological techniques. Unfortunately, those methods cannot identify viable but non-cultivable cells (VBNC) [1,16]. VBNC can instead be detected by molecular methods, based on the amplification of DNA and RNA fragments by the polymerase chain reaction (PCR). These methods are fast, specific, and sensitive [9]. The reverse transcriptase PCR (RT-PCR), employing an enzyme that synthesizes single-stranded DNA from RNA, is also able to discriminate between viable and non-viable cells. For this reason, it is largely employed. Nested-PCR is another molecular detection approach employed for B. bruxellensis detection. It uses two external and two internal primers, allowing the direct detection B. bruxellensis in wines without strain isolation [9]. More recently, a quantitative PCR by direct sampling (Cells-qPCR) has been used to detect and quantify yeasts in grape, must, and wine samples [24]. Cells-qPCR thus results a fast and sensitive technique. However, these molecular methods are more expensive than the plating techniques.
Recently, a flow cytometry kit (Bretta Test 80 tests, B80, Amarok Biotechnologies, Saint-Malo, France) for the identification of alive Brettanomyces yeasts in wines was optimized with the potential of overcoming the limitations linked to the abovementioned techniques. It must be underlined that in the past few years the use of polychromatic flow cytometry in the wine field greatly increased, given that it is a powerful technique allowing a rapid detection and enumeration of microbial populations in fermented food and during food production processes [25]. This technique, thanks to the use of probes (e.g., fluorescent molecules able to bind the DNA) and markers (e.g., fluorochrome-conjugated antibodies directed against specific microorganism markers), provides information about the presence of specific micro-organisms, about their physiological state and allows their enumeration in wine samples in a few hours [25]. Given that there are no publications evidencing the usefulness of this method, here we validated, for the first time, such a procedure. It is based on the identification of metabolically active B. bruxellensis cells, using the FDA and anti-Brettanomyces antibody. Our results demonstrated that the kit identifies homogeneous populations of metabolically active cells (FDA+), both in cell cultures and in wine samples (naturally and artificially contaminated). As already reported, with respect to the concentrations obtained by plate counts, flow cytometry also allows for identifying the population of viable, non-cultivable cells [22]. Therefore, microbiological techniques slightly underestimate yeast counts [26].
The specificity of the anti-Brettanomyces antibody provided by the kit was also demonstrated, given that we observed that different B. bruxellensis strains were successfully recognized by the antibody. We also observed that the kit stained the yeast cells in an efficient way even at low concentrations that produce natural contaminations (up to 105 cells/mL). Of note, B. bruxellensis appears in the wine at concentrations of the order of 102 cells/mL during the post-fermentation phase, while it can alter the wine characteristics when present at concentrations of the order of 103 cells/mL [27]. It must also be underlined that, anyway, wines are characterized by the occurrence of a wide array of microbes [22]. The microbial dynamics depend on several factors, including the chemical characteristics of must/wine and its nutrients availability [28]. Moreover, B. bruxellensis is mainly present in red wines obtained from grape cultivars rich in ethyl-phenol precursors. In white wines, its occurrence is lower because pH is decreased with respect to that of red wines and therefore the SO2 is more effective in causing yeast death. Therefore, the possibility to rapidly monitor the concentrations of unwanted (i.e., B. bruxellensis) and wanted (i.e., S. cerevisiae) viable micro-organisms, colonizing the wines during the different fermentation and conservation stages is crucial to develop a more efficient production process [29]. For these reasons, here, we also demonstrated the ability of this flow cytometry method to identify and count B. bruxellensis in wine samples artificially and naturally contaminated by B. bruxellensis and S. cerevisiae. It must be underlined, anyway, that besides the fact that in wine samples the staining of B. bruxellensis is still effective, it resulted slightly weaker than in culture samples. This was possibly due to the ethanol presence, which is known to affect the antigen-antibody binding [30]. For these reasons, we strongly recommend involving a flow cytometry expert in the implementation of the test in a microbiological laboratory. Our results also are a proof of principle of the flow cytometry’s great potential in the enological field. The main advantage of the here presented method is that it rapidly detects yeast suspensions, and in particular Brettanomyces, it allows the obtainment of exact and accurate cell concentrations. Furthermore, this method allows identifying the exact number of live and dead cells, an evaluation that is not allowed by molecular methods. The possibility to develop other specific markers for the identification of different micro-organisms may completely change the paradigm of the enological productions.

4. Materials and Methods

4.1. B. bruxellensis Cell Cultures

Four strains of B. bruxellensis (Bb1, Bb2, Bb3 and Bb4), one S. cerevisiae and one Pichia spp. strain, belonging to the collection of Department of Agronomy, Food, Environmental and Forestry, University of Florence (Italy) were cultured separately at 30 °C for 48 h using 30 mL of liquid YPD medium (1% w/v) yeast extract, 2% (w/v) peptone, and 2% (w/v) glucose. Cell counts of viable cells were carried out using a Thoma chamber with methylene blue staining [31]. Phosphate Buffer Saline (PBS) solution was used to dilute the strain cultures in order to obtain samples at concentrations ranging from 102 to 108 cell/mL.

4.2. Wine Samples

Both wine (Sangiovese) samples artificially (Table 1) and naturally contaminated (Table 2) were analyzed. Wines were analyzed, in parallel, both by flow cytometry and plate counts, as summarized in Figure S1.
In particular, sterile wine samples, obtained by membrane filtration (0.45 µm porosity) were inoculated with the four B. bruxellensis strains mixed together: the above mentioned S. cerevisiae strain and Pichia spp., following the scheme reported in Table 1. Cell concentration of the single cultures was determined by Thoma chamber and used to achieve the final concentration.
Wine samples, naturally contaminated with different B. bruxellensis concentrations were also analyzed (Table 2). In some wine samples, Oenococcus oeni and Pichia spp. yeasts also occurred.

4.3. Flow Cytometry Analyses

Flow cytometry identification and B. bruxellensis counts were carried out at the Center for Advanced Studies and Technology (CAST, Chieti), by using the “Bretta test” kit (Kit Bretta Test 80 tests, B80, Amarok Biotechnologies, Saint-Malo, France) that contains an antibody recognizing Brettanomyces. Samples, diluted in PBS, were filtered with a 30 µm filter to desegregate cell clumps eventually present since cell clumps are not suitable for flow cytometry purposes. Samples were then centrifuged at 500× g at room temperature for 10 min. The supernatant was removed, and the pellet was stained as suggested by the manufacturer’s instructions. Briefly, samples were resuspended using Reagent 4 (200 µL) of the kit, stained with 10 µL of a rabbit polyclonal antibody directed against Brettanomyces antigens (anti-Brettanomyces antibody) and incubated for 20 min in the dark. Reagent 4 was used to wash the cells; samples were then centrifuged at 500× g for 10 min, resuspended in Reagent 4 (200 µL), and stained with 10 µL of fluorescein diacetate (FDA), when appropriate, and 10 µL of secondary anti-rabbit antibody PE-conjugated (Amarok Biotechnologies, Saint-Malo, France), or 1 µL of secondary antibody anti-rabbit Alexa-Fluor 633 conjugated (Thermo Fisher Scientific, Waltham, MA, USA). Samples were incubated for 15 min in the dark, washed, resuspended in Reagent 4, and acquired by Flow Cytometry (FACSVerse, BD Biosciences, San Jose, CA, USA, 3 lasers, 8 fluorescences). For each sample, at least 10,000 events/sample were recorded, and the staining was repeated and acquired three times. Cell concentrations were obtained using a volumetric count device (FACSVerse, BD Biosciences). Instrument performances, data reproducibility, and fluorescence calibrations were carried out by the Cytometer Setup & Tracking Module (BD Biosciences) [32,33]. The evaluation of non-specific fluorescence was obtained by acquiring fluorescence-minus-one controls, combined with the secondary antibody only [34,35]. Compensation was calculated using individually stained fluorescent samples. Data were analyzed using FACSuite v 1.0.6.5230 software (BD Biosciences). To verify the correct positioning of the gating on the dimensional dot-plots (SSC-FSC), MegaMixlus polystyrene beads of known size (Byocitex, Marseille, France) were used [36]. All parameters were analyzed using logarithmic or bi-exponential display modes. A pure culture of S. cerevisiae at a concentration of 105 cells/mL was used as a negative control. Notably, given that the anti-Brettanomyces used by the kit is a rabbit polyclonal antibody, it is mandatory to optimize the staining (antibody titration, specificity verification, etc.) for each kit lot. FDA staining should also be optimized.

4.4. B. bruxellensis Counts

Plate count was carried out on different media and paralleled to flow cytometry counts. Different media were used: DBDM for B. bruxellensis [37], WL nutrient agar, Oxoid [38], with the addition of 2 g/L sodium propionate and 0.3 g/L streptomycin, for non-Brettanomyces yeasts, lactic bacteria MRS, ISO, agar, Oxoid [39], with the addition of 5 g/L fructose, 0.5 g/L cysteine, 2.5 g/L tomato juice broth, 6 g/L agar, and 0.05 g/L pimaricin, for lactic bacteria. Plates were incubated at 28 °C for 5–7 days until colonies developed and the results were expressed as colony forming units per milliliter (CFU/mL).

4.5. Statistics

Statistical analyses were performed using GraphPad Prism ver.8.0 (GraphPad Software Inc., La Jolla, CA, USA) and XLSTAT 2022 (Addinsoft, New York, NY, USA). Differences were tested using the Student’s t-test as appropriate. A p-value of <0.05 was considered statistically significant.

5. Conclusions

Altogether, our results provide evidence that polychromatic flow cytometry, together with the use of labeled antibodies, allowed us to rapidly detect B. bruxellensis yeasts. For these reasons, this technique has great potential for the detection of B. bruxellensis contaminates both in barrel-washing waters and in wines. The rapid execution of the test and the possibility to obtain cell counts of live and dead yeasts allows for effective interventions during fermentation, representing a major advantage with respect to plate count and molecular methods. Notably, flow cytometry costs are sustainable (slightly higher than plate count techniques) if the analyses are carried out by specialized laboratories. The need to send the samples to experts represents, anyway, a limitation for the wide application of flow cytometry in enology, even if the development of new strategies (such as “tele-flow cytometry”, which allows the telematic connection of the wine cellars with expert flow cytometry operators), would enable the application of these methods in enology and might open new perspectives for the improvement of wine production processes.

Supplementary Materials

The following supporting information can be downloaded at: https://www.mdpi.com/article/10.3390/ijms232315091/s1.

Author Contributions

Conceptualization, D.D.B., P.S., L.G., C.V., A.C., R.T. and P.L.; methodology, D.D.B., A.D.S., P.S., G.C., S.V. and E.M.; software, D.D.B., A.D.S. and S.V.; validation, D.D.B. and E.M.; formal analysis, D.D.B., S.V. and P.C.; investigation, D.D.B. and A.D.S.; resources, A.C. and P.L.; data curation, D.D.B. and P.S.; writing—original draft preparation, D.D.B. and P.S.; writing—review and editing, L.G., C.V., A.C., R.T. and P.L.; visualization, M.M., L.G. and P.L.; supervision, A.P., L.G., C.V. and P.L.; project administration, P.L.; funding acquisition, A.C. and P.L. All authors have read and agreed to the published version of the manuscript.

Funding

Domenico De Bellis has a PhD fellowship (code: n. 1353889) in the framework of PON RI 2014/2020, I.1-“Innovative PhDs with industrial characterization” funded by the Italian Ministry of University and Research (MUR), Italy, FSE-FESR.

Institutional Review Board Statement

Not applicable.

Informed Consent Statement

Not applicable.

Data Availability Statement

Data will be available on reasonable request.

Conflicts of Interest

The authors declare no conflict of interest.

References

  1. Kurtzman, C.P.; Fell, J.W.; Boekhout, T. The Yeasts: A Taxonomic Study; Elsevier Science: London, UK; Burlington, MA, USA, 2011; Volume 1, ISBN 978-0-08-093127-2. [Google Scholar]
  2. Loureiro, V.; Malfeito-Ferreira, M. Spoilage Yeasts in the Wine Industry. Int. J. Food Microbiol. 2003, 86, 23–50. [Google Scholar] [CrossRef] [PubMed]
  3. Agnolucci, M.; Tirelli, A.; Cocolin, L.; Toffanin, A. Brettanomyces bruxellensis Yeasts: Impact on Wine and Winemaking. World J. Microbiol. Biotechnol. 2017, 33, 180. [Google Scholar] [CrossRef] [PubMed]
  4. Henschke, P.; Curtin, C.; Grbin, P. Molecular Characterisation of the Wine Spoilage Yeast—Dekkera (Brettanomyces) bruxellensis. Microbiol. Aust. 2007, 28, 76. [Google Scholar] [CrossRef]
  5. Wedral, D.; Shewfelt, R.; Frank, J. The Challenge of Brettanomyces in Wine. LWT–Food Sci. Technol. 2010, 43, 1474–1479. [Google Scholar] [CrossRef]
  6. Oelofse, A.; Pretorius, I.S.; du Toit, M. Significance of Brettanomyces and Dekkera during Winemaking: A Synoptic Review. SAJEV 2008, 29. [Google Scholar] [CrossRef] [Green Version]
  7. Chatonnet, P.; Dubourdie, D.; Boidron, J.; Pons, M. The Origin of Ethylphenols in Wines. J. Sci. Food Agric. 1992, 60, 165–178. [Google Scholar] [CrossRef]
  8. Conterno, L.; Joseph, C.M.L.; Arvik, T.J.; Henick-Kling, T.; Bisson, L.F. Genetic and Physiological Characterization of Brettanomyces bruxellensis Strains Isolated from Wines. Am. J. Enol. Vitic. 2006, 57, 139. [Google Scholar] [CrossRef]
  9. Tubia, I.; Prasad, K.; Pérez-Lorenzo, E.; Abadín, C.; Zumárraga, M.; Oyanguren, I.; Barbero, F.; Paredes, J.; Arana, S. Beverage Spoilage Yeast Detection Methods and Control Technologies: A Review of Brettanomyces. Int. J. Food Microbiol. 2018, 283, 65–76. [Google Scholar] [CrossRef]
  10. Suárez, R.; Suárez-Lepe, J.A.; Morata, A.; Calderón, F. The Production of Ethylphenols in Wine by Yeasts of the Genera Brettanomyces and Dekkera: A Review. Food Chem. 2007, 102, 10–21. [Google Scholar] [CrossRef]
  11. Aguilar Uscanga, M.G.; Délia, M.-L.; Strehaiano, P. Brettanomyces bruxellensis: Effect of Oxygen on Growth and Acetic Acid Production. Appl. Microbiol. Biotechnol. 2003, 61, 157–162. [Google Scholar] [CrossRef]
  12. Serra Colomer, M.; Funch, B.; Forster, J. The Raise of Brettanomyces Yeast Species for Beer Production. Curr. Opin. Biotechnol. 2019, 56, 30–35. [Google Scholar] [CrossRef]
  13. Ji, J.; Henschen, C.W.; Nguyen, T.H.; Ma, L.; Waterhouse, A.L. Yeasts Induce Acetaldehyde Production in Wine Micro-Oxygenation Treatments. J. Agric. Food Chem. 2020, 68, 15216–15227. [Google Scholar] [CrossRef]
  14. Mansfield, A.K.; Zoecklein, B.W.; Whiton, R.S. Quantification of Glycosidase Activity in Selected Strains of Brettanomyces bruxellensis and Oenococcus oeni. Am. J. Enol. Vitic. 2002, 53, 303. [Google Scholar] [CrossRef]
  15. Pinto, L.; Baruzzi, F.; Cocolin, L.; Malfeito-Ferreira, M. Emerging Technologies to Control Brettanomyces spp. in Wine: Recent Advances and Future Trends. Trends Food Sci. Technol. 2020, 99, 88–100. [Google Scholar] [CrossRef]
  16. Cocolin, L.; Rantsiou, K.; Iacumin, L.; Zironi, R.; Comi, G. Molecular Detection and Identification of Brettanomyces/Dekkera bruxellensis and Brettanomyces/Dekkera anomalus in Spoiled Wines. Appl. Environ. Microbiol. 2004, 70, 1347–1355. [Google Scholar] [CrossRef] [Green Version]
  17. Tofalo, R.; Schirone, M.; Perpetuini, G.; Suzzi, G.; Corsetti, A. Development and Application of a Real-Time PCR-Based Assay to Enumerate Total Yeasts and Pichia anomala, Pichia guillermondii and Pichia kluyveri in Fermented Table Olives. Food Control 2012, 23, 356–362. [Google Scholar] [CrossRef]
  18. Tofalo, R.; Schirone, M.; Corsetti, A.; Suzzi, G. Detection of Brettanomyces spp. in Red Wines Using Real-Time PCR. J. Food Sci. 2012, 77, M545–M549. [Google Scholar] [CrossRef]
  19. Vendrame, M.; Manzano, M.; Comi, G.; Bertrand, J.; Iacumin, L. Use of Propidium Monoazide for the Enumeration of Viable Brettanomyces bruxellensis in Wine and Beer by Quantitative PCR. Food Microbiol 2014, 42, 196–204. [Google Scholar] [CrossRef]
  20. Van Wyk, S.; Silva, F. Enumeration of Brettanomyces in Wine Using Impedance. Appl. Microbiol. 2021, 1, 352–360. [Google Scholar] [CrossRef]
  21. Hong, D.; Lee, G.; Jung, N.C.; Jeon, M. Fast Automated Yeast Cell Counting Algorithm Using Bright-Field and Fluorescence Microscopic Images. Biol. Proced. Online 2013, 15, 13. [Google Scholar] [CrossRef]
  22. Capozzi, V.; Di Toro, M.R.; Grieco, F.; Michelotti, V.; Salma, M.; Lamontanara, A.; Russo, P.; Orrù, L.; Alexandre, H.; Spano, G. Viable But Not Culturable (VBNC) State of Brettanomyces bruxellensis in Wine: New Insights on Molecular Basis of VBNC Behaviour Using a Transcriptomic Approach. Food Microbiol. 2016, 59, 196–204. [Google Scholar] [CrossRef] [PubMed]
  23. Cossarizza, A.; Chang, H.; Radbruch, A.; Acs, A.; Adam, D.; Adam-Klages, S.; Agace, W.W.; Aghaeepour, N.; Akdis, M.; Allez, M.; et al. Guidelines for the Use of Flow Cytometry and Cell Sorting in Immunological Studies (Second Edition). Eur. J. Immunol. 2019, 49, 1457–1973. [Google Scholar] [CrossRef] [PubMed] [Green Version]
  24. Soares-Santos, V.; Pardo, I.; Ferrer, S. Cells-QPCR as a Direct Quantitative PCR Method to Avoid Microbial DNA Extractions in Grape Musts and Wines. Int. J. Food Microbiol. 2017, 261, 25–34. [Google Scholar] [CrossRef] [PubMed]
  25. Longin, C.; Petitgonnet, C.; Guilloux-Benatier, M.; Rousseaux, S.; Alexandre, H. Application of Flow Cytometry to Wine Microorganisms. Food Microbiol. 2017, 62, 221–231. [Google Scholar] [CrossRef] [PubMed]
  26. Davey, H.M. Life, Death, and In-Between: Meanings and Methods in Microbiology. Appl. Environ. Microbiol. 2011, 77, 5571–5576. [Google Scholar] [CrossRef] [Green Version]
  27. Branco, P.; Coutinho, R.; Malfeito-Ferreira, M.; Prista, C.; Albergaria, H. Wine Spoilage Control: Impact of Saccharomycin on Brettanomyces bruxellensis and Its Conjugated Effect with Sulfur Dioxide. Microorganisms 2021, 9, 2528. [Google Scholar] [CrossRef]
  28. Wei, R.; Chen, N.; Ding, Y.; Wang, L.; Liu, Y.; Gao, F.; Zhang, L.; Li, H.; Wang, H. Correlations between Microbiota with Physicochemical Properties and Volatile Compounds during the Spontaneous Fermentation of Cabernet Sauvignon (Vitis vinifera L.) Wine. LWT 2022, 163, 113529. [Google Scholar] [CrossRef]
  29. Granchi, L.; Bosco, M.; Messini, A.; Vincenzini, M. Rapid Detection and Quantification of Yeast Species during Spontaneous Wine Fermentation by PCR-RFLP Analysis of the RDNA ITS Region. J. Appl. Microbiol. 1999, 87, 949–956. [Google Scholar] [CrossRef]
  30. Rehan, M.; Younus, H. Effect of Organic Solvents on the Conformation and Interaction of Catalase and Anticatalase Antibodies. Int. J. Biol. Macromol. 2006, 38, 289–295. [Google Scholar] [CrossRef]
  31. Bonora, A.; Mares, D. A Simple Colorimetric Method for Detecting Cell Viability in Cultures of Eukaryotic Microorganisms. Curr. Microbiol. 1982, 7, 217–221. [Google Scholar] [CrossRef]
  32. Lanuti, P.; Simeone, P.; Rotta, G.; Almici, C.; Avvisati, G.; Azzaro, R.; Bologna, G.; Budillon, A.; Di Cerbo, M.; Di Gennaro, E.; et al. A Standardized Flow Cytometry Network Study for the Assessment of Circulating Endothelial Cell Physiological Ranges. Sci. Rep. 2018, 8, 5823. [Google Scholar] [CrossRef] [Green Version]
  33. Lanuti, P.; Rotta, G.; Almici, C.; Avvisati, G.; Budillon, A.; Doretto, P.; Malara, N.; Marini, M.; Neva, A.; Simeone, P.; et al. Endothelial Progenitor Cells, Defined by the Simultaneous Surface Expression of VEGFR2 and CD133, Are Not Detectable in Healthy Peripheral and Cord Blood. Cytom. Part A 2016, 89, 259–270. [Google Scholar] [CrossRef]
  34. Lanuti, P.; Ciccocioppo, F.; Bonanni, L.; Marchisio, M.; Lachmann, R.; Tabet, N.; Pierdomenico, L.; Santavenere, E.; Catinella, V.; Iacone, A.; et al. Amyloid-Specific T-Cells Differentiate Alzheimer’s Disease from Lewy Body Dementia. Neurobiol. Aging 2012, 33, 2599–2611. [Google Scholar] [CrossRef]
  35. Marchisio, M.; Simeone, P.; Bologna, G.; Ercolino, E.; Pierdomenico, L.; Pieragostino, D.; Ventrella, A.; Antonini, F.; Del Zotto, G.; Vergara, D.; et al. Flow Cytometry Analysis of Circulating Extracellular Vesicle Subtypes from Fresh Peripheral Blood Samples. Int. J. Mol. Sci. 2021, 22, 48. [Google Scholar] [CrossRef]
  36. Puca, V.; Ercolino, E.; Celia, C.; Bologna, G.; Di Marzio, L.; Mincione, G.; Marchisio, M.; Miscia, S.; Muraro, R.; Lanuti, P.; et al. Detection and Quantification of EDNA-Associated Bacterial Membrane Vesicles by Flow Cytometry. IJMS 2019, 20, 5307. [Google Scholar] [CrossRef] [Green Version]
  37. Rodrigues, N.; Goncalves, G.; Pereira-da-Silva, S.; Malfeito-Ferreira, M.; Loureiro, V. Development and Use of a New Medium to Detect Yeasts of the Genera Dekkera/Brettanomyces. J. Appl. Microbiol. 2001, 90, 588–599. [Google Scholar] [CrossRef] [Green Version]
  38. Cavazza, A.; Grando, M.; Zini, C. Rilevazione della Flora Microbica di Mosti e Vini. Vignevini 1992, 9, 17–20. [Google Scholar]
  39. De Man, J.C.; Rogosa, M.; Sharpe, M.E. A Medium for the Cultivation of Lactobacilli. J. Appl. Bacteriol. 1960, 23, 130–135. [Google Scholar] [CrossRef]
Figure 1. Flow cytometry detection of different B. bruxellensis strains. (ad) Four different B. bruxellensis strains were stained for flow cytometry analyses (Bb1, Bb2, Bb3, Bb4). For all strains, a morphologically homogeneous population (orange dots) of cells was identified on an FSC-A/SSC-A dot-plot (left images). Those cells were analyzed for the expression of B. bruxellensis antigens on left histograms (black curves represent the unstained controls, while the related stained samples were overlaid as red curves); (e) A sample of S. cerevisiae was used as a negative control.
Ijms 23 15091 g001
Figure 2. Flow cytometry detection of different B. bruxellensis concentrations (103 and 102 cell/mL) from pure cultures. The same B. bruxellensis strains reported in Figure 1 were analyzed at lower concentrations (103 and 102 cells/mL). The gating strategy used for the count is shown here: the homogeneous population of yeasts on the FSC-A/SSC-A dot-plot was gated (orange region) and shown on an FDA-A/SSC-A dot-plot. Events positive to the FDA staining (light blue gate) were identified as metabolically active yeasts and finally plotted on a dot-plot showing the staining of the B. bruxellensis specific antigens (blue gate). Data are representative of three separate experiments.
Ijms 23 15091 g002
Figure 3. Flow cytometry detection of B. bruxellensis in mixed cultures containing B. bruxellensis and S. cerevisiae. (a) Dot-plots, refer to two different separate experiments (EXP1 and EXP2). The gating strategy is shown for both experiments: on a dot-plot FSC-A/SSC-A the yeast populations were morphologically identified, then yeasts positive to the FDA were selected (light blue gates) and metabolically active yeasts were analyzed for the B. bruxellensis antigens. (b) The table shows the FSC-A Mean Fluorescence Intensity values, both for B. bruxellensis (Bretta +) and for S. cerevisiae.
Ijms 23 15091 g003
Figure 4. Flow Cytometry B. bruxellensis detection in wine samples. (a) The contour plot anti-Bretta/SSC-A represents a sample containing a mix of B. bruxellensis and S. cerevisiae. The plot shows the population of B. bruxellensis yeasts in the purple gate and the S. cerevisiae staining negative to the anti-Bretta antibody (at the left side of the purple gate). (b) The contour plot anti-Bretta/SSC-A represents a sample containing a pure population of B. bruxellensis. The plot shows the population of B. bruxellensis yeasts in the purple gate. (c) The dot-plot anti-Bretta/FDA shows the acquisition of a sterile wine sample. (d) The dot-plot SSC-A/FSC-A shows the scatter parameters of a sample containing a mix of B. bruxellensis and O. oeni. The grey gate contains the smaller detectable particles (O. oeni), while the orange gate contains the B. bruxellensis population of yeasts.
Ijms 23 15091 g004
Figure 5. The concentrations of the total live cells (a) and B. bruxellensis (b) in artificially contaminated wine samples (samples 1–3) were carried out both by flow cytometry (black bars, FC, Log Cells/mL) and plate counts (grey bars, Log CFU/mL). The concentrations of total live cells (c) and B. bruxellensis (d) in naturally contaminated wine samples (samples 5–7) were carried out both by flow cytometry (black bars, FC, Log Cells/mL) and plate counts (grey bars, Log CFU/mL). Bars with different letters indicate significant differences (t-test, p < 0.05).
Ijms 23 15091 g005
Table 1. Wine samples are artificially inoculated with a pure culture of B. bruxellensis (1) and with mixed yeast cultures (2 and 3).
Wine SampleInoculated CellsConcentration
(Cells/mL)
S1B. bruxellensis8 × 105
S2B. bruxellensis8 × 104
S. cerevisiae8 × 103
S3B. bruxellensis8 × 103
S. cerevisiae8 × 103
Pichia spp.8 × 103
Table 2. Wine samples naturally contaminated by only B. bruxellensis or by B. bruxellensis and other yeast species or by B. bruxellensis and O. oeni.
Wine SampleInoculated CellsConcentration
(Cells/mL)
SW5B. bruxellensis(6.0 ± 0.3) × 103
SW6B. bruxellensis(3.9 ± 0.1) × 104
O. oeni(3.3 ± 0.3) × 103
SW7B. bruxellensis(9.4 ± 0.5) × 102
Pichia spp.(2.6 ± 0.7) × 102
Publisher’s Note: MDPI stays neutral with regard to jurisdictional claims in published maps and institutional affiliations.

