
Clinically Applicable Assessment of Tisagenlecleucel CAR T Cell Treatment by Digital Droplet PCR for Copy Number Variant Assessment

 ,
,
Abstract
:1. Introduction
2. Results
3. Discussion
- (i)
- Flow cytometry assays work similarly to ddPCR to detect and quantify the fluorescence signal in the stained test set (CD19 for tisagenlecleucel). Here, cells are used directly. However, sample handling and processing, as well as assay times, can prove time consuming, and the results are less consistent than those of molecular assays. Flow cytometry techniques are operator dependent and difficult to standardize, and they have been proven before to be quantitatively less accurate than molecular assays [5,23].
- (ii)
- qPCR is fast and inexpensive. It is a well suited technique for the quantification of CAR T cell CNV. However, standards are needed for qPCR, and its sensitivity has been shown to be lower than that of ddPCR. In addition, more starting material is needed for qPCR [24].
- (iii)
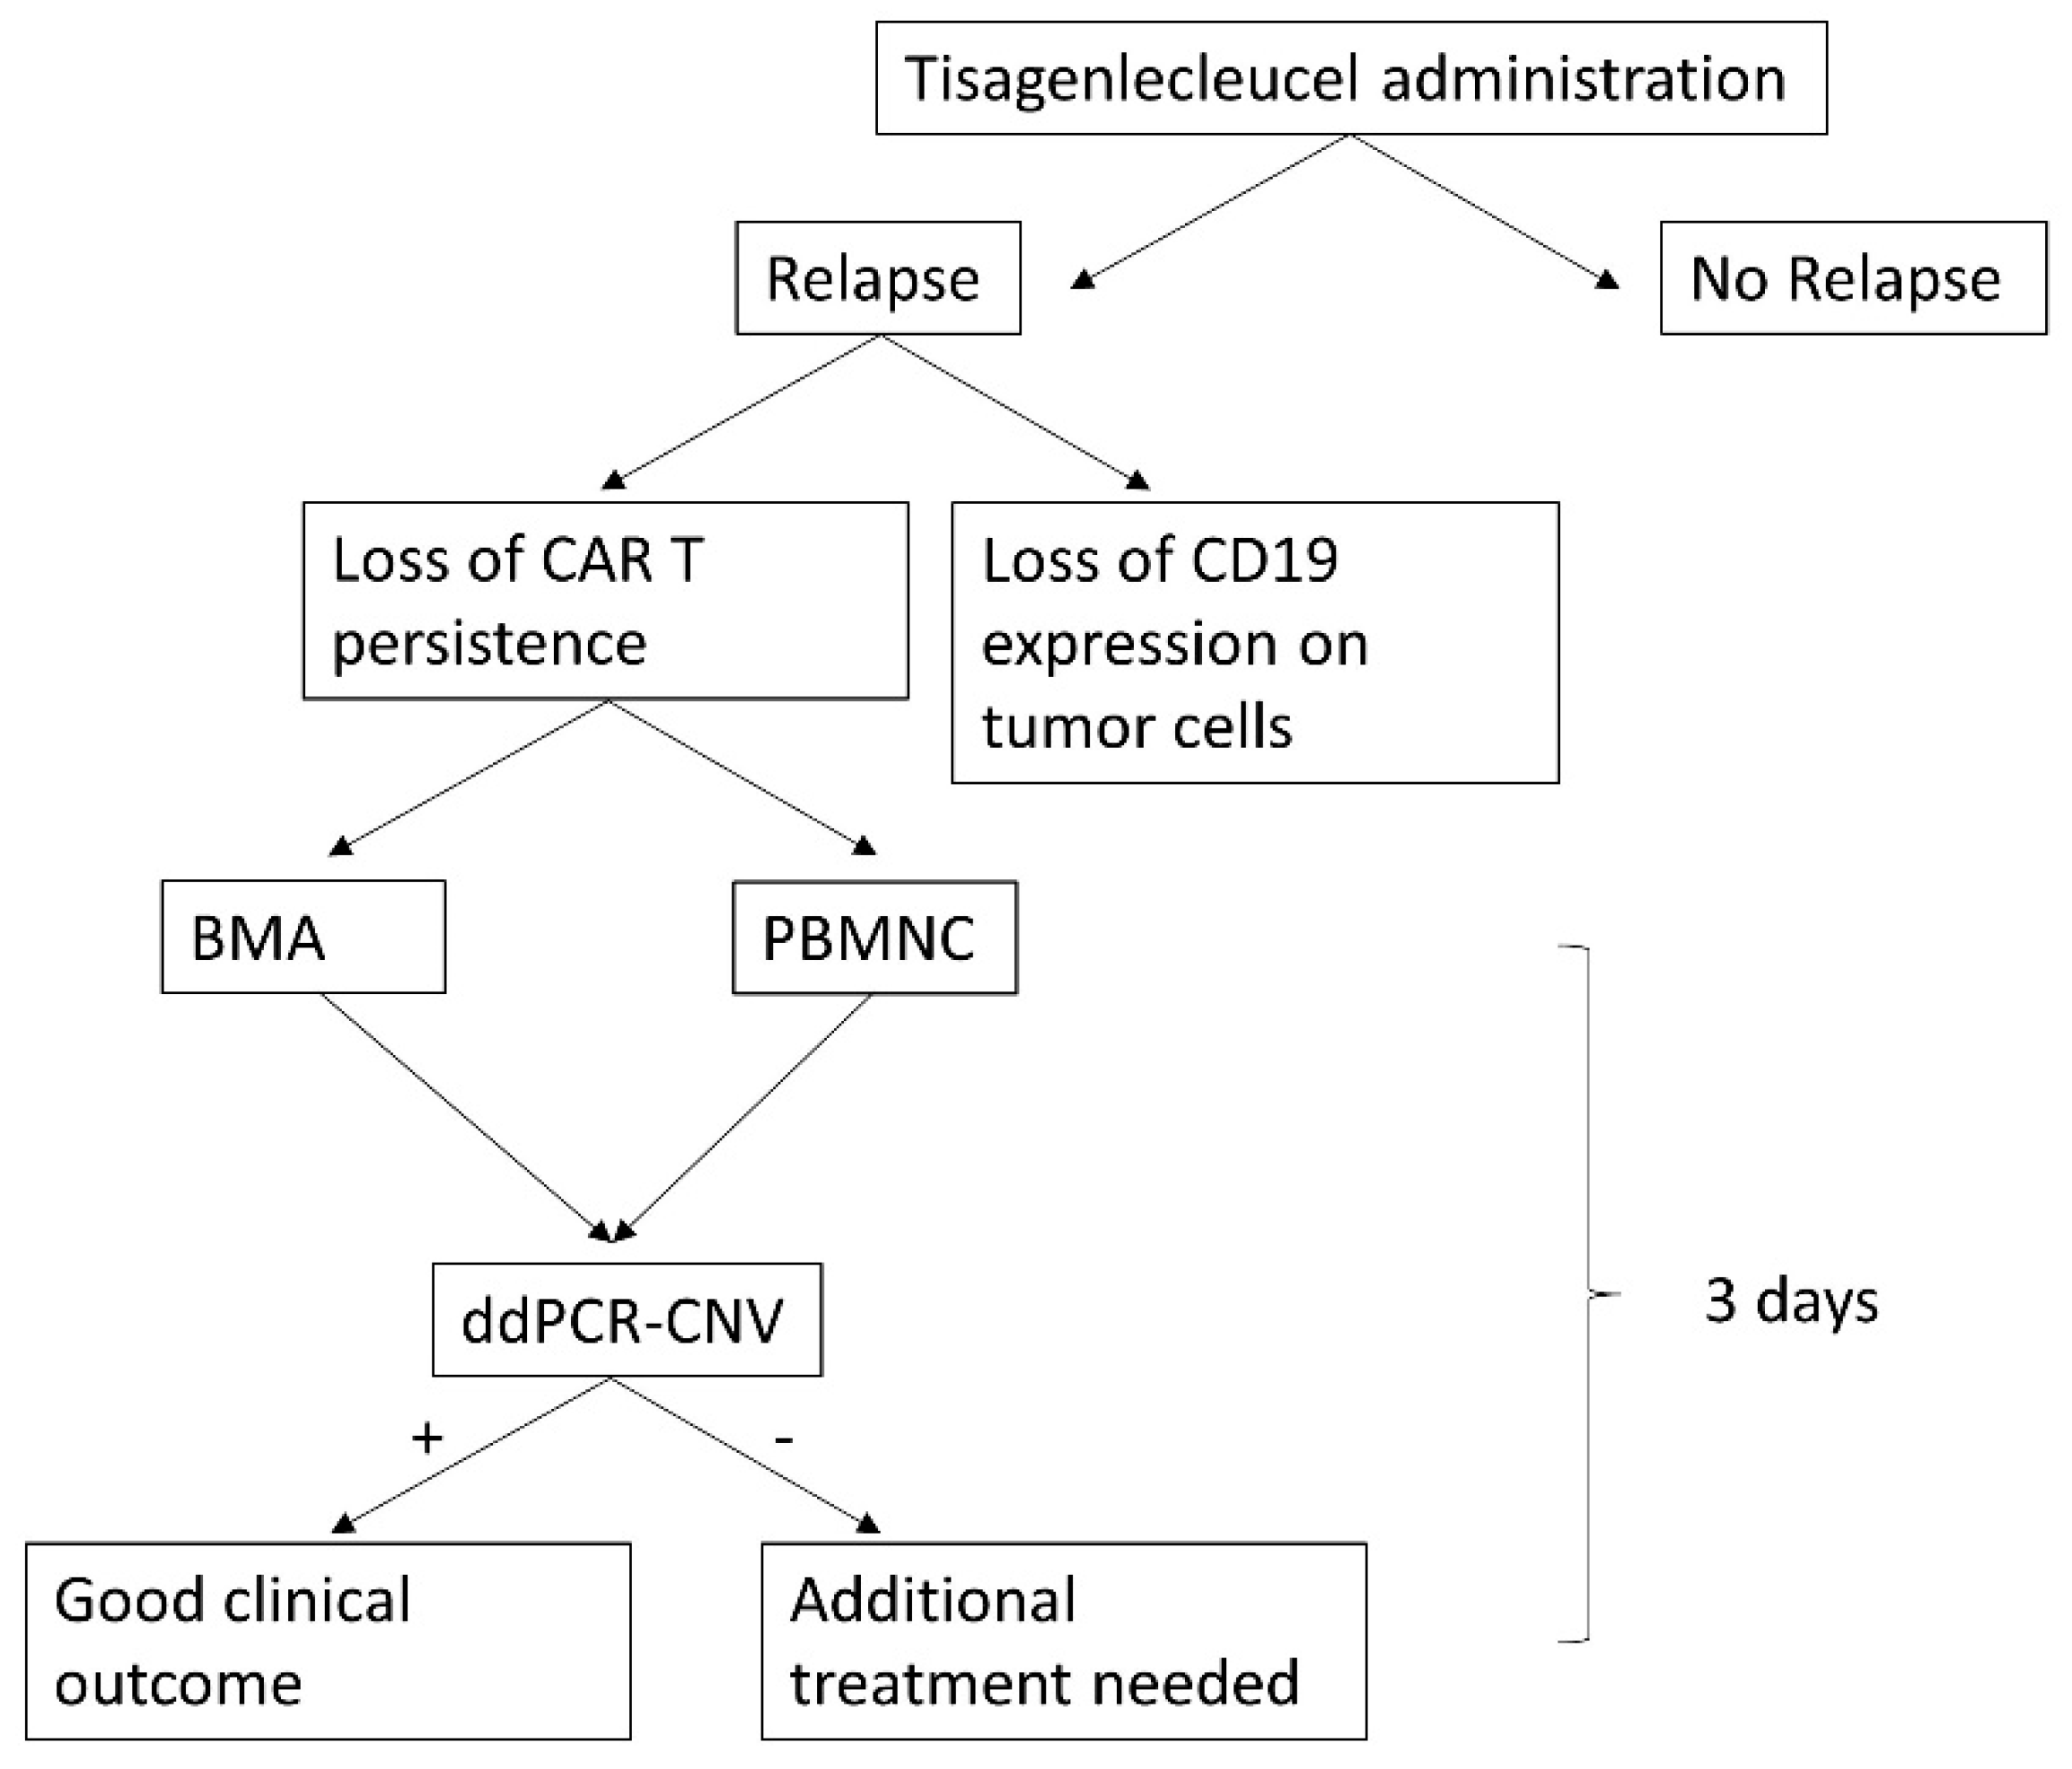
- ddPCR-CNV offers a quick, reliable method for the detection of CAR T cell persistence. Similar assays have been described both theoretically and methodologically elsewhere [15,20], demonstrating that ddPCR is often more robust than qPCR while requiring lower input of DNA. ddPCR-CNV requires access to specialized equipment. The tool combines high sensitivity with excellent accuracy; it is comparatively fast (results are available within <3 days from sample collection and receival in the lab, Appendix D) and inexpensive (approximately $3.6 per sample). Thus, it represents an excellent alternative to the existing methods for patient disease monitoring and can provide real-time assessment of disease in patients, which will significantly benefit clinical teams with treatment options and clinical management of the patient.
4. Materials and Methods
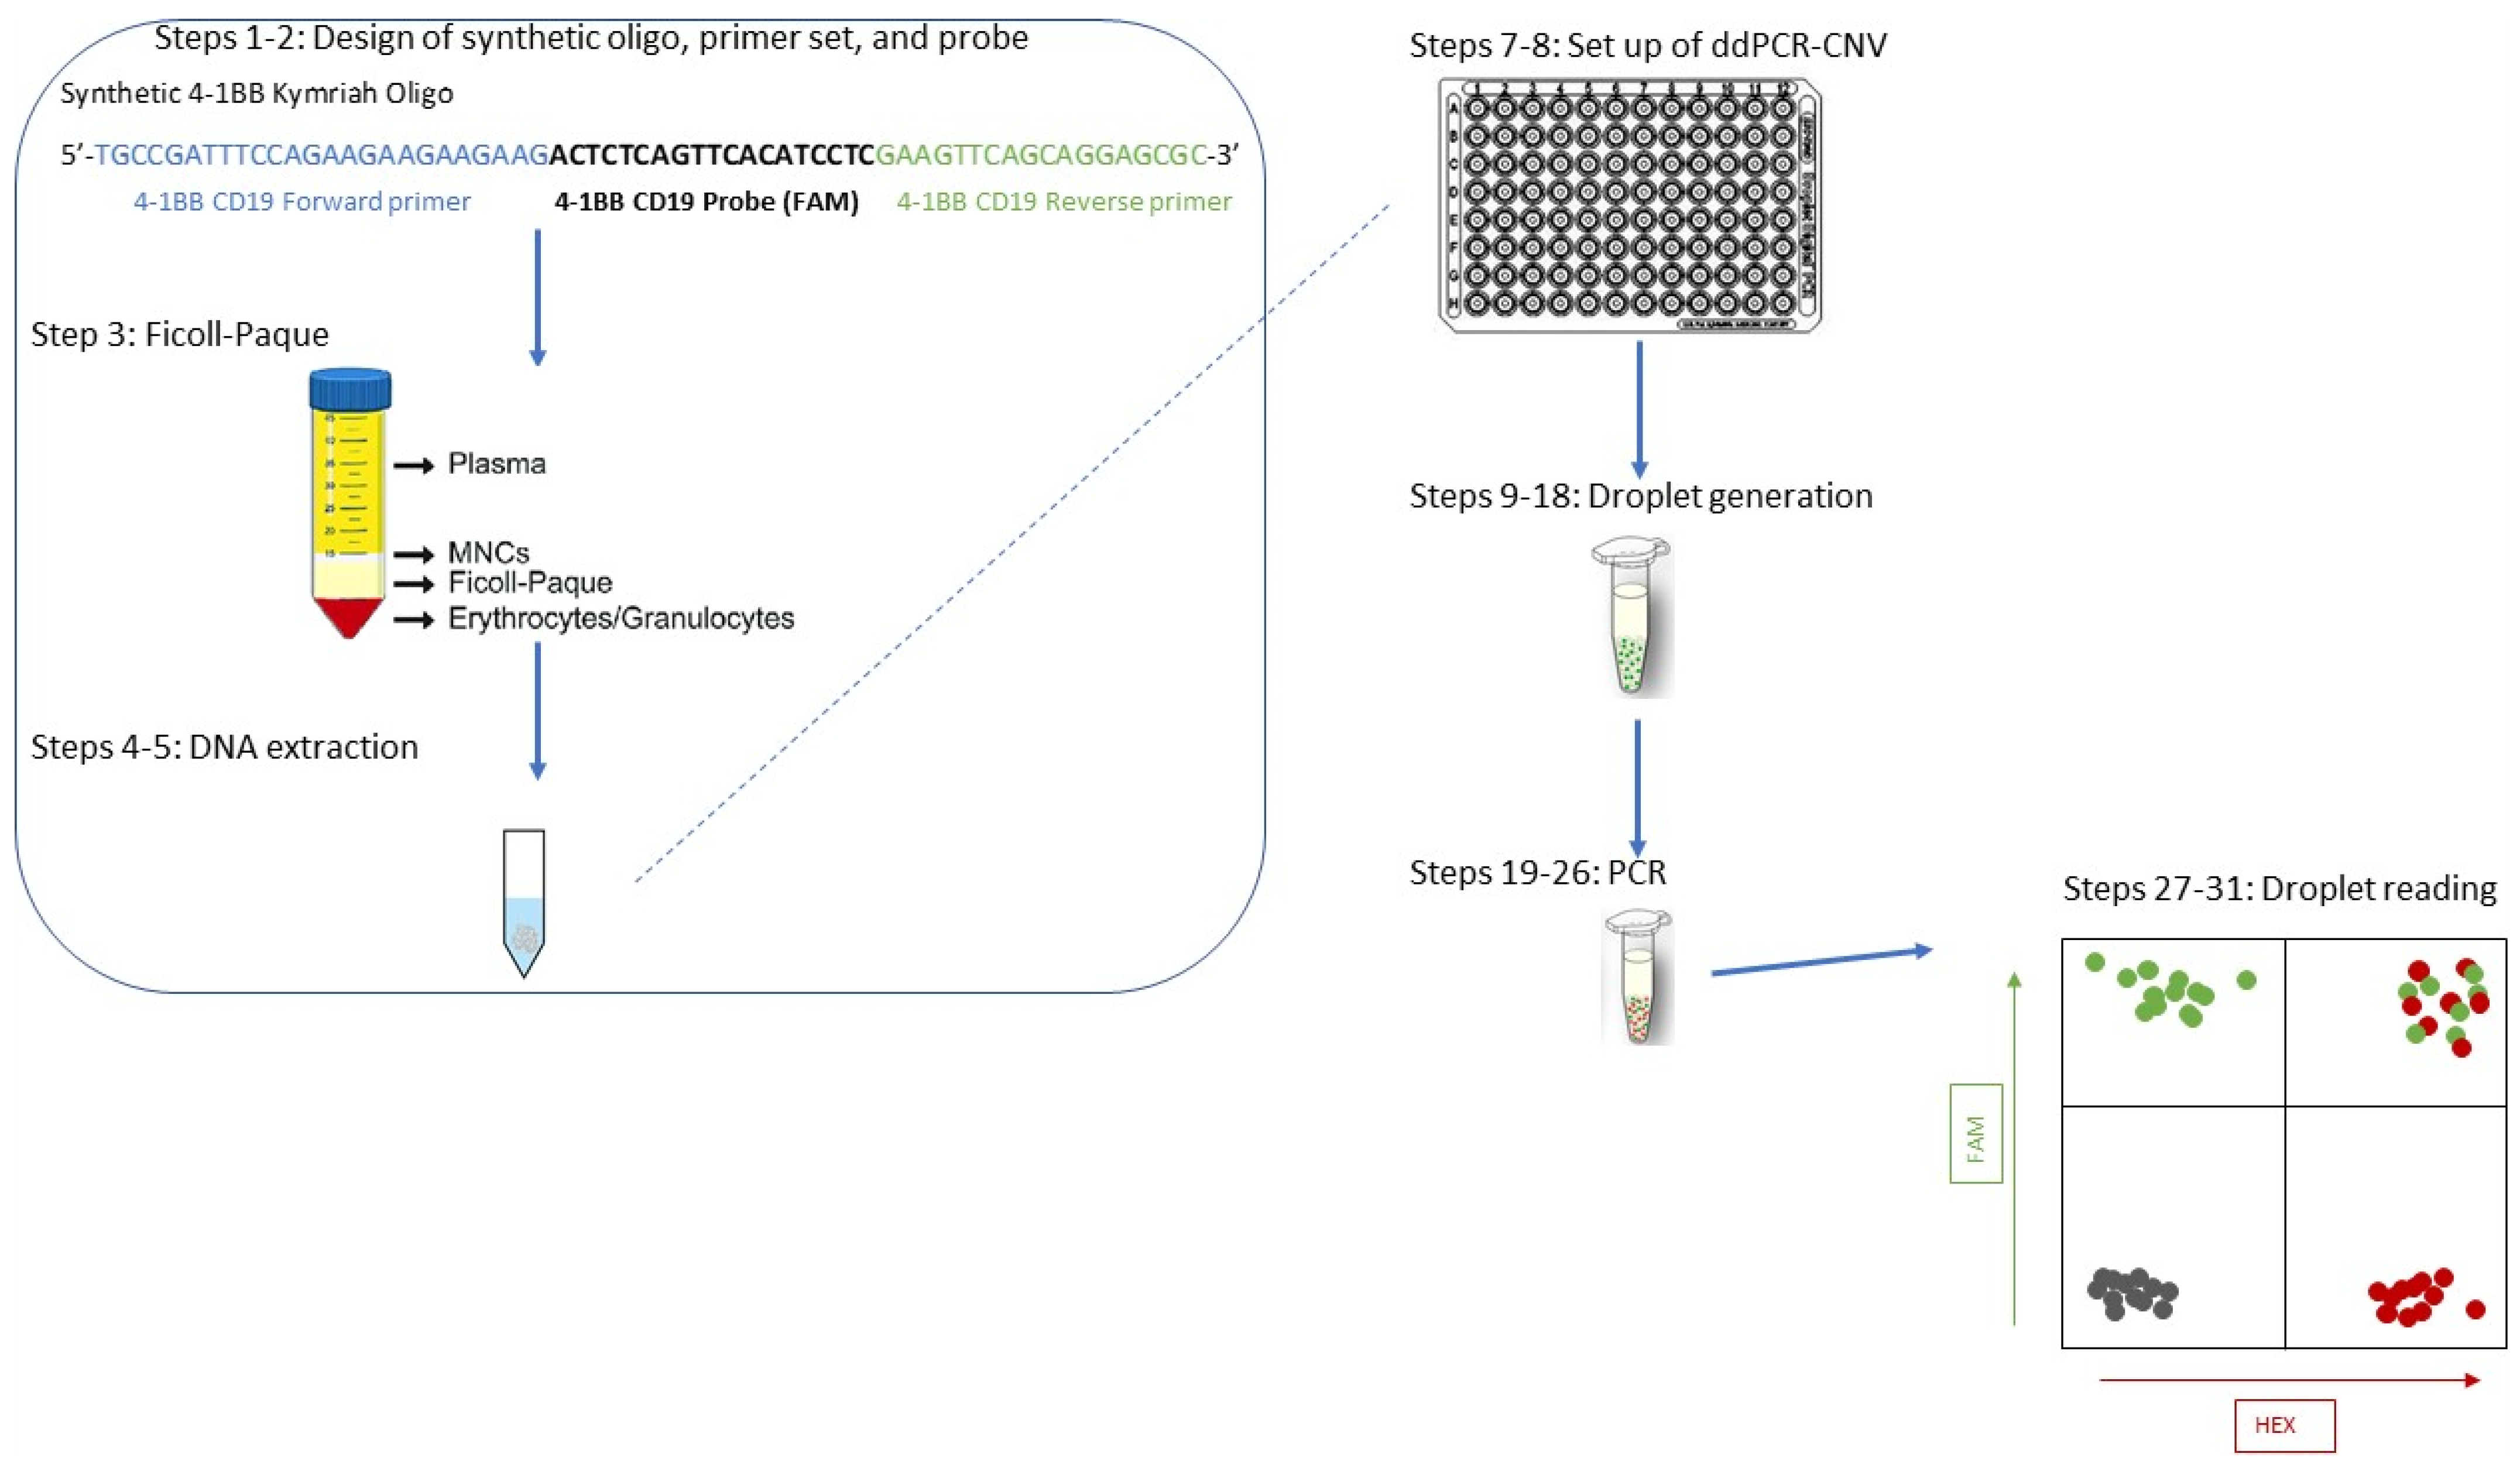
4.1. Primer, Probe, and Synthetic Oligonucleotide Design (Steps 1–3)
- (i)
- The size of the PCR product should ideally be <100 bp (the oligo here was 62 bp). Note that the shorter the product, the higher the efficiency of the technique (Bio-R).
- (ii)
- The GC content of the PCR product should ideally be 40–60%.
- (iii)
- Secondary structures should be avoided.
- (iv)
- Primer length should be 18–25 nucleotides, with a GC content of 50–60%.
- (v)
- Primers should not contain long stretches of Gs or Cs (longer than 3 bases).
- (vi)
- If possible, Gs and Cs should be placed at the ends of the primers (but no more than a stretch of 2).
- (vii)
- Primer annealing temperature should be ~60 °C.
- (viii)
- To exclude the formation of primer dimers, 3′ complementarity of forward and reverse primers should be avoided.
- (i)
- The probe must be located between the two primers.
- (ii)
- The probe sequence cannot overlap with either primer but can be directly adjacent to either or both.
- (iii)
- The probe should be shorter than 30 nucleotides, as it has been shown that longer distances between the fluorophore and quencher can increase background signal intensity.
- (iv)
- Tm (probe) should be ~5 degrees higher than those of the primers; i.e., Tm (probe) should be ~65 °C if the Tms of the primers are ~60 °C. If this is impossible, a range of 3–10 °C is still considered acceptable.
- (v)
- GC content should be 40–60 °C.
- (vi)
- Probes should not have a G at the 3′ or 5′ ends.
- (vii)
- Probe labelling: as ddPCR-CNV is based on a duplex assay, the probes should be labelled with either FAM or HEX. Alternatively to HEX, VIC can be used. A HEX and VIC probe should not be combined in the same assay.
- (viii)
- Nonfluorescent quenchers (e.g., BHQ or DDQ) should be used. Quenchers are essential for blocking the fluorescence signal, and they are usually at the 3′ end, whereas the fluorescent label is at the opposite side, the 5′ end. These need to be chosen during the ordering process. MGB and LNA probes are also options; they are usually shorter than standard ones.
4.2. Sample Preparation (Steps 4–5)
4.3. Digital Droplet PCR (DDPCR)—Steps 6–9
- (i)
- A droplet generator for partitioning the PCR mix.
- (ii)
- A heat sealer to seal the PCR plate using a special tinfoil sealer to avoid loss of product during the following step, the PCR. The sealer is perforated by the droplet generator upon PCR finalization.
- (iii)
- A thermocycler, needed to perform the PCR reaction. In general, a standard PCR device should suffice; however, this protocol was performed on a QX200 Bio-Rad PCR machine. Optimization of conditions may be needed when using different thermocyclers.
- (iv)
- A droplet reader (similar to a flow cytometer). It is noteworthy that droplets are stable up to 48 h at 4 °C after the thermocycling reaction.
4.4. ddPCR Analysis
- (1)
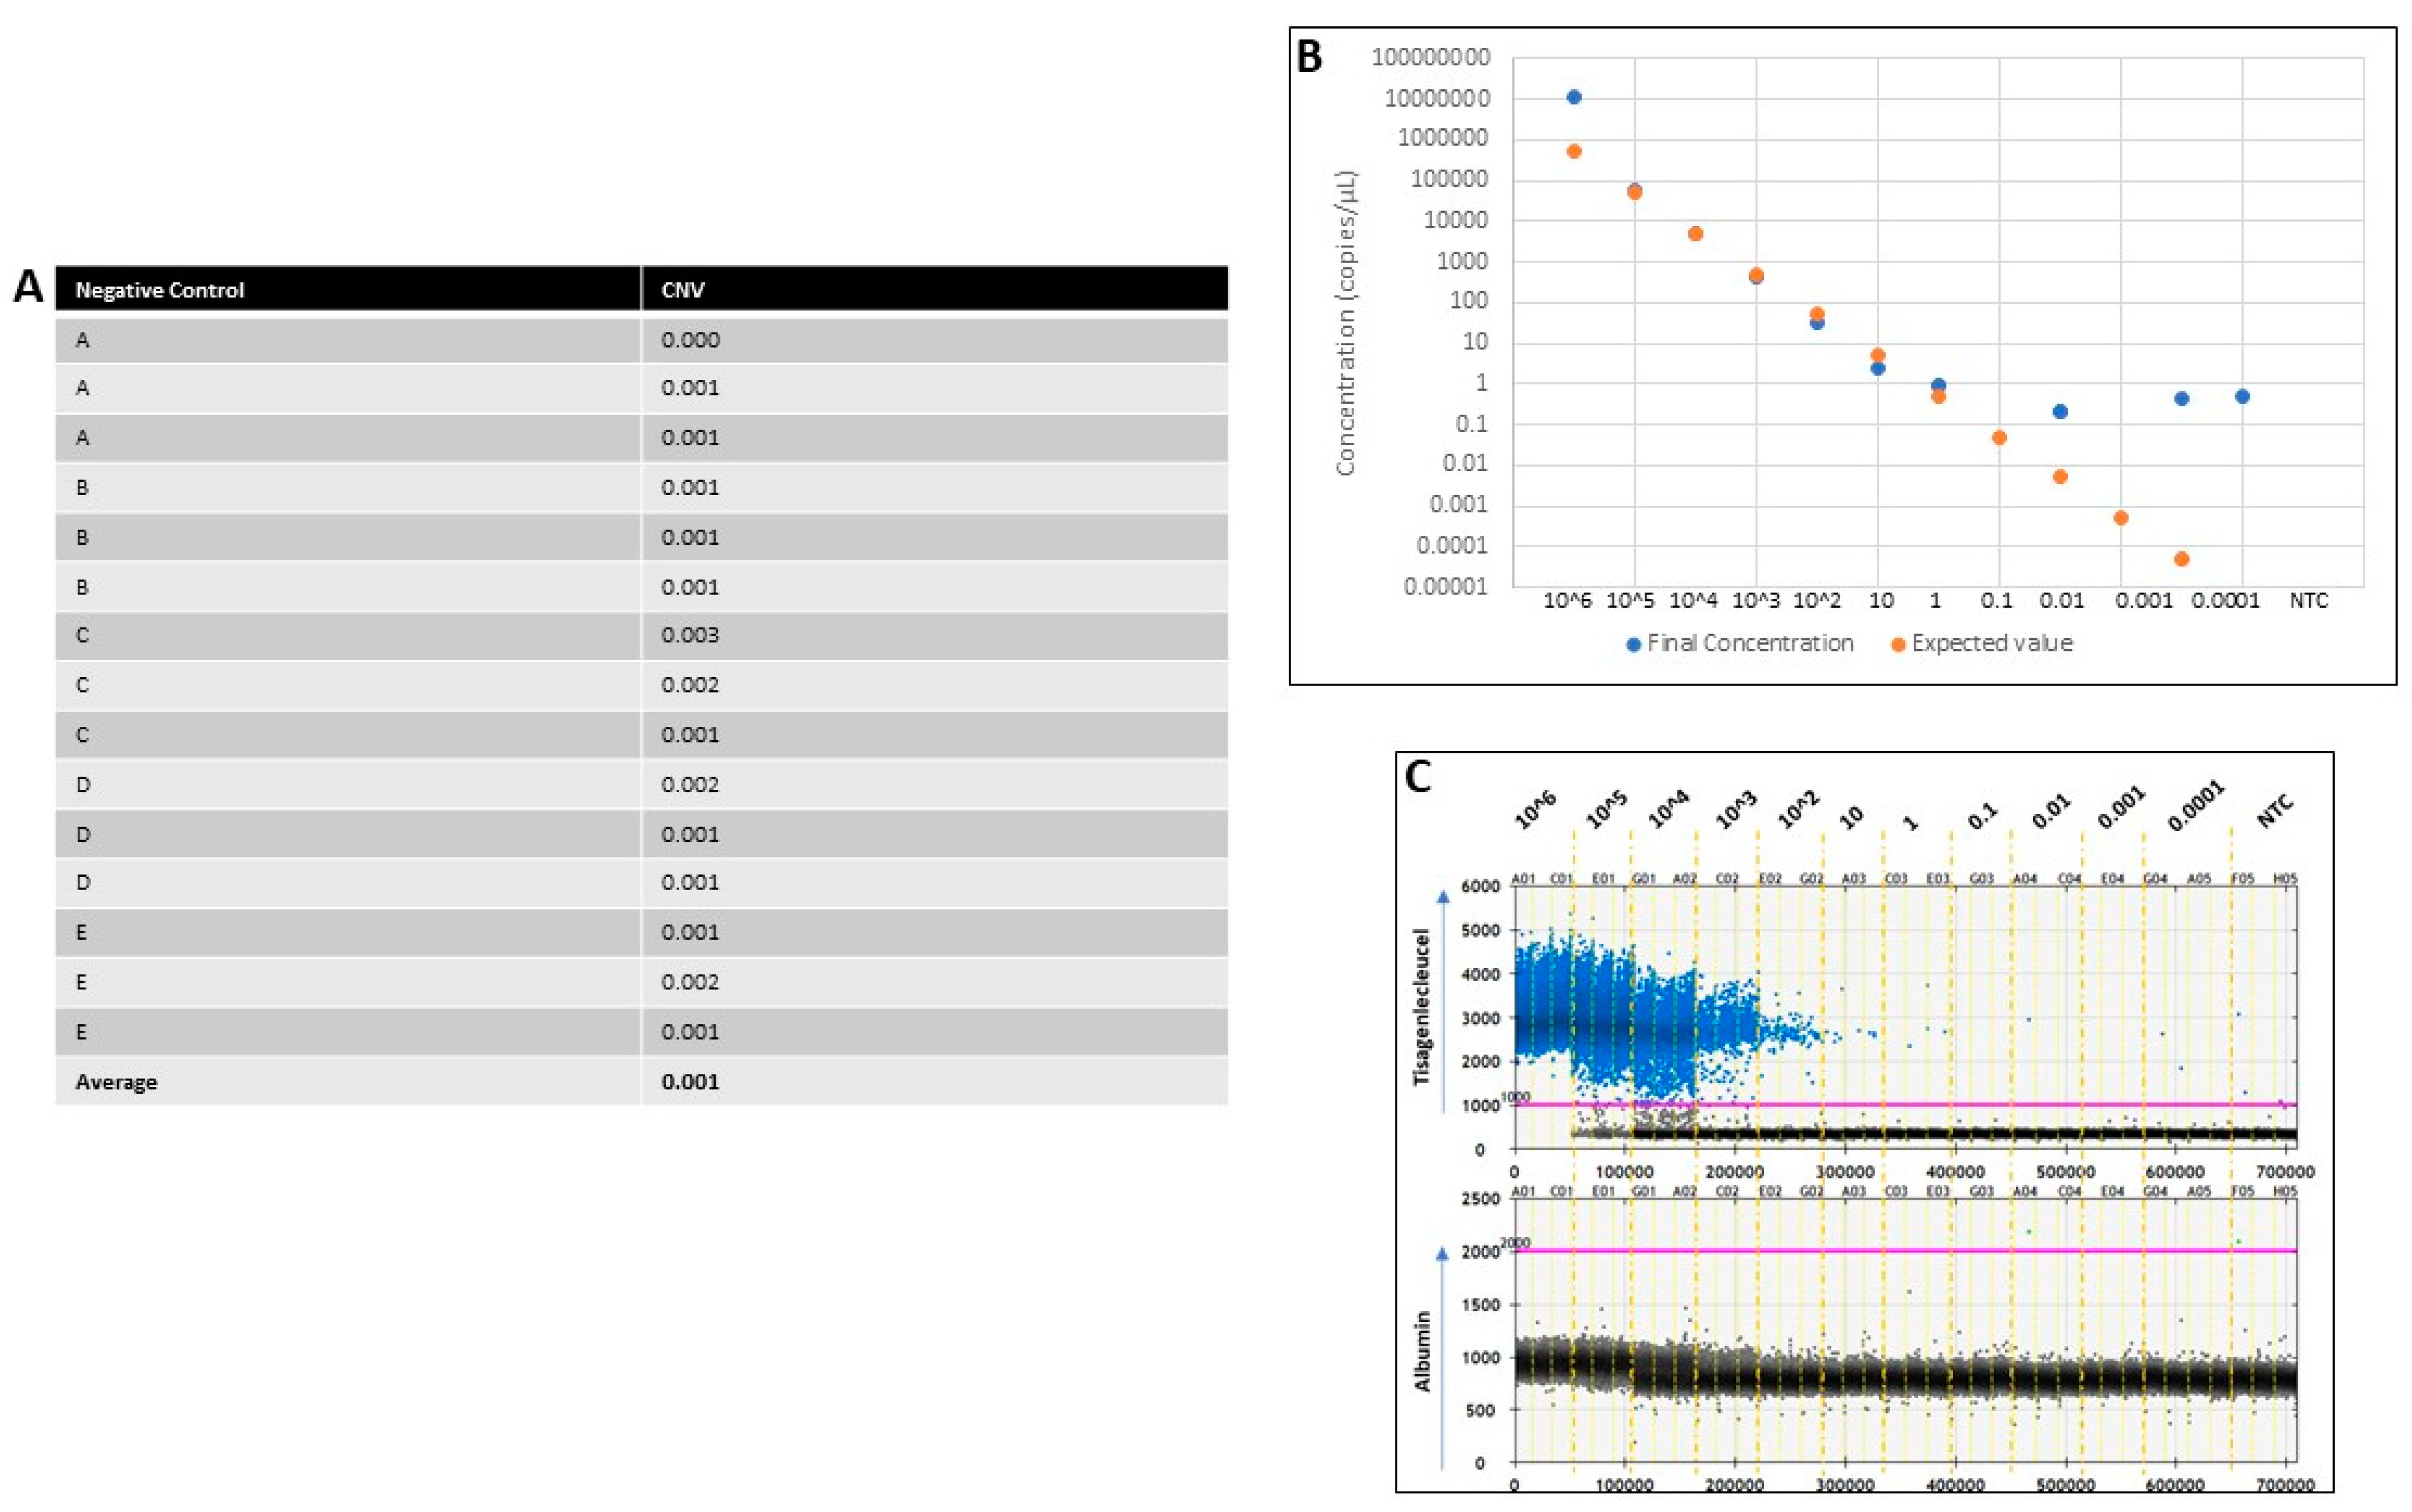
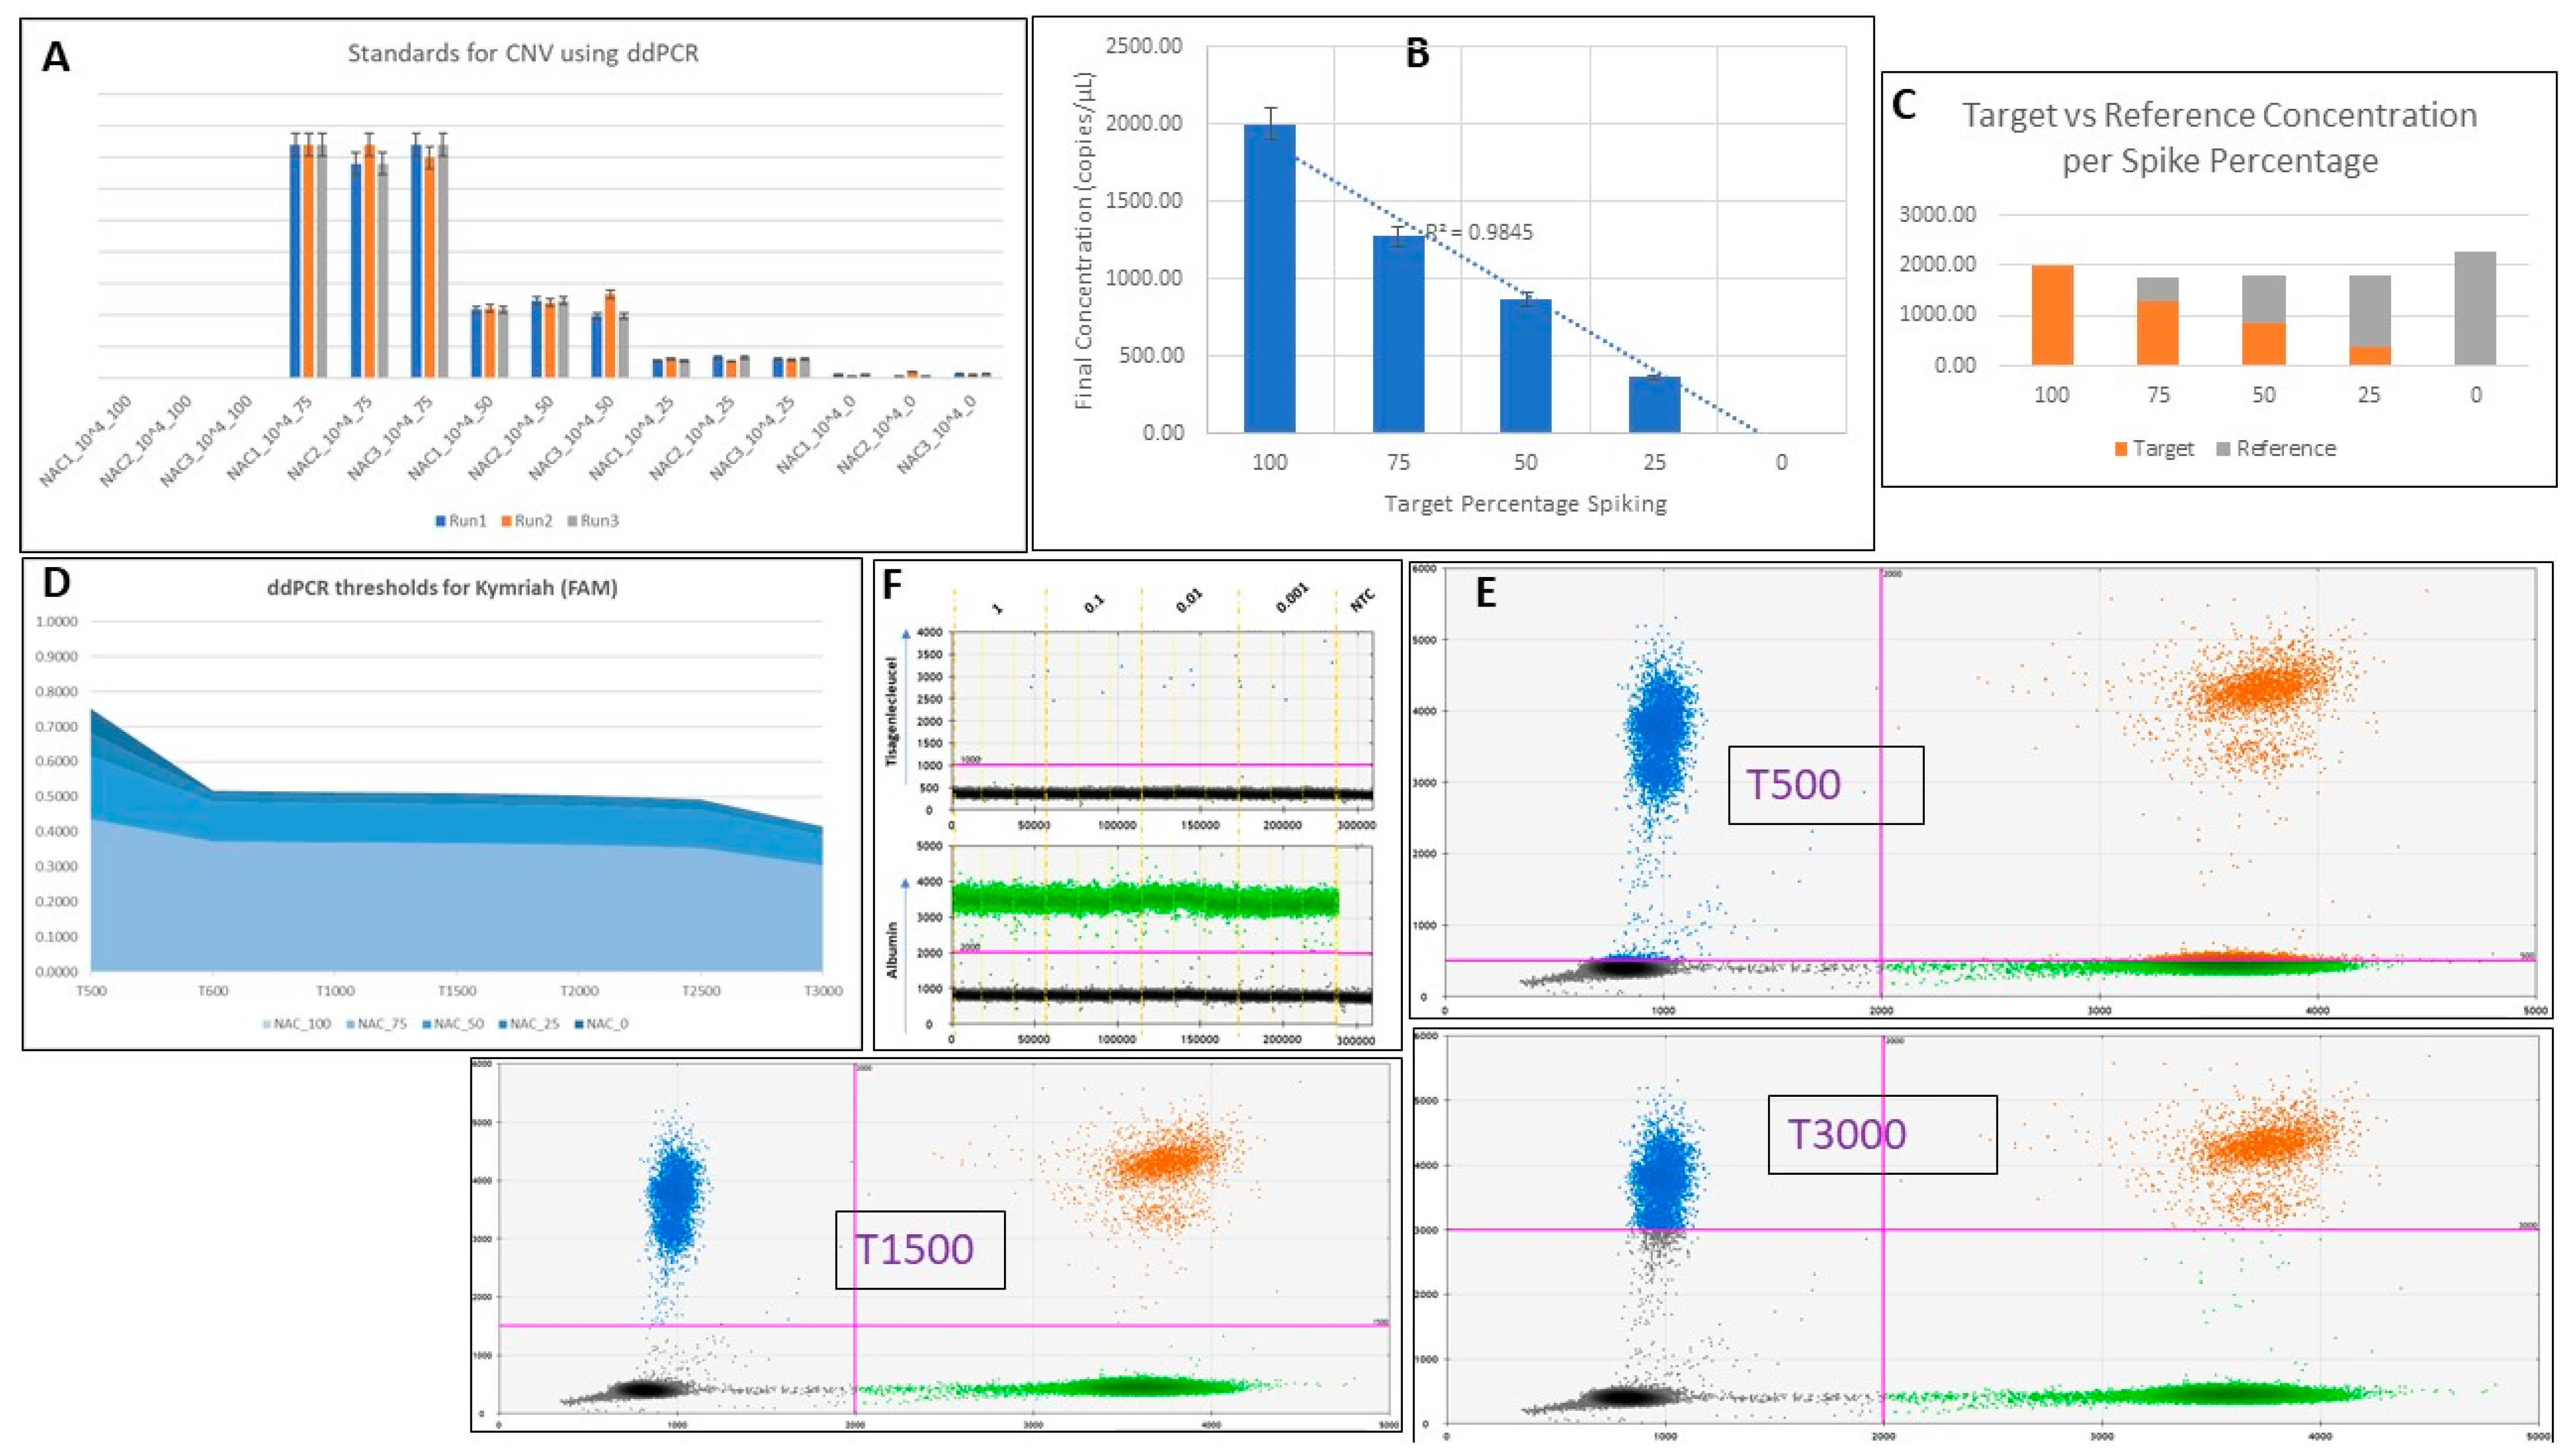
- NTCs were highlighted, and the 2D Amplitude tab (dot-plot) was selected, where a clear distinction between negative and single- or double-positive droplets was made. The middle of the quadrant gate was positioned close to the lower right corner of the negative population. The threshold levels for channels 1 and 2 were set using the quadrant gate option (multiwell thresholding selection).
- (2)
- The threshold we routinely used was 600–700 for channel 1 (FAM dye—the 4-1BB-specific probe) and 2000 for channel 2 (HEX dye—the probe for the albumin reference gene).
- (3)
- All samples then had the thresholds set as described in step 1.
- (4)
- The 4-1BB-specific events were represented in the entire top panel of the quadrant, both as single positives for FAM and as double positives for both FAM and HEX. Single HEX positives were the reference.
- (5)
- CNV was calculated.
4.5. QuantaSoft Software
4.6. Statistics
Author Contributions
Funding
Institutional Review Board Statement
Informed Consent Statement
Data Availability Statement
Acknowledgments
Conflicts of Interest
Appendix A
| Sample | Positives | Negatives | Ch1+/Ch2+ | Ch1+/Ch2- | Ch1-/Ch2+ | Ch1-/Ch2- |
| 1 copy/µL | 1 | 18,460 | 0 | 1 | 3373 | 15,087 |
| 1 copy/µL | 0 | 19,185 | 0 | 0 | 3246 | 15,939 |
| 1 copy/µL | 2 | 19,287 | 1 | 1 | 3737 | 1550 |
| 0.1 copy/µL | 2 | 19,358 | 1 | 1 | 3340 | 16,018 |
| 0.1 copy/µL | 1 | 19,510 | 0 | 1 | 3463 | 16,047 |
| 0.1 copy/µL | 1 | 19,400 | 0 | 1 | 3237 | 16,163 |
| 0.01 copy/µL | 2 | 19,067 | 0 | 2 | 3448 | 15,619 |
| 0.01 copy/µL | 2 | 19,327 | 0 | 2 | 3233 | 16,094 |
| 0.01 copy/µL | 1 | 19,517 | 0 | 1 | 4050 | 15,467 |
| 0.001 copy/µL | 2 | 19,806 | 0 | 2 | 3619 | 16,187 |
| 0.001 copy/µL | 2 | 19,452 | 0 | 2 | 4137 | 15,315 |
| 0.001 copy/µL | 2 | 19,554 | 2 | 0 | 4111 | 15,443 |
| NTC | 0 | 19,972 | 0 | 0 | 0 | 19,972 |
Appendix B

| Reagents | Catalogue Number | Supplier |
|---|---|---|
| ddPCR supermix for probes | 1863023 | Bio-Rad |
| Droplet generation oil for probes for AutoDG | 1864110 | Bio-Rad |
| Droplet reader oil | 1863004 | Bio-Rad |
| DNase-free, RNase-free water | P1193 | Promega |
Appendix C
| Consumables | Catalogue Number | Supplier |
|---|---|---|
| ddPCR 96-well plates | 12001925 | Bio-Rad |
| Pierceable heat seal foil for PCR plates | 1814040 | Bio-Rad |
| Sterile, RNase-free, DNase-free Eppendorfs (1.5 mL) | AM12400 | Ambion |
| Sterile, RNase-free, DNase-free filter tips (p10, p20, p200, p1000) | S11203810 S11201810 S11208810 S11221830 | Starlab |
| Pipette tips for Auto DG | 1864120/121 | Bio-Rad |
| DG32 cartridges for Auto DG | 1864108/109 | Bio-Rad |
Appendix D
Appendix E
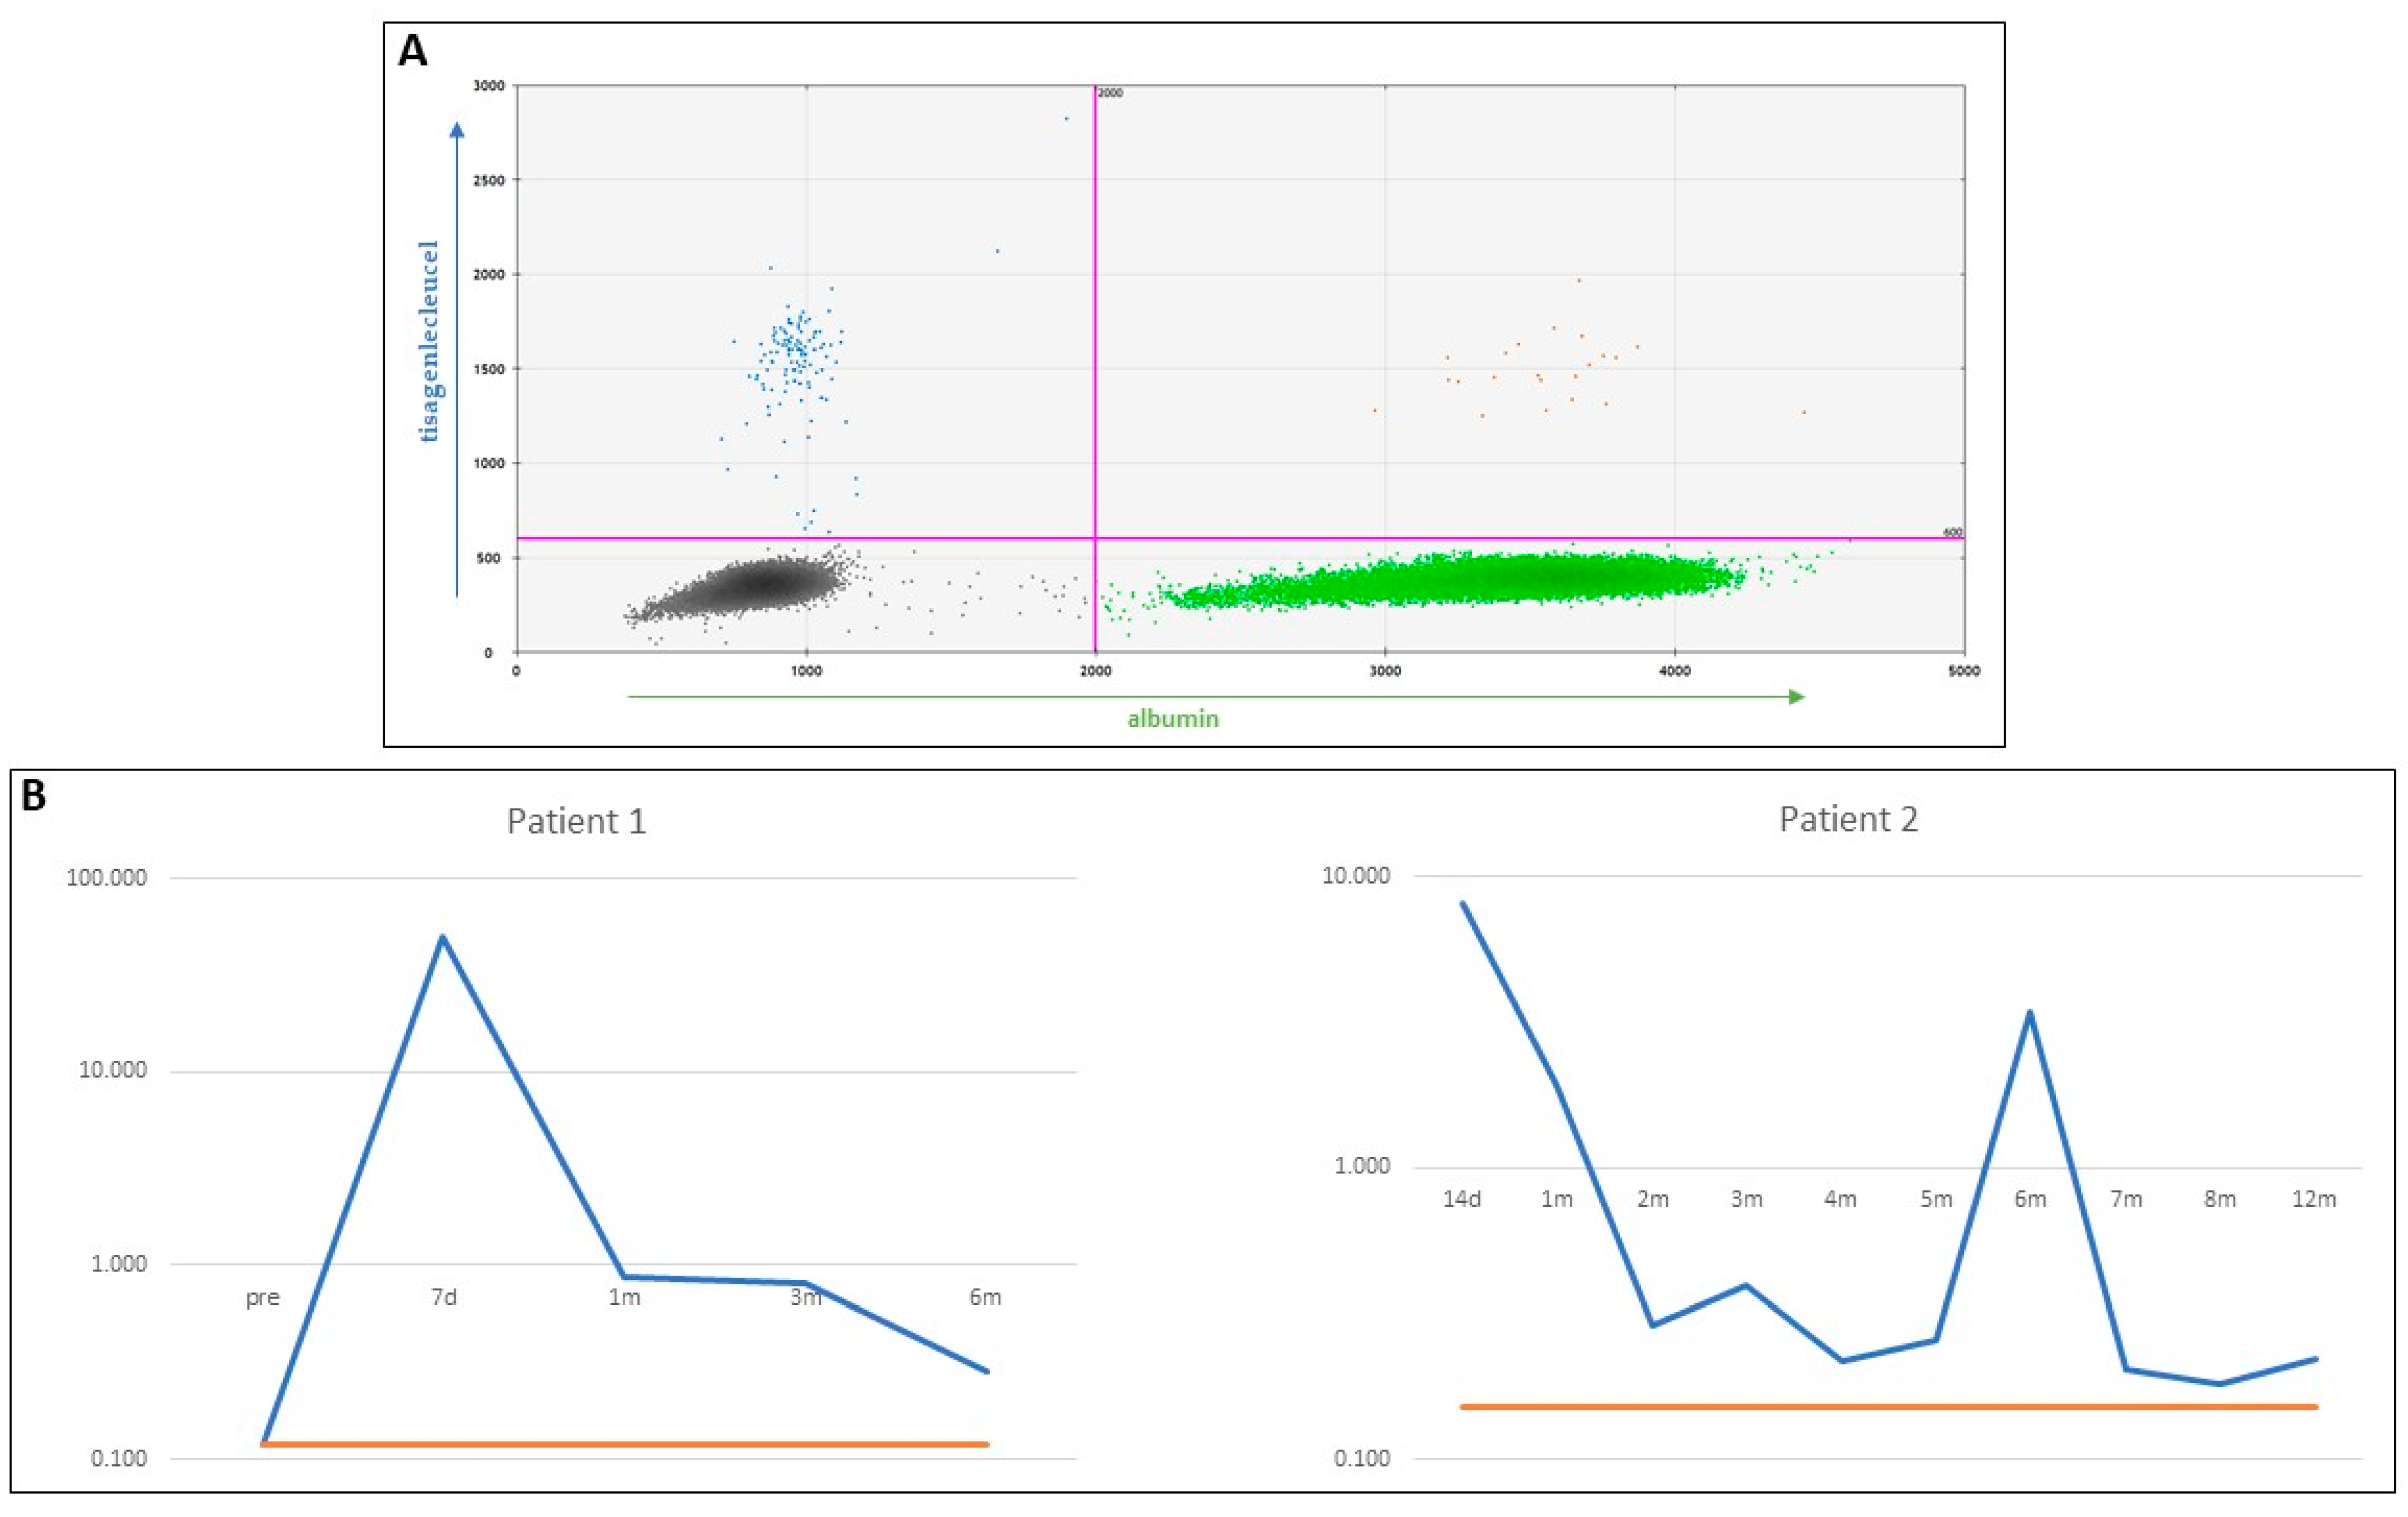
| Patient 1 | Patient 2 | ||||
| Time Points | CNV | LoQ | Time Points | CNV | LoQ |
| pre | 0.120 | 0.12 | 14 d | 8.100 | 0.15 |
| 7 d | 50.567 | 0.12 | 1 m | 1.933 | 0.15 |
| 1 m | 0.877 | 0.12 | 2 m | 0.287 | 0.15 |
| 3 m | 0.800 | 0.12 | 3 m | 0.397 | 0.15 |
| 6 m | 0.287 | 0.12 | 4 m | 0.217 | 0.15 |
| 5 m | 0.257 | 0.15 | |||
| 6 m | 3.400 | 0.15 | |||
| 7 m | 0.203 | 0.15 | |||
| 8 m | 0.180 | 0.15 | |||
| 12 m | 0.220 | 0.15 | |||
References
- Ghorashian, S.; Kramer, A.M.; Onuoha, S.; Wright, G.; Bartram, J.; Richardson, R.; Albon, S.J.; Casanovas-Company, J.; Castro, F.; Popova, B.; et al. Enhanced CAR T cell expansion and prolonged persistence in pediatric patients with ALL treated with a low-affinity CD19 CAR. Nat. Med. 2019, 25, 1408–1414. [Google Scholar] [CrossRef] [PubMed]
- Maude, S.L.; Laetsch, T.W.; Buechner, J.; Rives, S.; Boyer, M.; Bittencourt, H.; Bader, P.; Verneris, M.R.; Stefanski, H.E.; Myers, G.D.; et al. Tisagenlecleucel in Children and Young Adults with B-Cell Lymphoblastic Leukemia. N. Engl. J. Med. 2018, 378, 439–448. [Google Scholar] [CrossRef] [PubMed]
- Qasim, W.; Zhan, H.; Samarasinghe, S.; Adams, S.; Amrolia, P.; Stafford, S.; Butler, K.; Rivat, C.; Wright, G.; Somana, K.; et al. Molecular remission of infant B-ALL after infusion of universal TALEN gene-edited CAR T cells. Sci. Transl. Med. 2017, 9, eaaj2013. [Google Scholar] [CrossRef] [PubMed]
- Milone, M.C.; Fish, J.D.; Carpenito, C.; Carroll, R.G.; Binder, G.K.; Teachey, D.; Samanta, M.; Lakhal, M.; Gloss, B.; Danet-Desnoyers, G.; et al. Chimeric Receptors Containing CD137 Signal Transduction Domains Mediate Enhanced Survival of T Cells and Increased Antileukemic Efficacy In Vivo. Mol. Ther. 2009, 17, 1453–1464. [Google Scholar] [CrossRef]
- Orlando, E.J.; Han, X.; Tribouley, C.; Wood, P.A.; Leary, R.J.; Riester, M.; Levine, J.E.; Qayed, M.; Grupp, S.A.; Boyer, M.; et al. Genetic mechanisms of target antigen loss in CAR19 therapy of acute lymphoblastic leukemia. Nat. Med. 2018, 24, 1504–1506. [Google Scholar] [CrossRef]
- Fraietta, J.A.; Lacey, S.F.; Orlando, E.J.; Pruteanu-Malinici, I.; Gohil, M.; Lundh, S.; Boesteanu, A.C.; Wang, Y.; O’Connor, R.S.; Hwang, W.-T.; et al. Determinants of response and resistance to CD19 chimeric antigen receptor (CAR) T cell therapy of chronic lymphocytic leukemia. Nat. Med. 2018, 24, 563–571. [Google Scholar] [CrossRef]
- Fraietta, J.A.; Nobles, C.L.; Sammons, M.A.; Lundh, S.; Carty, S.A.; Reich, T.J.; Cogdill, A.P.; Morrissette, J.J.D.; DeNizio, J.E.; Reddy, S.; et al. Disruption of TET2 promotes the therapeutic efficacy of CD19-targeted T cells. Nature 2018, 558, 307–312. [Google Scholar] [CrossRef]
- Dourthe, M.; Rabian, F.; Yakouben, K.; Chevillon, F.; Cabannes-Hamy, A.; Méchinaud, F.; Grain, A.; Chaillou, D.; Rahal, I.; Caillat-Zucman, S.; et al. Determinants of CD19-positive vs CD19-negative relapse after tisagenlecleucel for B-cell acute lym-phoblastic leukemia. Leukemia 2021, 35, 3383–3393. [Google Scholar] [CrossRef]
- Pulsipher, M.A.; Han, X.; Maude, S.L.; Laetsch, T.W.; Qayed, M.; Rives, S.; Boyer, M.W.; Hiramatsu, H.; Yanik, G.A.; Driscoll, T.; et al. Next-Generation Sequencing of Minimal Residual Disease for Predicting Relapse after Tisagen-lecleucel in Children and Young Adults with Acute Lymphoblastic Leukemia. Blood Cancer Discov. 2022, 3, 66–81. [Google Scholar] [CrossRef]
- Bourbon, E.; Ghesquieres, H.; Bachy, E. CAR-T cells, from principle to clinical applications. Bull. Cancer 2021, 108, S4–S17. [Google Scholar] [CrossRef]
- Brentjens, R.J.; Brentjens, R.J.; Latouche, J.B.; Santos, E.; Marti, F.; Gong, M.C.; Lyddane, C.; King, P.D.; Larson, S.; Weiss, M.; et al. Eradication of systemic B-cell tumors by genetically targeted human T lymphocytes co-stimulated by CD80 and interleukin-15. Nat. Med. 2003, 9, 279–286. [Google Scholar] [CrossRef]
- Hollyman, D.; Stefanski, J.; Przybylowski, M.; Bartido, S.; Borquez-Ojeda, O.; Taylor, C.; Yeh, R.; Capacio, V.; Olszewska, M.; Hosey, J.; et al. Manufacturing Validation of Biologically Functional T Cells Targeted to CD19 Antigen for Autologous Adoptive Cell Therapy. J. Immunother. 2009, 32, 169–180. [Google Scholar] [CrossRef] [PubMed] [Green Version]
- Badbaran, A.; Berger, C.; Riecken, K.; Kruchen, A.; Geffken, M.; Müller, I.; Kröger, N.; Ayuk, F.A.; Fehse, B. Accurate In-Vivo Quantification of CD19 CAR-T Cells after Treatment with Axicabtagene Ciloleucel (Axi-Cel) and Tisagenlecleucel (Tisa-Cel) Using Digital PCR. Cancers 2020, 12, 1970. [Google Scholar] [CrossRef] [PubMed]
- Fehse, B.; Badbaran, A.; Berger, C.; Sonntag, T.; Riecken, K.; Geffken, M.; Kröger, N.; Ayuk, F.A. Digital PCR Assays for Precise Quantification of CD19-CAR-T Cells after Treatment with Axicabtagene Ciloleucel. Mol. Ther.-Methods Clin. Dev. 2020, 16, 172–178. [Google Scholar] [CrossRef] [PubMed] [Green Version]
- Haderbache, R.; Warda, W.; Hervouet, E.; da Rocha, M.N.; Trad, R.; Allain, V.; Nicod, C.; Thieblemeont, C.; Boissel, N.; Varlet, P.; et al. Droplet digital PCR allows vector copy number assessment and monitoring of experimental CAR T cells in murine xenograft models or approved CD19 CAR T cell-treated patients. J. Transl. Med. 2021, 19, 265. [Google Scholar] [CrossRef]
- Jozwik, A.; Dunlop, A.; Sanchez, K.; Benjamin, R. Monitoring Allogeneic CAR-T Cells Using Flow Cytometry. Mol. Biol. 2019, 2097, 293–308. [Google Scholar] [CrossRef]
- Lou, Y.; Chen, C.; Long, X.; Gu, J.; Xiao, M.; Wang, D.; Zhou, X.; Li, T.; Hong, Z.; Li, C.; et al. Detection and Quantification of Chimeric Antigen Receptor Transgene Copy Number by Droplet Digital PCR versus Real-Time PCR. J. Mol. Diagn. 2020, 22, 699–707. [Google Scholar] [CrossRef]
- Lu, A.; Liu, H.; Shi, R.; Cai, Y.; Ma, J.; Shao, L.; Rong, V.; Gkitsas, N.; Lei, H.; Highfill, S.L.; et al. Application of droplet digital PCR for the detection of vector copy number in clinical CAR/TCR T cell products. J. Transl. Med. 2020, 18, 191–197. [Google Scholar] [CrossRef]
- Maher, J.; Brentjens, R.J.; Gunset, G.; Rivière, I.; Sadelain, M. Human T-lymphocyte cytotoxicity and proliferation directed by a single chimeric TCRzeta /CD28 receptor. Nat. Biotechnol. 2002, 20, 70–75. [Google Scholar] [CrossRef]
- Mika, T.; Maghnouj, A.; Klein-Scory, S.; Ladigan-Badura, S.; Baraniskin, A.; Thomson, J.; Hasenkamp, J.; Hahn, S.A.; Wulf, G.; Schroers, R. Digital-Droplet PCR for Quantification of CD19-Directed CAR T-Cells. Front. Mol. Biosci. 2020, 7, 84. [Google Scholar] [CrossRef]
- Schubert, M.-L.; Berger, C.; Kunz, A.; Schmitt, A.; Badbaran, A.; Neuber, B.; Zeschke, S.; Wang, L.; Riecken, K.; Hückelhoven-Krauss, A.; et al. Comparison of single copy gene-based duplex quantitative PCR and digital droplet PCR for monitoring of expansion of CD19-directed CAR T cells in treated patients. Int. J. Oncol. 2022, 60, 48. [Google Scholar] [CrossRef] [PubMed]
- Peinelt, A.; Bremm, M.; Kreyenberg, H.; Cappel, C.; Banisharif-Dehkordi, J.; Erben, S.; Rettinger, E.; Jarisch, A.; Meisel, R.; Schlegel, P.-G.; et al. Monitoring of Circulating CAR T Cells: Validation of a Flow Cytometric Assay, Cellular Kinetics, and Phenotype Analysis Following Tisagenlecleucel. Front. Immunol. 2022, 13, 830773. [Google Scholar] [CrossRef] [PubMed]
- Demaret, J.; Varlet, P.; Trauet, J.; Beauvais, D.; Grossemy, A.; Hégo, F.; Yakoub-Agha, I.; Labalette, M. Monitoring CAR T-cells using flow cytometry. Cytom. Part B Clin. Cytom. 2020, 100, 218–224. [Google Scholar] [CrossRef] [PubMed]
- Kunz, A.; Gern, U.; Schmitt, A.; Neuber, B.; Wang, L.; Hückelhoven-Krauss, A.; Michels, B.; Hofmann, S.; Müller-Tidow, C.; Dreger, P.; et al. PeterDreger Optimized Assessment of qPCR-Based Vector Copy Numbers as a Safety Parameter for GMP-Grade CAR T Cells and Monitoring of Frequency in Patients. Mol. Ther. Methods Clin. Dev. 2020, 17, 448–454. [Google Scholar] [CrossRef]
- Gkazi, A.S.; Margetts, B.K.; Attenborough, T.; Mhaldien, L.; Standing, J.F.; Oakes, T.; Heather, J.M.; Booth, J.; Pasquet, M.; Chiesa, R.; et al. Clinical T Cell Receptor Repertoire Deep Sequencing and Analysis: An Application to Monitor Immune Reconstitution Following Cord Blood Transplantation. Front. Immunol. 2018, 9, 2547. [Google Scholar] [CrossRef]
- Kricke, S.; Mhaldien, L.; Fernandes, R.; Villanueva, C.; Shaw, A.; Veys, P.; Adams, S. Chimerism Analysis in the Pediatric Setting: Direct PCR from Bone Marrow, Whole Blood, and Cell Frac-tions. J. Mol. Diagn. 2018, 20, 381–388. [Google Scholar] [CrossRef] [Green Version]

| Reagent | Concentration | Volume per Well (µL) |
|---|---|---|
| Supermix | 2× | 11 µL |
| F tisagenlecleucel | 10 µM | 0.8 µL |
| R tisagenlecleucel | 10 µM | 0.8 µL |
| F albumin | 10 µM | 0.8 µL |
| R albumin | 10 µM | 0.8 µL |
| Probe tisagenlecleucel | 10 µM | 0.4 µL |
| Probe albumin | 10 µM | 0.4 µL |
| Dra I | 20 U/µL | 0.1 µL |
| Sterile water | 4.9 µL | |
| Template DNA | 10 ng/µL | 2 µL |
Publisher’s Note: MDPI stays neutral with regard to jurisdictional claims in published maps and institutional affiliations. |
© 2022 by the authors. Licensee MDPI, Basel, Switzerland. This article is an open access article distributed under the terms and conditions of the Creative Commons Attribution (CC BY) license (https://creativecommons.org/licenses/by/4.0/).
Share and Cite
Gkazi, S.A.; Gravett, E.; Bautista, C.; Bartram, J.; Ghorashian, S.; Adams, S.P. Clinically Applicable Assessment of Tisagenlecleucel CAR T Cell Treatment by Digital Droplet PCR for Copy Number Variant Assessment. Int. J. Mol. Sci. 2022, 23, 7573. https://doi.org/10.3390/ijms23147573
Gkazi SA, Gravett E, Bautista C, Bartram J, Ghorashian S, Adams SP. Clinically Applicable Assessment of Tisagenlecleucel CAR T Cell Treatment by Digital Droplet PCR for Copy Number Variant Assessment. International Journal of Molecular Sciences. 2022; 23(14):7573. https://doi.org/10.3390/ijms23147573
Chicago/Turabian StyleGkazi, Soragia Athina, Emma Gravett, Carla Bautista, Jack Bartram, Sara Ghorashian, and Stuart Paul Adams. 2022. "Clinically Applicable Assessment of Tisagenlecleucel CAR T Cell Treatment by Digital Droplet PCR for Copy Number Variant Assessment" International Journal of Molecular Sciences 23, no. 14: 7573. https://doi.org/10.3390/ijms23147573
APA StyleGkazi, S. A., Gravett, E., Bautista, C., Bartram, J., Ghorashian, S., & Adams, S. P. (2022). Clinically Applicable Assessment of Tisagenlecleucel CAR T Cell Treatment by Digital Droplet PCR for Copy Number Variant Assessment. International Journal of Molecular Sciences, 23(14), 7573. https://doi.org/10.3390/ijms23147573