Article

Genome–Wide Identification of the GRAS Family Genes in Melilotus albus and Expression Analysis under Various Tissues and Abiotic Stresses

State Key Laboratory of Grassland Agro–Ecosystems, Key Laboratory of Grassland Livestock Industry Innovation, Ministry of Agriculture and Rural Affairs, College of Pastoral Agriculture Science and Technology, Lanzhou University, Lanzhou 730020, China
*
Author to whom correspondence should be addressed.
Int. J. Mol. Sci. 2022, 23(13), 7403; https://doi.org/10.3390/ijms23137403
Submission received: 9 June 2022 / Revised: 27 June 2022 / Accepted: 1 July 2022 / Published: 3 July 2022

Abstract

:
The GRAS gene family is a plant–specific family of transcription factors, which play an important role in many metabolic pathways, such as plant growth and development and stress response. However, there is no report on the comprehensive study of the GRAS gene family of Melilotus albus. Here, we identified 55 MaGRAS genes, which were classified into 8 subfamilies by phylogenetic analysis, and unevenly distributed on 8 chromosomes. The structural analysis indicated that 87% of MaGRAS genes have no intron, which is highly conservative in different species. MaGRAS proteins of the same subfamily have similar protein motifs, which are the source of functional differences of different genomes. Transcriptome and qRT–PCR data were combined to determine the expression of 12 MaGRAS genes in 6 tissues, including flower, seed, leaf, stem, root and nodule, which indicated the possible roles in plant growth and development. Five and seven MaGRAS genes were upregulated under ABA, drought, and salt stress treatments in the roots and shoots, respectively, indicating that they play vital roles in the response to ABA and abiotic stresses in M. albus. Furthermore, in yeast heterologous expression, MaGRAS12, MaGRAS34 and MaGRAS33 can enhance the drought or salt tolerance of yeast cells. Taken together, these results provide basic information for understanding the underlying molecular mechanisms of GRAS proteins and valuable information for further studies on the growth, development and stress responses of GRAS proteins in M. albus.

1. Introduction

GRAS gene family is a plant–specific transcription factor family, the name GRAS is derived from the three functional members, gibberellic acid insensitive (GAI) [1], repressor of GAI (RGA) [2] and scarecrow (SCR) [3], which are widely distributed in plants. Members of the GRAS protein family are quite different in length and nucleotide sequence, and GRAS proteins typically consist of 400–770 amino acids [4]. Their C–terminal sequences are highly conserved, mainly including five motifs: LHR I (Leucine Heptapeptide Repeat I), VHIID, LHR II (Leucine Heptad Region II), PFYRE and SAW, among which VHIID conserved sequence is the core sequence of GRAS family proteins; these motifs are crucial to the interaction between GRAS and other proteins [5]. In contrast, the N–terminal part of the GRAS proteins is highly variable and will fold specifically when it meets a suitable ligand [6]. Studies have shown that the N–terminal sequence plays an important role in the specific function of GRAS proteins [7]. The phylogenetic tree can divide GRAS family into several subfamilies, but the number of subfamilies in different species is also different. According to the classification method of the Arabidopsis thaliana GRAS gene family, it is divided into eight subfamilies, including LISCL, PAT1, SCL3, DELLA, SCR, SHR, LAS and HAM [8]. These subfamilies are all named after their star members or unified functions. GRAS proteins from various subfamilies have distinct functions.
At present, genome–wide members of the GRAS gene family have been identified in a number of plant species, and 34, 60, 153 and 68 GRAS gene members were found from A. thaliana [9], rice (Oryza sativa) [9], wheat (Triticum aestivum) [10] and Medicago truncatula [11], respectively. GRAS proteins play various roles in plant growth and development, and participate in phytohormone signal transduction and the regulation of tissue development. [4]. SCR and SHR subfamily members are closely related to plant root growth [12]. SCR and SHR form a SCR/SHR complex, which plays an essential role in the extension direction of the plant root network [13]. SCL3 participates in Gibberellic acid/DELLA regulation pathway and cooperates with SHR/SCR to mediate cell elongation during root development [14]. The SHR/SCR/SCL3 module of GRAS transcription factor in tomato (Solanum lycopersicum) participates in the regulation of gibberellin signaling during mycorrhization process [15]. DELLA proteins are the key negative regulator of Gibberellic acid signaling pathway, and it mediates the synergistic regulation of gibberellin and light signal by interacting with PIF protein [16]. In addition, it is found that DELLA proteins participate in signal transmission and regulation of various hormones as a core role in the plant hormone regulation network, for example, in A. thaliana, the DELLA proteins control plant immune response by regulating the balance of jasmonic acid and salicylic acid signaling [17]. RGA–LIKE 1 (RGL1), RGL2, RGL3, GAI and RGA have conserved sequences, which are sensed by gibberellin signals and can participate in gibberellin signal regulation [18]. PAT1, which is regulated by DELLA protein, participates in gibberellin signal mediation and interacts with SCL3 protein to regulate photosensitive pigment signal transduction [19]. AtPAT1 in A. thaliana plays a positive role in regulating the signal transduction of phytochrome A [20]. Studies have suggested that GRAS proteins are related to nodule formation of leguminous plants [21]. NSP1 (nodulation signaling pathway 1) and NSP2 (nodulation signaling pathway 2) are two GRAS proteins identified from M. truncatula, belonging to SHR and HAM subfamilies, respectively [22]. They can directly bind to promoters of nodulation–related genes and play an important role in nodule formation, which shows the importance of GRAS proteins for the effective nodulation of legumes [21].
In addition, GRAS proteins have been involved in the plant response to biotic or abiotic stress. LISCL subfamily plays an important role in plants responding to stress. SCL14 is a LISCL protein in A. thaliana, and forms the TGA/SCL14 complex with TGA transcription factor, which is essential for activating stress–induced promoters when plants are attacked by exogenous substances [23]. VaPAT1 in Vitis amurensis plays a role as a positive transcription regulator in abscisic acid (ABA) and various abiotic stresses [24]. In poplar (Populus euphratica Oliv), PeSCL7 is induced by drought and high salt stresses, which may be useful for engineering drought–resistant and salt–tolerant trees [25]. The expression of OsGRAS23 gene in rice was induced by drought, NaCl and jasmonic acid, and its overexpressed plants enhanced drought tolerance by reducing H2O2 accumulation in cells [26]. Overexpressing BnLAS gene from Brassica napus in A. thaliana plants significantly enhanced drought resistance by increasing wax secretion in leaves and reducing stomatal opening [27]. In tomato, the expression levels of SlGRAS7 and SlGRAS40 were significantly upregulated under salt and D–mannitol treatment, and transgenic tomato plants overexpressing SlGRAS7 and SlGRAS40 were more tolerant to drought and salt stress than wild–type plants [28,29]. Moreover, GRAS genes were also found to respond to multifarious hormones [30]. The GRAS genes PgGRAS44–04, PgGRAS48–01 and PgGRAS50–01 in Panax ginseng are expressed under gibberellic acid treatment [31]. The downregulation of GRAS2 in tomato decreased the activity of gibberellic acid biosynthesis and signal transduction pathway, thus reducing the fruit weight of tomato [32].
Melilotus albus is a leguminous crop, which is an important forage and green manure around world [33]. It has strong stress resistance, especially its salt resistance and drought resistance [34]. It is one of the excellent forage legume for soil improvement [35]. In recent years, more attention has been paid to the research of GRAS gene family in plant species growth, signal transduction and abiotic stresses response. However, the whole genome analysis and function of GRAS family have not been reported in M. albus. In this study, using the latest available genome assembly and annotation database of M. albus [36], we comprehensively analyzed 55 GRAS genes by investigating physical and chemical properties, phylogenetic relations, gene duplication events, gene structures, motif compositions, chromosomal locations and cis–elements in promoter regions. Moreover, we explored the expression patterns of the MaGRAS genes in different tissues, ABA treatment, salt and drought stresses. In particular, six representative MaGRAS genes were selected and carried out the qRT–PCR analyses, and three of them were further selected to analyze their drought and salt tolerance functions by heterologous expression in yeast. Collectively, our results provide a theoretical basis for the role of GRAS genes in the abiotic stresses response of leguminous plants.

2. Results

2.1. Identification and Analysis of GRAS Genes in Melilotus albus

To identify GRAS genes in the M. albus genome, we conducted blastp searches on the M. albus genome using GRAS sequences documented in A. thaliana and M. truncatula as query sequences. Using this method, 172 putative GRAS genes were identified and submitted to CDD, Pfam and SMART to confirm the GRAS domain. A total of 55 genes were identified as predicted by GRAS genes. The 55 MaGRAS genes were named according to their physical positions on chromosomes (from top to bottom). Gene names, gene IDs, chromosomal locations, number of amino acids, molecular weights (Mws), isoelectric points (pIs), grand average of hydropathicity (GRAVY), CDS lengths and subgroups were listed in Supplementary Table S1. The length of amino acid sequences encoded by MaGRAS varied from 155 (MaGRAS50) to 819 (MaGRAS15) amino acids, the relative Mws ranged from 17.1 (MaGRAS50) to 90.5 (MaGRAS15) kDa, the pIs values of MaGRAS proteins varied from 4.81 (MaGRAS5) to 7.60 (MaGRAS31), the GRAVY values ranged from −0.693 (MaGRAS29) to −0.116 (MaGRAS51), the CDSs were distributed from 468 to 2460 bp (Supplementary Table S1). The predicted subcellular localizations of the MaGRAS proteins showed that 36 MaGRAS members might be in the nucleus, 9 MaGRAS proteins were anchored in the chloroplast and cytoplasm, respectively, and 1 MaGRAS protein was anchored in the mitochondria (Supplementary Table S1).

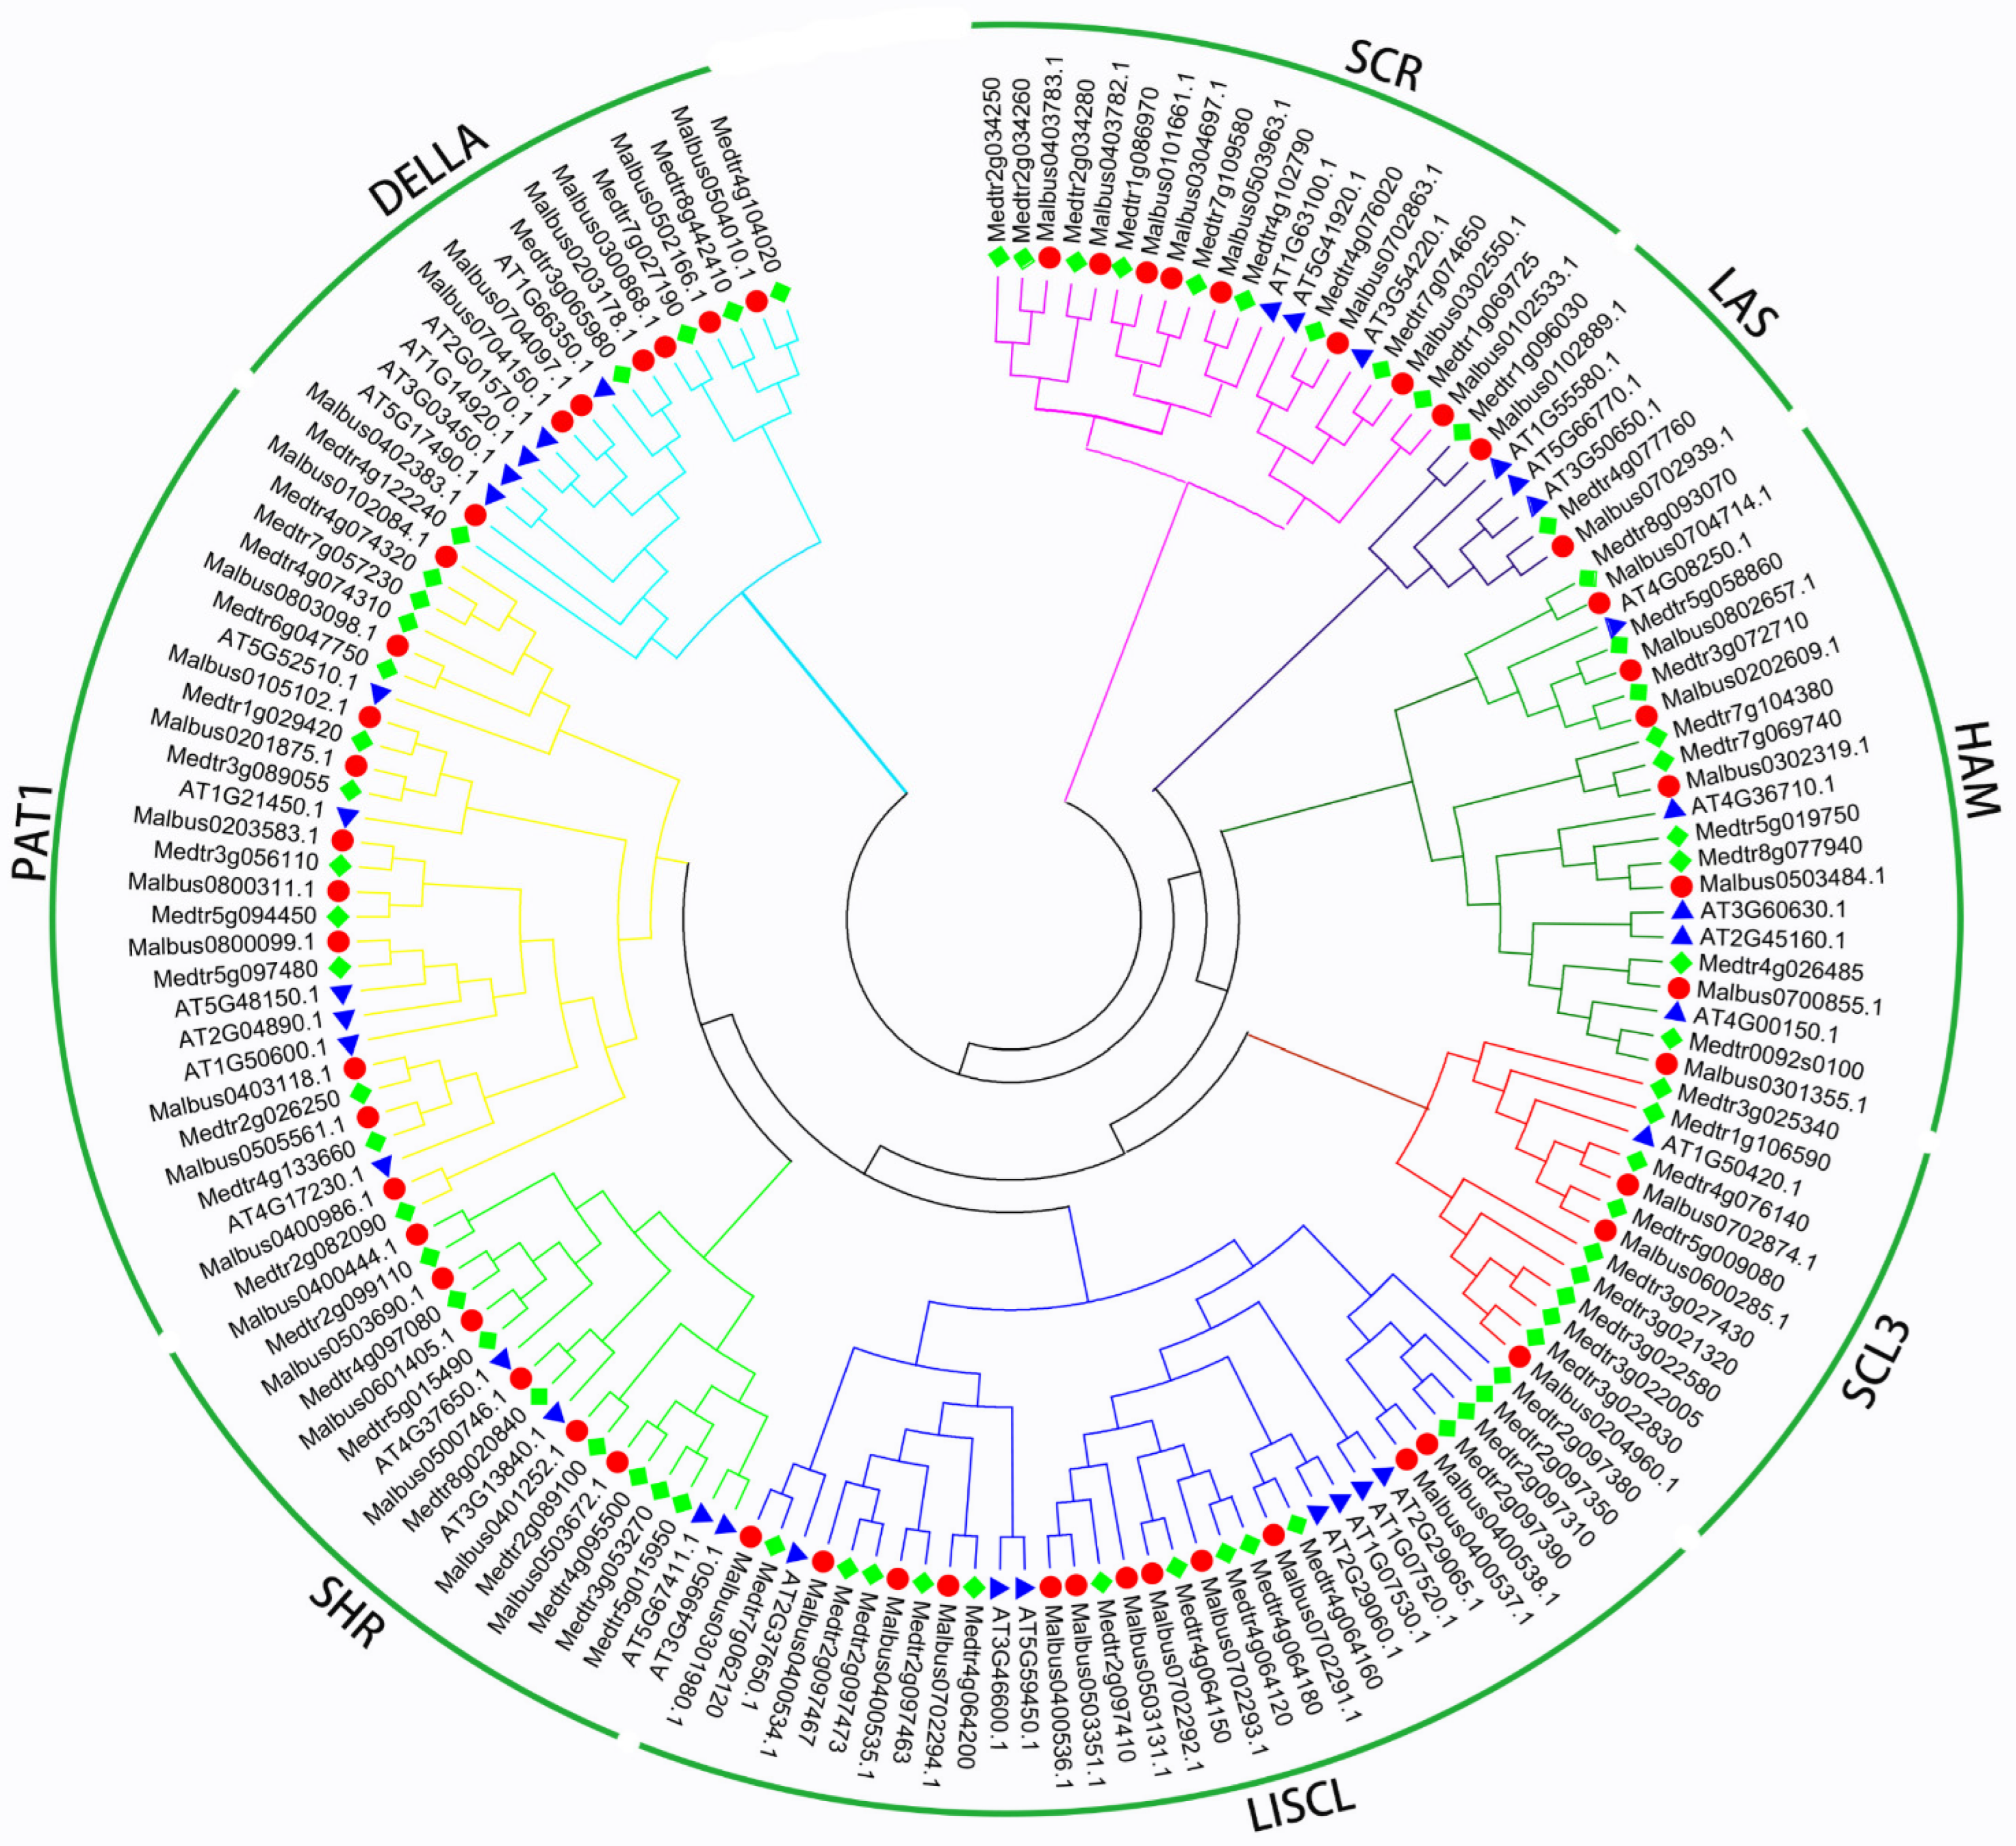
2.2. Phylogenetic Categories Analysis of MaGRAS Genes

To explore the evolutionary relationship of the MaGRAS proteins and other known GRAS proteins, a phylogenetic tree was resolved using 157 GRAS family members from M. albus (55 genes), M. truncatula (68 genes) and A. thaliana (34 genes) (Figure 1) using the neighbor–joining (NJ) method in MEGA 7.0. All GRAS members were divided into eight subfamilies based on the previous classification of GRAS families in A. thaliana. The 157 GRAS genes from 3 species were unevenly clustered into 8 groups, including SHR, LAS, DELLA, HAM, LISCL, PAT1, SCL3 and SCR subbranches. Compared with the number of GRAS genes in A. thaliana, the GRAS gene family of M. truncatula and M. albus expanded significantly. LISCL subfamily has the largest number of GRAS genes, followed by PAT1 subfamily. There were seven (A. thaliana) GRASs, 12 (M. albus) GRASs and 14 (M. truncatula) GRASs in the LISCL subfamily. Six (A. thaliana) GRASs, 10 (M. albus) GRASs and 12 (M. truncatula) GRASs in the PAT1 subfamily. Especially, both the A. thaliana and M. truncatula contained five GRASs while M. albus contained seven GRASs in the DELLA. In addition, we identified six, eight, three, seven and two MaGRAS genes in the SHR, SCR, SCL3, HAM and LAS subfamilies, respectively.

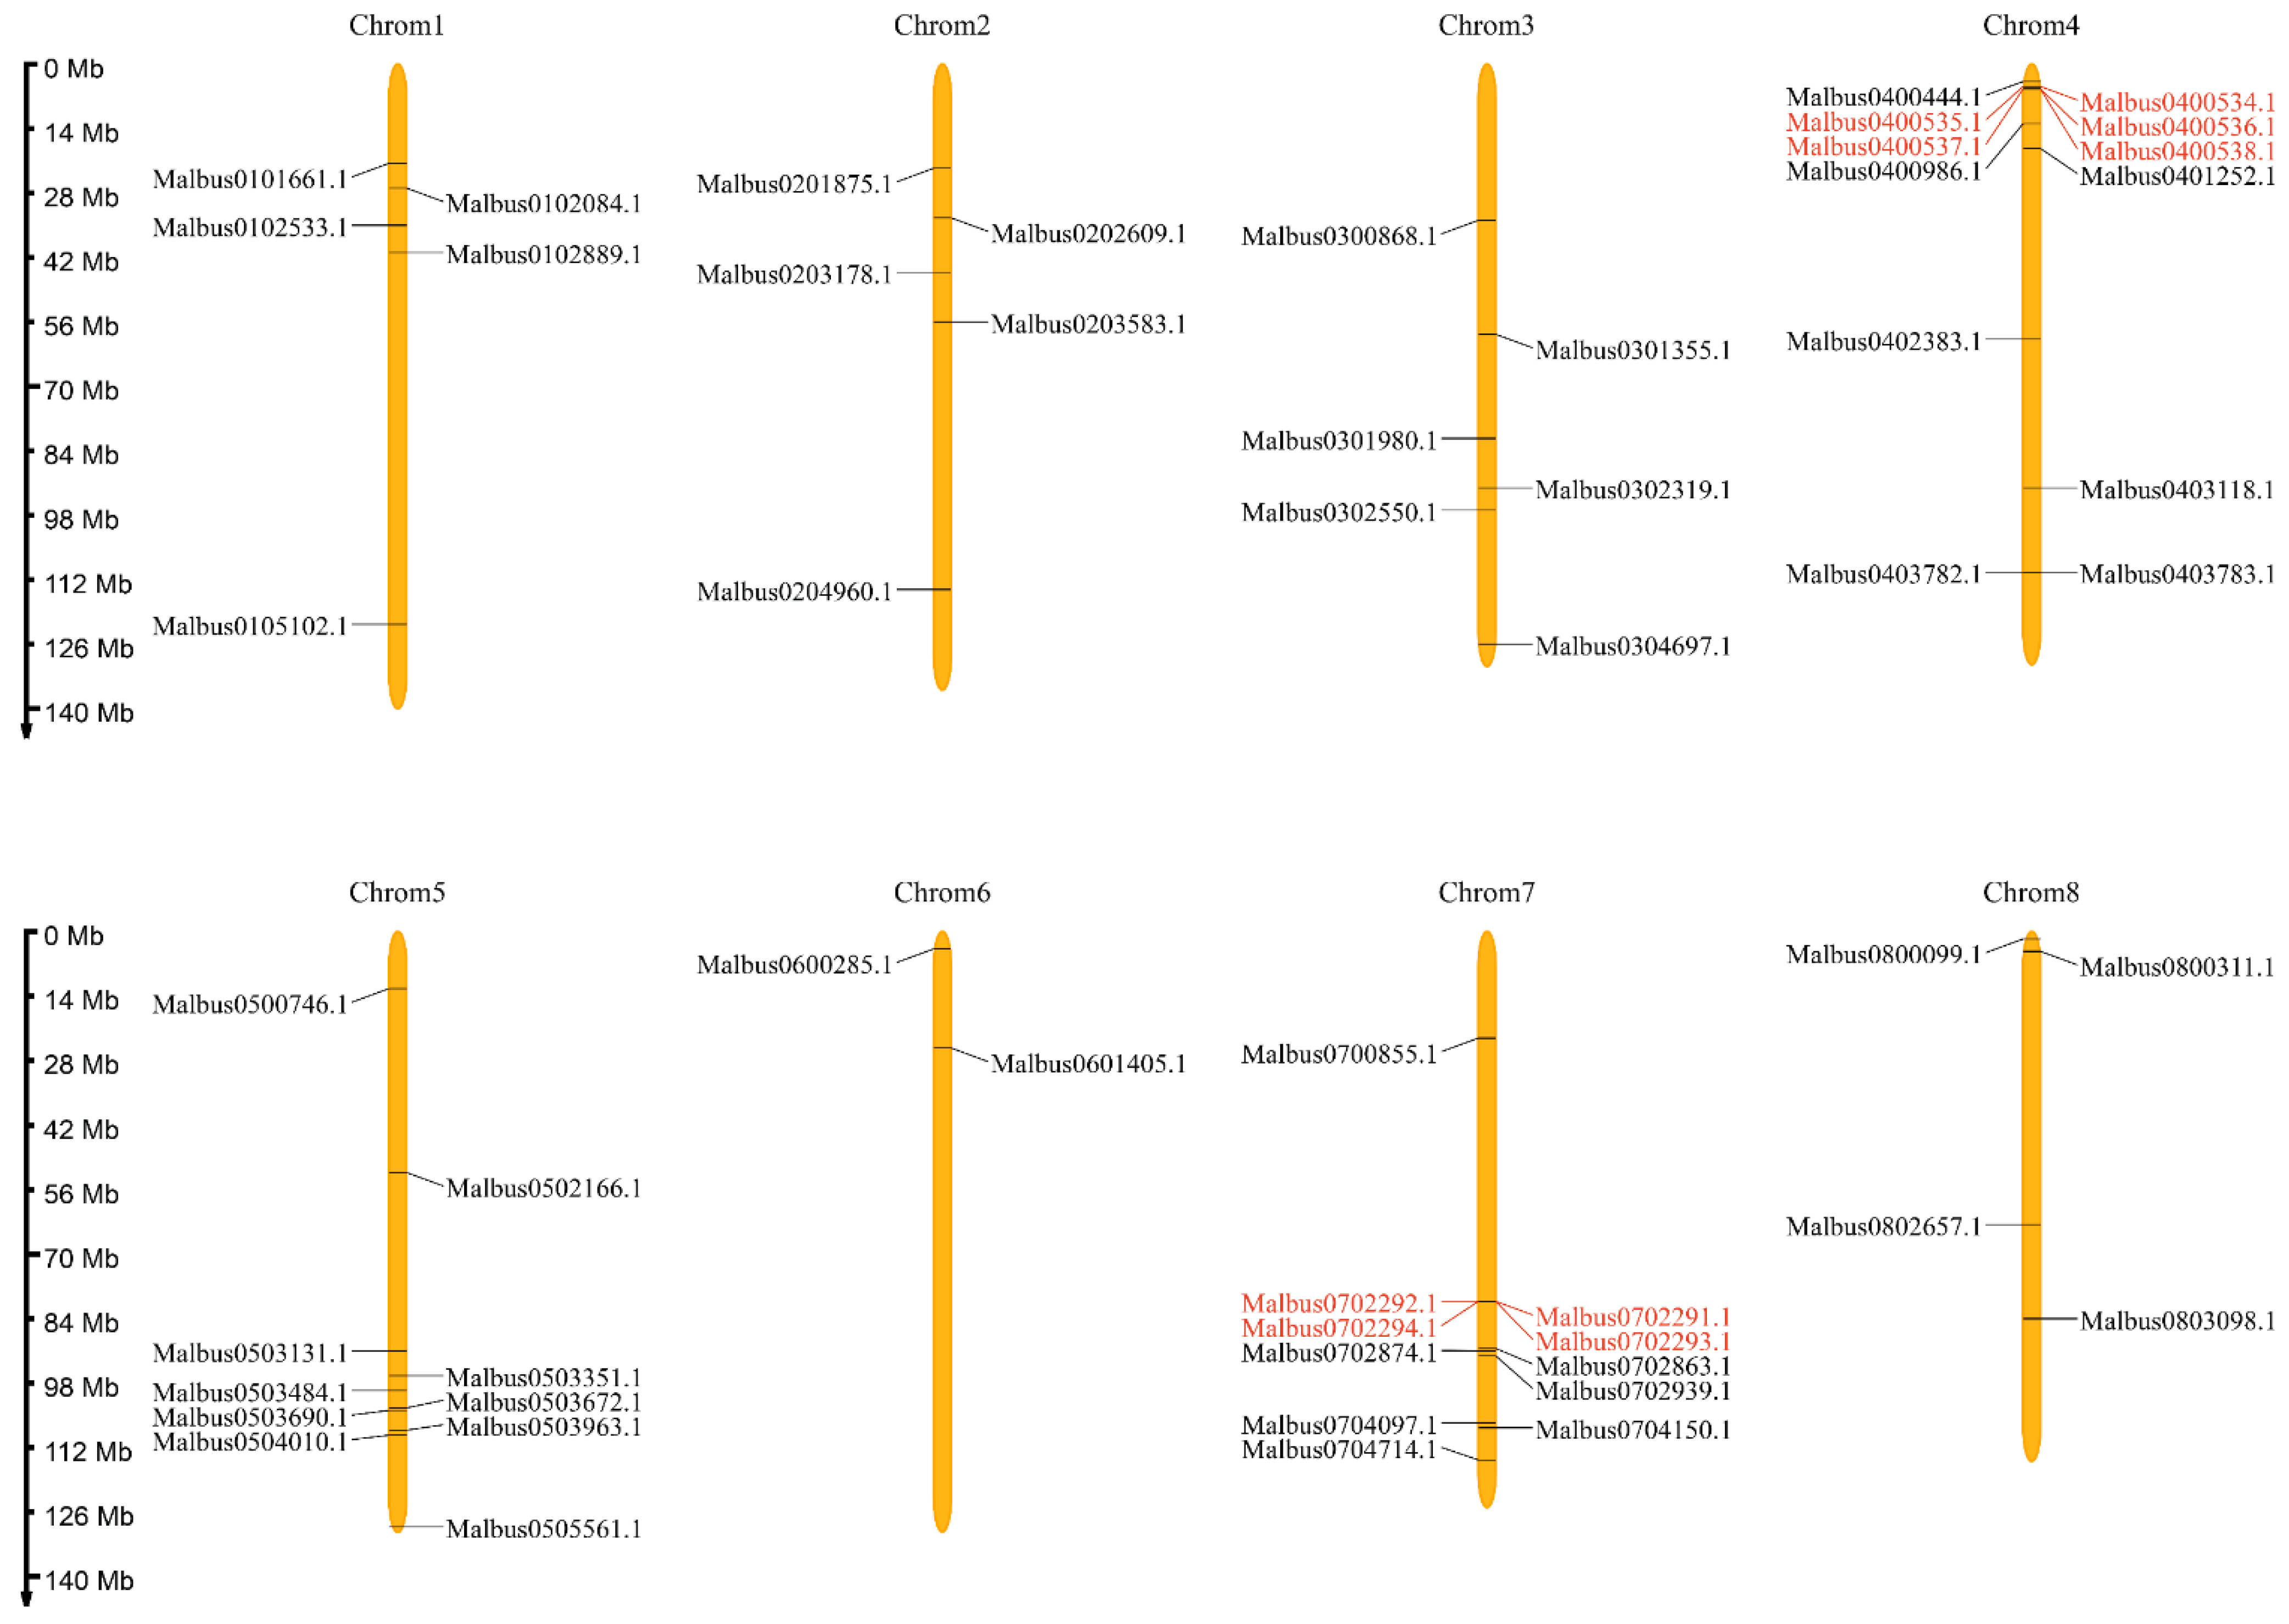
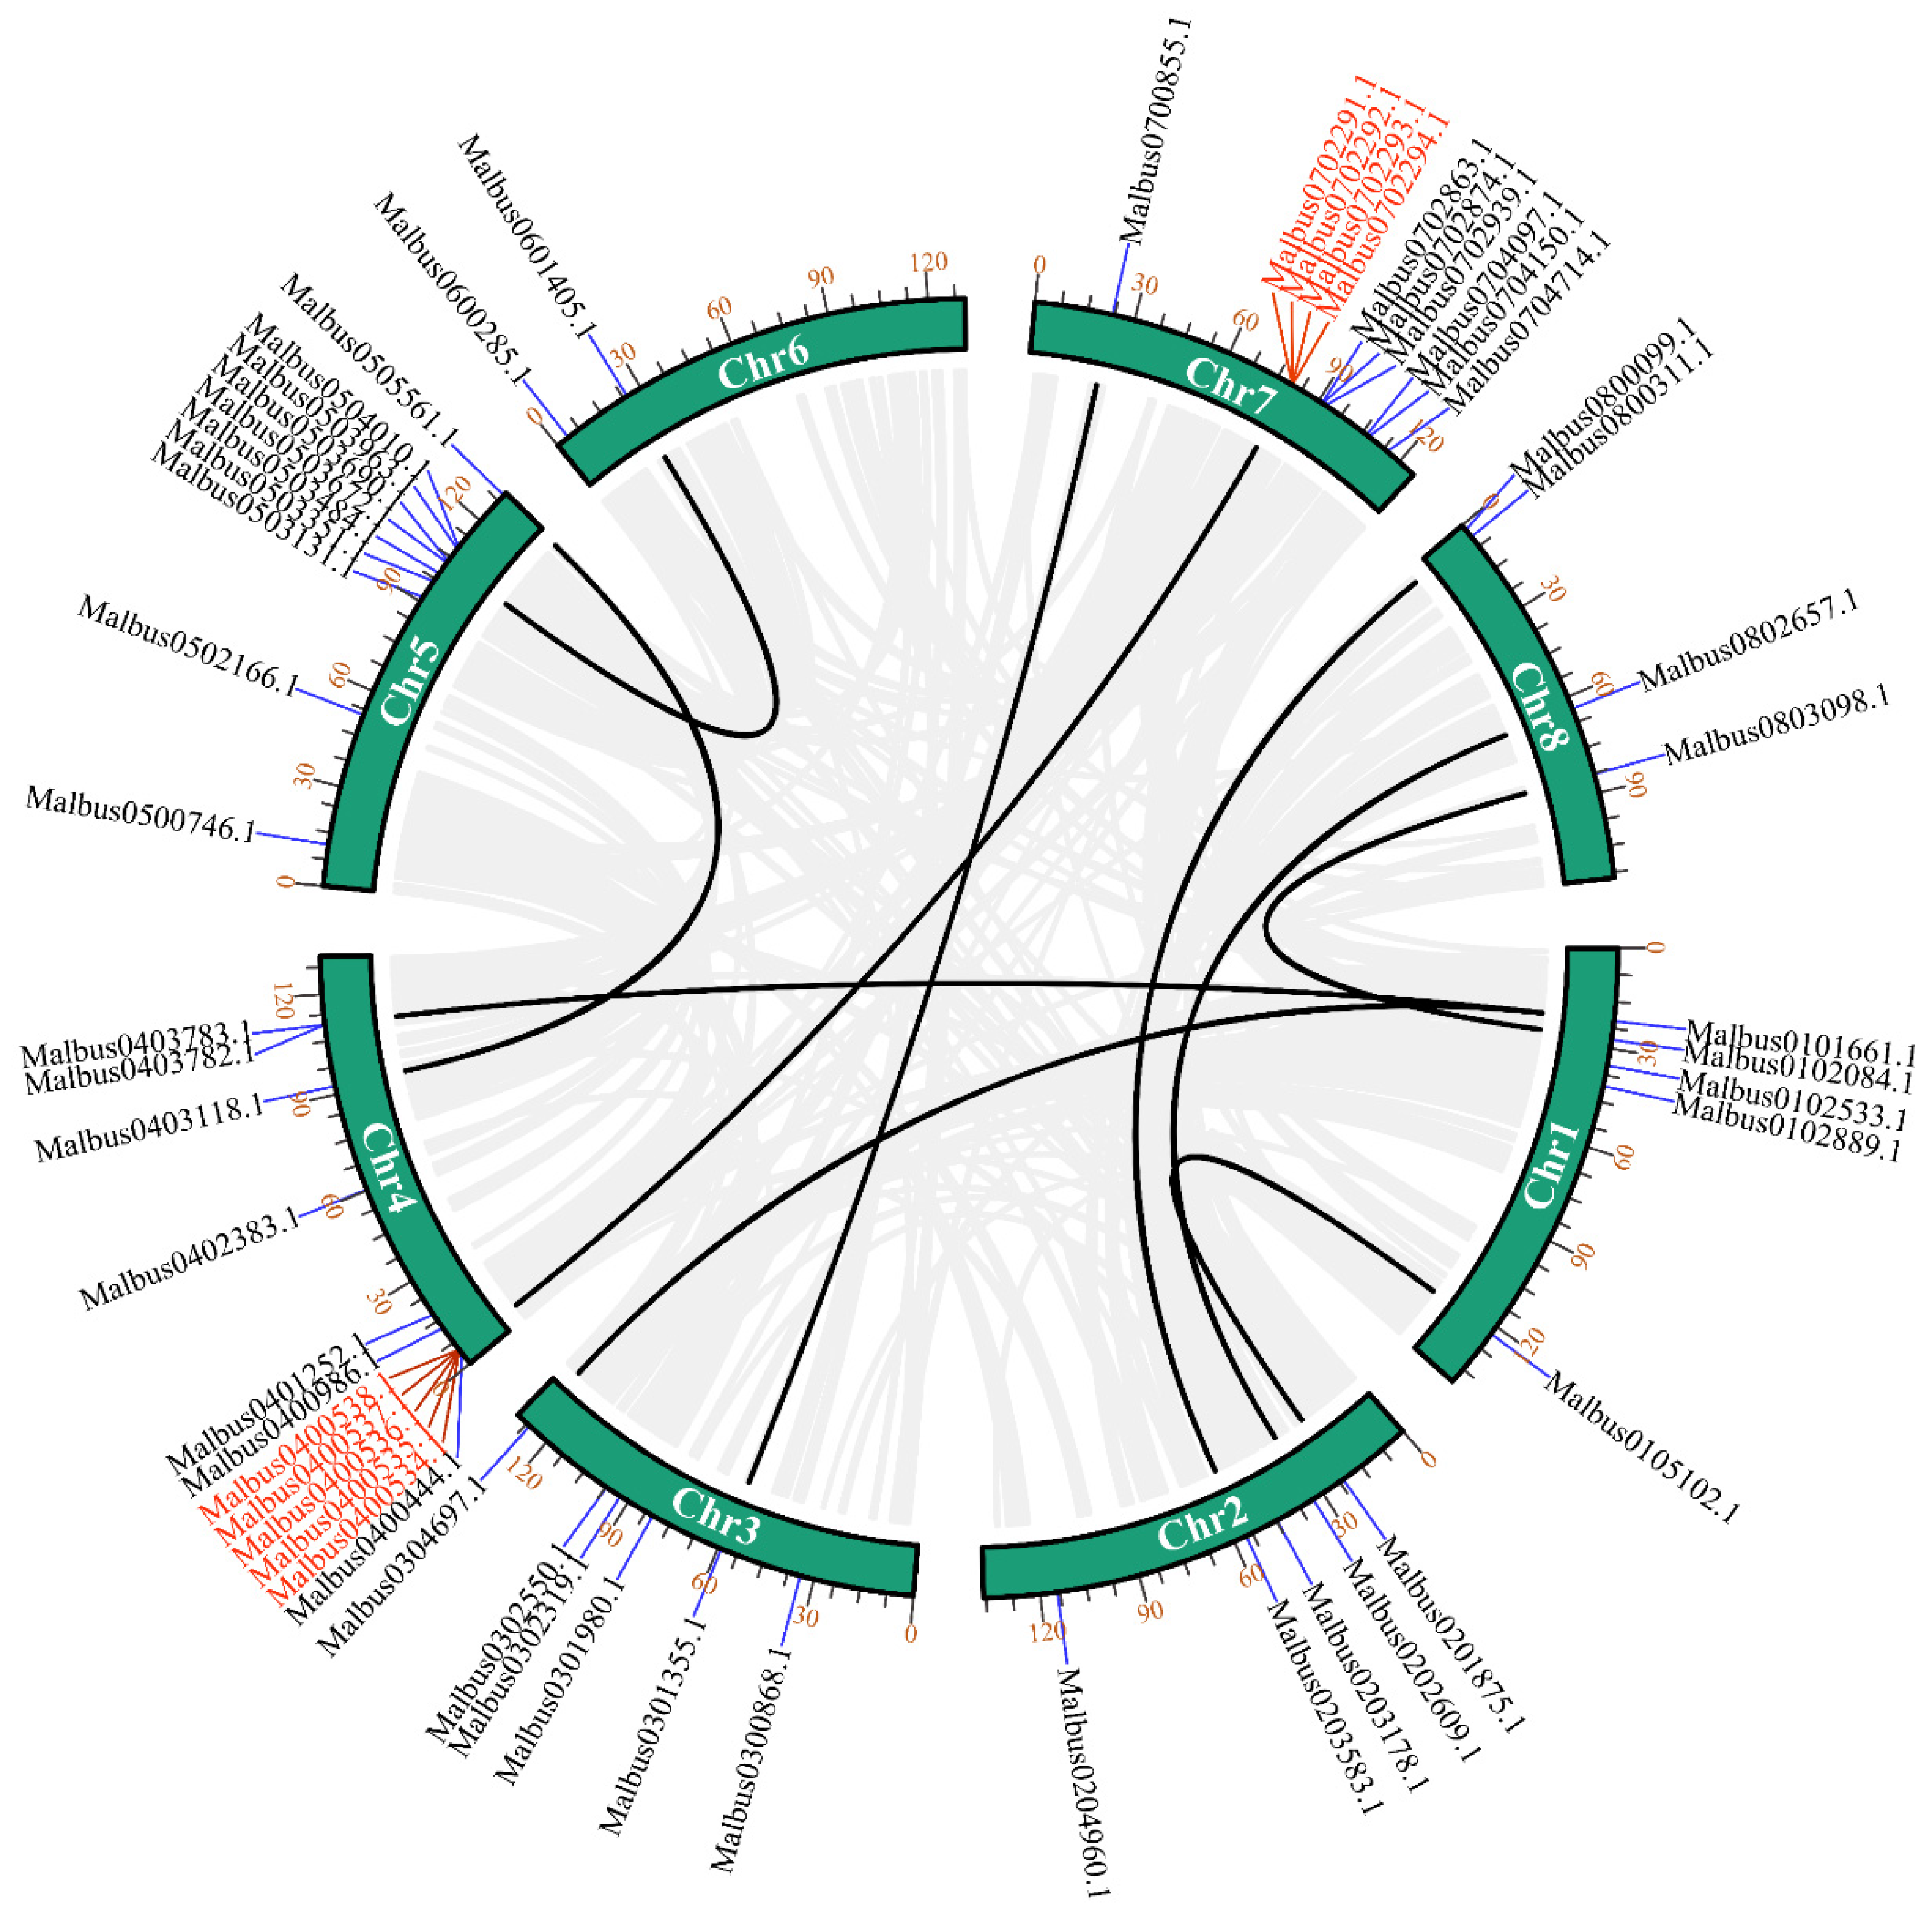
2.3. Chromosomal Locations and Gene Duplication Analysis of MaGRAS Genes

The physical locations of 55 MaGRAS genes were distributed on 8 chromosomes of M. albus (Figure 2), showing a heterogeneous distribution. Each chromosome in M. albus contained between two and twelve MaGRAS genes. Chromosome 4 had the highest number of MaGRAS genes (12 genes), and most of them are distributed at the front of the chromosome. Chromosome 6 had the least number of MaGRAS genes (two genes), which are distributed at the front of the chromosome. Chromosomes 3 and 8 contained six and four genes, respectively, evenly distributed on the chromosome. There are five MaGRAS genes on chromosomes 1 and 2, and their distribution trends are consistent. Chromosomes 5 and 7 contained 10 and 11 genes, respectively, mainly located at the rear end of the chromosome.
We used TBtools software for collinearity analysis to detect the gene duplication of MaGRAS genes in M. albus. MaGRAS genes had obvious tandem repeat phenomenon (Figure 3), a total of 10 pairs of duplicated segments in MaGRAS genes and 3 groups of tandemly duplicated MaGRAS genes (Malbus0400534.1/Malbus0400535.1, Malbus0400538.1/Malbus0400536.1/Malbus0400537.1, Malbus0702293.1/Malbus0702291.1/Malbus0702294.1/Malbus0702292.1), 2 of which are located on chromosome 4 and 1 on chromosome 7.

2.4. Structure and Conserved Motifs of MaGRAS Genes

A single rootless phylogenetic tree was generated from the complete protein sequences of all GRAS genes in M. albus, and MaGRAS genes were divided into eight subgroups. (Figure 4A). Gene structural diversity is an important basis for the evolution of gene families [37]. To further understand the structural evolution of the MaGRAS genes, the genome sequence and CDS sequence information of each MaGRAS gene were obtained according to the M. albus genome information, and the exon–intron structure diagram was drawn (Figure 4B). The results showed that the number of exons and introns of each member of MaGRAS family was kept relatively constant, and most of the MaGRAS genes (87%) contained only exons and no introns. It is indicated that no introns are the main structural forms of MaGRAS genes. MaGRAS genes in the same subgroup of phylogenetic tree showed a similar exon–intron structure; MaGRAS genes of groups LAS, PAT1, SHR, GRAS8 and DELLA were highly conserved without introns, groups HAM (Malbus0301355.1), SCR (Malbus0302550.1) and SCL3 (Malbus0204960.1) each have a gene with only one intron, group DELLA (Malbus0704150.1, Malbus0300868.1) has two genes with only one intron, group LISCL has two genes with two (Malbus0503351.1) and four (Malbus0503131.1) introns.
In order to further reveal the diversity of MaGRAS genes, MEME program predicted the putative motifs and identified 20 different motifs (Figure 4C). In addition, the detailed information and Seq logo of 20 MEME motifs are shown in Supplementary Table S2 and Figure S1. The results showed that most closely related members in the phylogenetic tree had similar motifs. The MEME motifs were further identified and classified into five GRAS–specific C–terminal domains, including LRHI, VHIID, LRHII, PFYRE and SAW [38]. As a result, motifs 6 and 10 classified into the LRHI, motifs 1 and 14 belonged to the VHIID, motifs 7 and 9 related with the LRHII, motifs 8 and 3 were included by the PFYRE and motifs 2, 4, 12 and 13 in the SAW were shared across almost all MaGRAS genes. In addition, motifs 5 and 16 were located between the LRHI and VHII D, motif 5 exists in most MaGRAS subfamilies and motif 16 exists specifically in PAT1 (eight genes) and LISCL subfamily (four genes), indicating their functional importance. It was worth noting that the MEME motifs among the five C–terminal domains was not fixed in MaGRAS proteins, and some C–terminal conserved domains were corresponding to two or three motifs. Interestingly, other motifs located outside the C–terminal conserved domains showed subgroup–specific patterns. For example, the motifs 11, 15, 17, 18, and 20 were only found in the LISCL subfamily, while motif 19 was nested within LHRII and was LISCL and DELLA subfamilies specific.
In addition, based on the interaction of GRAS proteins in M. truncatula, we predicted the interaction of different GRAS protein subfamilies in M. albus (Supplementary Figure S2). We found that MaGRAS14 gene of HAM subfamily was predicted to interact with proteins of multiple subfamilies, including SHR subfamily (two genes), DELLA subfamily (two genes), PAT1 subfamily (three genes), SCL3 subfamily (three genes) and SCR subfamily (four genes). Meanwhile, we predicted that MaGRAS29, the orthologous gene of nodulation–related transcription factor MtNSP1, can interact with MaGRAS51. The interactions between the putative orthologous of MaGRAS3, MaGRAS46, MaGRAS17 and MaGRAS35 have been validated in other species [39,40].

2.5. Identification of Cis–Elements in the MaGRAS Gene Promoters

In order to explore the mechanism of MaGRAS genes in the process of stress response and development, the 2000 bp upstream sequence of MaGRAS genes was analyzed by PlantCARE online tools. A total of 23 elements were recorded in this study (Figure 5), which were predicted to be involved in developmental regulation, abiotic stresses and phytohormone response. Among them, there are 10 phytohormone response elements (36.5%), namely TGA–element/AuxRR–core/TGA–box (auxin–responsive elements), ABRE (abscisic acid responsive elements), GARE–motif/P–box/TATC–box (gibberellin–responsive elements), TCA–element (salicylic acid responsive elements) CGTCA–motif/TGACG–motif (methyl jasmonate responsive elements), nine defense and stress responsive elements (60.3%) of Box 4/GT1–motif/TCT–motif/G–box (light responsive elements), ARE (anaerobic induction elements), TC–rich repeats (defense and stress elements), LTR (low–temperature responsive elements), MBS (drought–inducibility elements), WUN–motif (wound–responsive elements) and 4 growth and development regulating elements (6.2%) of CAT–box (meristem expression elements), circadian (circadian control elements), GCN4_motif (endosperm expression elements) and O2–site (zein metabolism regulation elements). All the 55 MaGRAS genes contained both phytohormone response elements and stress responsive elements. Malbus0503351.1 contained the largest number of components, 45 in total, and Malbus0600285.1 contained the least number of components, which was only 8. The number of defense and stress responsive elements is the highest, and 397 light responsive elements were identified, which was more than the number of other cis–acting elements, followed by anaerobic induction and methyl jasmonate responsive elements.

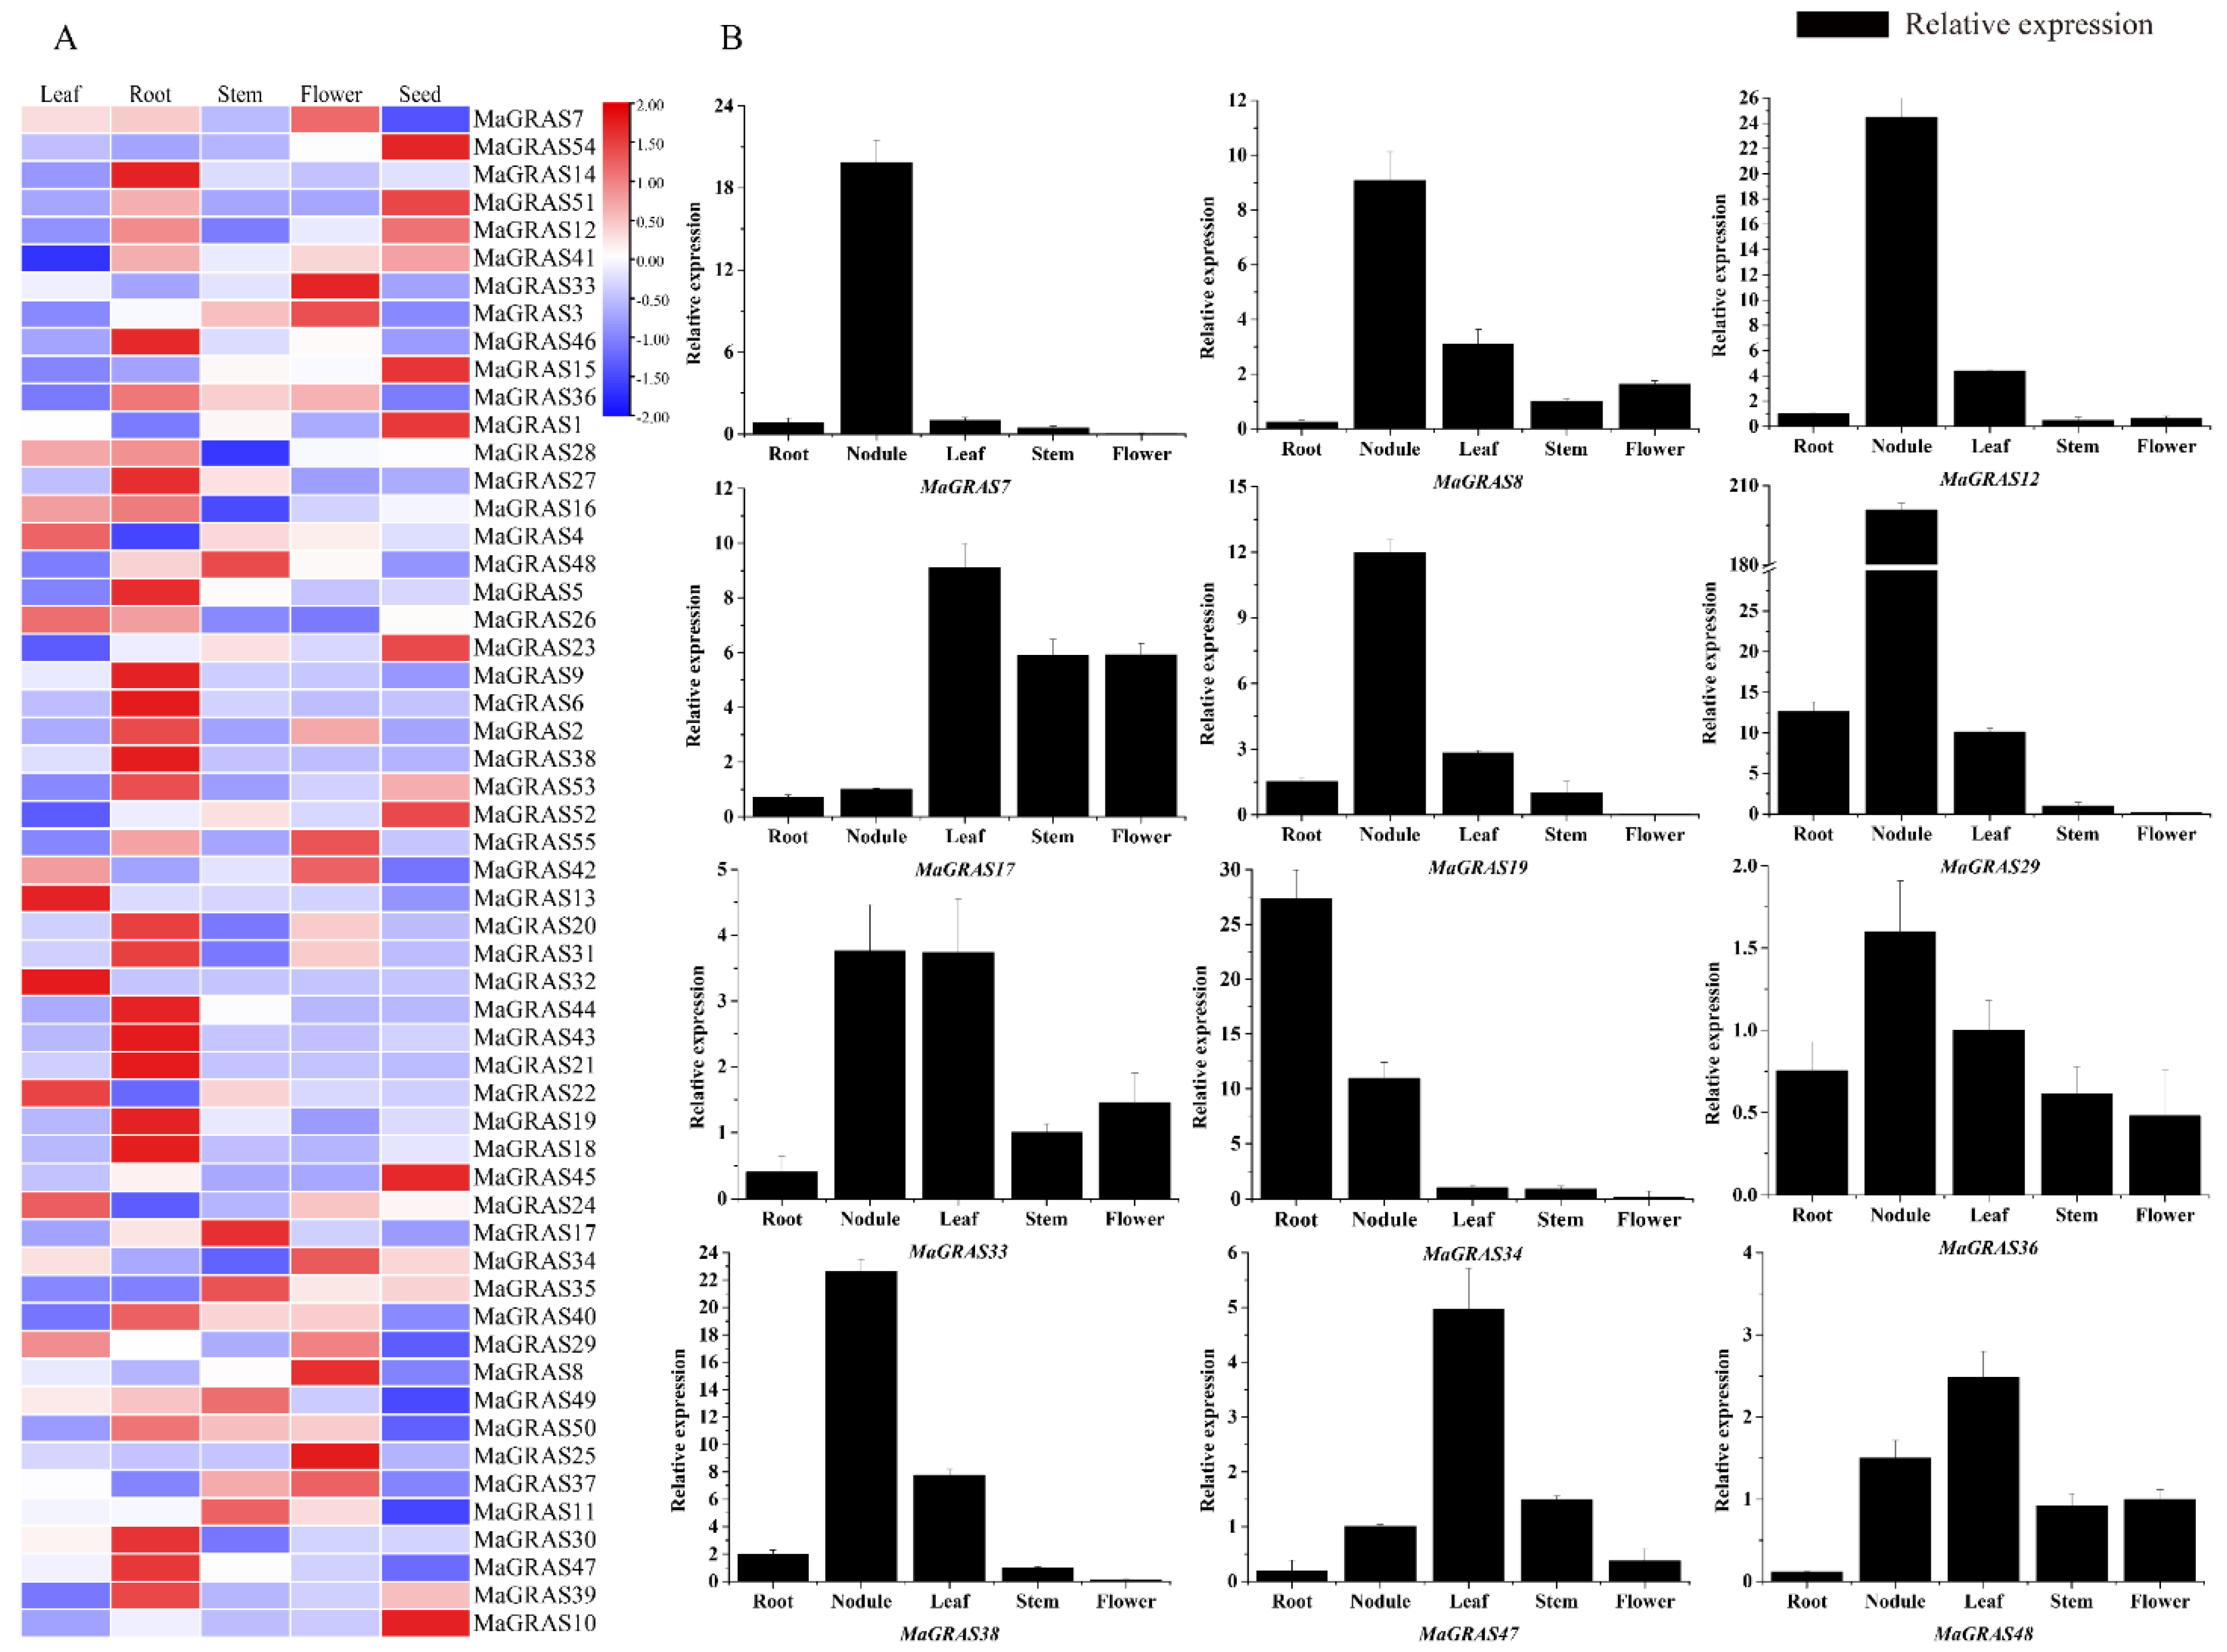
2.6. Expression Pattern Analysis of MaGRAS Genes in M. albus tissues

GRAS genes have important roles in various biological pathways, tissue–specific expression is related with the specific function of MaGRAS genes in different tissues. The expression profiles of MaGRAS genes in five tissues (leaf, root, stem, flower and seed tissues) were investigated (Figure 6A). A total of 41 (74.5%) MaGRAS genes were expressed at least in 1 tissue (FPKM ≥ 1), and 27 (49.1%) genes were expressed in all tissues (FPKM ≥ 1) (Supplementary Table S3). Among the 55 genes, 11, 15, 16, 17 and 25 MaGRAS genes were preferentially expressed in leaves, seeds, flowers, stems and roots, respectively (Supplementary Figure S3), and MaGRAS8, MaGRAS12, MaGRAS23, MaGRAS33, MaGRAS49 and MaGRAS52 were highly expressed in all tissues (FPKM ≥ 10), indicating their important role in the development of M. albus.
In addition, we performed qRT–PCR analysis of 12 MaGRAS genes in 5 tissues (leaf, root, stem, flower and nodule tissues) during the flowering stage of M. albus (Figure 6B). The qRT–PCR results had similar trends to transcriptome data. MaGRAS7, MaGRAS8, MaGRAS12, MaGRAS19, MaGRAS29, MaGRAS36 and MaGRAS38 were significantly more highly expressed in nodules than in other tissues. The expression of MaGRAS17 in leaves, stems and flowers were significantly higher than those in roots and nodules. MaGRAS33 was highly expressed in leaves and nodules, but the lowest in leaves. MaGRAS34 had the highest expression in roots, followed by in nodules. MaGRAS47 and MaGRAS48 were more highly expressed in leaves.

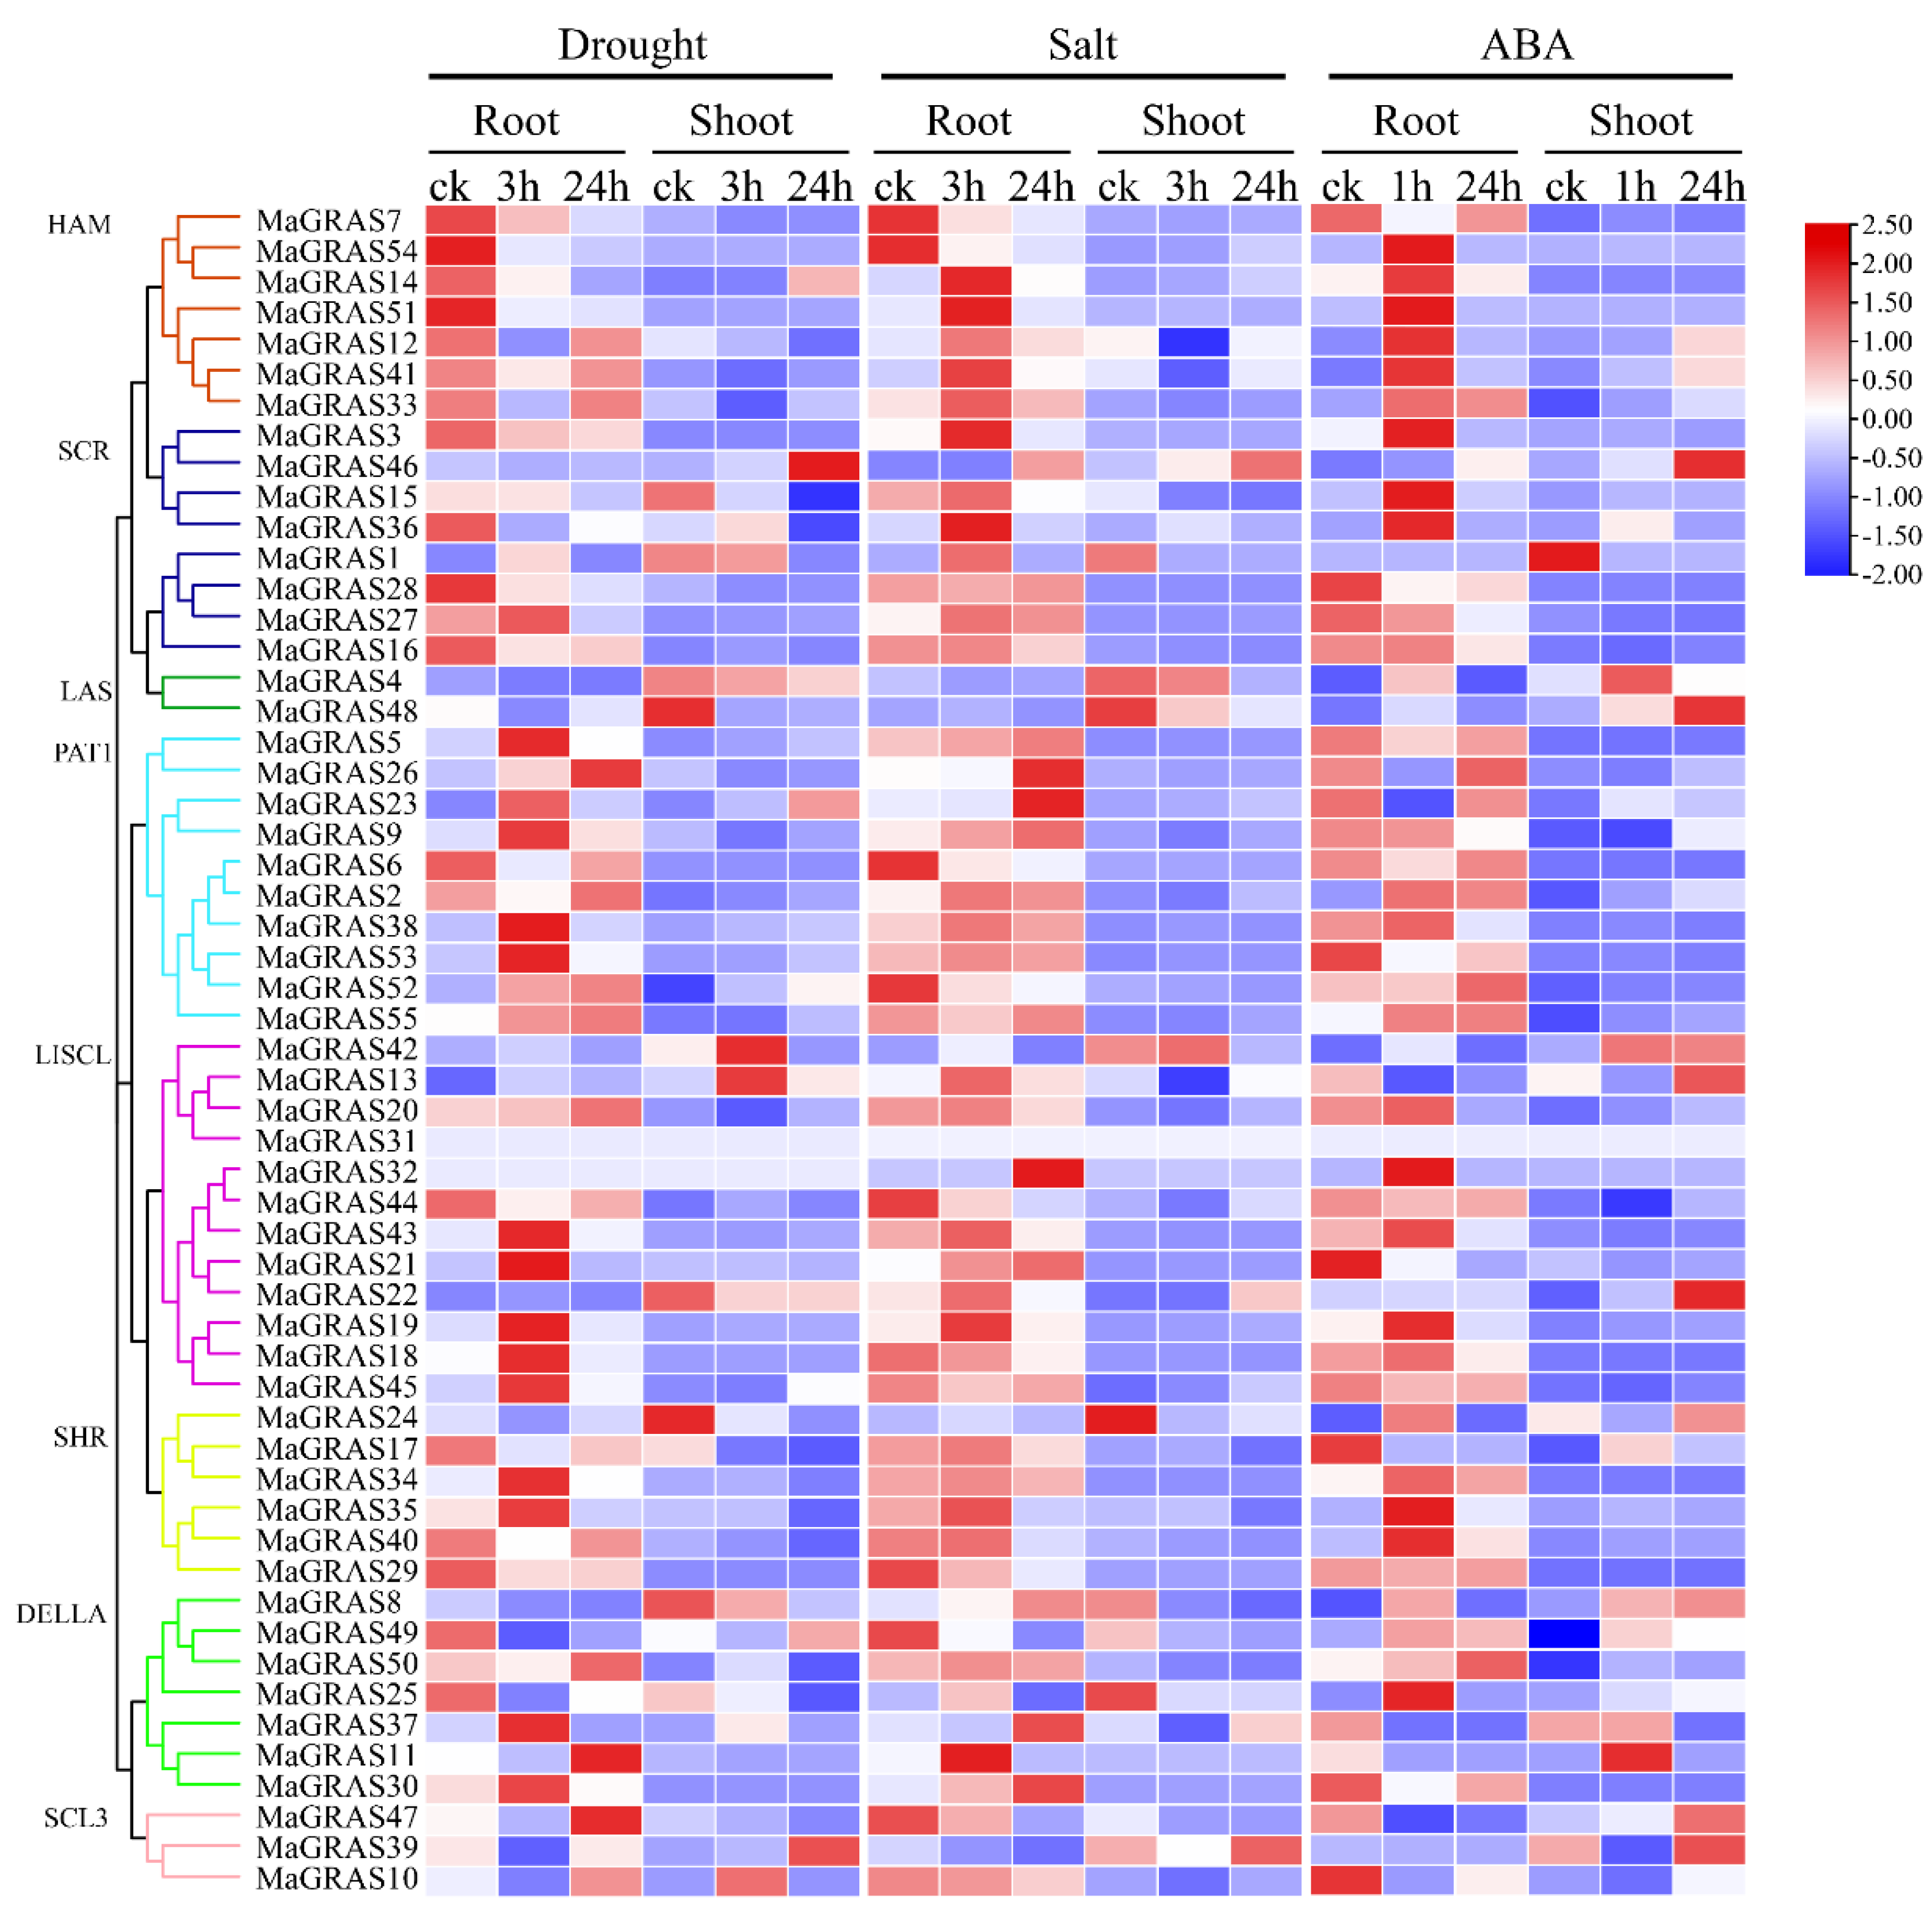
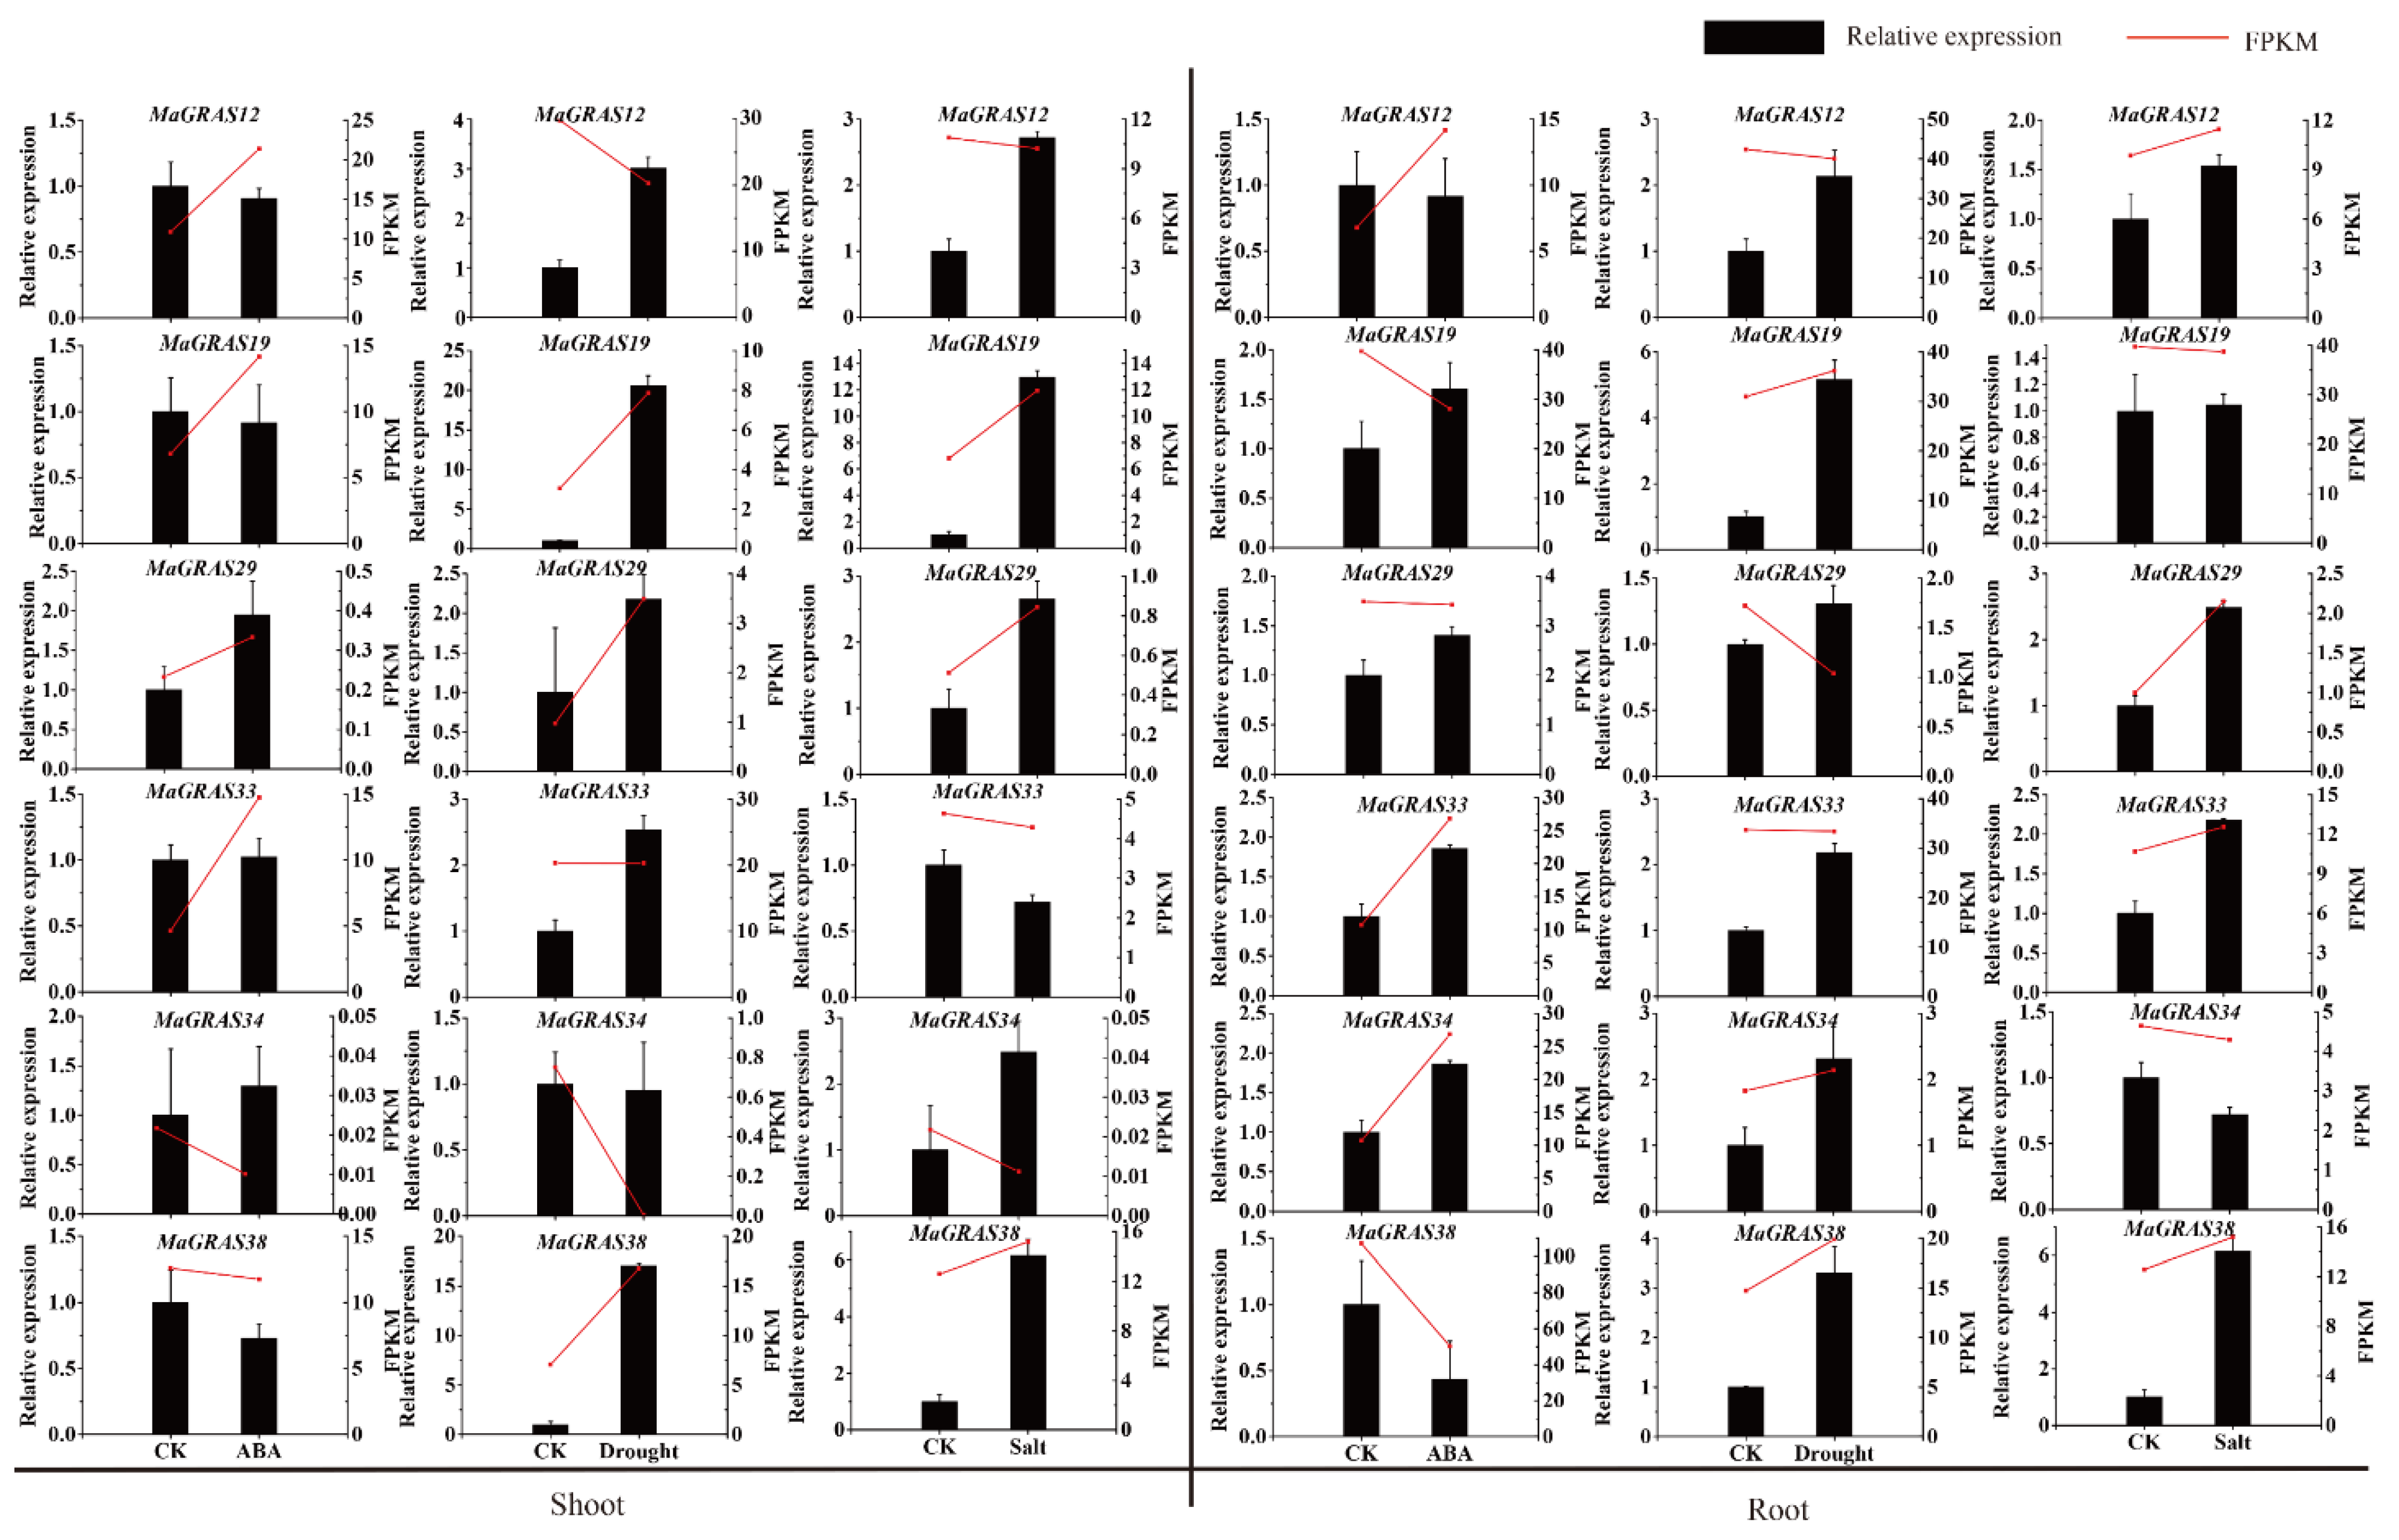
2.7. Expression Analysis of MaGRAS Genes Responding to ABA and Abiotic Stresses

GRAS genes are involved in the response of plants to abiotic stresses, such as drought and salt [30]. In this study, the transcriptome data sets of M. albus treated with ABA, salt and drought stresses were used to explore the functions of MaGRAS genes under abiotic stresses. As a result, we determined that 48 (87.3%) and 35 (63.6%) MaGRAS genes were expressed in roots and shoots under at least 1 stress condition (FPKM ≥ 1), respectively. In shoots and roots under ABA and abiotic stress conditions, 29 (52.7%) and 22 (40.0%) MaGRAS genes were expressed (FPKM ≥ 1), respectively, and 13 (23.6%) and 2 (3.6%) MaGRAS genes were highly expressed (FPKM ≥ 10), respectively (Supplementary Table S4). The expression of 32 (19 in roots; 13 in shoots), 34 (25 in roots; 12 in shoots), and 49 (25 in roots; 24 in shoots) MaGRAS genes was upregulated under ABA, salt and drought stresses, respectively. Notably, five and seven MaGRAS genes were upregulated under ABA and abiotic stress conditions in the roots and shoots, respectively (Figure 7).
Compared with the control, among the 55 expressed MaGRAS genes, 27, 23 and 14 differentially expressed MaGRAS genes were identified in the roots of M. albus under drought, salt and ABA stresses, respectively. A total of 29, 26 and 34 differentially expressed MaGRAS genes were identified in the shoots of M. albus under drought, salt and ABA stresses, respectively (Supplementary Figure S4). Meanwhile, we identified five and ten MaGRAS genes that were differentially expressed under three stress conditions in the roots and shoots, respectively. Fourteen and five MaGRAS genes were differentially expressed in shoots and roots under drought and salt stress, respectively. Two and eight MaGRAS genes were differentially expressed in shoots and roots under ABA and salt stress, respectively, and four and ten MaGRAS genes were differentially expressed in shoots and roots under ABA and drought stress, respectively, which indicated that many MaGRAS genes were involved in the response to abiotic stresses with independent on ABA. We determined that 46 (83.6%) MaGRAS genes were differentially expressed in roots and shoots under drought, salt and ABA stresses, and these genes were evenly distributed in 8 subfamilies. The other genes showed subfamily–specific characteristics, and the expression of MaGRAS genes clustered in PAT1 and LISCL subfamilies were highly upregulated under ABA, drought and salt stresses. The expression of most genes clustered in HAM and SCR subfamilies was highly upregulated under ABA and salt stress, while the expression of most genes clustered in SHR and DELLA subfamilies was only highly upregulated under ABA stress.
In addition, in order to further verify the RNA–Seq data, six MaGRAS genes responding to ABA, drought and salt stresses were selected for qRT–PCR validation. The expression trends of most MaGRAS genes tested are consistent with the results of RNA–Seq analysis (Figure 8). Most of the tested genes were up–regulated under drought, salt and ABA stresses, indicating that they were positive regulatory genes, for example, MaGRAS19 and MaGRAS29 were upregulated in shoots and roots under drought and salt stresses, but MaGRAS38 was downregulated in shoots and roots under ABA stress, which was similar to the RNA–Seq analysis results. These results indicated that MaGRAS genes play an important regulatory role in dealing with drought, salt stresses and ABA treatment.

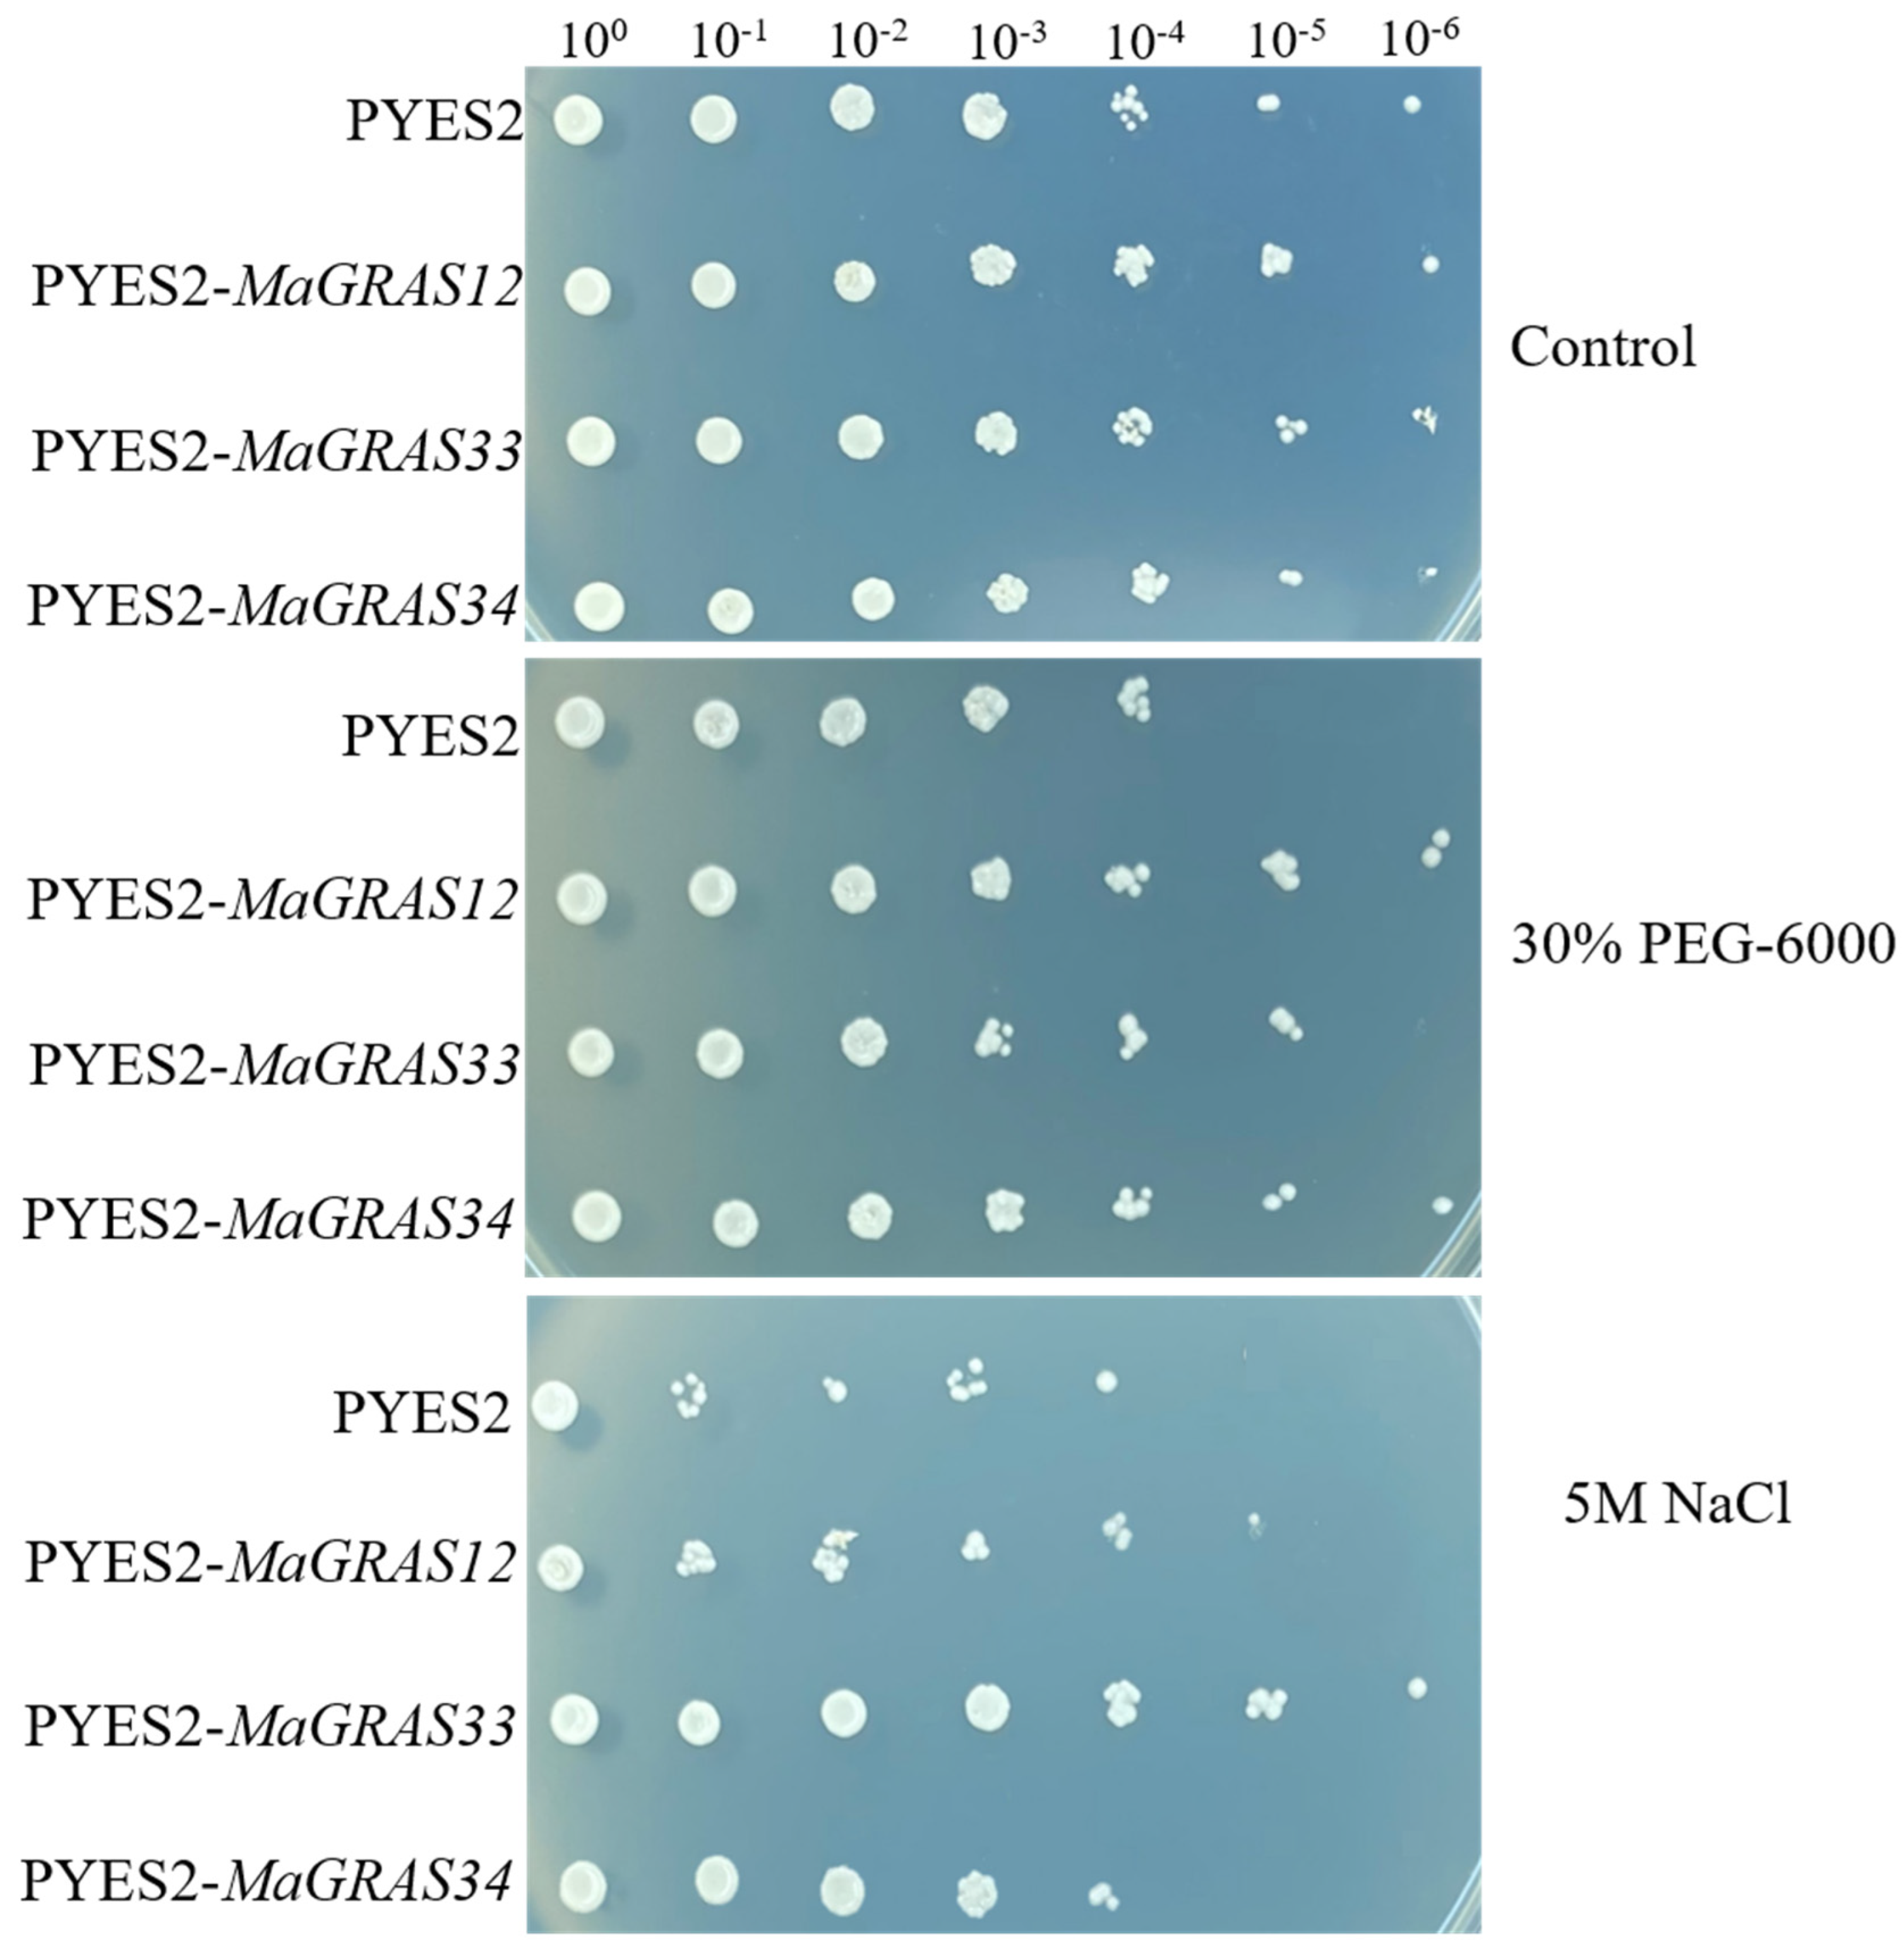
2.8. MaGRAS Genes Improved the Tolerance of Yeast to Abiotic Stresses

The results of qRT–PCR showed that the expression levels of MaGRAS12, MaGRAS33 and MaGRAS34 were upregulated under drought and salt stress. In order to further verify the functions, the drought and salt tolerance functions of these genes were discussed by yeast heterologous expression analysis (Figure 9). The results showed that transgenic yeast cells of three MaGRAS genes and yeast cells transformed with empty vectors grew well and no difference under the control treatment. Meanwhile, we observed that the yeast cells transformed with MaGRAS12 and MaGRAS34 genes showed significant tolerance under 30% PEG–6000 treatments, especially under 100,000 times dilution, and the yeast cells transformed with the MaGRAS33 gene showed drought and salt tolerance under 100,000 times dilution. We observed that the yeast cells transformed with MaGRAS33 gene showed significant tolerance under 5 M NaCl treatment, especially under 1,000,000 times dilution; followed by the MaGRAS12, the MaGRAS34 transformed yeast cells had no difference with the control.

3. Discussion

GRAS genes widely exist in plants and play an important role in plant development and various physiological processes [30]. Genomic identification and the evolutionary relationship of GRAS family has been explored in many species with the rapid development of whole–genome sequencing technologies. Nevertheless, the identification of GRAS gene family and the study of gene function in M. albus has not been previously reported. Therefore, this study confirmed and comprehensively analyzed the members of GRAS family in M. albus, which allowed us to study the evolution of M. albus GRAS family and speculate the biological functions of some unknown MaGRAS genes.
In this study, we identified and characterized 55 MaGRAS genes based on M. albus genome database, which were close to those of rice (60) [9] and alfalfa (68) [11], lower than those of soybean (117) [38] and wheat (153) [10] and higher than those of A. thaliana (34) [38] and barley (Hordeum vulgare) (34) [41]. This result was also paralleled to the genome size of different species, which shows that there is a positive correlation between the number of GRAS family genes and the genome size of the species. Evolutionary analysis showed that the MaGRAS proteins fit into eight subfamilies. Among the subfamilies, LISCL was the largest subfamily with 12 MaGRAS genes, and the PAT1 and DELLA subfamilies also consisted of multiple genes. MaGRAS proteins had been identified in every sub–population of A. thaliana, which indicates that these GRAS genes may play some fundamental biological functions during the long–term evolution of M. albus [42].
Studies have shown that gene duplication was the evolutionary force behind the expansion of the GRAS gene family [43]. In this study, all MaGRAS genes were unevenly distributed on eight chromosomes. Most of which are located on chromosome 4 (12 genes) and 7 (11 genes), and the number of MaGRAS genes on chromosome 6 is the least (2 genes). Interestingly, three groups of tandemly duplicated MaGRAS genes were found on chromosomes 4 and 7 (two/chr4, one/chr7). In addition to tandem duplications, a considerable number of MaGRAS family genes were derived from segmental duplication events, 10 pairs of duplicated segments in MaGRAS genes were evenly distributed on eight chromosomes. Gene fragment duplication can expand the number of MaGRAS genes in different subgroups, and many orthologous MaGRAS genes are produced on different chromosomes. The MaGRAS genes involved in segmental duplication events are mainly distributed in SHR (two genes), HAM (four genes), LISCL (two genes), PAT1 (eight genes) and SCR (three genes) subfamilies, among which MaGRAS genes from group PAT1 are distributed on different chromosomes (MaGRAS2 and MaGRAS5 on chromosome 1, MaGRAS6 and MaGRAS9 on chromosome 2, MaGRAS26 on chromosome 4, MaGRAS38 on chromosome 5, MaGRAS53 and MaGRAS55 on chromosome 8) and are products of gene segmental duplication events. Studies have shown that gene duplication events are common in GRAS gene family. For example, GRAS2 and GRAS34 in A. thaliana [9], GRAS15 and GRAS53 in tomato [44] and GRAS17 and GRAS60 in rice [9] were identified as duplicated genes, which further confirmed that gene duplication may be a mechanism for the expansion of GRAS family members.
In addition, the pattern analysis of the exon–intron of gene families can provide additional insights into their evolution [44]. It has been reported that the main reason for the absence of intron genes in gene families is the rapid duplication after horizontal gene transfer at the bacterial level [45]. Consistent with reports from other species, such as A. thaliana (67.6%) [9], tomato (77.4%) [45] and populus (54.7%) [42], the exon–intron structure analysis of the GRAS gene family in M. albus shows that most MaGRAS genes lack introns (87%) (Figure 4B). The high proportion of intronless genes in the gene family can further indicate the close evolutionary relationship of these family proteins [44]. Besides GRAS gene family, intronless genes have also been found in other gene families of plants, such as small auxin up–regulated RNAs (SAUR) [46] and F–box transcription factor [47]. Meanwhile, the change of introns in the process of evolution can be considered as a necessary way for gene families to acquire new gene functions [48]. Compared with most the genes of soybean PAT1 subfamily, which contain introns in 5′UTRS (untranslated region) [38], genes of PAT1 subfamily in M. albus do not contain introns. There are two genes in LISCL subfamily, including two introns and four introns, respectively, which indicates that the structure of GRAS genes is species–specific. Moreover, GRAS proteins belonging to the same taxonomic branch show a common evolutionary origin and have conserved motifs related to their functions [43]. These specific conserved motifs ensure the interaction of GRAS proteins and the characteristics of DNA binding modifications [49]. In this study, the 20 motifs predicted by MEME are classified into 5 conserved domains: LRHI, VHIID, LRHII, PFYRE and SAW are located at C–terminal of GRAS proteins (Figure 4C). Interestingly, MEME motifs in the five C–terminal conserved domains fluctuate with different subfamilies, especially the 2, 4, 12, 13 motifs are not present in every MaGRAS protein with SAW conserved domain, which may correspond to different functions of MaGRAS proteins in different subfamilies. Most MaGRAS proteins contain five conserved domains at the C–terminal, but the HAM subfamily (Malbus0503484.1) lacks the conserved domain of LRHII, the LISCL subfamily (Malbus0503351.1) lacks the conserved domain of VHIID, and the DELLA subfamily (Malbus0704150.1) lacks the conserved domains of LRHII, PFYRE and SAW. Generally speaking, the structural relationship between MaGRAS proteins can indicate their functional similarities and differences. Furthermore, we predicted the protein interactions of different subfamilies of GRAS in M. albus. The MaGRAS14 gene of HAM subfamily can interact with multiple subfamilies, which may be the hub for regulating the functions of different proteins. MaGRAS51 can interact with the nodulation–related transcription factor MaGRAS29. MaGRAS51 may be involved in the formation and development of nodules in M. albus, but this needs further experimental verification.
GRAS genes are widely participated in regulating plant development and various stress responses [50,51]. In this study, the cis–acting elements in the 2000bp promoter regions upstream of MaGRAS genes were identified (Figure 5). It was found that the phytohormone response elements (auxin, gibberellin and methyl jasmonate, etc.) and abiotic stresses elements (defense, low temperature and drought, etc.) existed widely, and some elements related to plant growth and development (meristem expression, etc.) were also found. It is suggested that GRAS genes of M. albus play an important role in regulating plant development and responding to different stresses. Studies have shown that GRAS genes are expressed in many plant organs and tissues, including flowers, fruits, leaves, stems, roots and nodules [52], and the expression levels of GRAS genes will change according to plant development stage, species and environmental conditions [21]. In our study, tissue expression analysis showed that 14 MaGRAS genes had no discernible expression levels in 5 tissues (Supplementary Table S3), which indicated that these genes may have lost their functions in the process of evolution. A total of 27 (49.1%) MaGRAS genes were expressed in flowers, seeds, leaves, stems and roots tissues according to M. albus transcription analysis, indicating that these genes may participate in the regulation of plant growth and development. Noticeably, the gene expression of HAM, SHR, SCR and PAT1 subfamilies was the highest in all five tissues during the development of M. albus (Figure 6). MaGRAS52 (orthologous to AtPAT1) and MaGRAS38 (orthologous to AtSCL13 and AtSCL21) in the PAT1 subfamily were highly transcribed in leaves, and they are functionally involved in the signal transduction of photosensitive pigments [53,54]. AtSCL3, an orthology of MaGRAS48 (SCL3 subfamily), showed high expression in flowers, indicating that they might play a role in pollination/fertilization [55]. MaGRAS12 (orthologous to AtSHR) in the SHR subfamily and MaGRAS46 (orthologous to AtSCR) in the SCR subfamily were highly expressed in roots, which may be involved in the growth and development of roots [12,13]. According to the results of qRT–PCR analysis (Figure 6), MaGRAS36 (orthologous to At5g41920.1, At3g54220.1) and MaGRAS19 (orthologous to At4g08250.1) were specifically expressed in nodule, which may be involved in signal transduction in the process of nodulation. In summary, MaGRAS proteins are involved in different processes of plant development, which can lay a foundation for further research on the growth and development of M. albus.
At present, many studies have shown that GRAS genes have potential regulatory effects under various abiotic stresses [56]. In soybean (Glycine max), GmGRAS37 was significantly upregulated under drought and salt stresses, and the overexpression of GmGRAS37 gene improved soybean resistance [57]. BrLAS gene in Brassica rapa can limit water loss by controlling stomatal opening, thus playing a role in drought resistance [58]. In our study, most of the genes can be induced obviously in roots but not in leaves (Figure 7), which indicates that the expression of M. albus GRAS genes are tissue specific. Additionally, we found that 52.7% and 40.0% MaGRAS genes were expressed in roots and stems under ABA and abiotic stresses, respectively, and most of MaGRAS genes belong to PAT1, LISCL and DELLA subfamilies. Notably, nine MaGRAS genes were up–regulated under ABA and abiotic stresses, and four of them (MaGRAS2, MaGRAS23, MaGRAS38 and MaGRAS55) were distributed in PAT1 subfamily. The expression levels of PAT1 subfamily genes Gh_D01G0564 and Gh_A04G0196 in cotton (Gossypium hirsutum) increased obviously under salt, drought, cold and high temperature stress, which indicated that PAT1 subfamily genes played an important regulatory role in plant response to abiotic stresses [51]. Meanwhile, compared to control samples, there were 46 (83.6%) MaGRAS genes differentially expressed in the roots and shoots under under ABA, drought and salt stress treatments, and these MaGRAS genes were evenly distributed in 8 subfamilies. In addition, the expression of TaTLP2–B and TaCRK68–A can significantly enhance the tolerance of yeast cells under abiotic stress conditions, and the yeast heterologous expression is an important method to verify the function of genes under abiotic stress conditions [59,60]. In this study, MaGRAS12 and MaGRAS34 can significantly enhanced the tolerance of yeast cells under drought treatment, while MaGRAS33 can significantly enhance the tolerance of yeast cells under salt treatment (Figure 8). In future studies, these genes can be used to develop transgenic plants tolerant to abiotic stresses. These results indicated that MaGRAS genes play vital roles in the regulation of M. albus response to ABA and abiotic stresses.

4. Materials and Methods

4.1. Identification of the GRAS Genes in M. albus

The genome sequences [36] and RNA–seq data [61,62] of M. albus was obtained from College of Pastoral Agriculture Science and Technology, Lanzhou University. GRAS gene sequences of A. thaliana and M. truncatula are downloaded from the Phytozome database (https://phytozome.jgi.doe.gov/pz/portal.html, accessed on 5 February 2022) for searching and identifying GRAS sequences in M. albus genome. The putative GRAS genes were submitted to CDD (https://www.ncbi.nlm.nih.gov/Structure/bwrpsb/bwrpsb.cgi, accessed on 5 February 2022), Pfam (http://pfam.xfam.org/, accessed on 5 February 2022) and SMART (http://smart.embl-heidelberg.de/, accessed on 5 February 2022); all GRAS proteins were identified by the GRAS domain (PF03514) in the Hidden Markov Model (HMM) profile. The online tool EXPASY (http://web.expasy.org/protparam/, accessed on 5 February 2022) [63] was used to analyze the molecular weights, amino acid residues, grand average of hydropathicity and isoelectric points were of MaGRAS genes. The online tool CELLO v2.5 system (http://cello.life.nctu.edu.tw, accessed on 5 February 2022) was used to predict the subcellular localization of MaGRAS genes [64].

4.2. Phylogenetic Analysis and Classification of MaGRASs

The full–length amino acid sequences of GRASs derived from 55 MaGRASs, 34 AtGRASs and 68 MtGRASs were used for phylogenetic analysis. Sequence alignment was performed using Ctlustal X with the default settings [65]. The neighbor–joining phylogenetic tree was constructed by using MEGA 7.0 software, and 1000 boot tests were performed to support statistical reliability [66]. According to orthology with AtGRASs and MtGRASs, the MaGRAS genes were further divided into 8 subgroups.

4.3. Chromosomal Mapping and Gene Duplication Analysis of MaGRAS Genes

The location information of all MaGRAS genes in the M. albus genome was extracted and submitted to the online tool MAP Gene 2 Chromosome V2 (http://mg2c.iask.in/mg2c_v2.1/, accessed on 10 February 2022) to display the MaGRAS genes on the corresponding chromosomal locations. The collinearity of 55 MaGRAS genes was analyzed by TBtools software [67].

4.4. Analysis of Gene Structures and Motif Composition of MaGRAS Genes

The full–length amino acid sequences of 55 MaGRASs were used for construct unrooted phylogenetic tree, and the genes were further divided into 8 different subfamilies. The MEME was employed (http://meme-suite.org/, accessed on 15 February 2022) to identify the conserved motifs of MaGRAS proteins in M. albus by set MEME to find 20 motifs. [68]. TBtools was used to analyze and visualize the exon–intron structure of MaGRAS members in M. albus genome [67].

4.5. The Prediction of Protein–Protein for MaGRAS Proteins

The prediction of protein–protein interactions of MaGRAS protein subfamilies was performed by the online tool STRING 11.5 (https://cn.string-db.org/cgi/input?sessionId=P9OZVCkjeo8u&input_page_show_search=on, accessed on 27 June 2022), with reference to the protein–protein interactions of the GRAS proteins of M. truncatula.

4.6. Identification of Putative Cis–Elements in MaGRAS Genes

Sequences of 2000bp from the upstream promoters of the MaGRAS genes were extracted by TBtools software [67], and submitted to PlantCARE website (http://bioinformatics.psb.ugent.be/webtools/plantcare/html/, accessed on 21 February 2022) to identify the cis–acting elements in the promoter regions [69].

4.7. Transcriptome Analysis for Tissue–Specific Expression and Stress Treatment

Transcriptome data of the MaGRAS genes in different tissues (roots, leaves, seeds, flowers and stems) and under ABA, drought and salt stress in M. albus were obtained from our previous study [61,62]. The analysis of RNA–seq data were the same as those in a previous study [62]. The M. albus genes expression levels were estimated based on fragments per kilobase of exon model per million mapped reads (FPKM) [61]. TBtools software was used to show a heat map and a Venn diagram of the MaGRAS genes expression profile [67].

4.8. Quantitative Real–Time PCR Analysis for Tissue–Specific Expression and Stress Treatment

Using TransZol reagent (TransGen Biotech, Beijing, China), the total RNA was extracted from stress treatment of the shoots (leaves and stems) and roots of control and treated seedlings (ABA, drought and salt stress) and from different tissues of the roots, nodules, stems, flowers and leaves samples during the flowering stage. Reverse transcription and cDNA synthesis were performed using the cDNA synthesis kit (Sangon Biotech Ltd., Shanghai, China) from 1 μg of total RNA. The quantitative primers designed by PerlPrimer software (Supplementary Table S5). The qRT–PCR experiment was carried out with Hieff® qPCR SYBR® Green Master Mix (No Rox) (Yeasen Biotech Co., Ltd., Shanghai, China) on a CFX96 Real–Time PCR Detection System (Bio–Rad, Los Angeles, CA, USA). The qRT–PCR reaction procedure is 40 cycles of 95 °C for 5 s, 60 °C for 15 s, and 72 °C for 34 s. The expression level of Maβ–tubulin gene was used as control. The relative expression level of each gene was calculated by 2−ΔΔCT method [70], and the experiment was set up for 3 biological repetitions.

4.9. Functional Verification of Heterologous Expression Genes in Yeast

The full–length coding sequences of MaGRAS12, MaGRAS33 and MaGRAS34 were amplified using the cDNA as the template, and ClonExpress® MultiS One Step Cloning Kit (Vazyme Biotech Co., Ltd., Nanjing, China) was used to connect the pYES2 expression vector. Specific amplification primers used in this experiment are listed in Supplementary Table S5. The empty pYES2 plasmid and recombinant pYES2–MaGRAS12, MaGRAS33 and MaGRAS34 plasmids were transferred into Saccharomyces cerevisiae strain INVSc1. The method is consistent with previous studies [62,71]. The 4 yeast cultures were independently grown in synthetic complete (SC)–Ura liquid medium containing 2% (m/v) galactose at 30 °C for 36 h up to A600 = 0.4. Then, yeast was collected and adjusted with SC–Ura containing 2% galactose and cultured to A600 = 1 for stress analysis. The same number of yeast cells were resuspended in 30% PEG–6000 and 5 M NaCl. Then, the serial dilutions (100, 10−1, 10−2, 10−3, 10−4, 10−5, 10−6) were spotted on SC–Ura agar plates and incubated at 30 °C for three days. As a control, yeast A600 = 1 was also spotted on SC–Ura agar plate with the same dilution as the treatment and grew at 30 °C for three days. The colony growth was observed, and the expression of binding protein was recorded by taking photos.

5. Conclusions

This study represents the first comprehensive identification and analysis of the GRAS gene family of M. albus. All 55 MaGRAS genes are divided into 8 subfamilies and unevenly distributed on chromosomes 1 to 8 in M. albus. GRAS proteins of the same subfamily have similar protein motifs. Gene structure analysis showed that MaGRAS genes had few introns and were highly conserved in M. albus. The promoter region contains many plant hormone response elements and stress response elements. In addition, gene expression analysis using RNA–seq data and qRT–PCR showed that MaGRAS genes played an important role in plant growth and development, ABA and abiotic stress responses. The remarkable tolerance of yeast cells expressing MaGRAS12, MaGRAS33 and MaGRAS34 further established their roles in drought and salt stresses. Taken together, these results provide useful insights for future research on the function of MaGRAS genes in stress response and the development of transgenic plants.

Supplementary Materials

The following supporting information can be downloaded at: https://www.mdpi.com/article/10.3390/ijms23137403/s1.

Author Contributions

S.W.: Conceptualization, Methodology, Validation, Formal analysis, Investigation, Data curation, Writing original draft, Visualization. Z.D.: Methodology, Writing review & editing. Q.Y.: Methodology, Investigation. F.W.: Formal analysis. P.Z.: Investigation. J.Z.: Conceptualization, Methodology, Resources, Writing review & editing, Project administration, Funding acquisition, Supervision. All authors have read and agreed to the published version of the manuscript.

Funding

This study was supported by the National Natural Science Foundation of China (NSFC–CGIAR; No. 32061143035), the Gansu Provincial Science and Technology Major Projects (19ZD2NA002), the 111 Project (B12002).

Institutional Review Board Statement

Not applicable.

Informed Consent Statement

Not applicable.

Data Availability Statement

The genomic data of M. ablus are openly available in NCBI (NCBI BioProject ID PRJNA674670).

Conflicts of Interest

The authors declare no declarations of interest.

References

  1. Peng, J.R.; Carol, P.; Richards, D.E.; King, K.E.; Cowling, R.J.; Murphy, G.P.; Harberd, N.P. The Arabidopsis GAI gene defines a signaling pathway that negatively regulates gibberellin responses. Genes Dev. 1997, 11, 3194–3205. [Google Scholar] [CrossRef] [PubMed] [Green Version]
  2. Silverstone, A.L.; Ciampaglio, C.N.; Sun, T.P. The Arabidopsis RGA gene encodes a transcriptional regulator repressing the gibberellin signal transduction pathway. Plant Cell 1998, 10, 155–169. [Google Scholar] [CrossRef] [Green Version]
  3. DiLaurenzio, L.; WysockaDiller, J.; Malamy, J.E.; Pysh, L.; Helariutta, Y.; Freshour, G.; Hahn, M.G.; Feldmann, K.A.; Benfey, P.N. The SCARECROW gene regulates an asymmetric cell division that is essential for generating the radial organization of the Arabidopsis root. Cell 1996, 86, 423–433. [Google Scholar] [CrossRef] [Green Version]
  4. Bolle, C. The role of GRAS proteins in plant signal transduction and development. Planta 2004, 218, 683–692. [Google Scholar] [CrossRef]
  5. Pysh, L.D.; Wysocka–Diller, J.W.; Camilleri, C.; Bouchez, D.; Benfey, P.N. The GRAS gene family in Arabidopsis: Sequence characterization and basic expression analysis of the SCARECROW–LIKE genes. Plant J. 1999, 18, 111–119. [Google Scholar] [CrossRef] [PubMed]
  6. Sun, X.; Xue, B.; Jones, W.T.; Rikkerink, E.; Dunker, A.K.; Uversky, V.N. A functionally required unfoldome from the plant kingdom: Intrinsically disordered N–terminal domains of GRAS proteins are involved in molecular recognition during plant development. Plant Mol. Biol. 2011, 77, 205–223. [Google Scholar] [CrossRef] [PubMed]
  7. Sun, X.; Jones, W.T.; Harvey, D.; Edwards, P.J.B.; Pascal, S.M.; Kirk, C.; Considine, T.; Sheerin, D.J.; Rakonjac, J.; Oldfield, C.J.; et al. N–Terminal Domains of DELLA Proteins Are Intrinsically Unstructured in the Absence of Interaction with GID1/Gibberellic Acid Receptors. J. Biol. Chem. 2010, 285, 11557–11571. [Google Scholar] [CrossRef] [PubMed] [Green Version]
  8. Hirsch, S.; Oldroyd, G.E.D. GRAS–domain transcription factors that regulate plant development. Plant Signal. Behav. 2009, 4, 698–700. [Google Scholar] [CrossRef] [Green Version]
  9. Tian, C.; Wan, P.; Sun, S.; Li, J.; Chen, M.J.P.M.B. Genome–Wide Analysis of the GRAS Gene Family in Rice and Arabidopsis. Plant Mol. Biol. 2004, 54, 519–532. [Google Scholar] [CrossRef] [PubMed]
  10. Chen, K.; Li, H.; Chen, Y.; Zheng, Q.; Li, B.; Li, Z. TaSCL14, a Novel Wheat (Triticum aestivum L.) GRAS Gene, Regulates Plant Growth, Photosynthesis, Tolerance to Photooxidative Stress, and Senescence. J. Genet. Genom. 2015, 42, 21–32. [Google Scholar] [CrossRef]
  11. Song, L.; Tao, L.; Cui, H.; Ling, L.; Guo, C. Genome–wide identification and expression analysis of the GRAS family proteins in Medicago truncatula. Acta Physiol. Plant. 2017, 39, 93. [Google Scholar] [CrossRef]
  12. Helariutta, Y.; Fukaki, H.; Wysocka–Diller, J.; Nakajima, K.; Jung, J.; Sena, G.; Hauser, M.T.; Benfey, P.N. The SHORT–ROOT gene controls radial patterning of the Arabidopsis root through radial signaling. Cell 2000, 101, 555–567. [Google Scholar] [CrossRef] [Green Version]
  13. Cui, H.; Levesque, M.P.; Vernoux, T.; Jung, J.W.; Paquette, A.J.; Gallagher, K.L.; Wang, J.Y.; Blilou, I.; Scheres, B.; Benfey, P.N. An evolutionarily conserved mechanism delimiting SHR movement defines a single layer of endodermis in plants. Science 2007, 316, 421–425. [Google Scholar] [CrossRef] [Green Version]
  14. Heo, J.-O.; Chang, K.S.; Kim, I.A.; Lee, M.-H.; Lee, S.A.; Song, S.-K.; Lee, M.M.; Lim, J. Funneling of gibberellin signaling by the GRAS transcription regulator SCARECROW–LIKE 3 in the Arabidopsis root. Proc. Natl. Acad. Sci. USA 2011, 108, 2166–2171. [Google Scholar] [CrossRef] [PubMed] [Green Version]
  15. Ho–Plagaro, T.; Molinero–Rosales, N.; Farina Flores, D.; Villena Diaz, M.; Manuel Garcia–Garrido, J. Identification and Expression Analysis of GRAS Transcription Factor Genes Involved in the Control of Arbuscular Mycorrhizal Development in Tomato. Front. Plant Sci. 2019, 10, 268. [Google Scholar] [CrossRef] [PubMed]
  16. Li, K.; Yu, R.; Fan, L.-M.; Wei, N.; Chen, H.; Deng, X.W. DELLA–mediated PIF degradation contributes to coordination of light and gibberellin signalling in Arabidopsis. Nat. Commun. 2016, 7, 11868. [Google Scholar] [CrossRef] [Green Version]
  17. Navarro, L.; Bari, R.; Achard, P.; Lisón, P.; Nemri, A.; Harberd, N.P.; Jones, J.D.G. DELLAs control plant immune responses by modulating the balance of jasmonic acid and salicylic acid signaling. Curr. Biol. 2008, 18, 650–655. [Google Scholar] [CrossRef] [PubMed]
  18. Dill, A.; Jung, H.S.; Sun, T.P. The DELLA motif is essential for gibberellin–induced degradation of RGA. Proc. Natl. Acad. Sci. USA 2001, 98, 14162–14167. [Google Scholar] [CrossRef] [Green Version]
  19. Muntha, S.T.; Zhang, L.; Zhou, Y.; Zhao, X.; Hu, Z.; Yang, J.; Zhang, M. Phytochrome A signal transduction 1 and CONSTANS–LIKE 13 coordinately orchestrate shoot branching and flowering in leafy Brassica juncea. Plant Biotechnol. J. 2019, 17, 1333–1343. [Google Scholar] [CrossRef] [Green Version]
  20. Huang, W.; Xian, Z.; Kang, X.; Tang, N.; Li, Z. Genome–wide identification, phylogeny and expression analysis of GRAS gene family in tomato. BMC Plant Biol. 2015, 15, 209. [Google Scholar] [CrossRef] [Green Version]
  21. Hirsch, S.; Kim, J.; Munoz, A.; Heckmann, A.B.; Downie, J.A.; Oldroyd, G.E.D. GRAS Proteins Form a DNA Binding Complex to Induce Gene Expression during Nodulation Signaling in Medicago truncatula. Plant Cell 2009, 21, 545–557. [Google Scholar] [CrossRef] [PubMed] [Green Version]
  22. Kalo, P.; Gleason, C.; Edwards, A.; Marsh, J.; Mitra, R.M.; Hirsch, S.; Jakab, J.; Sims, S.; Long, S.R.; Rogers, J.; et al. Nodulation signaling in legumes requires NSP2, a member of the GRAS family of transcriptional regulators. Science 2005, 308, 1786–1789. [Google Scholar] [CrossRef]
  23. Fode, B.; Siemsen, T.; Thurow, C.; Weigel, R.; Gatz, C. The Arabidopsis GRAS Protein SCL14 Interacts with Class II TGA Transcription Factors and Is Essential for the Activation of Stress–Inducible Promoters. Plant Cell 2008, 20, 3122–3135. [Google Scholar] [CrossRef] [PubMed] [Green Version]
  24. Yuan, Y.; Fang, L.; Karungo, S.K.; Zhang, L.; Gao, Y.; Li, S.; Xin, H. Overexpression of VaPAT1, a GRAS transcription factor from Vitis amurensis, confers abiotic stress tolerance in Arabidopsis. Plant Cell Rep. 2016, 35, 655–666. [Google Scholar] [CrossRef] [PubMed]
  25. Ma, H.-S.; Liang, D.; Shuai, P.; Xia, X.-L.; Yin, W.-L. The salt– and drought–inducible poplar GRAS protein SCL7 confers salt and drought tolerance in Arabidopsis thaliana. J. Exp. Bot. 2010, 61, 4011–4019. [Google Scholar] [CrossRef] [PubMed] [Green Version]
  26. Xu, K.; Chen, S.; Li, T.; Ma, X.; Liang, X.; Ding, X.; Liu, H.; Luo, L. OsGRAS23, a rice GRAS transcription factor gene, is involved in drought stress response through regulating expression of stress–responsive genes. BMC Plant Biol. 2015, 15, 141. [Google Scholar] [CrossRef] [Green Version]
  27. Li, P.; Zhang, B.; Su, T.; Li, P.; Xin, X.; Wang, W.; Zhao, X.; Yu, Y.; Zhang, D.; Yu, S.; et al. BrLAS, a GRAS Transcription Factor from Brassica rapa, Is Involved in Drought Stress Tolerance in Transgenic Arabidopsis. Front. Plant Sci. 2018, 9, 1792. [Google Scholar] [CrossRef] [Green Version]
  28. Awan, M.; Habib, S.; Li, N.; Yang, L.; Li, Z. Overexpression of SlGRAS7 Affects Multiple Behaviors Leading to Confer Abiotic Stresses Tolerance and Impacts Gibberellin and Auxin Signaling in Tomato. Int. J. Genom. 2019, 2019, 4051981. [Google Scholar]
  29. Liu, Y.; Huang, W.; Xian, Z.; Hu, N.; Lin, D.; Ren, H.; Chen, J.; Su, D.; Li, Z. Overexpression of SIGRAS40 in Tomato Enhances Tolerance to Abiotic Stresses and Influences Auxin and Gibberellin Signaling. Front. Plant Sci. 2017, 8, 1659. [Google Scholar] [CrossRef]
  30. Khan, Y.; Xiong, Z.; Zhang, H.; Liu, S.; Yaseen, T.; Hui, T. Expression and roles of GRAS gene family in plant growth, signal transduction, biotic and abiotic stress resistance and symbiosis formation—A review. Plant Biol. 2022, 24, 404–416. [Google Scholar] [CrossRef]
  31. Wang, N.; Wang, K.; Li, S.; Jiang, Y.; Li, L.; Zhao, M.; Jiang, Y.; Zhu, L.; Wang, Y.; Su, Y.; et al. Transcriptome–Wide Identification, Evolutionary Analysis, and GA Stress Response of the GRAS Gene Family in Panax ginseng CA Meyer. Plants 2020, 9, 190. [Google Scholar] [CrossRef] [PubMed] [Green Version]
  32. Li, M.; Wang, X.; Li, C.; Li, H.; Zhang, J.; Ye, Z. Silencing GRAS2 reduces fruit weight in tomato. Chin. Bull. Bot. 2018, 60, 16. [Google Scholar] [CrossRef] [PubMed] [Green Version]
  33. Wu, F.; Luo, K.; Yan, Z.; Zhang, D.; Yan, Q.; Zhang, Y.; Yi, X.; Zhang, J. Analysis of miRNAs and their target genes in five Melilotus albus NILs with different coumarin content. Sci. Rep. 2018, 8, 14138. [Google Scholar] [CrossRef]
  34. Zhang, J.; Di, H.; Kai, L.; Jahufer, Z.; Wu, F.; Duan, Z.; Stewart, A.; Yan, Z.; Wang, Y. Coumarin Content, Morphological Variation, and Molecular Phylogenetics of Melilotus. Molecules 2018, 23, 810. [Google Scholar] [CrossRef] [Green Version]
  35. Zabala, J.M.; Marinoni, L.; Giavedoni, J.A.; Schrauf, G.E. Breeding strategies in Melilotus albus Desr., a salt–tolerant forage legume. Euphytica 2018, 214, 22. [Google Scholar] [CrossRef]
  36. Wu, F.; Duan, Z.; Xu, P.; Yan, Q.; Meng, M.; Cao, M.; Jones, C.S.; Zong, X.; Zhou, P.; Wang, Y.; et al. Genome and systems biology of Melilotus albus provides insights into coumarins biosynthesis. Plant Biotechnol. J. 2022, 20, 592–609. [Google Scholar] [CrossRef] [PubMed]
  37. Wei, Y.; Shi, H.; Xia, Z.; Tie, W.; Ding, Z.; Yan, Y.; Wang, W.; Hu, W.; Li, K. Genome–Wide Identification and Expression Analysis of the WRKY Gene Family in Cassava. Front. Plant Sci. 2016, 7, 25. [Google Scholar] [CrossRef] [PubMed] [Green Version]
  38. Wang, L.; Ding, X.; Gao, Y.; Yang, S. Genome–wide identification and characterization of GRAS genes in soybean (Glycine max). BMC Plant Biol. 2020, 20, 415. [Google Scholar] [CrossRef] [PubMed]
  39. Hirano, Y.; Nakagawa, M.; Suyama, T.; Murase, K.; Shirakawa, M.; Takayama, S.; Sun, T.-p.; Hakoshima, T. Structure of the SHR–SCR heterodimer bound to the BIRD/IDD transcriptional factor JKD. Nat. Plants 2017, 3, 17010. [Google Scholar] [CrossRef] [Green Version]
  40. Long, Y.; Goedhart, J.; Schneijderberg, M.; Terpstra, I.; Shimotohno, A.; Bouchet, B.P.; Akhmanova, A.; Gadella, T.W.J., Jr.; Heidstra, R.; Scheres, B.; et al. SCARECROW–LIKE23 and SCARECROW jointly specify endodermal cell fate but distinctly control SHORT–ROOT movement. Plant J. 2015, 84, 773–784. [Google Scholar] [CrossRef]
  41. To, V.-T.; Shi, Q.; Zhang, Y.; Shi, J.; Shen, C.; Zhang, D.; Cai, W. Genome–Wide Analysis of the GRAS Gene Family in Barley (Hordeum vulgare L.). Genes 2020, 11, 553. [Google Scholar] [CrossRef] [PubMed]
  42. Liu, X.; Widmer, A.J.P.M.B.R. Genome–wide Comparative Analysis of the GRAS Gene Family in Populus, Arabidopsis and Rice. Plant Mol. Biol. Rep. 2014, 32, 1129–1145. [Google Scholar] [CrossRef]
  43. Zhang, H.; Cao, Y.; Shang, C.; Li, J.; Wang, J.; Wu, Z.; Ma, L.; Qi, T.; Fu, C.; Bai, Z.; et al. Genome–wide characterization of GRAS family genes in Medicago truncatula reveals their evolutionary dynamics and functional diversification. PLoS ONE 2017, 12, e0185439. [Google Scholar] [CrossRef]
  44. Niu, Y.; Zhao, T.; Xu, X.; Li, J. Genome–wide identification and characterization of GRAS transcription factors in tomato (Solanum lycopersicum). PeerJ 2017, 5, e3955. [Google Scholar] [CrossRef] [PubMed] [Green Version]
  45. Zhang, D.; Iyer, L.M.; Aravind, L. Bacterial GRAS domain proteins throw new light on gibberellic acid response mechanisms. Bioinformatics 2012, 28, 2407–2411. [Google Scholar] [CrossRef] [Green Version]
  46. Jain, M.; Tyagi, A.K.; Khurana, J.P. Genome–wide analysis, evolutionary expansion, and expression of early auxin–responsive SAUR gene family in rice (Oryza sativa). Genomics 2006, 88, 360–371. [Google Scholar] [CrossRef] [Green Version]
  47. Jain, M.; Nijhawan, A.; Arora, R.; Agarwal, P.; Ray, S.; Sharma, P.; Kapoor, S.; Tyagi, A.K.; Khurana, J.P. F–box proteins in rice. Genome–wide analysis, classification, temporal and spatial gene expression during panicle and seed development, and regulation by light and abiotic stress. Plant Physiol. 2007, 143, 1467–1483. [Google Scholar] [CrossRef] [Green Version]
  48. Iwamoto, M.; Maekawa, M.; Saito, A.; Higo, H.; Higo, K. Evolutionary relationship of plant catalase genes inferred from exon–intron structures: Isozyme divergence after the separation of monocots and dicots. Theor. Appl. Genet. 1998, 97, 9–19. [Google Scholar] [CrossRef]
  49. Liu, L.; White, M.J.; MacRae, T.H. Transcription factors and their genes in higher plants. Eur. J. Biochem. 1999, 262, 247–257. [Google Scholar] [CrossRef]
  50. Liu, M.; Huang, L.; Ma, Z.; Sun, W.; Wu, Q.; Tang, Z.; Bu, T.; Li, C.; Chen, H. Genome–wide identification, expression analysis and functional study of the GRAS gene family in Tartary buckwheat (Fagopyrum tataricum). BMC Plant Biol. 2019, 19, 342. [Google Scholar] [CrossRef] [Green Version]
  51. Zhang, B.; Liu, J.; Yang, Z.E.; Chen, E.Y.; Zhang, C.J.; Zhang, X.Y.; Li, F.G. Genome–wide analysis of GRAS transcription factor gene family in Gossypium hirsutum L. BMC Genom. 2018, 19, 348. [Google Scholar] [CrossRef] [PubMed]
  52. Heckmann, A.B.; Lombardo, F.; Miwa, H.; Perry, J.A.; Bunnewell, S.; Parniske, M.; Wang, T.L.; Downie, J.A. Lotus japonicus nodulation requires two GRAS domain regulators, one of which is functionally conserved in a non–legume. Plant Physiol. 2006, 142, 1739–1750. [Google Scholar] [CrossRef] [PubMed] [Green Version]
  53. Torres–Galea, P.; Huang, L.-F.; Chua, N.-H.; Bolle, C. The GRAS protein SCL13 is a positive regulator of phytochrome–dependent red light signaling, but can also modulate phytochrome A responses. Mol. Genet. Genom. 2006, 276, 13–30. [Google Scholar] [CrossRef]
  54. Bolle, C.; Koncz, C.; Chua, N.H. PAT1, a new member of the GRAS family, is involved in phytochrome A signal transduction. Genes Dev. 2000, 14, 1269–1278. [Google Scholar] [CrossRef]
  55. Zhang, Z.-L.; Ogawa, M.; Fleet, C.M.; Zentella, R.; Hu, J.; Heo, J.-O.; Lim, J.; Kamiya, Y.; Yamaguchi, S.; Sun, T.-P. SCARECROW–LIKE 3 promotes gibberellin signaling by antagonizing master growth repressor DELLA in Arabidopsis. Proc. Natl. Acad. Sci. USA 2011, 108, 2160–2165. [Google Scholar] [CrossRef] [PubMed] [Green Version]
  56. Bolle, C. Functional Aspects of GRAS Family Proteins. In Plant Transcription Factors; Elsevier: Amsterdam, The Netherlands, 2016. [Google Scholar]
  57. Wang, T.-T.; Yu, T.-F.; Fu, J.-D.; Su, H.-G.; Chen, J.; Zhou, Y.-B.; Chen, M.; Guo, J.; Ma, Y.-Z.; Wei, W.-L.; et al. Genome–Wide Analysis of the GRAS Gene Family and Functional Identification of GmGRAS37 in Drought and Salt Tolerance. Front. Plant Sci. 2020, 11, 4690. [Google Scholar] [CrossRef]
  58. Song, X.-M.; Liu, T.-K.; Duan, W.-K.; Ma, Q.-H.; Ren, J.; Wang, Z.; Li, Y.; Hou, X.-L. Genome–wide analysis of the GRAS gene family in Chinese cabbage (Brassica rapa ssp. pekinensis). Genomics 2014, 103, 135–146. [Google Scholar] [CrossRef] [Green Version]
  59. Sharma, A.; Sharma, H.; Rajput, R.; Pandey, A.; Upadhyay, S.K. Molecular Characterization Revealed the Role of Thaumatin–Like Proteins of Bread Wheat in Stress Response. Front. Plant Sci. 2022, 12, 807448. [Google Scholar] [CrossRef]
  60. Shumayla; Tyagi, S.; Sharma, A.; Singh, K.; Upadhyay, S.K. Genomic dissection and transcriptional profiling of Cysteine–rich receptor–like kinases in five cereals and functional characterization of TaCRK68–A. Int. J. Biol. Macromol. 2019, 134, 316–329. [Google Scholar] [CrossRef]
  61. Zong, X.; Wang, S.; Han, Y.; Zhao, Q.; Xu, P.; Yan, Q.; Wu, F.; Zhang, J. Genome–wide profiling of the potential regulatory network of lncRNA and mRNA in Melilotus albus under salt stress. Environ. Exp. Bot. 2021, 189, 104548. [Google Scholar] [CrossRef]
  62. Duan, Z.; Yan, Q.; Wu, F.; Wang, Y.; Wang, S.; Zong, X.; Zhou, P.; Zhang, J. Genome–Wide Analysis of the UDP–Glycosyltransferase Family Reveals Its Roles in Coumarin Biosynthesis and Abiotic Stress in Melilotus albus. Int. J. Mol. Sci. 2021, 22, 10826. [Google Scholar] [CrossRef] [PubMed]
  63. Gasteiger, E.; Hoogland, C.; Appel, R.D.; Ivanyi, I.; Bairoch, A.; Gattiker, A. ExPASy: The proteomics server for in–depth protein knowledge and analysis. Nucleic Acids Res. 2013, 31, 3784–3788. [Google Scholar] [CrossRef] [PubMed] [Green Version]
  64. Chou, K.C.; Shen, H.B. Cell–PLoc: A package of Web servers for predicting subcellular localization of proteins in various organisms. Nat. Protoc. 2007, 3, 153–162. [Google Scholar] [CrossRef] [PubMed]
  65. Jeanmougin, F.; Thompson, J.D.; Gouy, M.; Higgins, D.G.; Gibson, T.J. Multiple sequence alignment with Clustal x. Trends Biochem. Sci. 1998, 23, 403–405. [Google Scholar] [CrossRef]
  66. Kumar, S.; Tamura, K.; Nei, M. MEGA: Molecular Evolutionary Genetics Analysis software for microcomputers. Comput. Appl. Biosci. 1994, 10, 189–191. [Google Scholar] [CrossRef] [PubMed] [Green Version]
  67. Chen, C.; Chen, H.; Zhang, Y.; Thomas, H.R.; Frank, M.H.; He, Y.; Xia, R. TBtools: An Integrative Toolkit Developed for Interactive Analyses of Big Biological Data. Mol. Plant 2020, 13, 1194–1202. [Google Scholar] [CrossRef]
  68. Brown, P.; Baxter, L.; Hickman, R.; Beynon, J.; Moore, J.D.; Ott, S. MEME–LaB: Motif analysis in clusters. Bioinformatics 2013, 29, 1696–1697. [Google Scholar] [CrossRef] [Green Version]
  69. Lescot, M.; Dehais, P.; Thijs, G.; Marchal, K.; Moreau, Y.; Van de Peer, Y.; Rouze, P.; Rombauts, S. PlantCARE, a database of plant cis–acting regulatory elements and a portal to tools for in silico analysis of promoter sequences. Nucleic Acids Res. 2002, 30, 325–327. [Google Scholar] [CrossRef]
  70. Zhang, J.Y.; Wang, Y.R.; Nan, Z.B. Relative and absolute quantification expression analysis of CsSAMDC gene as a case. China Biotechnol. 2009, 29, 86–91. [Google Scholar]
  71. Zhang, Z.; Jin, X.; Liu, Z.; Zhang, J.; Liu, W. Genome–wide identification of FAD gene family and functional analysis of MsFAD3.1 involved in the accumulation of α–linolenic acid in alfalfa. Crop Sci. 2020, 61, 566–579. [Google Scholar] [CrossRef]
Figure 1. Phylogenetic tree constructed using GRAS proteins from M. albus (red circle), M. truncatula (green square) and A. thaliana (blue triangle). The phylogenetic tree was constructed using MEGA 7.0 and using the neighbor–joining method.
Ijms 23 07403 g001
Figure 2. Chromosomal distribution and position of 55 MaGRAS genes identified in the M. albus genome. Eight chromosomes are indicated in orange columns, and black lines indicate the position of each MaGRAS genes. Red lines represent the tandemly duplicated genes.
Ijms 23 07403 g002
Figure 3. Distribution and synteny analysis of MaGRAS genes. In the figure, the 8 M. albus chromosomes are shown in green–colored partial circles, gene IDs are indicated at the top of each bar. Background gray lines indicate all M. albus genome synteny blocks, black lines indicate the duplicated MaGRAS genes, red lines represent the tandemly duplicated MaGRAS genes.
Ijms 23 07403 g003
Figure 4. Exon–intron structure and distribution of conserved motifs of MaGRAS genes in M. albus: (A), MaGRAS proteins are categorized into 8 subfamilies, which are classified and labeled with different colors, including LISCL, SHR, PAT1, LAS, HAM, DELLA, SCR, and SCL3; (B), exon–intron structures of MaGRAS genes. Intron indicated by black line and CDS exon indicated by green boxes; (C), schematic diagram of the conserved motifs in the MaGRAS proteins. Each motif is represented by a number in the colored box. The black lines represent the non–conserved sequences. A total of 5 conserved domains and corresponding motifs in the GRAS proteins sequences are shown at the top. A scale of gene and protein length is shown at the bottom.
Ijms 23 07403 g004
Figure 5. The cis–acting elements of promoter sequences (−2000 bp) of 55 MaGRAS genes are analyzed by PlantCARE in M. albus.
Ijms 23 07403 g005
Figure 6. Expression analysis of the MaGRAS genes in different tissues: (A) a Heat map of all MaGRAS genes in different tissues based on transcriptome datasets, the expression values (FPKM) were normalized; (B) expression analysis of the MaGRAS genes in different tissues using qRT–PCR, the values shown are the means ± standard deviation of three replicates.
Ijms 23 07403 g006
Figure 7. Expression of 55 MaGRAS genes in response to drought, salt and ABA treatments. Data were retrieved from transcriptome datasets, and the clustering was performed using TBtools. The heat map shows the relative transcript level of MaGRAS genes under drought, salt and ABA stresses. The expression values (FPKM) were normalized.
Ijms 23 07403 g007
Figure 8. Gene expression analysis of six MaGRAS genes in shoots and roots under drought, salt and ABA treatments using qRT–PCR. CK represents control. Red lines indicated the expression values (FPKM) from RNA–seq data and the displayed values show the means ± standard deviation of three replicates.
Ijms 23 07403 g008
Figure 9. Drought and salt stresses tolerance analysis of MaGRAS12, MaGRAS33 and MaGRAS34 in a yeast expression system, using yeast with empty pYES2 vector as control.
Ijms 23 07403 g009
Publisher’s Note: MDPI stays neutral with regard to jurisdictional claims in published maps and institutional affiliations.

