Article

An Eleven-microRNA Signature Related to Tumor-Associated Macrophages Predicts Prognosis of Breast Cancer

by
Sharmilla Devi Jayasingam
1,
Marimuthu Citartan
2,
Anani Aila Mat Zin
3,
Timofey S. Rozhdestvensky
4,5,
Thean-Hock Tang
2 and
Ewe Seng Ch’ng
1,*
1
Department of Clinical Medicine, Advanced Medical and Dental Institute (AMDI), Universiti Sains Malaysia, Kepala Batas 13200, Penang, Malaysia
2
Department of Biomedical Science, Advanced Medical and Dental Institute (AMDI), Universiti Sains Malaysia, Kepala Batas 13200, Penang, Malaysia
3
Department of Pathology, School of Medical Sciences, Universiti Sains Malaysia, Kubang Kerian 16150, Kelantan, Malaysia
4
Medical Faculty, Core Facility Transgenic Animal and Genetic Engineering Models (TRAM), University Muenster, 48149 Muenster, Germany
5
Faculty of Applied Sciences, AIMST University, Bedong 08100, Kedah, Malaysia
*
Author to whom correspondence should be addressed.
Int. J. Mol. Sci. 2022, 23(13), 6994; https://doi.org/10.3390/ijms23136994
Submission received: 19 May 2022 / Revised: 11 June 2022 / Accepted: 13 June 2022 / Published: 23 June 2022

Abstract

:
The dysregulation of microRNAs (miRNAs) has been known to play important roles in tumor development and progression. However, the understanding of the involvement of miRNAs in regulating tumor-associated macrophages (TAMs) and how these TAM-related miRNAs (TRMs) modulate cancer progression is still in its infancy. This study aims to explore the prognostic value of TRMs in breast cancer via the construction of a novel TRM signature. Potential TRMs were identified from the literature, and their prognostic value was evaluated using 1063 cases in The Cancer Genome Atlas Breast Cancer database. The TRM signature was further validated in the external Gene Expression Omnibus GSE22220 dataset. Gene sets enrichment analyses were performed to gain insight into the biological functions of this TRM signature. An eleven-TRM signature consisting of mir-21, mir-24-2, mir-125a, mir-221, mir-22, mir-501, mir-365b, mir-660, mir-146a, let-7b and mir-31 was constructed. This signature significantly differentiated the high-risk group from the low-risk in terms of overall survival (OS)/ distant-relapse free survival (DRFS) (p value < 0.001). The prognostic value of the signature was further enhanced by incorporating other independent prognostic factors in a nomogram-based prediction model, yielding the highest AUC of 0.79 (95% CI: 0.72–0.86) at 5-year OS. Enrichment analyses confirmed that the differentially expressed genes were mainly involved in immune-related pathways such as adaptive immune response, humoral immune response and Th1 and Th2 cell differentiation. This eleven-TRM signature has great potential as a prognostic factor for breast cancer patients besides unravelling the dysregulated immune pathways in high-risk breast cancer.

1. Introduction

Tumor-associated macrophages (TAMs) are macrophages within the tumor microenvironment that play an important role in cancer initiation and progression. These macrophages could be polarized into two main phenotypes with distinct cytokine and chemokine profiles: at one extreme, the M1 phenotype demonstrates proinflammatory and microbicidal/tumoricidal characteristics while at the other extreme, the M2 phenotype shows anti-inflammatory and tumor-promoting characteristics [1]. In breast cancer, TAMs mainly demonstrate the M2 phenotype [2]. It has been shown in many studies that the regulation of breast cancer by TAMs via microRNAs constitutes one of the crucial mechanisms, although the precise interaction requires further elucidation [3].
MicroRNAs (miRNAs) are a large group of small, endogenous non-coding RNAs of 18–23 nucleotides in length. MiRNAs in general negatively regulate gene expression at the post-transcriptional level by mostly binding at the 3′ untranslated region (UTR) of target mRNAs to suppress their expression, although interaction of miRNAs with the 5′ UTR, protein coding sequence and gene promoters has also been reported [4]. Furthermore, miRNAs can positively regulate mRNA expression under certain circumstances [5].
MiRNAs are associated with immunomodulation in cancer progression and regression. Their expression patterns and implications, however, vary in different types of cancer. MiRNAs can either act as tumor suppressors or tumor promoters [6]. In addition, depending on the tumor context, miRNA which acts as a tumor suppressor in certain cancer types may act as a tumor promoter in others [7].
There are two distinct ways that TAMs are associated with miRNAs. First, miRNAs can be transported from cancer cells to TAMs to regulate TAM polarization. Reciprocally, miRNAs derived from TAMs exert their effects on cancer cells to modulate tumor progression [2]. To date, there are limited studies regarding miRNAs related to TAMs and how these TAM-related miRNAs (TRMs) modulate cancer progression, especially in breast cancer. Furthermore, the relationship between these TRMs with known clinicopathological parameters is yet to be explored. Accumulating studies have demonstrated the diagnostic and prognostic value of the miRNA signature in a variety of cancers, including a few on breast cancer [8,9,10,11,12], but none has focused on TRMs. Elucidating the role of these TRMs in breast cancer can help establish a better understanding of the interplay between TAMs and miRNAs in breast cancer progression.
This study aimed to explore the roles of miRNAs in breast cancer in relation to TAMs with a focus on M1/M2 polarization. First, this study curated the list of TRMs by a knowledge-driven literature search. By modelling the different TRM expression profiles, a novel TRM signature of prognostic value, independent of classic clinicopathological parameters, was constructed. Comprehensive analysis of this TRM signature was conducted via enrichment analyses to deduce the underpinning biological processes of TRMs in regulating breast cancer.

2. Results

The workflow of this study is summarized in Figure 1 below.

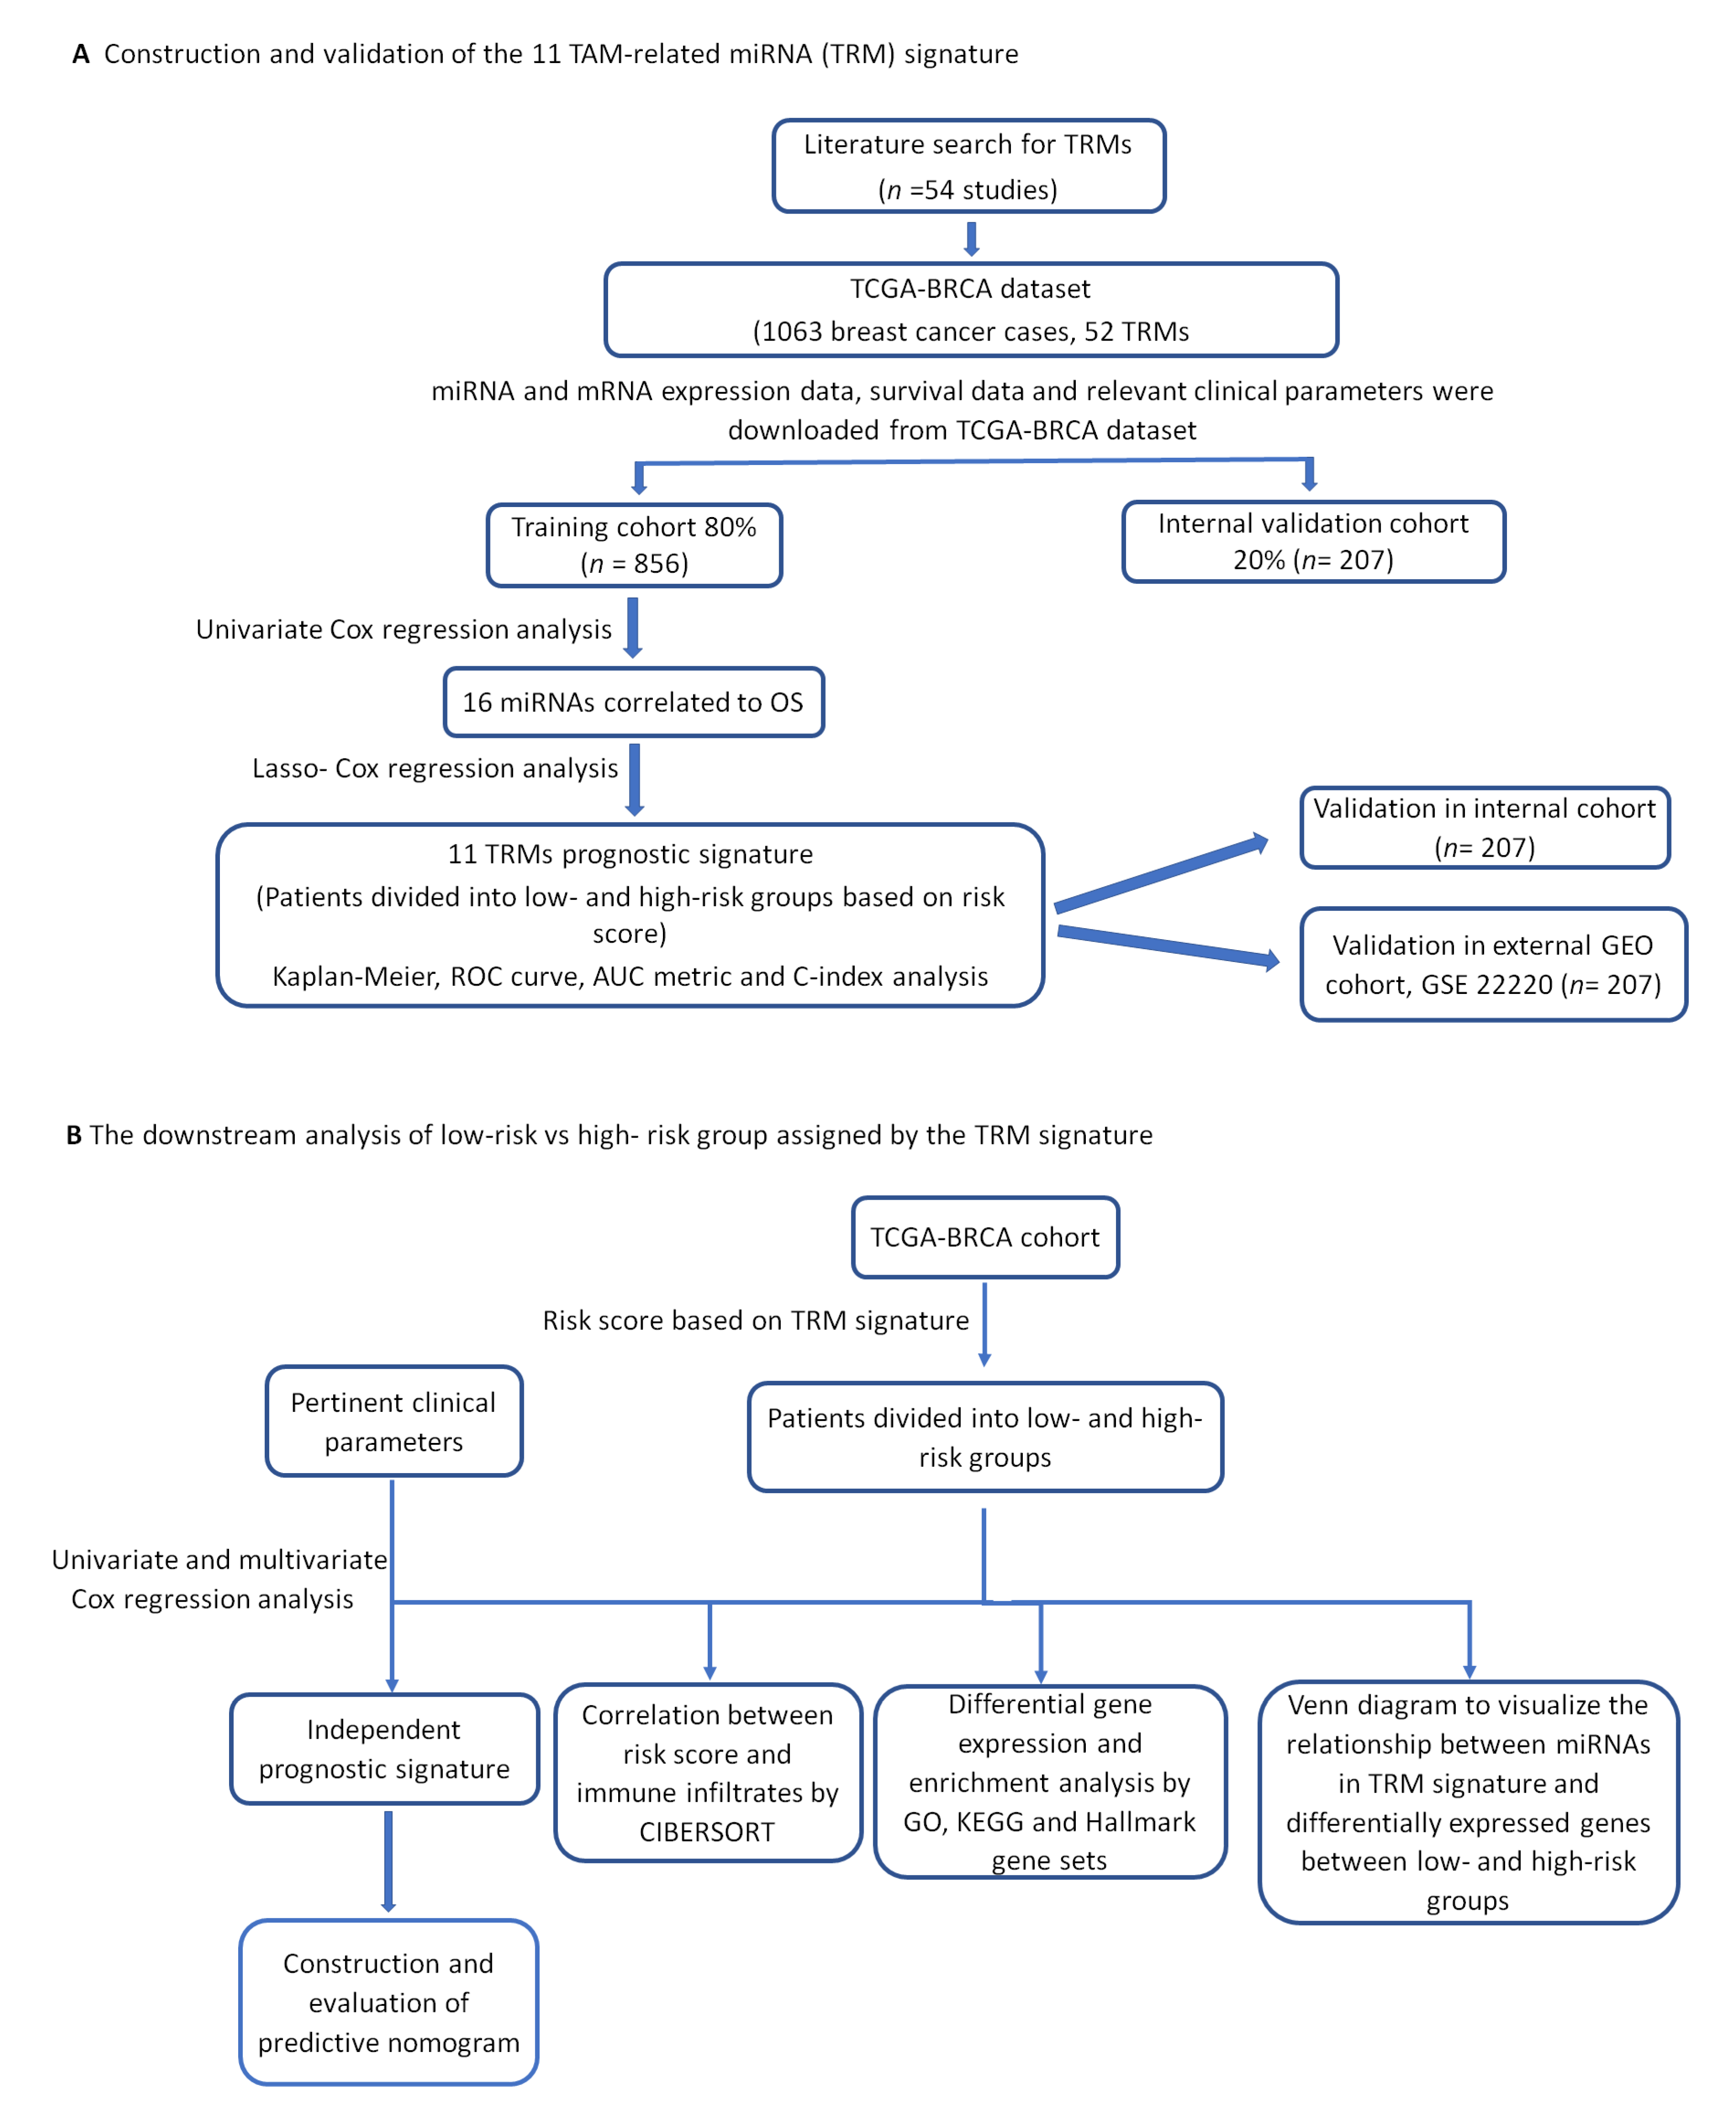
2.1. Construction of the Eleven-TAM-Related miRNA Signature

Forty-two TAM-related miRNAs from various cancer studies were identified from a total of 54 related studies (Table 1). The variations of these miRNAs’ precursors available in the TCGA-BRCA dataset (such as let-7a-1, let-7a-2 and let-7a-3 for let-7a) were also included in our analysis. Two of the TRMs (mir-720 and mir-4291) were excluded from further analysis due to the lack of expression data in the TCGA-BRCA dataset, yielding a total of 52 TRM expression profiles. From the UCSC Xena website, a total of 1063 breast cancer cases were extracted from TCGA-BRCA for primary breast cancer after removing duplicate cases and cases with incomplete overall survival (OS) time. These cases were randomly separated into 80% for the training set (n = 856) and 20% for the internal validation set (n = 207). Pertinent clinicopathological parameters of the training set, validation set and whole cohort are summarized in Supplementary Table S1.
Univariate Cox proportional hazards regression analysis showed that 16 out of the 52 TRMs had p value < 0.15 in the training cohort (Figure 2A). LASSO-Cox regression analysis ultimately incorporated 11 from the 16 TRMs in the prognostic model of the training cohort (Figure 2B,C), which contributed to the miRNAs signature. The formula of the novel risk score based on this signature was constructed as below:
Risk score = 0.263 × (mir-21 expression value) + 0.251 ×(mir-24-2 expression value) + 0.197 × (mir-125a expression value) + 0.169 × (mir-221 expression value) + 0.118 × (mir-22 expression value) + 0.093×(mir-501 expression value) + 0.053 × (mir-365b expression value) + 0.039 × (mir-660 expression value) − 0.243 ×(mir-146a expression value)-0.189 × (let-7b expression value) − 0.166 × (mir-31 expression value).

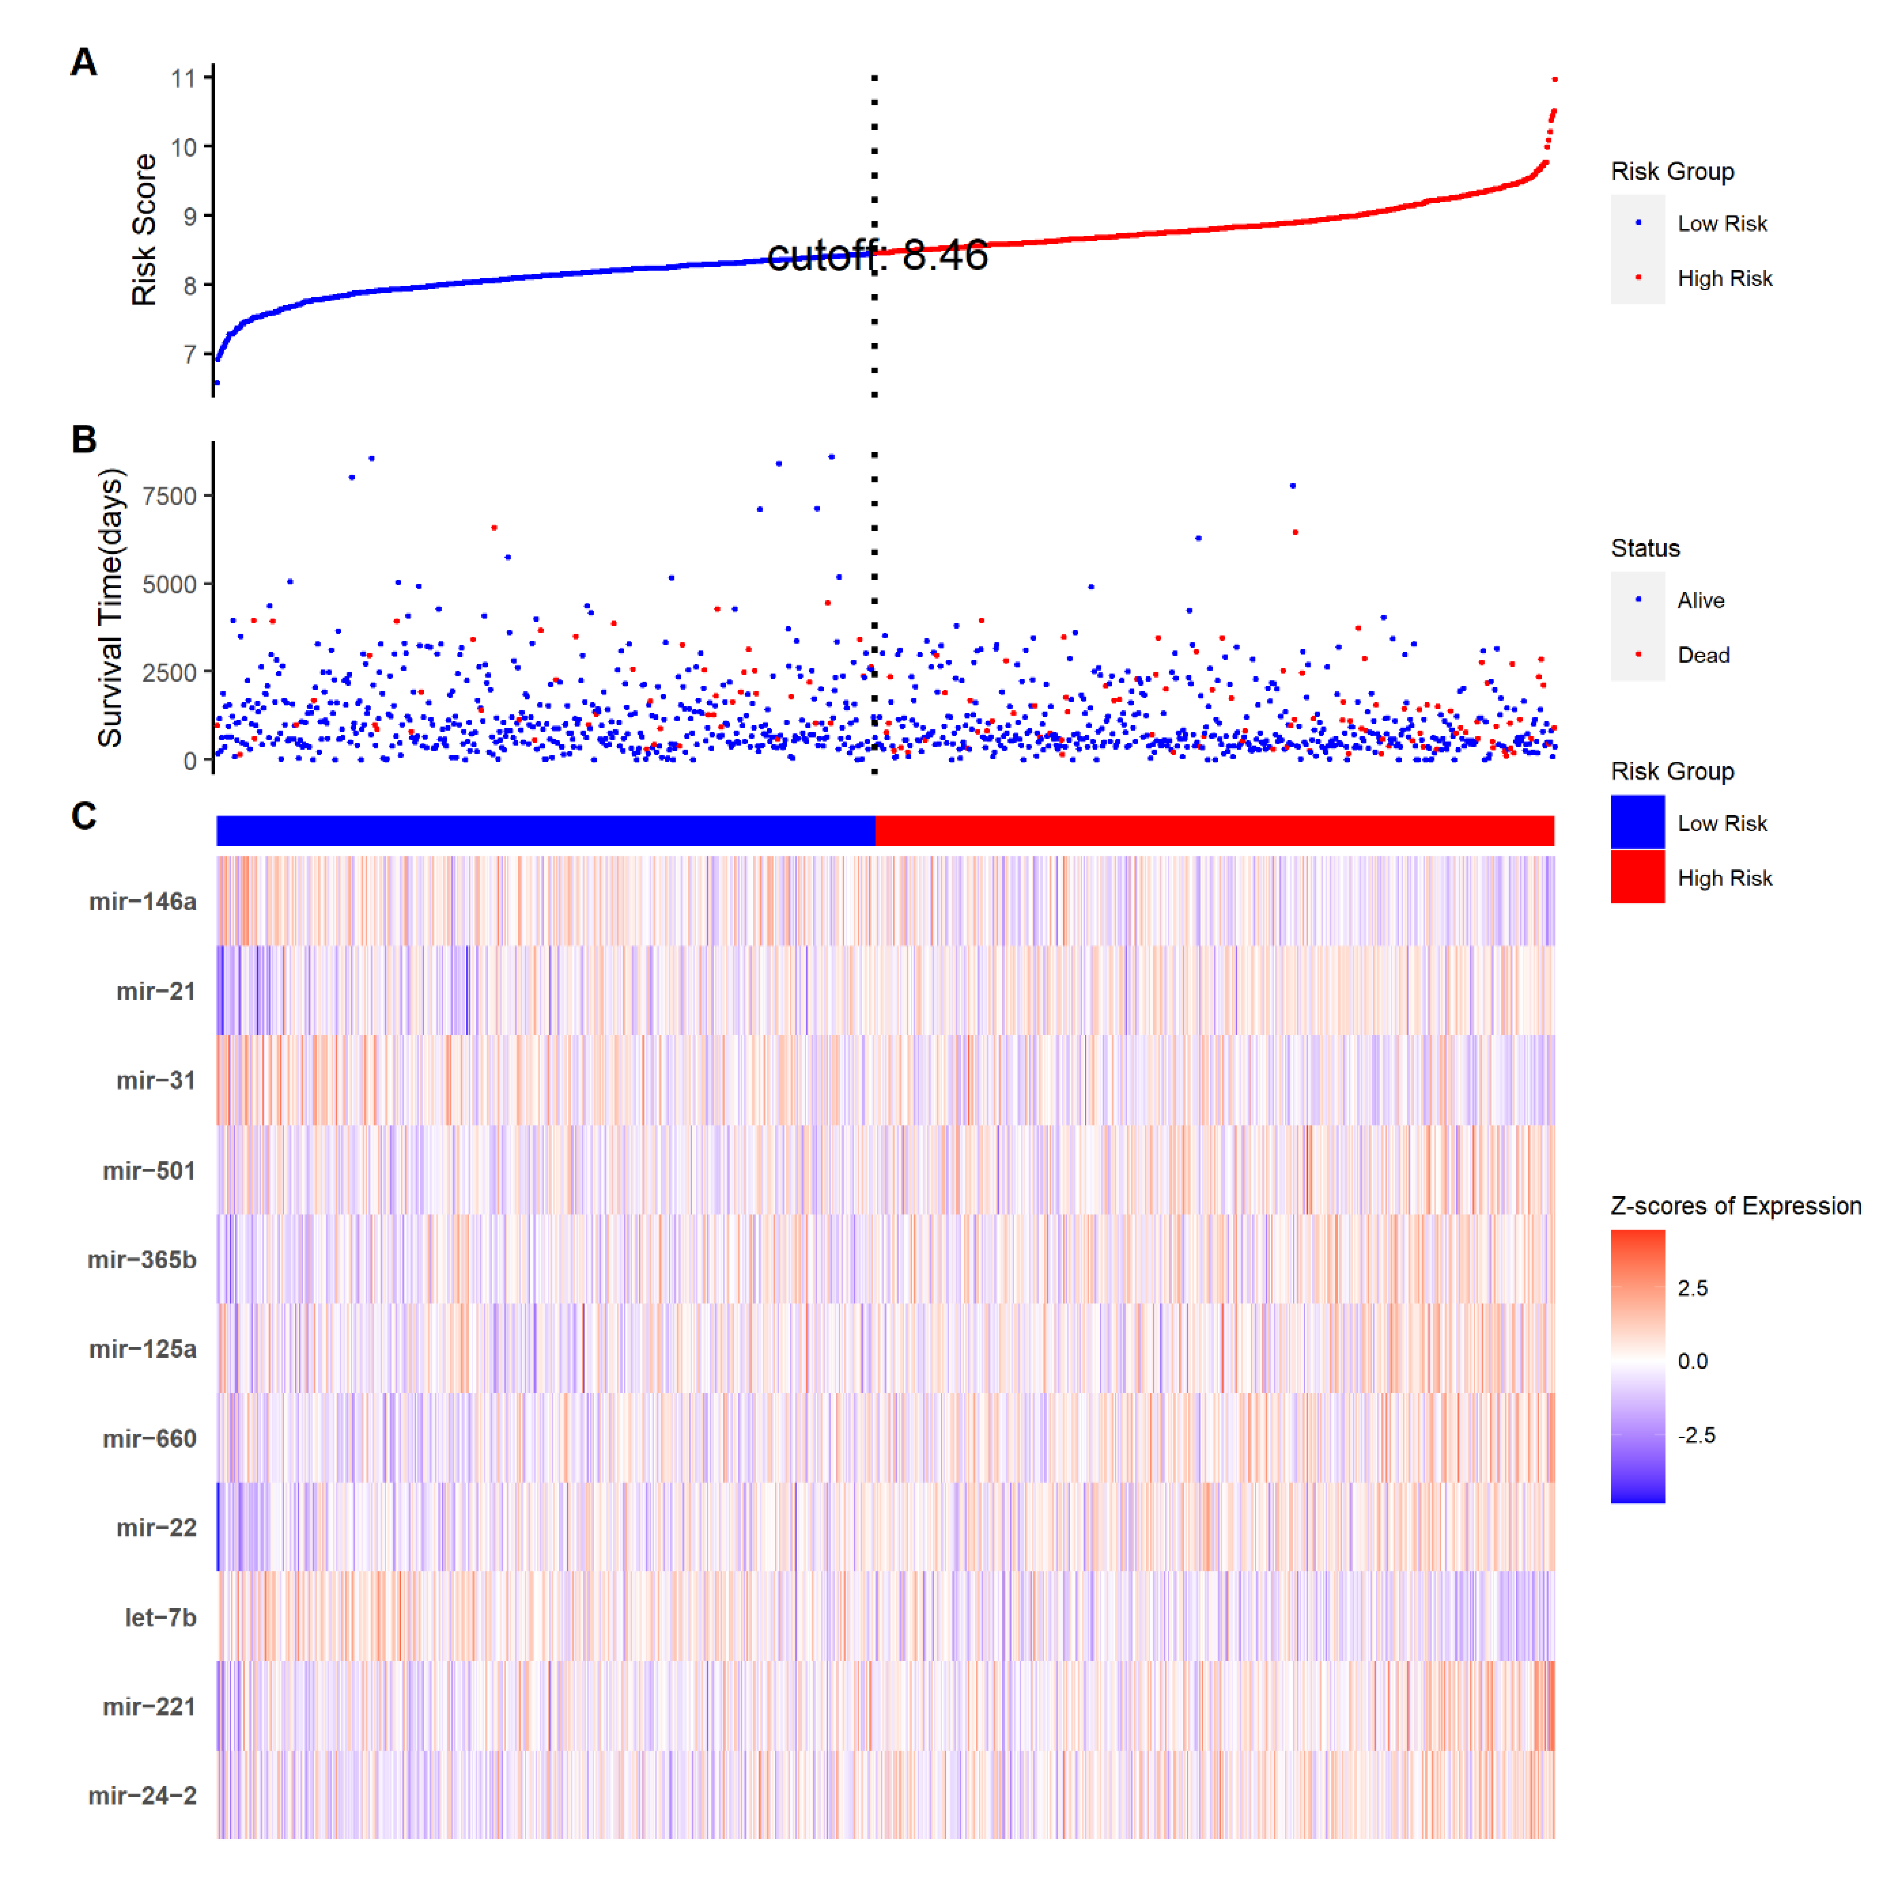
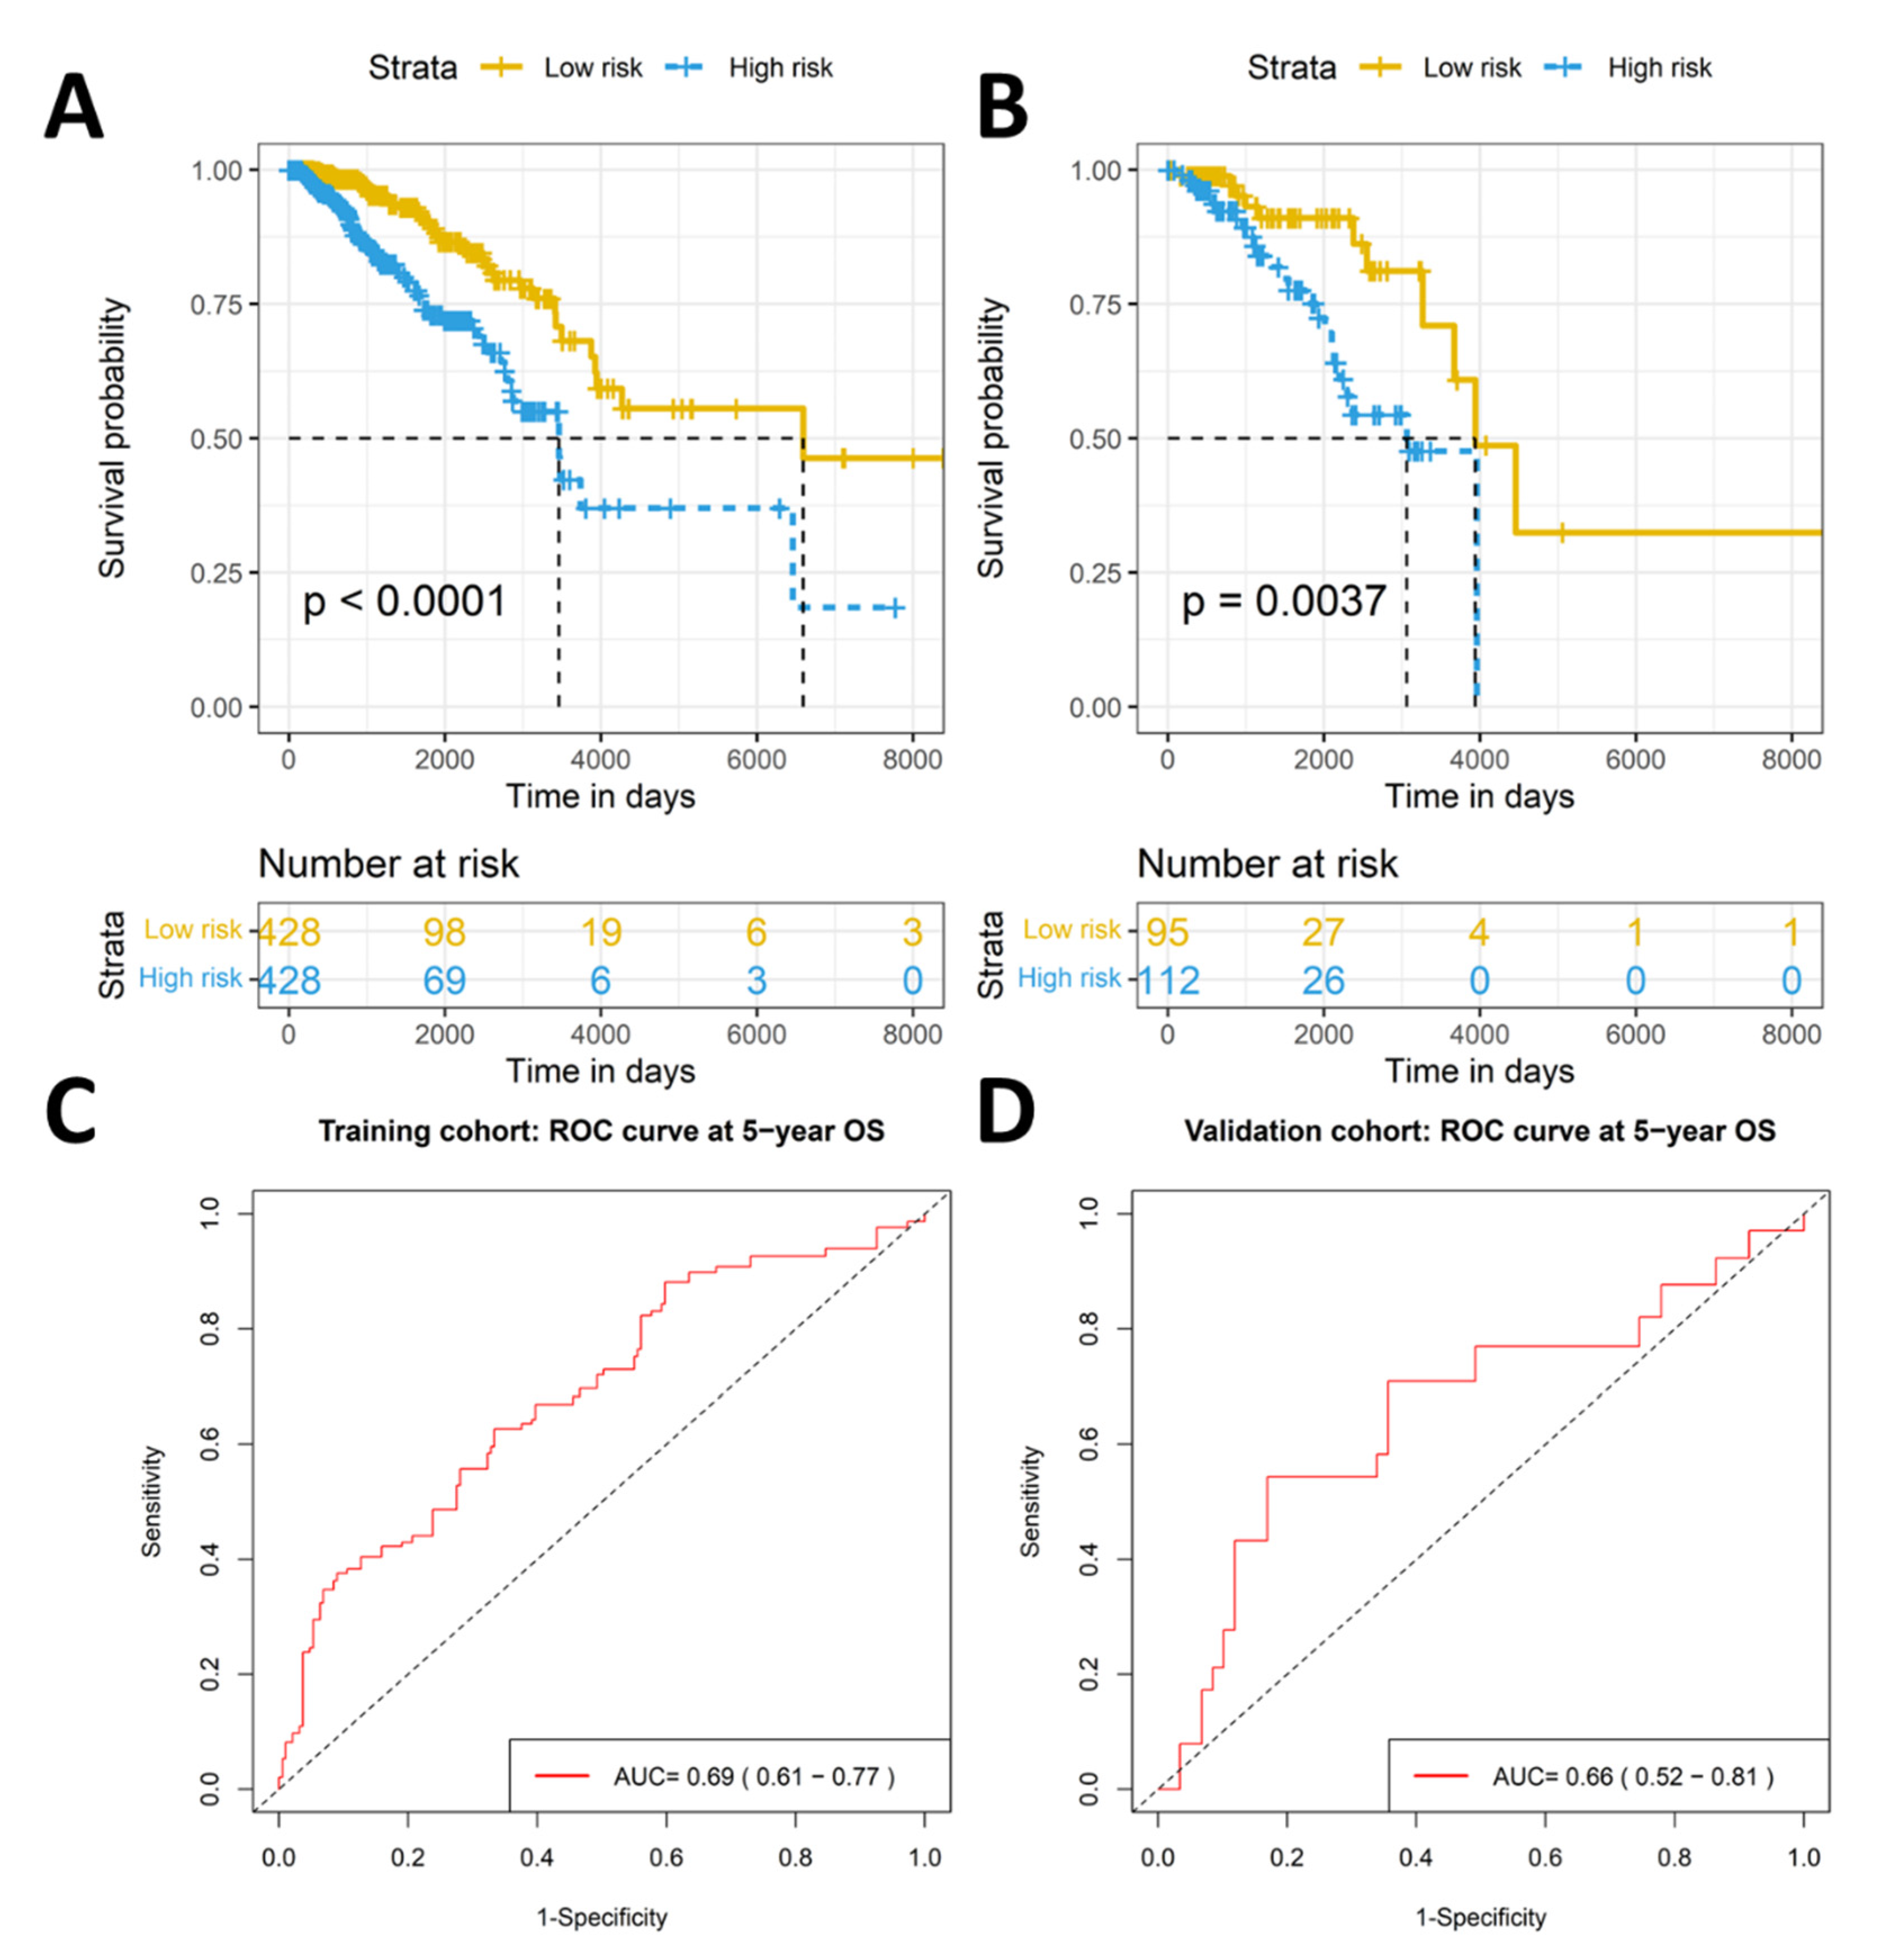
2.2. The Eleven-TAM-Related miRNA Signature Significantly Differentiate the High-Risk Group from the Low-Risk Group

The risk score for each patient was calculated based on the constructed formula (Figure 3). The reliability of the 11-TRM signature was then tested on both training and internal validation cohorts. Kaplan–Meier survival analysis with a two-sided log-rank test in the training cohort showed that patients in the high-risk group had a significantly shorter OS compared to the patients in the low-risk group (p value < 0.001) (Figure 4A).
The prognostic value of the signature was further tested in the internal validation cohort whereby a similar significant difference in OS was observed between the high- and low-risk groups (p value < 0.05) (Figure 4B). AUCs of time-dependent ROC curves at 5-year OS were 0.69 (95% CI: 0.61–0.77) and 0.66 (95% CI: 0.52–0.81) for the training and internal validation cohorts, respectively (Figure 4C,D). For the whole cohort, patients of the high-risk group had significantly shorter OS (p value < 0.001), and the AUCs of time-dependent ROC curves at 3-, 5- and 10-year OS were 0.68 (95% CI: 0.61–0.76), 0.68 (95% CI: 0.62–0.75) and 0.75 (95% CI: 0.66–0.84), respectively (Supplementary Figure S1). The C-index for the risk score of the whole cohort was 0.68 (95% CI: 0.63–0.74).

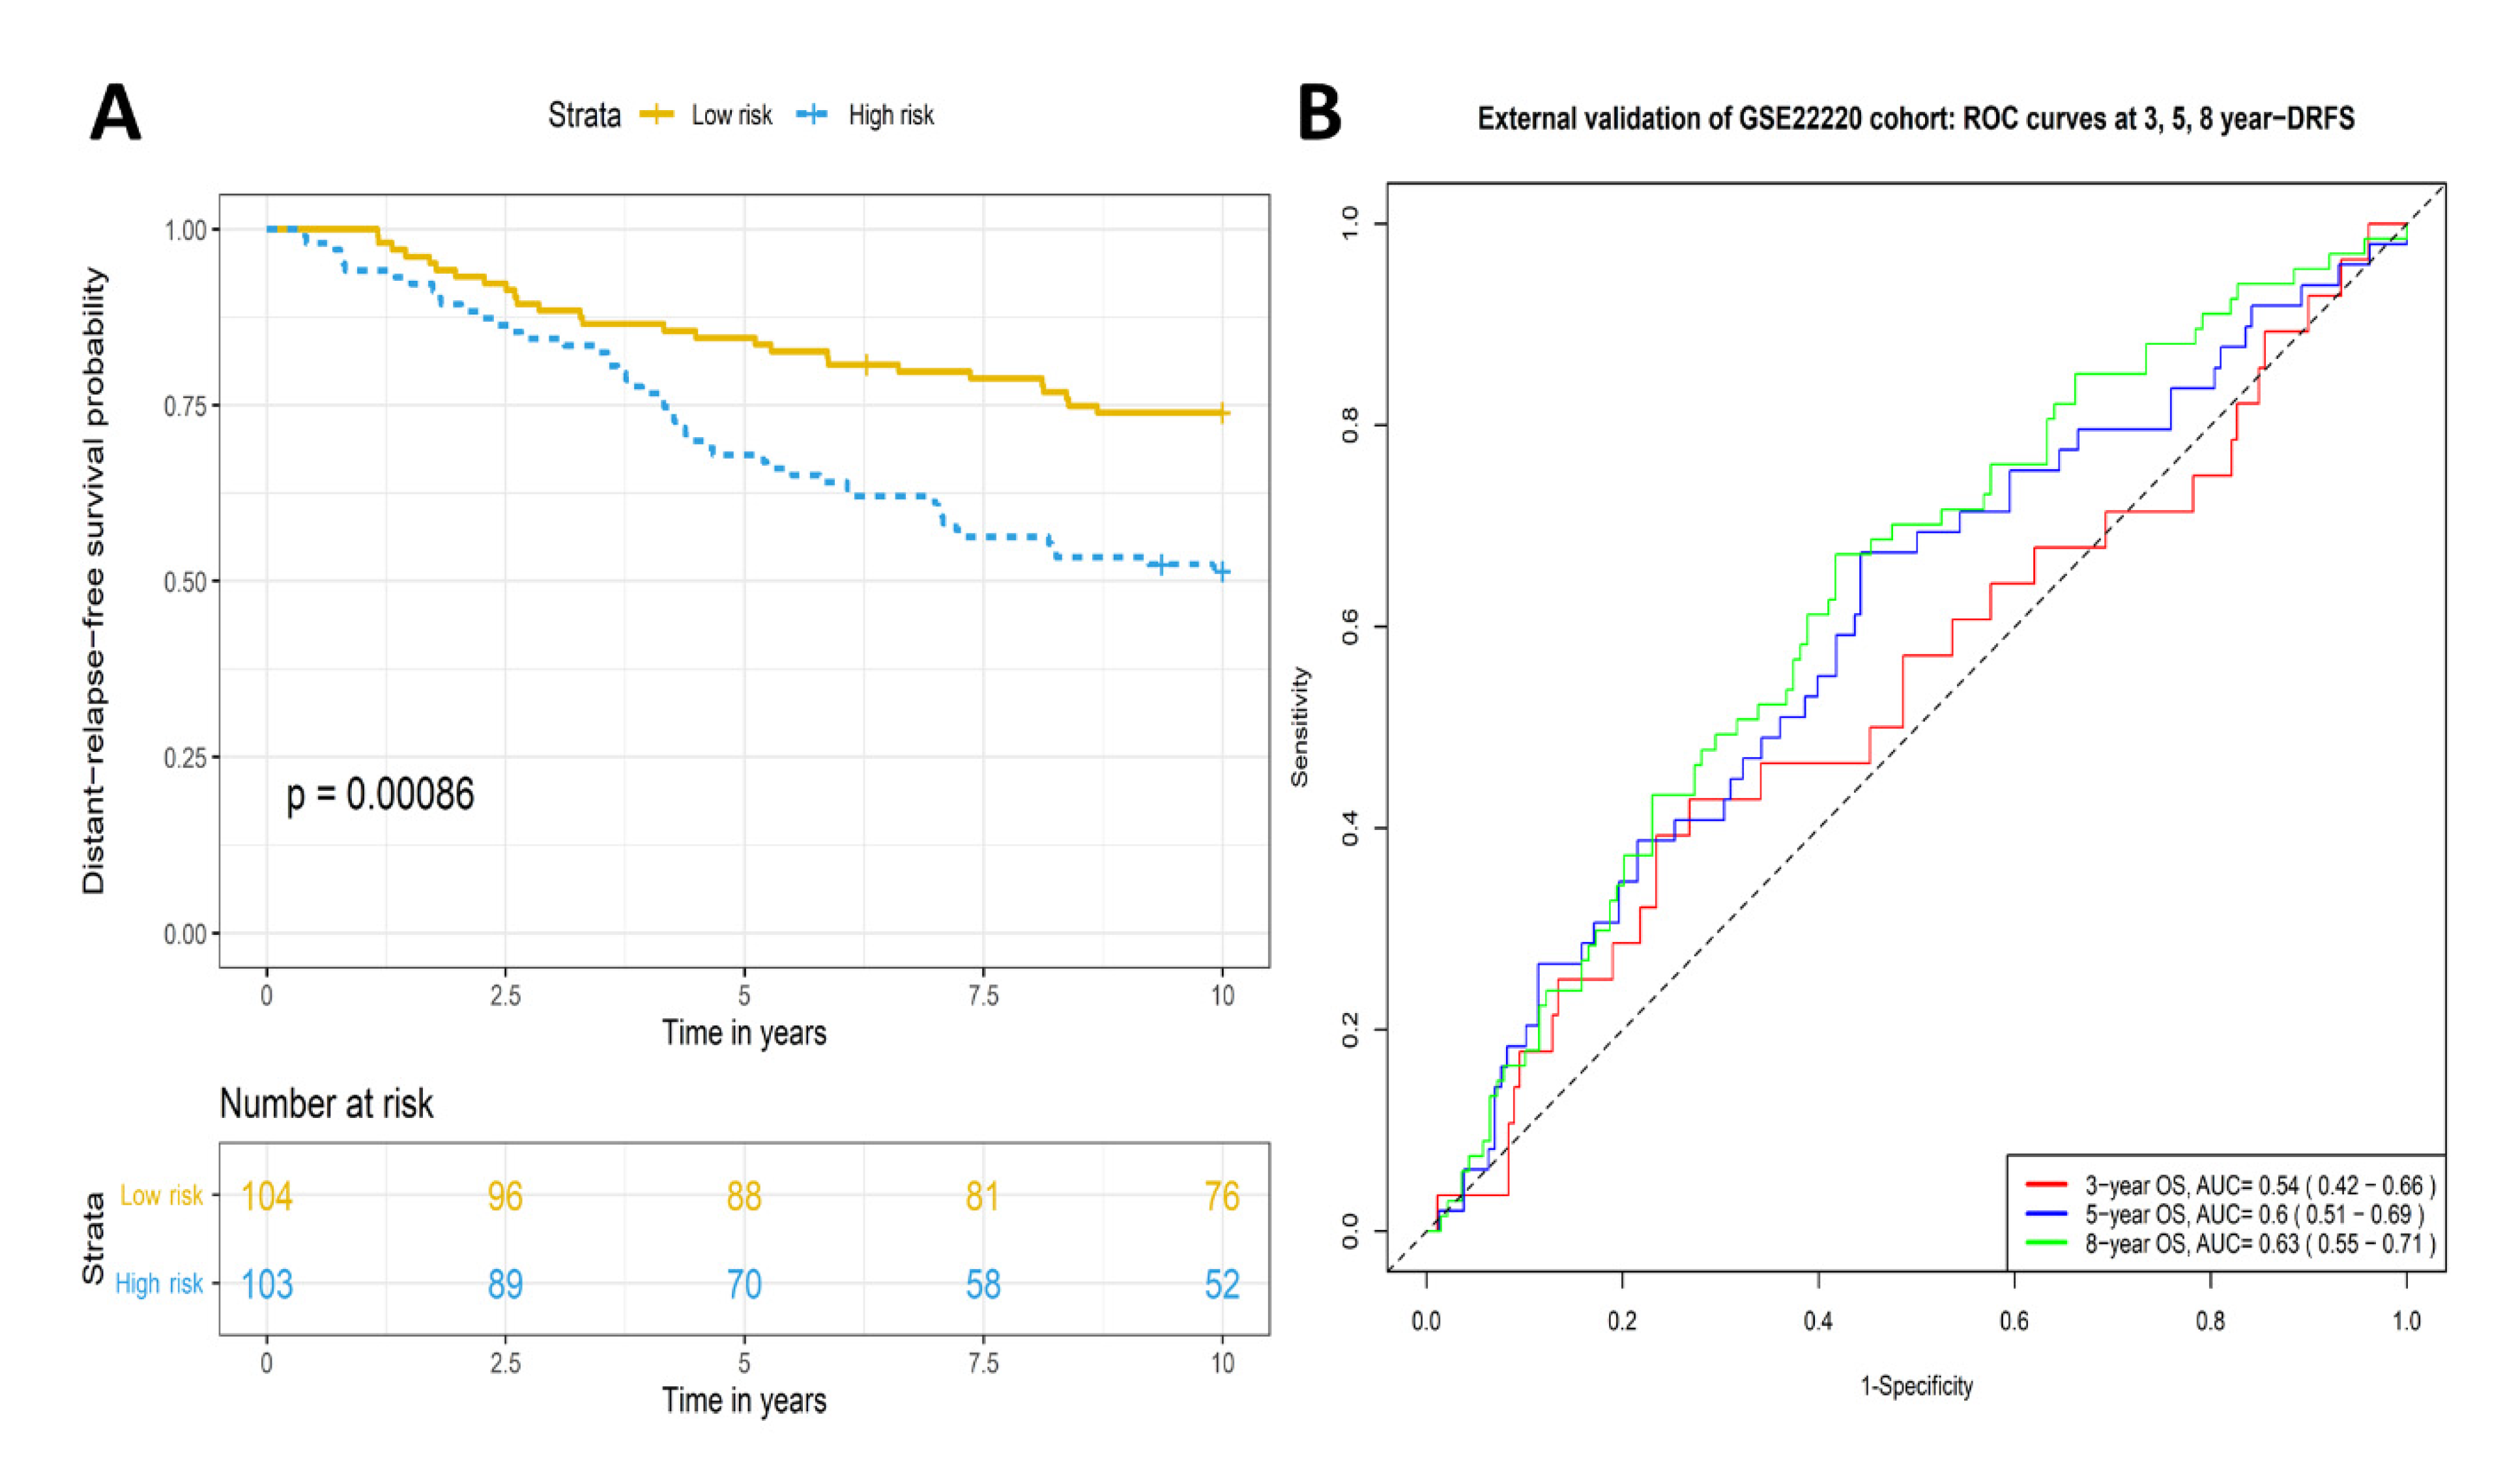
2.3. Validation of Prognostic Significance of the Eleven-TAM-Related miRNA Signature in the GEO Dataset

The prognostic value of this TRM signature was further validated in the GEO dataset, GSE22220 which contains a cohort of 207 primary breast cancer cases. A similar significant difference in distant-relapse-free survival (DRFS) was observed between the high- and low-risk groups (p value < 0.001) (Figure 5A). The AUCs of time-dependent ROC curves at 3-, 5- and 8-year DRFS were 0.54 (95% CI: 0.42–0.66), 0.60 (95% CI: 0.51–0.69) and 0.63 (95% CI: 0.55–0.71), respectively (Figure 5B). The C-index for the risk score for this cohort was 0.58 (95% CI: 0.53–0.65).

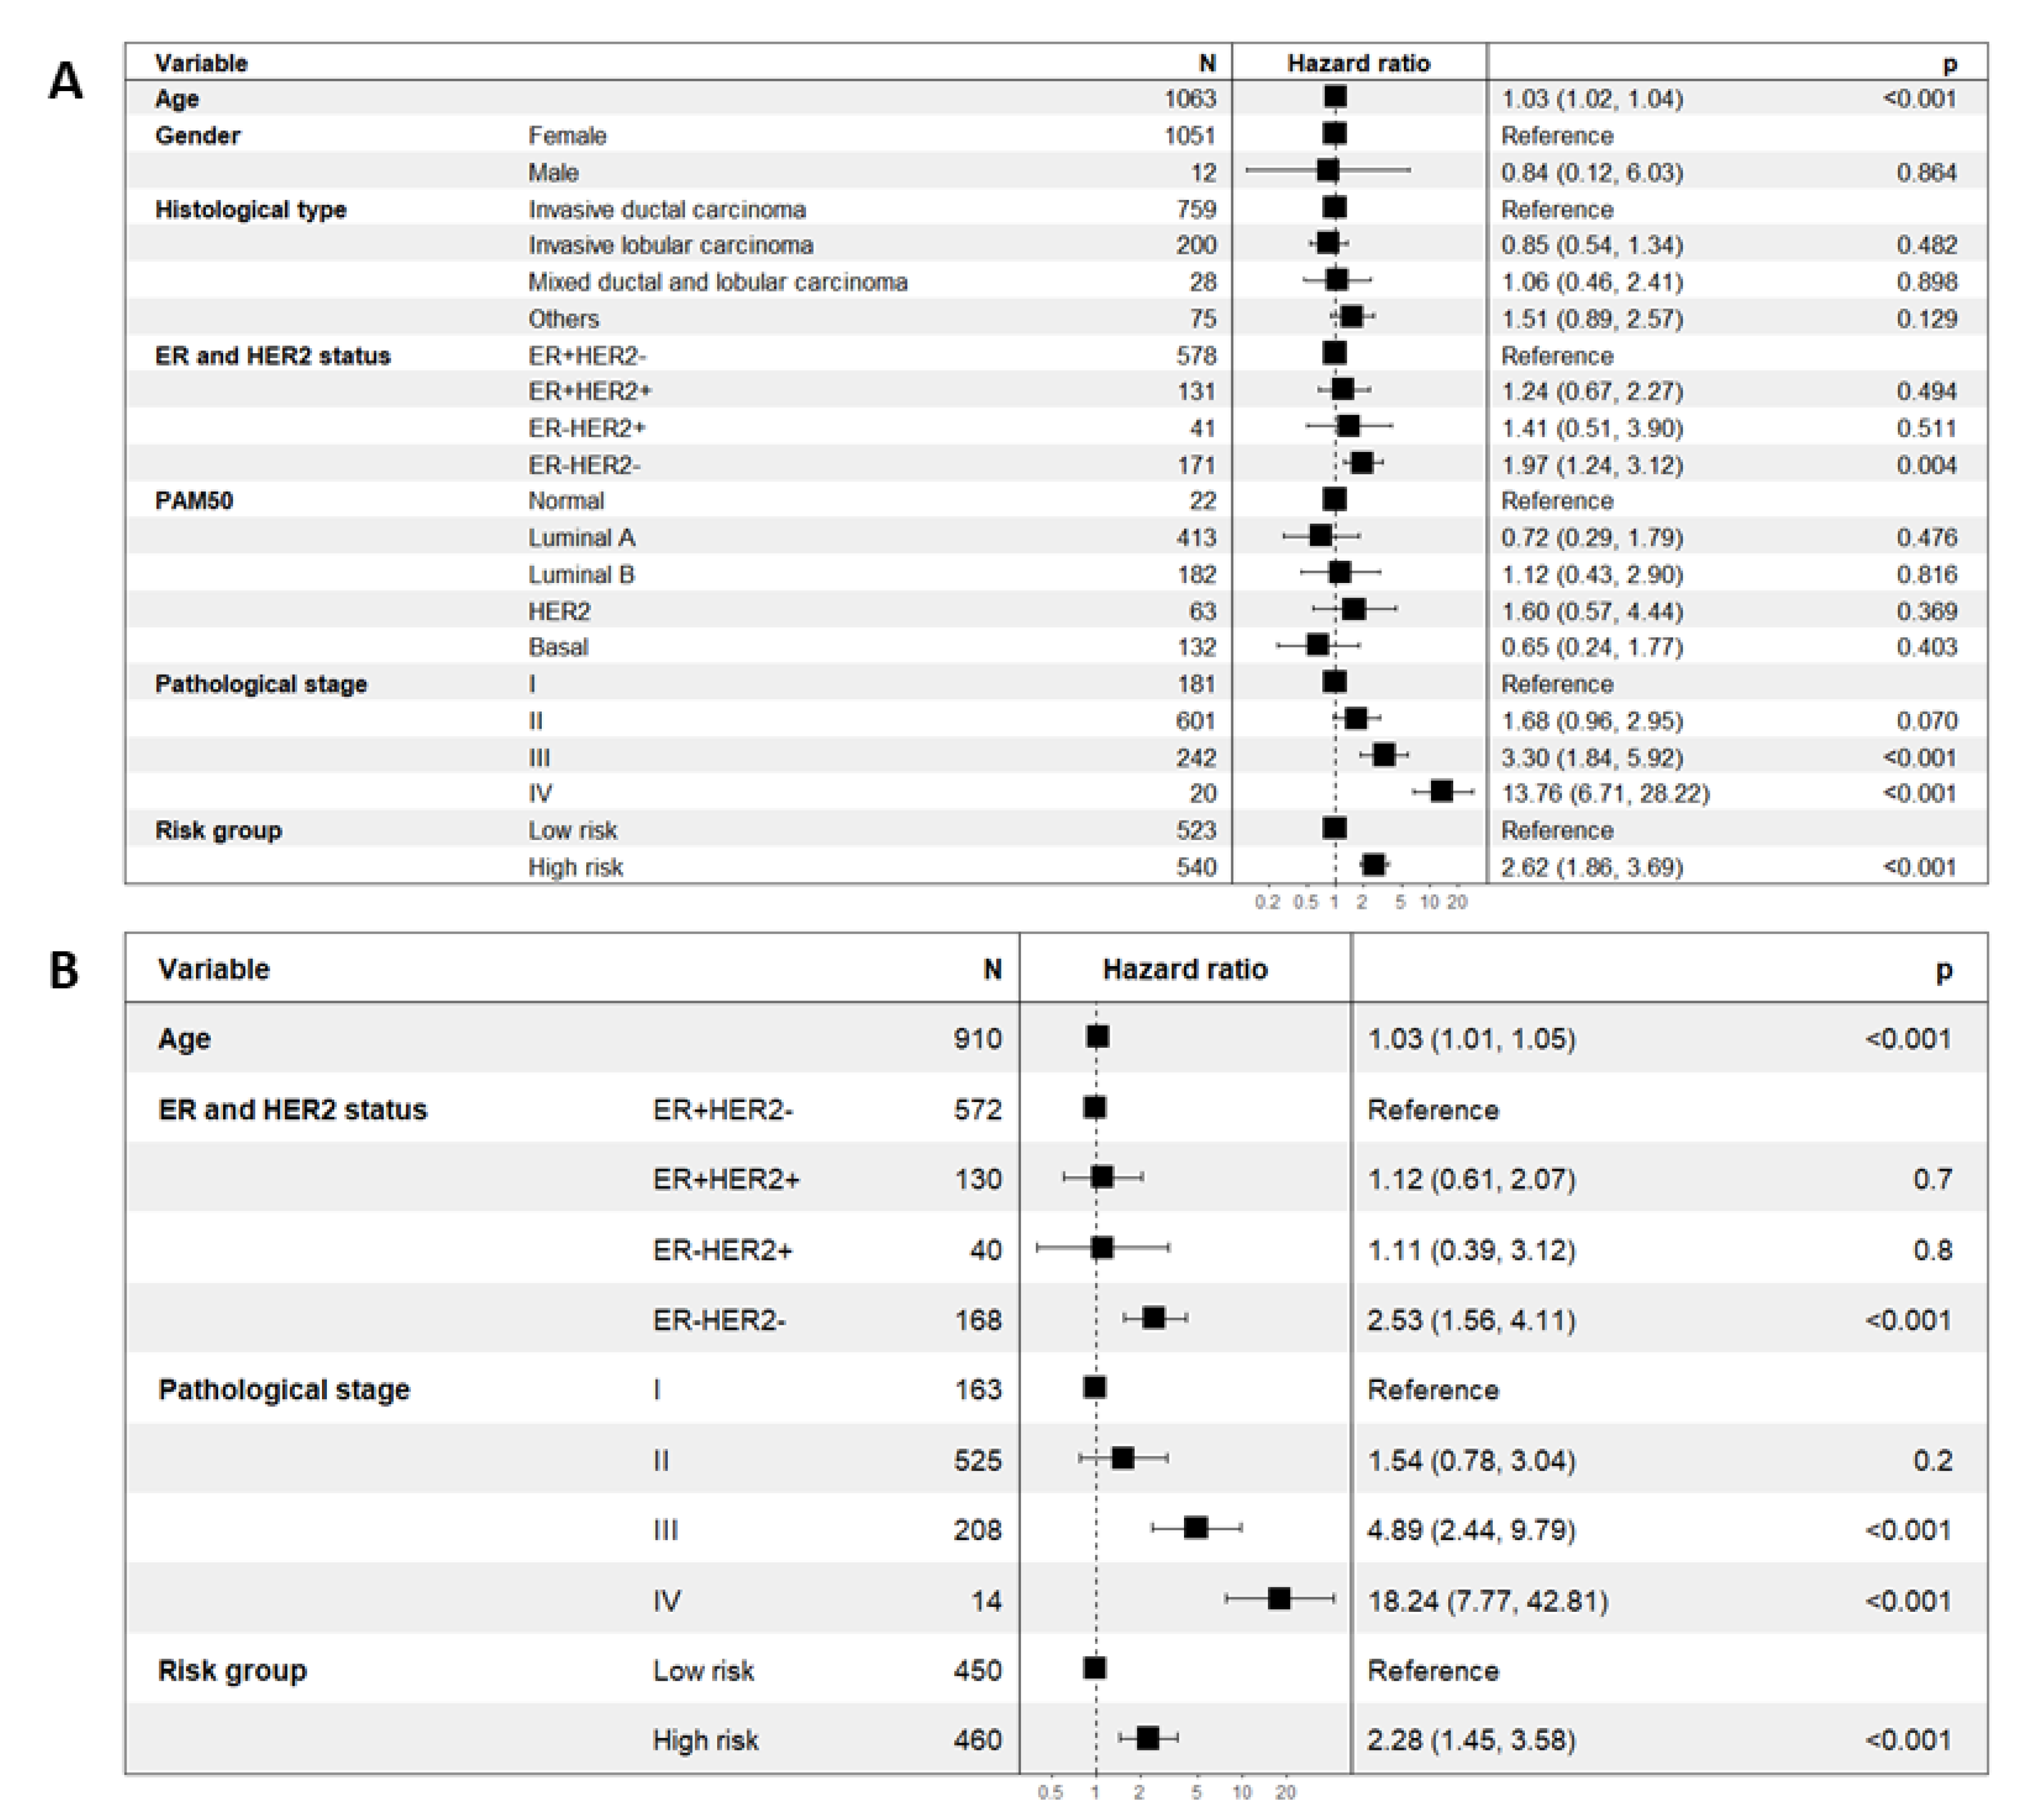
2.4. Prognostic Significance of the Eleven-TAM-Related miRNA Signature Is Independent of Clinicopathological Parameters

The association analysis between the risk score and pertinent clinicopathological parameters in the TCGA-BRCA dataset is summarized in Supplementary Table S2. The risk score was significantly associated with age, gender, pathological stage, histological type, ER and HER2 status and PAM50 (all p values < 0.05).
The prognostic value of this signature was further scrutinized among breast cancer subtypes based on ER and HER2 status. The high-risk group had significantly poorer prognosis as compared to the low-risk group in the ER+HER2−and ER−HER2− cohorts (p value < 0.01) but not in the ER+/− HER2+ cohort (Supplementary Figure S2). Interestingly, the risk scores based on the TRM signature was inversely correlated to the scores of TIL in the TNBC cases (Spearman rho = −0.33, p value = 0.001, Supplementary Figure S3).
Univariate Cox proportional hazards regression analysis showed that among the pertinent clinicopathological parameters, higher pathological stages (stage III and IV), ER and HER2 negative status, higher age and high-risk group based on the eleven-TRM signature were poor prognostic factors (p value < 0.001, p value = 0.004, p value < 0.001 and p value < 0.001, respectively) (Figure 6A). Multivariate Cox proportional hazards regression analysis revealed that the risk score based on the eleven-TRM signature remained as an indicator for poor prognosis (p value < 0.001) with a hazard ratio of 2.28 (95% CI: 1.45–3.58) (Figure 6B).
A nomogram was constructed integrating all the independent prognostic factors in the multivariate analysis. The AUC of the time-dependent ROC curve at 5-year OS for the nomogram-based prediction model was the highest at 0.79 (95% CI: 0.72–0.86). The AUC of time-dependent ROC for the risk group (0.62 (95% CI: 0.55–0.69)) was comparable to the AUCs of other independent prognostic factors (Age: 0.66 (95% CI: 0.58–0.74); pathological stage: 0.67 (95% CI: 0.6–0.75); and ER and HER2 status: 0.61 (95% CI: 0.53–0.68)) (Supplementary Figure S4). The C-index for the nomogram was the highest at 0.82 (95% CI: 0.77–0.86). C-indices for other factors were risk group: 0.78 (95% CI: 0.69–0.87); Age: 0.66 (95% CI: 0.60–0.73); Pathological stage: 0.80 (95% CI: 0.73–0.88); and ER and HER2 status: 0.65 (95% CI: 0.56–0.74).

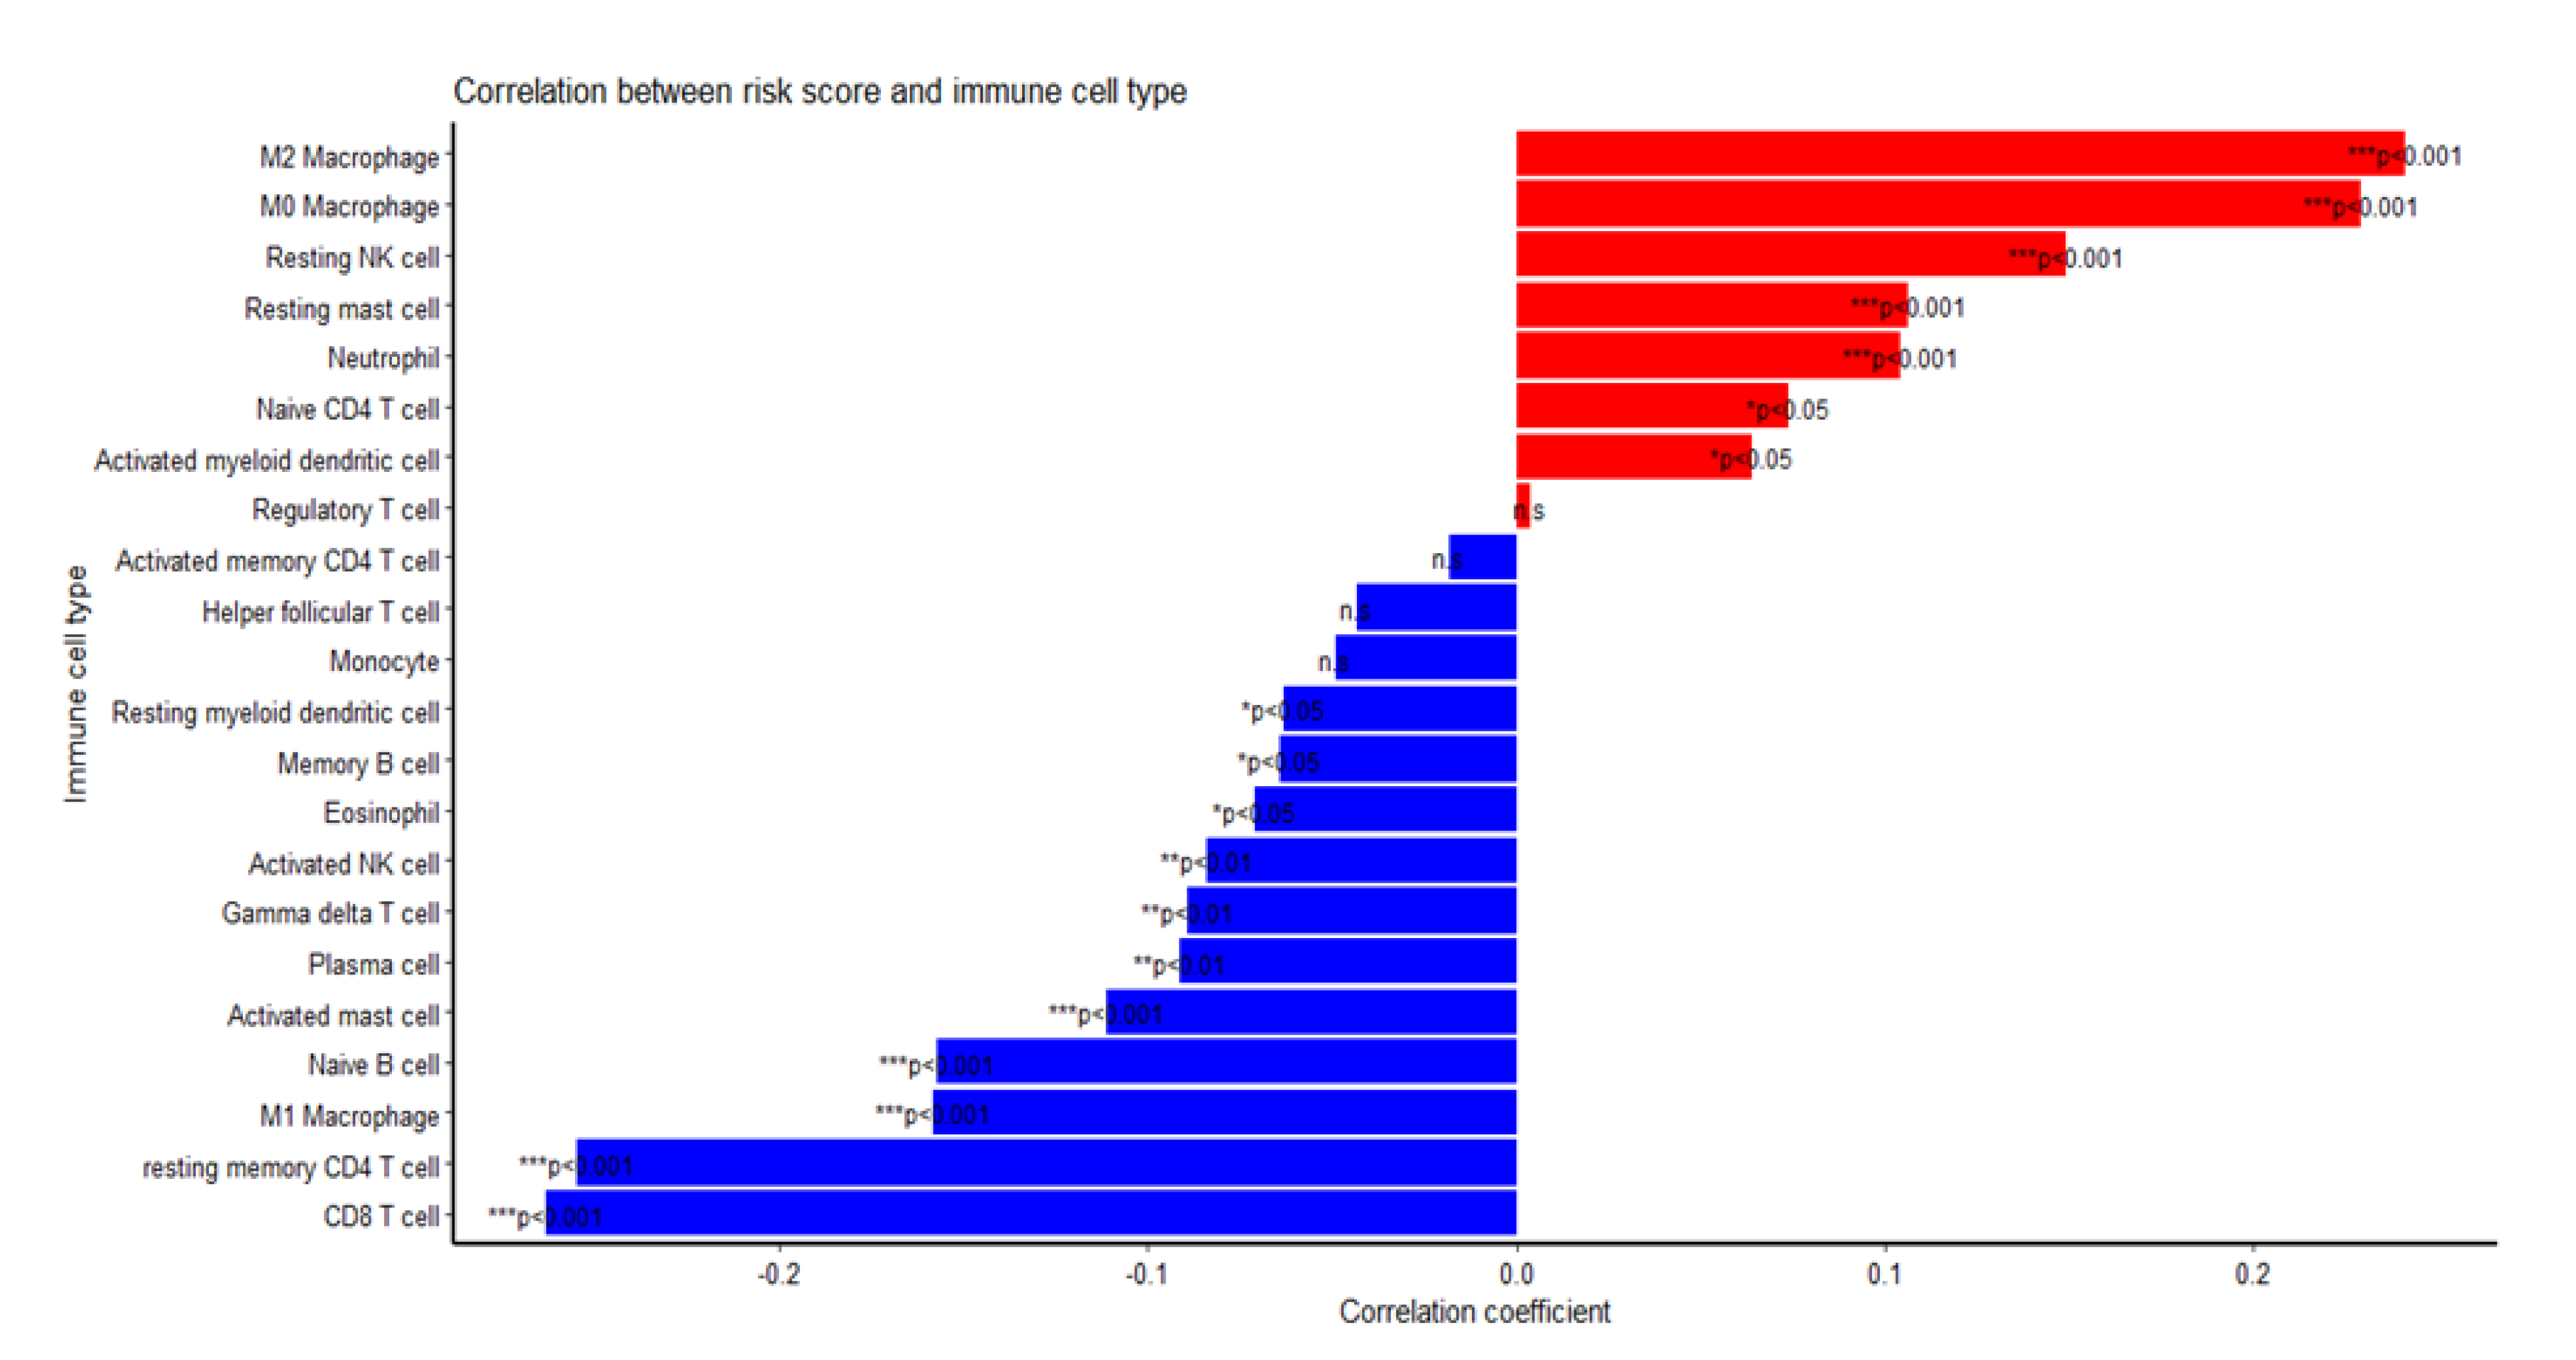
2.5. Among the Different Immune Infiltrate Populations, TAMs Had the Highest Correlation with the Risk Score Responsible for Poor Prognosis

The risk score based on the TRM signature is validated through high correlations with the abundance of TAM subtypes in the dataset. Among the populations of immune infiltrates estimated from the CIBERSORT algorithm, M2 macrophages showed the highest positive correlation with the risk score (r = 0.241, p value < 0.001), whereas CD8 T cells showed the highest negative correlation with the risk score (r = −0.263, p value < 0.001), followed by CD4 T cells and M1 macrophages (Figure 7). However, inter-relationship between individual miRNAs and different immune infiltrate populations showed various strengths and directions of correlations without a distinctive pattern with certain immune cell types (Supplementary Figure S5).

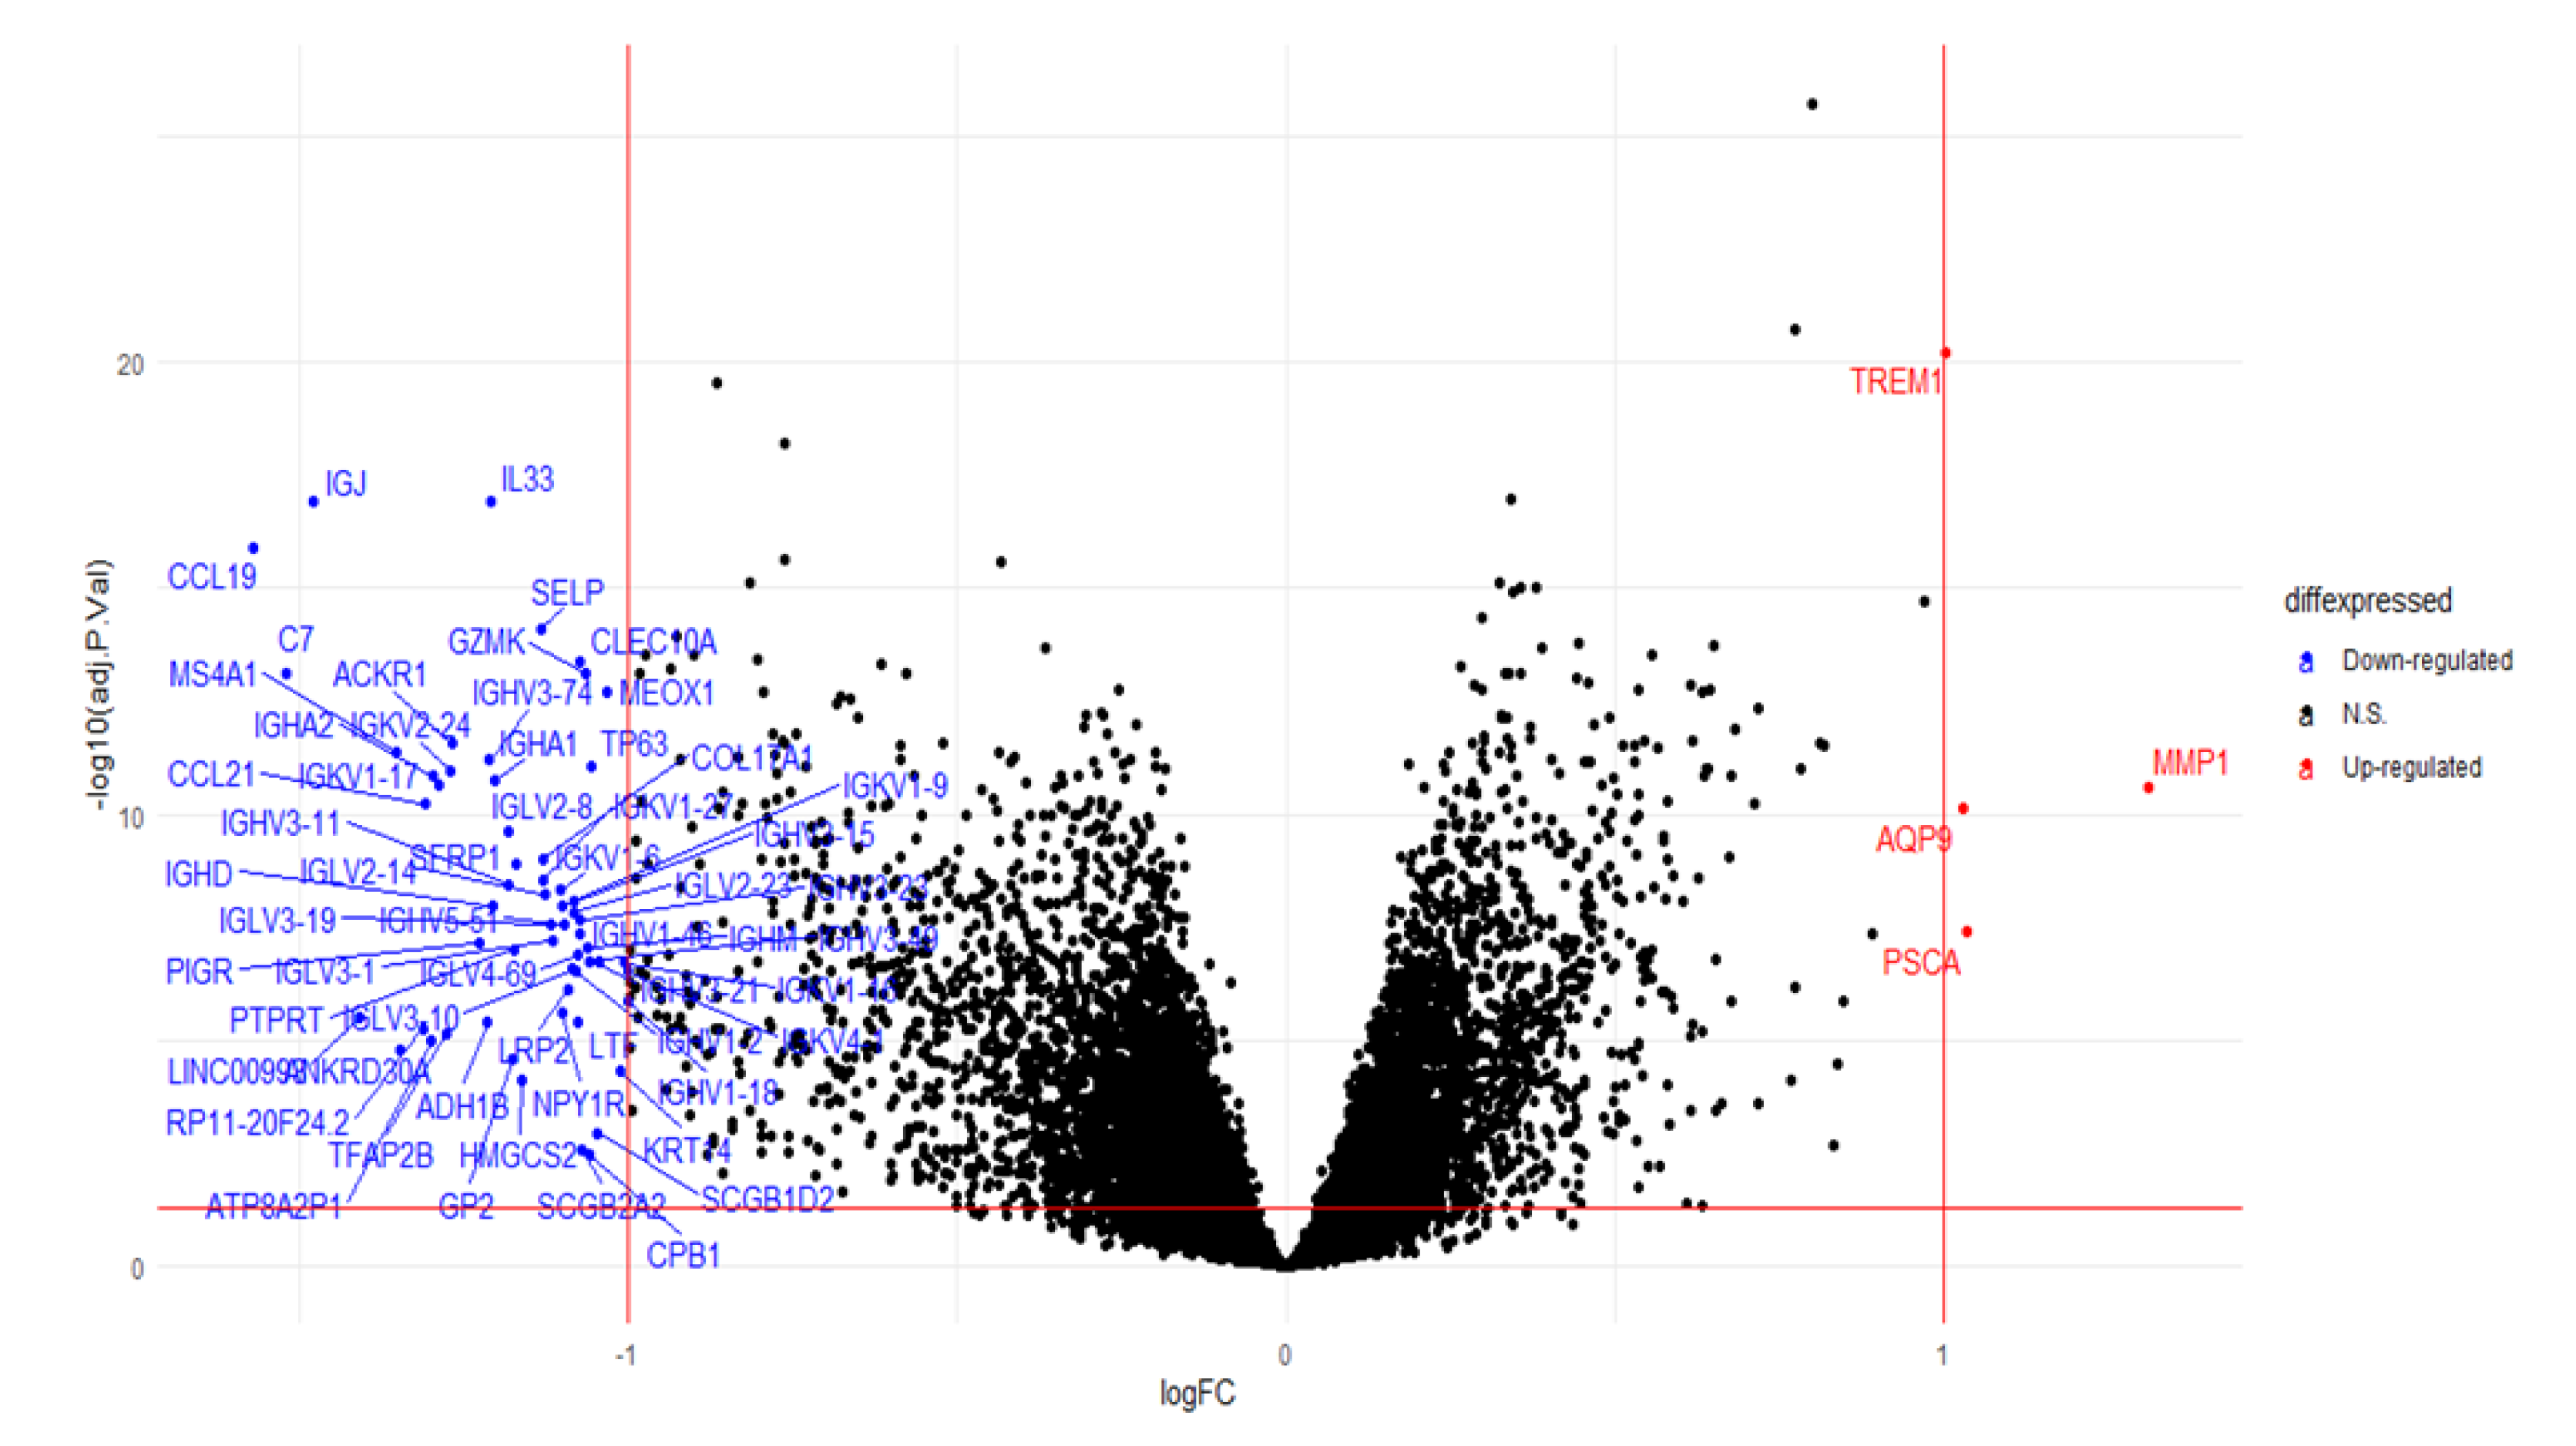
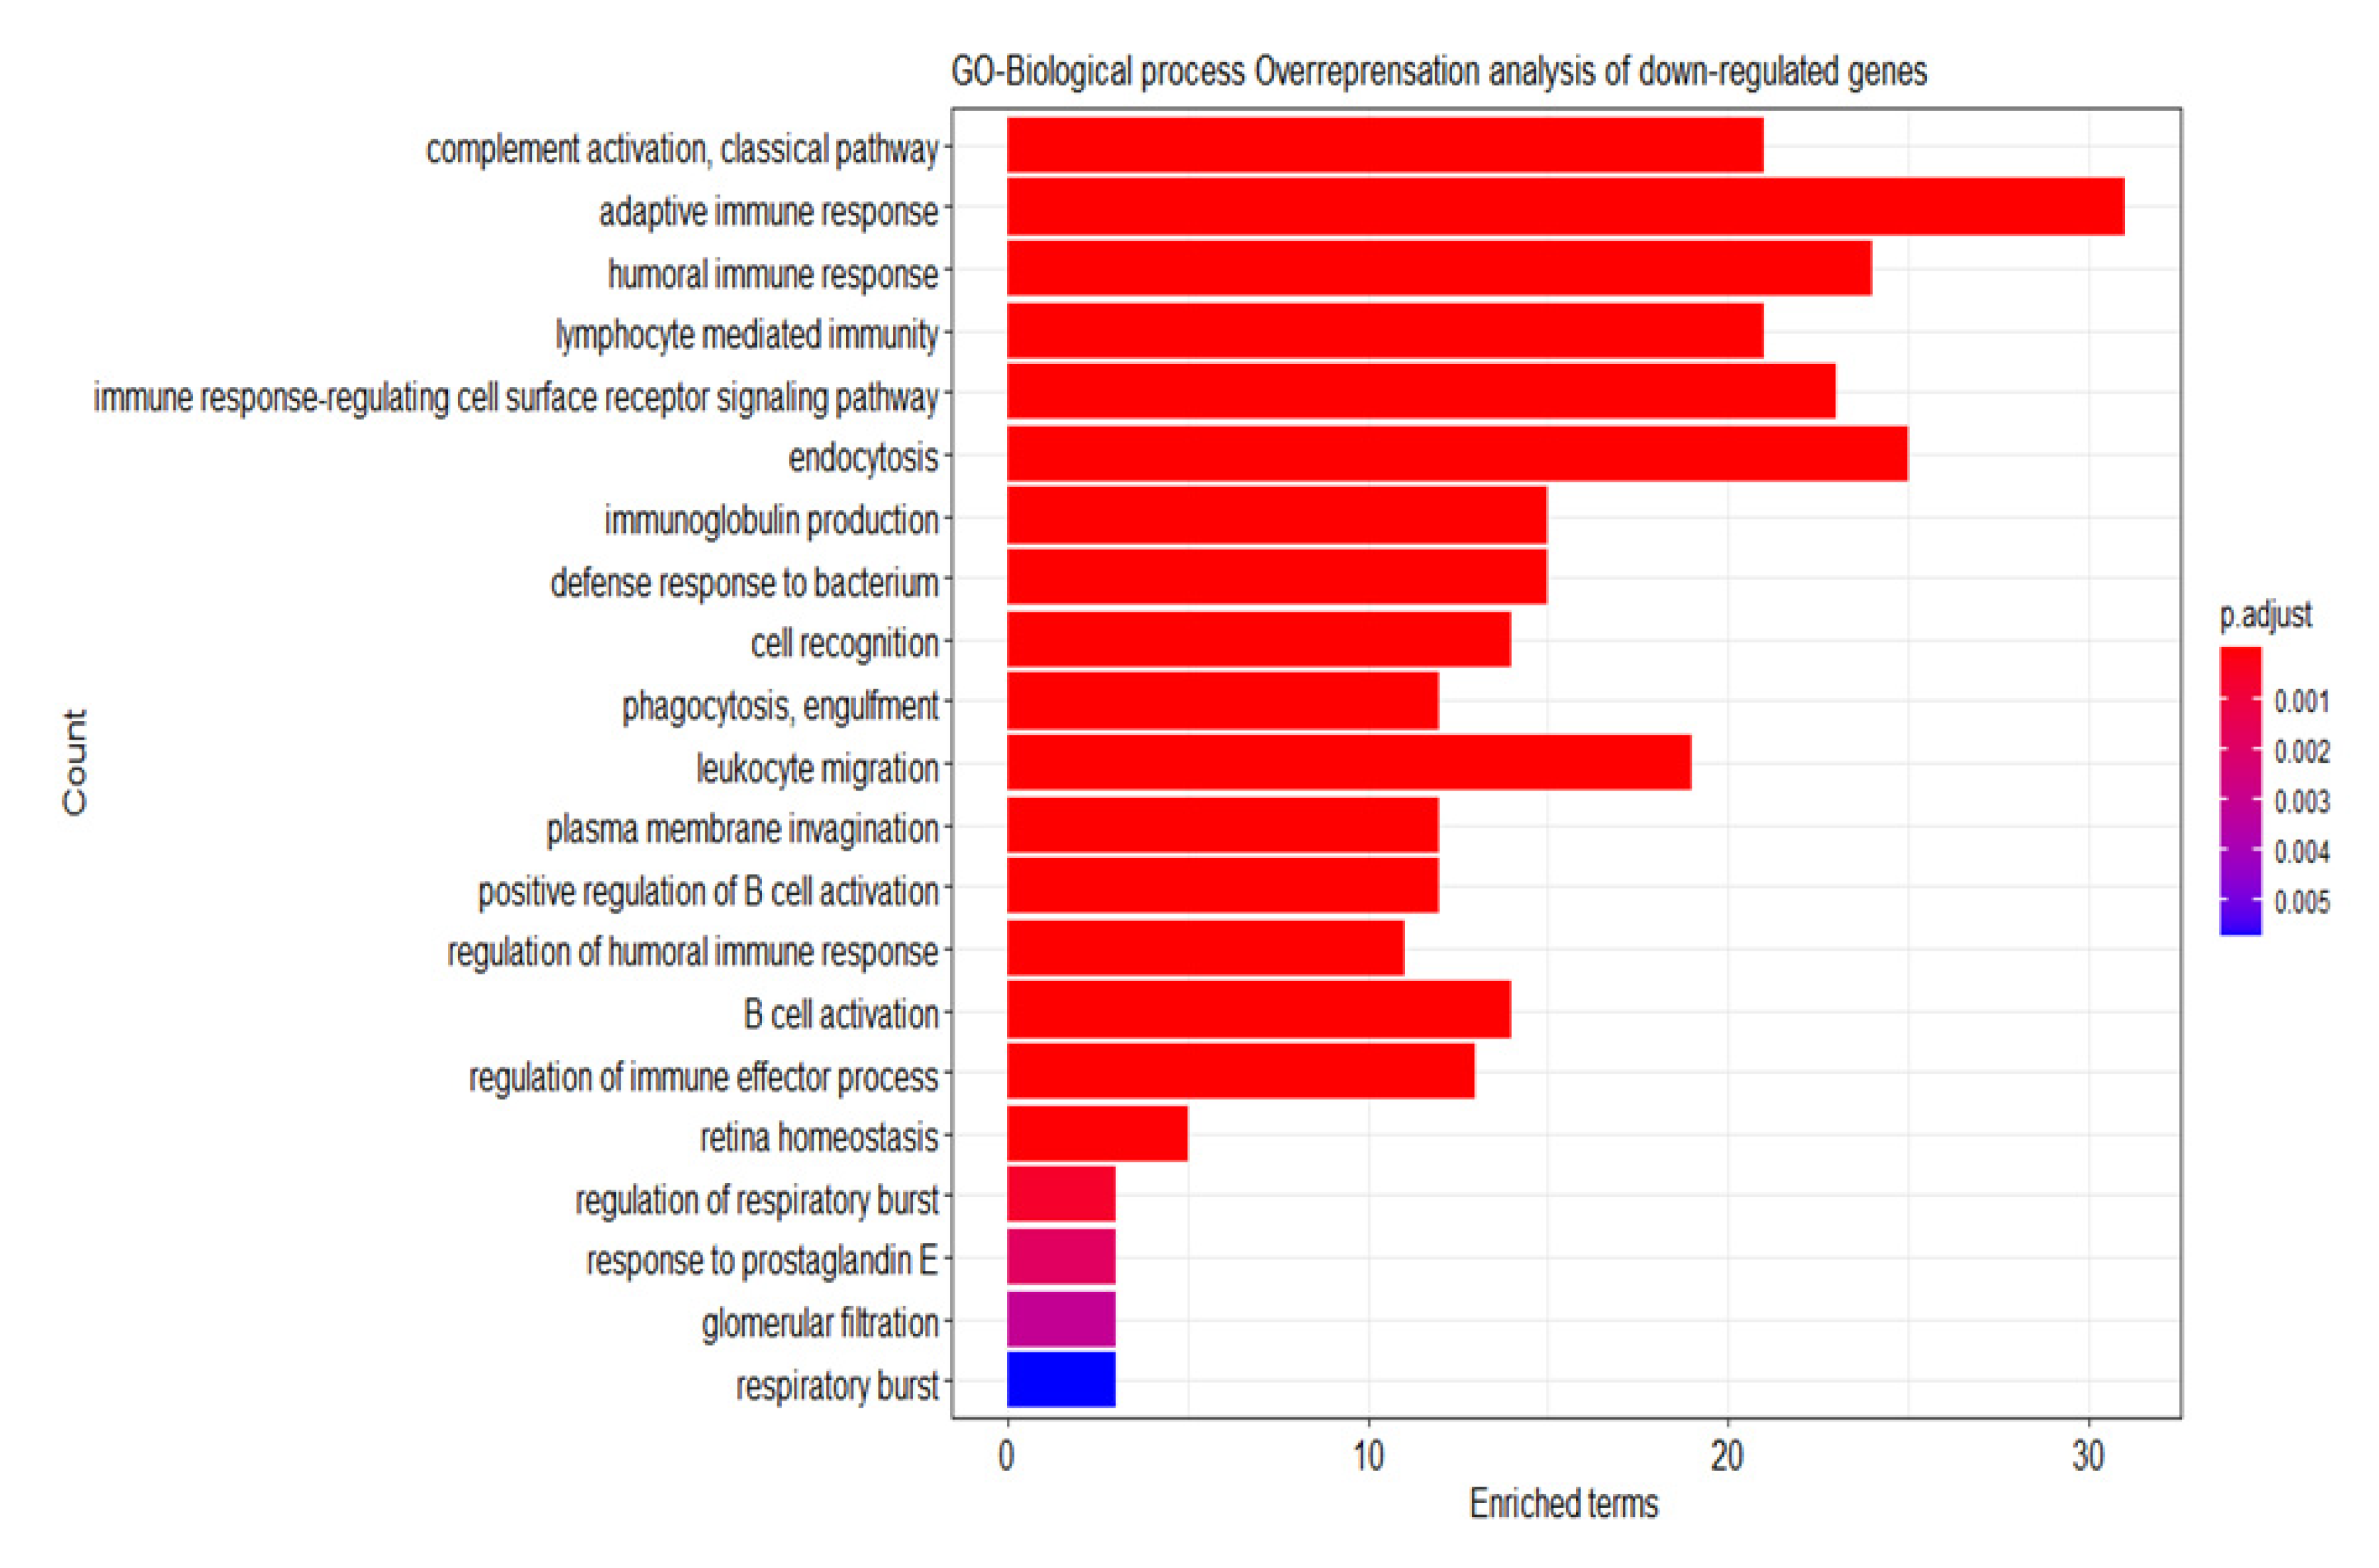
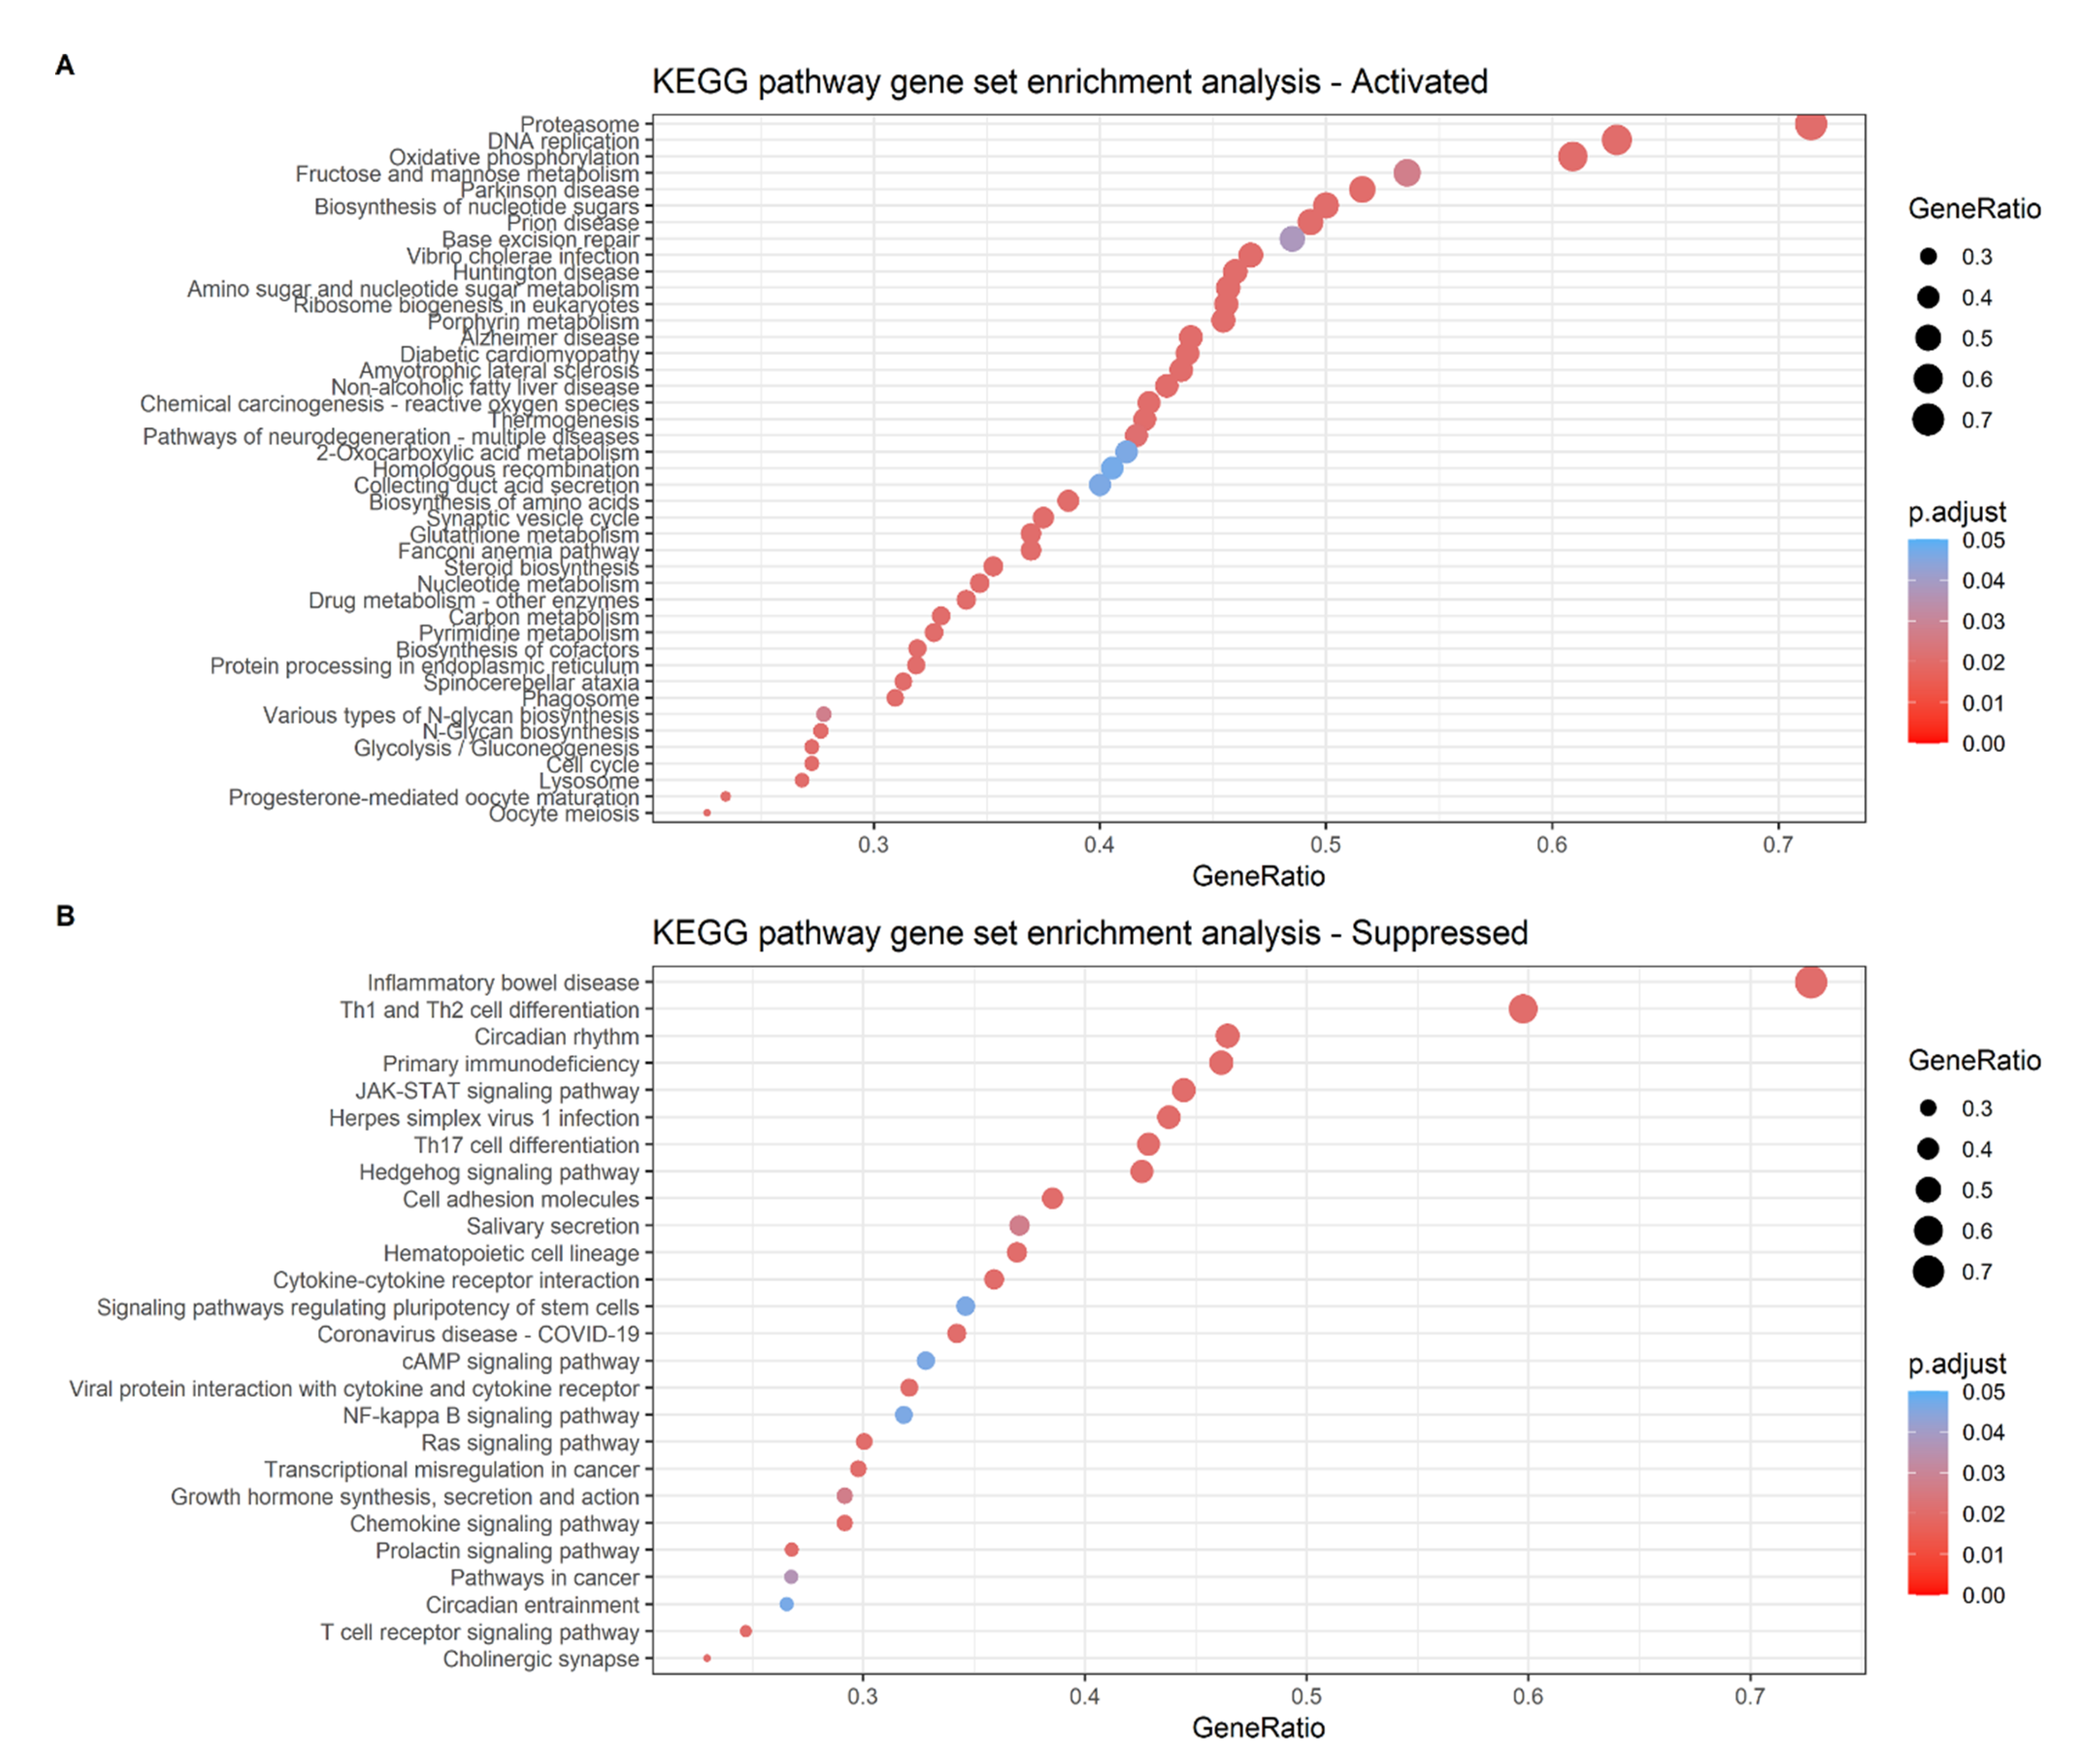
2.6. Analysis of the Differential Gene Expression and Gene Set Enrichment

As depicted in Figure 8 below, differential gene expression revealed 4 upregulated genes and 59 downregulated genes in the high-risk group as compared to the low-risk group (adjusted p value <  0.05 and |Log2(fold change)| > 1). To gain insights into the underlying biological processes, overrepresentation analysis of the differentially expressed genes was performed using Gene Ontology (GO) to determine the association of the gene sets with any biological processes. No biological process was found to be associated with the upregulated genes. On the other hand, downregulated genes were strongly associated with immune responses such as classical pathway of complement activation, adaptive immune response and humoral immune response (Figure 9).
Genes from the differential expression analysis of coding mRNA data were ranked as described in the method for gene set enrichment analysis. The KEGG pathway gene set enrichment analysis showed that immunity pathways such as Th1 and Th2 cell differentiation, JAK-STAT signaling pathway and Th17 cell differentiation were suppressed, whereas pathways such as proteosome, DNA replication, oxidative phosphorylation and base excision repair were activated in the high-risk group (Figure 10). Gene set enrichment analysis using Hallmark gene sets displayed 20 significantly enriched gene sets; activated gene sets in the high-risk group included Myc Target V2, oxidative phosphorylation and E2F Targets whereas suppressed gene sets included UV response and KRAS signaling (Supplementary Figure S6).

2.7. Relationship between miRNAs in TRM Signature and Differentially Expressed Genes between High- and Low-Risk Groups

A total of 387 and 61 regulatory miRNAs were obtained from TarBase 8.0 based on the downregulated and upregulated genes in the high-risk group. Based on the premise that miRNAs act as negative regulators of target mRNAs, an intersection was performed with the miRNAs in the TRM signature with positive and negative coefficients, respectively. Among these regulatory miRNAs, six and two mature miRNAs intersected with the miRNAs in the TRM signature with positive and negative coefficients, respectively (Figure 11A,C). Similarly, a total of 6736 and 8173 genes were obtained as predicted target mRNA based on miRNAs in the TRM signature with positive and negative coefficients, respectively. Six and one mRNAs intersected with the downregulated and upregulated genes in the high-risk group, respectively (Figure 11B,D). Specifically, six miRNA: RNA pairs were identified based on the miRNAs from TRM signature with positive coefficients and downregulated genes, i.e., hsa-mir-21-3p: IL33, hsa-mir-21-3p: SELP, hsa-mir-22-5p: CLEC10A, hsa-mir-21-5p: TP63, hsa-mir-365b-3p: PTPRT and hsa-mir-22-5p: GP2. Likewise, two miRNA: RNA pairs were identified from the miRNAs in TRM signature with negative coefficients and the upregulated genes. They were hsa-let-7b-5p: PSCA and hsa-mir-146a-5p: PSCA.

3. Discussion

Tumor-associated macrophages (TAMs) as immune cells residing within the tumor microenvironment have garnered much interest due to their roles in modulating the progression of breast cancer. Of particular interest is the polarization status of the TAMs that would result in either the suppression or promotion of breast cancer progression. Although numerous studies have proved the vital role miRNAs plays in breast cancer progression, studies that describe the interaction between TAM-related miRNAs (TRMs) and breast cancer progression are scarce. Driven by this scarcity, this study aimed to explore the relationship between TRMs and breast cancer prognosis.
A total of 42 TRMs were identified from the literature search; 9 were associated with breast cancer only, 27 were reported in other cancer types while 6 were associated with both breast and other cancer types. Intriguingly, several TRMs have been reported in more than one cancer type, either exerting similar or total opposite effects. We hypothesized that some TRMs reported in other cancer types may also contribute to breast cancer prognosis, and thus, these TRMs were included although the focus of this study is on breast cancer. Including the precursors of these miRNAs’ genes available in the TCGA-BRCA dataset, a total of 52 TRM expression were analyzed. From the analysis of 52 TRM expression, 11 of them eventually constitute the TRM signature, which was shown to have a significant independent prognostic value for breast cancer (p value < 0.005). Among these 11 TRMs, only 4 have been reported in TAMs of breast cancer, namely let-7b, miR-21, miR-24-2 and miR-146a (Table 1). Although there were reports of miR-22, miR-31, miR-125a, miR-221, miR-501 and miR-660 involved in breast cancer [67,68,69,70,71,72], they have not been associated with TAMs so far. MiR-365b, on the other hand, has not been reported in any breast cancer studies to date, but is known to be secreted by M2 TAMs to promote hepatocellular carcinoma cell migration and invasion [73].
Eight of these TRMs had positive coefficients in the constructed TRM signature, which implies worse prognosis based on the expressions of these TRMs. They were miR- 21, miR-24-2, miR-125a, miR-221, miR-22, miR-501, miR-365b and miR-660, arranged in the descending order of their coefficients. Estimated at 0.263, miR-21 had the highest positive coefficient and the highest overall coefficient in the TRM signature, suggesting that miR-21 expression exerts the most impact on breast cancer progression in this cohort. In fact, miR-21 is well-established as the main tumor promoter in various cancers, and multiples studies have evidenced its linkage to poor prognosis. Li et al., in 2017 demonstrated that in breast cancer, the upregulation of miR-21 in TAMs favored M2 transformation and promoted metastasis by inhibiting the expression of PTEN, a tumor suppressor gene [25]. Another study by Zheng et al., 2017 revealed that miR-21 derived from M2 TAMs promoted cisplatin resistance in gastric cancer cells. They further demonstrated that miR-21 were transferred from TAMs to gastric cancer cells to suppress cell apoptosis and enhance the activation of the PI3K/AKT signaling pathway via the downregulation of PTEN [23]. Acting as the crucial factor that promotes the tumorigenesis of breast cancer, miR-21 can be potentially targeted to debilitate tumor growth.
The miR-24-2 belongs to the miR-23a/27a/24-2 cluster associated with multiple diseases [74,75]. In a breast cancer study, the miR-23a/27a/24-2 cluster was suggested to work as a double feedback loop. This cluster was downregulated by M1-type stimulation and upregulated by M2-type stimulation. The down- regulation of the cluster is mediated by the binding of the transcription factors involved in macrophage polarization, NF-κB and STAT-X, to the promoter of the miR-23a/27a/24-2 cluster, thus repressing its expression. On the other hand, the upregulation of the cluster was promoted by the binding of STAT6 to the promoter of the cluster. However, this cluster was surprisingly downregulated in TAMs of breast cancer patients, and further probing is needed to determine the cause [27]. Consistent with these findings, miR-24-2 in our study contributes to the worse prognosis of breast cancer. Furthermore, miR-24-2 was highly expressed in the high-risk group of breast cancer patients.
Likewise, miR-221 derived from M2 TAMs promoted cancer cell proliferation in epithelial ovarian cancer (EOC) via suppression of the cyclin-dependent kinase inhibitor 1B (CDKN1B) [49] and aggravates the growth and metastasis of cancer cells in osteosarcoma by targeting SOCS3, which then activates the JAK2/STAT3 pathway [50]. TAM-derived exosomal miR-501 promotes progression of pancreatic ductal adenocarcinoma by inhibiting the tumor suppressor, TGF-beta Receptor III (TGFBR3) gene and activating the TGF-β signaling pathway [60]. Similarly, miR-660 was found to be upregulated in exosomes secreted by TAMs of epithelial ovarian cancer [63].
There were limited data on TAM-related miR-125a and miR-22 in cancers, but the transfer of miR-125a or miR-125b to TAMs can suppress cancer cell proliferation and stem cell properties by targeting CD90, a stem cell marker for hepatocellular carcinoma [36]. Meanwhile, miR-22 transferred from TAMs to glioma stem cells was able to promote mesenchymal phenotypes and induce radiotherapy resistance by targeting the chromodomain helicase DNA-binding protein 7 (CHD7), a chromodomain enzyme that maintains the proneural phenotype in glioblastoma [26].
In descending order, miR-146a, let-7b and miR-31 had negative coefficients in this signature, implying their role as tumor suppressor. The miR-146a has many conflicting findings in regard to its functions. Some research groups found miR-146a to act as a tumor suppressor while others stress the tumor-promoting property of this miRNA in breast cancer [7]. In 2015, Li et al., discovered that miR-146a expression was significantly downregulated in the TAMs of patients’ breast tumors. They also reported that inhibiting miR-146a promoted the M1 TAM expression but decreased M2 TAM expression and suppressed tumor growth in mice, indicating the oncogenic function of this miRNA. However, the in vivo studies on mice revealed that the decreased expression of miR-146a in macrophages somehow also inhibited tumor growth at the same time. The authors acknowledged that miR-146a function in TAMs appeared to be contradictory to the observation that miR-146a was downregulated in TAMs of breast cancer and postulated that miR-146a is a negative regulator in TAM polarization [41]. In this study, our TRM signature showed that miR-146a acts as a tumor suppressor, associating it with good prognosis. In fact, miR-146a possessed the highest negative coefficient with a value of −0.243 and hence constitutes the most potent tumor-suppressing function of our signature. This was substantiated by our finding that miR-146a was highly expressed in the low-risk group compared to the high-risk in our cohort. The contradictory role portrayed by miR-146a in our study compared to the ones reported in other studies seems to suggest the involvement of other alternative pathways or mechanisms that may influence its function and needs further investigation.
Let -7b is a known tumor suppressor in breast, gastric and ovarian cancers [76,77,78]. In 2016, Zhen Huang and his team discovered that the administration of let-7b in tumor cells can repolarize M2 TAMs to M1, reverse the suppressive tumor microenvironment and inhibit tumor growth in a breast cancer mouse model [14], consistent with the tumor suppressive signature displayed by let-7b in our TRM panel. To the best of our knowledge, there were no studies on TAM-related miR-31 in breast cancer, although miR-31 expression was significantly downregulated in many cancers, including breast, ovarian, prostate [79] and gastric cancers [80].
In this study, we have successfully constructed an eleven TAM-related miRNA-based signature that was significantly associated with OS/ DRFS in breast cancer patients. The performance of this signature was validated in both TCGA and GEO cohorts whereby Kaplan–Meier analyses demonstrated a significant difference in survival between the low- and high-risk groups. The performance of this signature is on par with other well-established multi-gene based prognostic tools such as Endopredict and Oncotype Dx, which had C-indices ranging from 0.6 to 0.7 [81]. In comparison, C-indices of the risk score based on the TRM signature in our TCGA-BRCA and GSE22220 cohorts were 0.68 and 0.58, respectively. As C-index is not a proper metric to predict a t-year risk of an event [82], AUC metrics for time-dependent ROC curves at a specific t-year OS/DRFS were chosen in our study. The prognostic value of this signature was further enhanced with the amalgamation of independent clinical factors, resulting in the highest AUC of the nomogram for the 5-year OS at 0.79. In addition, when considering all the independent prognostic factors, the risk group based on this TRM signature has similar prognostic performance with other traditional established prognostic factors either in terms of AUC metrics or C-indices. This signature in combination with other relevant independent prognostic factors has a promising potential in the prognostication of breast cancer.
The fact that the tumor microenvironment (TME) components and functions differ across the various subtypes of breast cancer is well-established [83]. Since the abundance of TAMs varies in different subtypes of breast cancer, the risk scores of these cases also varied accordingly (Supplementary Table S2). The prognostic value of risk score based on the TRM was demonstrated in the whole TCGA-BRCA cohort, and further sub-group analysis showed that its prognostic value was retained especially in the ER+HER2− and ER−HER2− cohorts. Intriguingly, risk score derived from this signature was inversely corelated with the TIL score in TNBC cases. It was known that high TIL scores in TNBC cases are associated with better response to chemotherapy and improved overall survival [88]. Therefore, the inverse relationship of this risk score with TIL score could be alluded to in part the underlying interaction between TAMs and TILs in TNBC cases.
Analysis of the immune infiltrate estimates from the CIBERSORT algorithm revealed that among the different immune infiltrate populations, the constellation of eleven miRNAs as a risk score had a collective relationship with TAMs. However, analysis between individual miRNAs in the TRM signature and different immune infiltrate populations did not recapitulate such relationship at the individual miRNA level. From the chord diagram in Supplementary Figure S5, several miRNAs did show significant correlation with M1 or M2 TAMs; nonetheless, they were also correlated with other immune cell types concurrently, forming many-to-many relationships between miRNAs and different immune infiltrate populations. The relationship of these miRNAs with TAMs is thus best alluded to the collective effects by these miRNAs, presumably via a complex regulatory network rather than simple additive effects by individual miRNAs. One such outcome of the complex regulatory network could be the Th1-Th2 cell differentiation, which was shown to be significantly suppressed in the high-risk group by KEGG pathway gene set enrichment analysis. Taken together, such a result reflects the complex intertwined relationships among miRNAs, TAM polarization and the Th1/Th2 paradigm.
Bioinformatics analysis was applied to elucidate the biological functions of this TRM signature. From the differential gene expression analysis, four genes were upregulated while 59 genes were downregulated in the high-risk group. GO analysis showed that the downregulated genes were strongly involved in immune pathways, such as adaptive immune response, humoral immune response and immune response signaling pathway (p value < 0.001). It is well-established that immune pathways detect and destruct cancerous cells. Adaptive immune response, for one, consists of T cells, B cells and antigen-presenting cells that target and kill antigens specific to the cancer cells [84]. Similarly, humoral immunity develops autoantibodies against tumor-associated proteins. In 2020, Sato et al. discovered that humoral immunity plays a vital part in the suppression of breast cancer. In a cohort of 500 invasive breast cancer patients, they found that the recurrence-free survival of the high anti-HER2 autoantibody (HER2-AAb) group was significantly longer than that of the low HER2-AAb group (p value = 0.015). The high HER2-AAb group also had a higher number of CD20, IGKC and CXCL13 immune cells, indicating enhanced humoral immunity compared to the low HER2-AAb group [85]. In short, GO analysis suggests that the eleven miRNAs were indeed key players in modulating breast cancer via immune pathways. Therefore, immunomodulatory strategy in concert with the targeted inhibition of miRNAs can be employed to ameliorate tumorigenesis and cancer progression.
Furthermore, KEGG analysis revealed that mechanisms such as DNA replication, base excision repair, proteosome and oxidative phosphorylation were significantly activated in the high-risk group while immunity pathways such as Th1 and Th2 cell differentiation, JAK-STAT signaling pathway and Th17 cell differentiation were suppressed. Proteosome complexes support cancer cell differentiation and survival [86], while oxidative phosphorylation is rudimentary in cancer cell proliferation, stemness and metastasis [87]. In fact, a recent paper revealed that improved anti-tumor response was observed in TNBC cell lines and in patient-derived tumor xenograft models when marizomib, a proteasome inhibitor derived from marine bacteria was used to inhibit the multiple proteasome catalytic activities and oxidative phosphorylation in vivo [88].
Th1, Th2 and Th17 cells are all subsets of the CD4+ T cell. Th1 cells produce tumor necrosis factor alpha (TNF-α), interferon gamma (IFN-γ), interleukin (IL)-2 and IL-12 to mediate antitumor effects, while Th2 cells produce IL-4 and IL-10 which favor tumor growth [89]. Hence, repressing the Th1/Th2 balance would promote tumor growth. Eftekhari et al., in 2017, discovered that Th17 cell markers were significantly decreased in stage IV of breast cancer [90]. Our findings verified that a decrease in Th17 correlates with worse prognosis.
The relationship between miRNAs in TRM signature and differentially expressed genes between high- and low-risk groups was explored via TarBase 8.0, a reference database cataloguing experimentally supported miRNA targets [91]. This exploration revealed six miRNA: mRNA pairs when a higher expression of the miRNAs with positive coefficients intersected with downregulated genes in the high-risk group. Intriguingly, among these downregulated genes, CLEC10A and PTPRT have been demonstrated as poor prognostic factors when their expressions were reduced in breast cancer, suggesting a plausible negative regulatory mechanism of these miRNAs in our TRM signature [92,93]. Similarly, it reduced the expression of the TP63; a known suppressor of cell migration and metastasis and could lead to enhanced tumor invasion and migration [94].
When miRNAs with negative coefficients intersected with upregulated genes, two miRNA: mRNA pairs targeted the same PSCA gene, i.e., hsa-let-7b-5p: PSCA and hsa-mir-146a-5p: PSCA. Our results show that reduced let-7b and mir-146a expression could account for a higher expression PSCA, which has been shown to correlate with unfavorable histological features and HER2/neu overexpression in breast cancer, although there was no association of PSCA with patients’ prognosis [95].
Another mechanism of TAM-mediated cancer progression worth noting is via the methylation of breast cancer-specific genes to regulate gene expression [96]. A recent paper discovered that TAMs secrete IL-6 in the TME to stimulate protein arginine methyltransferase 1 (PRMT1)-mediated meR342-EZH2 formation in order to stabilize the enhancer of Zeste Homolog 2 (EZH2) in breast cancer cells. The EZH2 enrichment subsequently enhanced breast cancer metastasis. The detailed mechanism behind the increment of PRMT1, however, remains unknown [97]. It would be interesting to see in the future if our signature plays any part in this TAM-mediated methylation.
We acknowledge the existence of other miRNA-based prognostic models in breast cancer [98,99], including the seminal work by Iorio et al., which first showed differentially expressed miRNAs in breast cancer correlated with specific clinicopathological features [100]. However, our approach is unique, where instead of comparing the differentially expressed miRNAs in cancer and normal breast tissue, we searched for miRNAs from published literatures that have been proven by experimental data. Furthermore, this study focused on TAM-related miRNAs instead of miRNAs in general, hence narrowing the target for future anti-cancer therapies. In addition, gene set analyses in most studies were based on the list of bioinformatics-predicted mRNAs from the corresponding relevant miRNAs [98,99,101], whereas in this study, we performed the differential expression of coding mRNAs based on risk stratification by the TRM signature to identify the truly differentially expressed genes attributed to this signature.
Overall, as a retrospective study, our data may have certain limitations and would certainly benefit from prospective experimental validation.

4. Methods

4.1. Literature Search for TAM-Related miRNAs

Literature search was performed with the keywords: “miRNA”, “tumor-associated macrophage”, “macrophage” and “cancer” from the year 2016 to 30 May 2021. The NCBI PubMed database was utilized to identify potential prognostic miRNAs that were either delivered to TAMs or derived from TAMs in various cancer types. The scope was broadened to include TRMs within cancer in general, as there were very few TRMs reported in breast cancer alone. Publications that do not mention TAMs were excluded.

4.2. Data Mining of miRNAs, mRNAs and Clinicopathological Data

Stem-loop miRNAs expression and the expression of mRNAs were downloaded from The Cancer Genome Atlas Breast Cancer (TCGA-BRCA) dataset using UCSC Xena [102]. Stem-loop miRNAs expression were miRNA sequencing (miRNAseq) data quantified by a modified version of the profiling pipeline developed by Chu et al. [103]. MiRNAs were annotated based on the miRBase (version 21.0) database. Curated survival data and phenotypes were also obtained. Specifically, data regarding overall survival (OS) and overall survival time (OST), age, gender, estrogen receptor (ER) status, Human Epidermal Growth Factor Receptor-2 (HER2) status, pathological stage, intrinsic subtype based on PAM50 and histological subtype were extracted. The dataset was randomly split into training cohort (80%) and internal validation cohort (20%).

4.3. Prognostic TAM-Related miRNA Signature Construction

Analysis was performed using R software version 4.1.0. TRMs were first screened for their prognostic values in the training cohort by univariate Cox proportional hazards regression analysis using the “survival” package. The p value was adjusted to <0.15 as these miRNAs were curated from literature supported by experimental data. Then, least absolute shrinkage and selection operator (LASSO)-Cox regression analysis was applied using the “glmnet” package to construct the TRM signature with 5-fold cross validation. The risk score for each patient was computed based on this signature by calculating the sum product of miRNA expressions and their respective coefficients.
Patients were ranked by their risk scores and subsequently assigned into low- and high-risk groups. The median risk score from the training cohort was used as the cut-off point. Kaplan–Meier analysis with two-sided log-rank test using “survminer” package was conducted to determine the prognostic value of the risk score in training, internal validation and whole cohorts with the level of significance set at p value < 0.05. To evaluate the prognostic capacity of the risk score based on the TRM signature for overall survival, the time-dependent receiver operating characteristic (ROC) curve was drawn using the “timeROC” package. Subsequently, the Area Under Curve (AUC) metric was calculated for training, internal validation and whole cohorts. The prognostic performance of the risk score for the whole cohort was further evaluated by Harrell’s concordance index (C-index) using the “survcomp” package.

4.4. External Validation of the Prognostic Significance of TAM-Related miRNA Signature with the Gene Expression Omnibus (GEO) Dataset

The GEO database was searched for breast cancer datasets using keywords “miRNA” and “breast cancer”, and the search was limited to studies using human samples, non-coding RNA profiling by array/high throughput sequencing, and with a sample count of more than 200. One dataset, GSE22220, was identified as containing 207 primary breast cancer cases with miRNA expression profiled using Illumina Human v1 MicroRNA expression beadchip containing 735 microRNAs designed against miRBase (version 9.1) and potential miRNAs identified in a RAKE analysis study. The miRNA expressions were normalized log2 signal intensities. Available distant-relapse-free survival data with a complete 10-year follow-up was also downloaded. Kaplan–Meier analysis, time-dependent receiver operating characteristic (ROC) curve, AUC metric analysis and C-index were performed to validate the prognostic capacity of the risk score based on the TRM signature in this external dataset. Similarly, the median risk score was used as the cut-off point to assign patients into low- and high-risk groups.

4.5. Independent Prognostic Significance of the Risk Score Based on TAM-Related miRNAs Signature

Using the TCGA-BRCA dataset, association analyses between the risk score and other pertinent clinicopathological parameters were conducted using Pearson correlation, Welch t-test or one-way ANOVA. Univariate and multivariate Cox proportional hazards regression analyses were conducted using the “survival” package to evaluate the prognostic capacity of the risk score in distinguishing between high-risk and low-risk patients and for its independence from other pertinent clinicopathological parameters. These parameters were age, gender, histological subtype, ER and HER2 status, intrinsic subtype based on PAM50 and pathological stage. The level of significance was set at p value < 0.05. A nomogram was constructed based on the multivariate analysis using “rms” package to predict the 3-, 5- and 10- year survival probability. A time-dependent ROC curve was further drawn to evaluate the prognostic capacity of the nomogram-based prediction model for overall survival by the AUC metric for the whole cohort. C-index was also calculated.
The prognostic capability of this signature was further assessed based on ER+HER2−, ER+/− HER2+ and ER−HER2− breast cancer cohorts via Kaplan–Meier analysis. Focusing on triple-negative breast cancer (TNBC) cases, scores of tumor-infiltrating lymphocytes (TIL) of these cases were extracted from a recent study [104]. The relationship between risk score based on the TRM signature and TIL scores was sought using Spearman correlation.

4.6. Correlation between Prognostic Risk Score and Immune Infiltrate Populations

Immune infiltrates in the tumor tissue were inferred using a gene expression deconvolution algorithm, CIBERSORT. The data for the TCGA-BRCA dataset were downloaded from TIMER2.0 (http://timer.cistrome.org/ (accessed on 27 April 2022)). The Pearson correlation was performed between the risk score and the population of immune infiltrate estimates by using the “ggcorrplot” package. A Pearson correlation coefficient with a p value < 0.05 was considered statistically significant. A Pearson correlation between expressions of individual miRNAs and the populations of immune infiltrate estimates was also performed. The inter-relationship between miRNAs and immune infiltrate populations as visualized by chord diagrams using the “circlize” package. Correlations with correlation coefficients carrying p values < 0.01 were used to construct the chord diagrams.

4.7. Differential Gene Expression and Enrichment Analysis

The raw count data of mRNA expressions from the TCGA-BRCA dataset were first subjected to the filtration of the low expression genes prior to normalization by the weighted trimmed mean of M-values method in the “edgeR” package, and they were transformed by voom in “limma” package for differential gene expression between the high- and low-risk groups. The differentially expressed genes were defined according to adjusted p value <  0.05 and |Log2(fold change)| > 1.
Three types of enrichment analyses were utilized to deduce the biological functions of the differentially expressed genes, which were coding mRNA data from the TCGA-BRCA dataset. First, over-representation analysis of Gene Ontology (GO) to associate the differentially expressed genes with biological processes was performed using the “clusterProfiler” package. Genes were ranked based on the association between their expression and the class distinction (high- or low-risk groups) by a ranking metric, which was defined as the sign of the fold change multiplied by the inverse of the adjusted p value obtained from differential expression analysis. Next, the Kyoto Encyclopedia of Genes and Genomes (KEGG) pathway gene set enrichment analysis and gene set enrichment analysis using Hallmark gene sets from The Molecular Signatures Database (MSigDB) v7.4. were performed for the ranked genes. Adjusted p value < 0.05 was considered as statistically significant.

4.8. Relationship between miRNAs in the TRM Signature and the Differentially Expressed Genes of High- and Low-Risk Groups

To explore the relationship between the miRNAs in the TRM signature and the differentially expressed genes, target mRNAs of the miRNAs in the TRM signature and regulatory miRNAs of the differentially expressed genes in homo sapiens were downloaded from miRNet (https://www.mirnet.ca/ (accessed on 27 April 2022)) based on TarBase 8.0 [104]. Venn diagrams were drawn using the “ggVennDiagram” package to display the relationship between the miRNAs in the TRM signature and regulatory miRNAs inferred from the differentially expressed genes. Similarly, target mRNAs of the miRNAs in the TRM signature were compared to the differentially expressed genes between the high- and low-risk groups.

5. Conclusions

We have successfully constructed an eleven-TAM-related miRNA-based signature in this study that could act as an independent prognostic factor. With further exploration, this signature has the potential to provide best survival estimates, ease prognostication and guide treatment that targets TAMs and immune-related pathways.

Supplementary Materials

The following supporting information can be downloaded at: https://www.mdpi.com/article/10.3390/ijms23136994/s1.

Author Contributions

E.S.C. and S.D.J. conceptualized, designed and performed the data analytics and wrote the first draft. E.S.C. supervised and performed the machine learning analysis. M.C., A.A.M.Z., T.S.R. and T.-H.T. reviewed and edited the manuscript. All authors have read and agreed to the published version of the manuscript.

Funding

S.D.J. was supported by the Universiti Sains Malaysia Research University Grant for Individual (RUI, Grant No: 1001/CIPPT/8012230). E.S.C. was supported by the Universiti Sains Malaysia Research University Grant for Individual (RUI, Grant No: 1001/CIPPT/8012230) and Bridging Grant (Grant No:304.CIPPT.6316263).

Informed Consent Statement

This study did not involve any animal and/or human tissue/individual data/participants; thus, there were no ethics-related issues. No permission was required to use any repository data involved in this study.

Data Availability Statement

The TCGA-BRCA dataset used in this study can be obtained from the UCSC Xena exploration tool (https://xenabrowser.net/ (accessed on 28 August 2021)). GEO dataset used in this study can be obtained from the GEO database (https://www.ncbi.nlm.nih.gov/gds (accessed on 21 April 2022)).

Conflicts of Interest

The authors declare no conflict of interest.

Abbreviations

KRAS: Κirsten rat sarcoma viral oncogene homolog; PTEN: Phosphatase and Tensin Homolog deleted on Chromosome 10; PI3K: phosphatidylinositol 3-kinase; AKT: protein kinase B; NF-κB: Nuclear factor kappa B; STAT: Signal transducer and activator of transcription; SOCS3: Suppressor of cytokine signaling 3; JAK2: Janus kinase 2; TGF: Transforming growth factor; IGKC: Immunoglobulin kappa C; CXCL13: Chemokine (C-X-C motif) ligand 13; CLEC10A: C-type lectin domain family 10 member A; PTPRT: Protein Tyrosine Phosphatase Receptor Type T; PSCA: Prostate Stem Cell Antigen.

References

  1. Jayasingam, S.D.; Citartan, M.; Thang, T.H.; Mat Zin, A.A.; Ang, K.C.; Ch’ng, E.S. Evaluating the polarization of tumor-associated macrophages into M1 and M2 phenotypes in human cancer tissue: Technicalities and challenges in routine clinical practice. Front. Oncol. 2020, 9, 1512. [Google Scholar] [CrossRef] [PubMed] [Green Version]
  2. Chen, C.; Liu, J.-m.; Luo, Y.-p. MicroRNAs in tumor immunity: Functional regulation in tumor-associated macrophages. J. Zhejiang Univ. Sci. B 2020, 21, 12–28. [Google Scholar] [CrossRef] [PubMed]
  3. Meehan, J.; Gray, M.; Martínez-Pérez, C.; Kay, C.; Pang, L.Y.; Fraser, J.A.; Poole, A.V.; Kunkler, I.H.; Langdon, S.P.; Argyle, D. Precision medicine and the role of biomarkers of radiotherapy response in breast cancer. Front. Oncol. 2020, 10, 628. [Google Scholar] [CrossRef] [PubMed]
  4. O’Brien, J.; Hayder, H.; Zayed, Y.; Peng, C. Overview of microRNA biogenesis, mechanisms of actions, and circulation. Front. Endocrinol. 2018, 9, 402. [Google Scholar] [CrossRef] [Green Version]
  5. Vasudevan, S. Posttranscriptional upregulation by microRNAs. Wiley Interdiscip. Rev. RNA 2012, 3, 311–330. [Google Scholar] [CrossRef]
  6. Raue, R.; Frank, A.-C.; Syed, S.N.; Brüne, B. Therapeutic targeting of MicroRNAs in the tumor microenvironment. Int. J. Mol. Sci. 2021, 22, 2210. [Google Scholar] [CrossRef]
  7. Iacona, J.R.; Lutz, C.S. miR-146a-5p: Expression, regulation, and functions in cancer. Wiley Interdiscip. Rev. RNA 2019, 10, e1533. [Google Scholar] [CrossRef]
  8. Liu, H.-T.; Wang, Y.-W.; Xing, A.-Y.; Shi, D.-B.; Zhang, H.; Guo, X.-Y.; Xu, J.; Gao, P. Prognostic value of microRNA signature in patients with gastric cancers. Sci. Rep. 2017, 7, 42806. [Google Scholar] [CrossRef]
  9. Qi, Y.; Lai, Y.-L.; Shen, P.-C.; Chen, F.-H.; Lin, L.-J.; Wu, H.-H.; Peng, P.-H.; Hsu, K.-W.; Cheng, W.-C. Identification and validation of a miRNA-based prognostic signature for cervical cancer through an integrated bioinformatics approach. Sci. Rep. 2020, 10, 22270. [Google Scholar] [CrossRef]
  10. Tian, B.; Hou, M.; Zhou, K.; Qiu, X.; Du, Y.; Gu, Y.; Yin, X.; Wang, J. A Novel TCGA-Validated, MiRNA-Based Signature for Prediction of Breast Cancer Prognosis and Survival. Front. Cell Dev. Biol. 2021, 9, 717462. [Google Scholar] [CrossRef]
  11. Wei, J.; Yin, Y.; Deng, Q.; Zhou, J.; Wang, Y.; Yin, G.; Yang, J.; Tang, Y. Integrative analysis of MicroRNA and gene interactions for revealing candidate signatures in prostate cancer. Front. Genet. 2020, 11, 176. [Google Scholar] [CrossRef] [PubMed]
  12. Yang, Y.; Qu, A.; Wu, Q.; Zhang, X.; Wang, L.; Li, C.; Dong, Z.; Du, L.; Wang, C. Prognostic value of a hypoxia-related microRNA signature in patients with colorectal cancer. Aging 2020, 12, 35. [Google Scholar] [CrossRef] [PubMed]
  13. Duan, S.; Yu, S.; Yuan, T.; Yao, S.; Zhang, L. Exogenous let-7a-5p induces A549 lung cancer cell death through BCL2L1-mediated PI3Kγ signaling pathway. Front. Oncol. 2019, 9, 808. [Google Scholar] [CrossRef]
  14. Huang, Z.; Gan, J.; Long, Z.; Guo, G.; Shi, X.; Wang, C.; Zang, Y.; Ding, Z.; Chen, J.; Zhang, J. Targeted delivery of let-7b to reprogramme tumor-associated macrophages and tumor infiltrating dendritic cells for tumor rejection. Biomaterials 2016, 90, 72–84. [Google Scholar] [CrossRef]
  15. Wang, Z.; Xu, L.; Hu, Y.; Huang, Y.; Zhang, Y.; Zheng, X.; Wang, S.; Wang, Y.; Yu, Y.; Zhang, M. miRNA let-7b modulates macrophage polarization and enhances tumor-associated macrophages to promote angiogenesis and mobility in prostate cancer. Sci. Rep. 2016, 6, 25602. [Google Scholar] [CrossRef] [PubMed] [Green Version]
  16. Hu, Y.; Li, D.; Wu, A.; Qiu, X.; Di, W.; Huang, L.; Qiu, L. TWEAK-stimulated macrophages inhibit metastasis of epithelial ovarian cancer via exosomal shuttling of microRNA. Cancer Lett. 2017, 393, 60–67. [Google Scholar] [CrossRef] [PubMed]
  17. Tong, F.; Mao, X.; Zhang, S.; Xie, H.; Yan, B.; Wang, B.; Sun, J.; Wei, L. HPV + HNSCC-derived exosomal miR-9 induces macrophage M1 polarization and increases tumor radiosensitivity. Cancer Lett. 2020, 478, 34–44. [Google Scholar] [CrossRef]
  18. Li, J.; Xue, J.; Ling, M.; Sun, J.; Xiao, T.; Dai, X.; Sun, Q.; Cheng, C.; Xia, H.; Wei, Y. MicroRNA-15b in extracellular vesicles from arsenite-treated macrophages promotes the progression of hepatocellular carcinomas by blocking the LATS1-mediated Hippo pathway. Cancer Lett. 2021, 497, 137–153. [Google Scholar] [CrossRef]
  19. Li, Z.; Suo, B.; Long, G.; Gao, Y.; Song, J.; Zhang, M.; Feng, B.; Shang, C.; Wang, D. Exosomal miRNA-16-5p derived from M1 macrophages enhances T cell-dependent immune response by regulating PD-L1 in gastric cancer. Front. Cell Dev. Biol. 2020, 8, 1362. [Google Scholar] [CrossRef]
  20. Peng, Y.; Li, X.; Liu, H.; Deng, X.; She, C.; Liu, C.; Wang, X.; Liu, A. microRNA-18a from M2 Macrophages Inhibits TGFBR3 to Promote Nasopharyngeal Carcinoma Progression and Tumor Growth via TGF-β Signaling Pathway. Nanoscale Res. Lett. 2020, 15, 196. [Google Scholar] [CrossRef]
  21. Teng, Y.; Mu, J.; Hu, X.; Samykutty, A.; Zhuang, X.; Deng, Z.; Zhang, L.; Cao, P.; Yan, J.; Miller, D. Grapefruit-derived nanovectors deliver miR-18a for treatment of liver metastasis of colon cancer by induction of M1 macrophages. Oncotarget 2016, 7, 25683. [Google Scholar] [CrossRef] [PubMed] [Green Version]
  22. Yang, J.; Zhang, Z.; Chen, C.; Liu, Y.; Si, Q.; Chuang, T.; Li, N.; Gomez-Cabrero, A.; Reisfeld, R.; Xiang, R. MicroRNA-19a-3p inhibits breast cancer progression and metastasis by inducing macrophage polarization through downregulated expression of Fra-1 proto-oncogene. Oncogene 2014, 33, 3014–3023. [Google Scholar] [CrossRef] [PubMed] [Green Version]
  23. Zheng, P.; Chen, L.; Yuan, X.; Luo, Q.; Liu, Y.; Xie, G.; Ma, Y.; Shen, L. Exosomal transfer of tumor-associated macrophage-derived miR-21 confers cisplatin resistance in gastric cancer cells. J. Exp. Clin. Cancer Res. 2017, 36, 53. [Google Scholar] [CrossRef] [PubMed] [Green Version]
  24. Lin, F.; Yin, H.B.; Li, X.Y.; Zhu, G.M.; He, W.Y.; Gou, X. Bladder cancer cell-secreted exosomal miR-21 activates the PI3K/AKT pathway in macrophages to promote cancer progression. Int. J. Oncol. 2020, 56, 151–164. [Google Scholar] [CrossRef] [PubMed] [Green Version]
  25. Li, N.; Qin, J.F.; Han, X.; Jin, F.J.; Zhang, J.H.; Lan, L.; Wang, Y. miR-21a negatively modulates tumor suppressor genes PTEN and miR-200c and further promotes the transformation of M2 macrophages. Immunol. Cell Biol. 2018, 96, 68–80. [Google Scholar] [CrossRef]
  26. Zhang, Z.; Xu, J.; Chen, Z.; Wang, H.; Xue, H.; Yang, C.; Guo, Q.; Qi, Y.; Guo, X.; Qian, M. Transfer of microRNA via macrophage-derived extracellular vesicles promotes proneural-to-mesenchymal transition in glioma stem cells. Cancer Immunol. Res. 2020, 8, 966–981. [Google Scholar] [CrossRef]
  27. Ma, S.; Liu, M.; Xu, Z.; Li, Y.; Guo, H.; Ge, Y.; Liu, Y.; Zheng, D.; Shi, J. A double feedback loop mediated by microRNA-23a/27a/24-2 regulates M1 versus M2 macrophage polarization and thus regulates cancer progression. Oncotarget 2016, 7, 13502. [Google Scholar] [CrossRef] [Green Version]
  28. Mi, X.; Xu, R.; Hong, S.; Xu, T.; Zhang, W.; Liu, M. M2 macrophage-derived exosomal lncRNA AFAP1-AS1 and microRNA-26a affect cell migration and metastasis in esophageal cancer. Mol. Ther.-Nucleic Acids 2020, 22, 779–790. [Google Scholar] [CrossRef]
  29. Cai, J.; Qiao, B.; Gao, N.; Lin, N.; He, W. Oral squamous cell carcinoma-derived exosomes promote M2 subtype macrophage polarization mediated by exosome-enclosed miR-29a-3p. Am. J. Physiol.—Cell Physiol. 2019, 316, C731–C740. [Google Scholar] [CrossRef]
  30. Lu, L.; Ling, W.; Ruan, Z. Tumor associated macrophages-derived extracellular vesicles containing microRNA-29a-3p explains the deterioration of ovarian cancer. Mol. Ther. Nucleic Acids 2021, 25, 468–482. [Google Scholar] [CrossRef]
  31. Yuan, Y.; Wang, Z.; Chen, M.; Jing, Y.; Shu, W.; Xie, Z.; Li, Z.; Xu, J.; He, F.; Jiao, P. Macrophage-Derived Exosomal miR-31-5p Promotes Oral Squamous Cell Carcinoma Tumourigenesis Through the Large Tumor Suppressor 2-Mediated Hippo Signalling Pathway. J. Biomed. Nanotechnol. 2021, 17, 822–837. [Google Scholar] [CrossRef] [PubMed]
  32. Nilsson, S.; Möller, C.; Jirström, K.; Lee, A.; Busch, S.; Lamb, R.; Landberg, G. Downregulation of miR-92a is associated with aggressive breast cancer features and increased tumour macrophage infiltration. PLoS ONE 2012, 7, e36051. [Google Scholar] [CrossRef] [PubMed]
  33. Liu, G.; Ouyang, X.; Sun, Y.; Xiao, Y.; You, B.; Gao, Y.; Yeh, S.; Li, Y.; Chang, C. The miR-92a-2-5p in exosomes from macrophages increases liver cancer cells invasion via altering the AR/PHLPP/p-AKT/β-catenin signaling. Cell Death Differ. 2020, 27, 3258–3272. [Google Scholar] [CrossRef] [PubMed]
  34. Guan, H.; Peng, R.; Fang, F.; Mao, L.; Chen, Z.; Yang, S.; Dai, C.; Wu, H.; Wang, C.; Feng, N. Tumor-associated macrophages promote prostate cancer progression via exosome-mediated miR-95 transfer. J. Cell. Physiol. 2020, 235, 9729–9742. [Google Scholar] [CrossRef]
  35. Yin, Z.; Zhou, Y.; Ma, T.; Chen, S.; Shi, N.; Zou, Y.; Hou, B.; Zhang, C. Down-regulated lncRNA SBF2-AS1 in M2 macrophage-derived exosomes elevates miR-122-5p to restrict XIAP, thereby limiting pancreatic cancer development. J. Cell. Mol. Med. 2020, 24, 5028–5038. [Google Scholar] [CrossRef] [Green Version]
  36. Wang, Y.; Wang, B.; Xiao, S.; Li, Y.; Chen, Q. miR-125a/b inhibits tumor-associated macrophages mediated in cancer stem cells of hepatocellular carcinoma by targeting CD90. J. Cell. Biochem. 2019, 120, 3046–3055. [Google Scholar] [CrossRef]
  37. Lin, L.; Lin, H.; Wang, L.; Wang, B.; Hao, X.; Shi, Y. miR-130a regulates macrophage polarization and is associated with non-small cell lung cancer. Oncol. Rep. 2015, 34, 3088–3096. [Google Scholar] [CrossRef] [Green Version]
  38. Zhang, Y.; Meng, W.; Yue, P.; Li, X. M2 macrophage-derived extracellular vesicles promote gastric cancer progression via a microRNA-130b-3p/MLL3/GRHL2 signaling cascade. J. Exp. Clin. Cancer Res. 2020, 39, 134. [Google Scholar] [CrossRef]
  39. Zhang, J.; Shan, W.-f.; Jin, T.-t.; Wu, G.-q.; Xiong, X.-x.; Jin, H.-y.; Zhu, S.-m. Propofol exerts anti-hepatocellular carcinoma by microvesicle-mediated transfer of miR-142-3p from macrophage to cancer cells. J. Transl. Med. 2014, 12, 279. [Google Scholar] [CrossRef] [Green Version]
  40. Xu, S.; Wei, J.; Wang, F.; Kong, L.-Y.; Ling, X.-Y.; Nduom, E.; Gabrusiewicz, K.; Doucette, T.; Yang, Y.; Yaghi, N.K. Effect of miR-142-3p on the M2 macrophage and therapeutic efficacy against murine glioblastoma. JNCI J. Natl. Cancer Inst. 2014, 106, dju162. [Google Scholar] [CrossRef]
  41. Li, Y.; Zhao, L.; Shi, B.; Ma, S.; Xu, Z.; Ge, Y.; Liu, Y.; Zheng, D.; Shi, J. Functions of miR-146a and miR-222 in tumor-associated macrophages in breast cancer. Sci. Rep. 2015, 5, 18648. [Google Scholar] [CrossRef]
  42. Zhou, Y.-x.; Zhao, W.; Mao, L.-w.; Wang, Y.-l.; Xia, L.-q.; Cao, M.; Shen, J.; Chen, J. Long non-coding RNA NIFK-AS1 inhibits M2 polarization of macrophages in endometrial cancer through targeting miR-146a. Int. J. Biochem. Cell Biol. 2018, 104, 25–33. [Google Scholar] [CrossRef]
  43. Yin, C.; Han, Q.; Xu, D.; Zheng, B.; Zhao, X.; Zhang, J. SALL4-mediated upregulation of exosomal miR-146a-5p drives T-cell exhaustion by M2 tumor-associated macrophages in HCC. Oncoimmunology 2019, 8, e1601479. [Google Scholar] [CrossRef]
  44. Wu, Q.; Wu, X.; Ying, X.; Zhu, Q.; Wang, X.; Jiang, L.; Chen, X.; Wu, Y.; Wang, X. Suppression of endothelial cell migration by tumor associated macrophage-derived exosomes is reversed by epithelial ovarian cancer exosomal lncRNA. Cancer Cell Int. 2017, 17, 62. [Google Scholar] [CrossRef] [PubMed]
  45. Xue, Y.; Tong, L.; LiuAnwei Liu, F.; Liu, A.; Zeng, S.; Xiong, Q.; Yang, Z.; He, X.; Sun, Y.; Xu, C. Tumor-infiltrating M2 macrophages driven by specific genomic alterations are associated with prognosis in bladder cancer. Oncol. Rep. 2019, 42, 581–594. [Google Scholar] [CrossRef] [PubMed]
  46. Wang, P.; Xu, L.-J.; Qin, J.-J.; Zhang, L.; Zhuang, G.-H. MicroRNA-155 inversely correlates with esophageal cancer progression through regulating tumor-associated macrophage FGF2 expression. Biochem. Biophys. Res. Commun. 2018, 503, 452–458. [Google Scholar] [CrossRef] [PubMed]
  47. Li, X.; Chen, Z.; Ni, Y.; Bian, C.; Huang, J.; Chen, L.; Xie, X.; Wang, J. Tumor-associated macrophages secret exosomal miR-155 and miR-196a-5p to promote metastasis of non-small-cell lung cancer. Transl. Lung Cancer Res. 2021, 10, 1338. [Google Scholar] [CrossRef] [PubMed]
  48. Lan, J.; Sun, L.; Xu, F.; Liu, L.; Hu, F.; Song, D.; Hou, Z.; Wu, W.; Luo, X.; Wang, J. M2 macrophage-derived exosomes promote cell migration and invasion in colon cancer. Cancer Res. 2019, 79, 146–158. [Google Scholar] [CrossRef] [Green Version]
  49. Li, X.; Tang, M. Exosomes released from M2 macrophages transfer miR-221-3p contributed to EOC progression through targeting CDKN1B. Cancer Med. 2020, 9, 5976–5988. [Google Scholar] [CrossRef]
  50. Liu, W.; Long, Q.; Zhang, W.; Zeng, D.; Hu, B.; Liu, S.; Chen, L. miRNA-221-3p derived from M2-polarized tumor-associated macrophage exosomes aggravates the growth and metastasis of osteosarcoma through SOCS3/JAK2/STAT3 axis. Aging (Albany NY) 2021, 13, 19760. [Google Scholar] [CrossRef]
  51. Chen, W.-X.; Wang, D.-D.; Zhu, B.; Zhu, Y.-Z.; Zheng, L.; Feng, Z.-Q.; Qin, X.-H. Exosomal miR-222 from adriamycin-resistant MCF-7 breast cancer cells promote macrophages M2 polarization via PTEN/Akt to induce tumor progression. Aging 2021, 13, 10415. [Google Scholar] [CrossRef] [PubMed]
  52. Ying, X.; Wu, Q.; Wu, X.; Zhu, Q.; Wang, X.; Jiang, L.; Chen, X.; Wang, X. Epithelial ovarian cancer-secreted exosomal miR-222-3p induces polarization of tumor-associated macrophages. Oncotarget 2016, 7, 43076. [Google Scholar] [CrossRef] [PubMed] [Green Version]
  53. Zhu, X.; Shen, H.; Yin, X.; Yang, M.; Wei, H.; Chen, Q.; Feng, F.; Liu, Y.; Xu, W.; Li, Y. Macrophages derived exosomes deliver miR-223 to epithelial ovarian cancer cells to elicit a chemoresistant phenotype. J. Exp. Clin. Cancer Res. 2019, 38, 81. [Google Scholar] [CrossRef] [PubMed]
  54. Yang, M.; Chen, J.; Su, F.; Yu, B.; Su, F.; Lin, L.; Liu, Y.; Huang, J.-D.; Song, E. Microvesicles secreted by macrophages shuttle invasion-potentiating microRNAs into breast cancer cells. Mol. Cancer 2011, 10, 117. [Google Scholar] [CrossRef] [PubMed] [Green Version]
  55. Gao, H.; Ma, J.; Cheng, Y.; Zheng, P. Exosomal transfer of macrophage-derived miR-223 confers doxorubicin resistance in gastric Cancer. OncoTargets Ther. 2020, 13, 12169. [Google Scholar] [CrossRef]
  56. Bai, Z.-z.; Li, H.-y.; Li, C.-h.; Sheng, C.-l.; Zhao, X.-n. M1 Macrophage-Derived Exosomal MicroRNA-326 Suppresses Hepatocellular Carcinoma Cell Progression Via Mediating NF-κB Signaling Pathway. Nanoscale Res. Lett. 2020, 15, 221. [Google Scholar] [CrossRef]
  57. Binenbaum, Y.; Fridman, E.; Yaari, Z.; Milman, N.; Schroeder, A.; David, G.B.; Shlomi, T.; Gil, Z. Transfer of miRNA in macrophage-derived exosomes induces drug resistance in pancreatic adenocarcinoma. Cancer Res. 2018, 78, 5287–5299. [Google Scholar] [CrossRef] [Green Version]
  58. Li, X.; Xu, H.; Yi, J.; Dong, C.; Zhang, H.; Wang, Z.; Miao, L.; Zhou, W. miR-365 secreted from M2 Macrophage-derived extracellular vesicles promotes pancreatic ductal adenocarcinoma progression through the BTG2/FAK/AKT axis. J. Cell. Mol. Med. 2021, 25, 4671–4683. [Google Scholar] [CrossRef]
  59. Yang, X.; Cai, S.; Shu, Y.; Deng, X.; Zhang, Y.; He, N.; Wan, L.; Chen, X.; Qu, Y.; Yu, S. Exosomal miR-487a derived from m2 macrophage promotes the progression of gastric cancer. Cell Cycle 2021, 20, 434–444. [Google Scholar] [CrossRef]
  60. Yin, Z.; Ma, T.; Huang, B.; Lin, L.; Zhou, Y.; Yan, J.; Zou, Y.; Chen, S. Macrophage-derived exosomal microRNA-501-3p promotes progression of pancreatic ductal adenocarcinoma through the TGFBR3-mediated TGF-β signaling pathway. J. Exp. Clin. Cancer Res. 2019, 38, 1–20. [Google Scholar] [CrossRef] [Green Version]
  61. Lei, J.; Chen, P.; Zhang, F.; Zhang, N.; Zhu, J.; Wang, X.; Jiang, T. M2 macrophages-derived exosomal microRNA-501-3p promotes the progression of lung cancer via targeting WD repeat domain 82. Cancer Cell Int. 2021, 21, 91. [Google Scholar] [CrossRef] [PubMed]
  62. Huang, S.; Fan, P.; Zhang, C.; Xie, J.; Gu, X.; Lei, S.; Chen, Z.; Huang, Z. Exosomal microRNA-503-3p derived from macrophages represses glycolysis and promotes mitochondrial oxidative phosphorylation in breast cancer cells by elevating DACT2. Cell Death Discov. 2021, 7, 119. [Google Scholar] [CrossRef] [PubMed]
  63. Zhou, J.; Li, X.; Wu, X.; Zhang, T.; Zhu, Q.; Wang, X.; Wang, H.; Wang, K.; Lin, Y.; Wang, X. Exosomes released from tumor-associated macrophages transfer miRNAs that induce a Treg/Th17 cell imbalance in epithelial ovarian cancer. Cancer Immunol. Res. 2018, 6, 1578–1592. [Google Scholar] [CrossRef] [Green Version]
  64. Zhong, Y.; Yi, C. MicroRNA-720 suppresses M2 macrophage polarization by targeting GATA3. Biosci. Rep. 2016, 36, e00363. [Google Scholar] [CrossRef] [PubMed] [Green Version]
  65. Chen, X.; Ying, X.; Wang, X.; Wu, X.; Zhu, Q.; Wang, X. Exosomes derived from hypoxic epithelial ovarian cancer deliver microRNA-940 to induce macrophage M2 polarization. Oncol. Rep. 2017, 38, 522–528. [Google Scholar] [CrossRef] [PubMed] [Green Version]
  66. Yue, S.; Ye, X.; Zhou, T.; Gan, D.; Qian, H.; Fang, W.; Yao, M.; Zhang, D.; Shi, H.; Chen, T. PGRN−/− TAMs-derived exosomes inhibit breast cancer cell invasion and migration and its mechanism exploration. Life Sci. 2021, 264, 118687. [Google Scholar] [CrossRef]
  67. An, M.; Zang, X.; Wang, J.; Kang, J.; Tan, X.; Fu, B. Comprehensive analysis of differentially expressed long noncoding RNAs, miRNAs and mRNAs in breast cancer brain metastasis. Epigenomics 2021, 13, 14. [Google Scholar] [CrossRef]
  68. Liang, Y.-K.; Lin, H.-Y.; Dou, X.-W.; Chen, M.; Wei, X.-L.; Zhang, Y.-Q.; Wu, Y.; Chen, C.-F.; Bai, J.-W.; Xiao, Y.-S. MiR-221/222 promote epithelial-mesenchymal transition by targeting Notch3 in breast cancer cell lines. NPJ Breast Cancer 2018, 4, 20. [Google Scholar] [CrossRef]
  69. Lv, C.; Li, F.; Li, X.; Tian, Y.; Zhang, Y.; Sheng, X.; Song, Y.; Meng, Q.; Yuan, S.; Luan, L. MiR-31 promotes mammary stem cell expansion and breast tumorigenesis by suppressing Wnt signaling antagonists. Nat. Commun. 2017, 8, 1036. [Google Scholar] [CrossRef] [Green Version]
  70. Shen, Y.; Ye, Y.; Ruan, L.; Bao, L.; Wu, M.; Zhou, Y. Inhibition of miR-660-5p expression suppresses tumor development and metastasis in human breast cancer. Genet. Mol. Res. 2017, 16, gmr16019479. [Google Scholar] [CrossRef]
  71. Yan, L.; Yu, M.C.; Gao, G.L.; Liang, H.W.; Zhou, X.Y.; Zhu, Z.T.; Zhang, C.Y.; Wang, Y.B.; Chen, X. MiR-125a-5p functions as a tumour suppressor in breast cancer by downregulating BAP1. J. Cell. Biochem. 2018, 119, 8773–8783. [Google Scholar] [CrossRef] [PubMed]
  72. Zhang, X.; Li, Y.; Wang, D.; Wei, X. miR-22 suppresses tumorigenesis and improves radiosensitivity of breast cancer cells by targeting Sirt1. Biol. Res. 2017, 50, 27. [Google Scholar] [CrossRef] [PubMed] [Green Version]
  73. Tian, Q.; Sun, H.-F.; Wang, W.-J.; Li, Q.; Ding, J.; Di, W. miRNA-365b promotes hepatocellular carcinoma cell migration and invasion by downregulating SGTB. Future Oncol. 2019, 15, 2019–2028. [Google Scholar] [CrossRef] [PubMed]
  74. Hua, K.; Chen, Y.T.; Chen, C.F.; Tang, Y.S.; Huang, T.T.; Lin, Y.C.; Yeh, T.S.; Huang, K.H.; Lee, H.C.; Hsu, M.T. MicroRNA-23a/27a/24-2 cluster promotes gastric cancer cell proliferation synergistically. Oncol. Lett. 2018, 16, 2319–2325. [Google Scholar] [CrossRef] [PubMed] [Green Version]
  75. Maghsudlu, M.; Yazd, E.F.; Amiriani, T. Increased expression of MiR-27a and MiR-24-2 in esophageal squamous cell carcinoma. J. Gastrointest. Cancer 2020, 51, 227–233. [Google Scholar] [CrossRef] [PubMed]
  76. Al-Harbi, B.; Hendrayani, S.-F.; Silva, G.; Aboussekhra, A. Let-7b inhibits cancer-promoting effects of breast cancer-associated fibroblasts through IL-8 repression. Oncotarget 2018, 9, 17825. [Google Scholar] [CrossRef]
  77. Han, X.; Zhang, J.-J.; Han, Z.-Q.; Zhang, H.-B.; Wang, Z.-A. Let-7b attenuates cisplatin resistance and tumor growth in gastric cancer by targeting AURKB. Cancer Gene Ther. 2018, 25, 300–308. [Google Scholar] [CrossRef]
  78. Kuang, Y.; Xu, H.; Lu, F.; Meng, J.; Yi, Y.; Yang, H.; Hou, H.; Wei, H.; Su, S. Inhibition of microRNA let-7b expression by KDM2B promotes cancer progression by targeting EZH2 in ovarian cancer. Cancer Sci. 2021, 112, 231. [Google Scholar] [CrossRef]
  79. Yu, T.; Ma, P.; Wu, D.; Shu, Y.; Gao, W. Functions and mechanisms of microRNA-31 in human cancers. Biomed. Pharmacother. 2018, 108, 1162–1169. [Google Scholar] [CrossRef]
  80. Ge, F.; Wang, C.; Wang, W.; Liu, W.; Wu, B. MicroRNA-31 inhibits tumor invasion and metastasis by targeting RhoA in human gastric cancer. Oncol. Rep. 2017, 38, 1133–1139. [Google Scholar] [CrossRef] [Green Version]
  81. Li, X.; Truong, B.; Xu, T.; Liu, L.; Li, J.; Le, T.D. Uncovering the roles of microRNAs/lncRNAs in characterising breast cancer subtypes and prognosis. BMC Bioinform. 2021, 22, 300. [Google Scholar] [CrossRef] [PubMed]
  82. Blanche, P.; Kattan, M.W.; Gerds, T.A. The c-index is not proper for the evaluation of-year predicted risks. Biostatistics 2019, 20, 347–357. [Google Scholar] [CrossRef]
  83. Fan, Y.; He, S. The Characteristics of Tumor Microenvironment in Triple Negative Breast Cancer. Cancer Manag. Res. 2022, 14, 1. [Google Scholar] [CrossRef] [PubMed]
  84. Sato, Y.; Shimoda, M.; Sota, Y.; Miyake, T.; Tanei, T.; Kagara, N.; Naoi, Y.; Kim, S.J.; Noguchi, S.; Shimazu, K. Enhanced humoral immunity in breast cancer patients with high serum concentration of anti-HER2 autoantibody. Cancer Med. 2021, 10, 1418–1430. [Google Scholar] [CrossRef] [PubMed]
  85. Pandya, P.H.; Murray, M.E.; Pollok, K.E.; Renbarger, J.L. The immune system in cancer pathogenesis: Potential therapeutic approaches. J. Immunol. Res. 2016, 2016, 4273943. [Google Scholar] [CrossRef] [PubMed]
  86. Zagirova, D.; Autenried, R.; Nelson, M.E.; Rezvani, K. Proteasome Complexes and Their Heterogeneity in Colorectal, Breast and Pancreatic Cancers. J. Cancer 2021, 12, 2472. [Google Scholar] [CrossRef] [PubMed]
  87. Zacksenhaus, E.; Shrestha, M.; Liu, J.C.; Vorobieva, I.; Chung, P.E.; Ju, Y.; Nir, U.; Jiang, Z. Mitochondrial OXPHOS induced by RB1 deficiency in breast cancer: Implications for anabolic metabolism, stemness, and metastasis. Trends Cancer 2017, 3, 768–779. [Google Scholar] [CrossRef]
  88. Raninga, P.V.; Lee, A.; Sinha, D.; Dong, L.-f.; Datta, K.K.; Lu, X.; Kalita-de Croft, P.; Dutt, M.; Hill, M.; Pouliot, N. Marizomib suppresses triple-negative breast cancer via proteasome and oxidative phosphorylation inhibition. Theranostics 2020, 10, 5259. [Google Scholar] [CrossRef]
  89. Zhao, X.; Liu, J.; Ge, S.; Chen, C.; Li, S.; Wu, X.; Feng, X.; Wang, Y.; Cai, D. Saikosaponin A inhibits breast cancer by regulating Th1/Th2 balance. Front. Pharmacol. 2019, 10, 624. [Google Scholar] [CrossRef] [Green Version]
  90. Eftekhari, R.; Esmaeili, R.; Mirzaei, R.; Bidad, K.; de Lima, S.; Ajami, M.; Shirzad, H.; Hadjati, J.; Majidzadeh-A., K. Study of the tumor microenvironment during breast cancer progression. Cancer Cell Int. 2017, 17, 123. [Google Scholar] [CrossRef] [Green Version]
  91. Karagkouni, D.; Paraskevopoulou, M.D.; Chatzopoulos, S.; Vlachos, I.S.; Tastsoglou, S.; Kanellos, I.; Papadimitriou, D.; Kavakiotis, I.; Maniou, S.; Skoufos, G. DIANA-TarBase v8: A decade-long collection of experimentally supported miRNA–gene interactions. Nucleic Acids Res. 2018, 46, D239–D245. [Google Scholar] [CrossRef] [PubMed] [Green Version]
  92. Li, L.; Xu, F.; Xie, P.; Yuan, L.; Zhou, M. PTPRT Could Be a Treatment Predictive and Prognostic Biomarker for Breast Cancer. BioMed Res. Int. 2021, 2021, 3301402. [Google Scholar] [CrossRef] [PubMed]
  93. Kurze, A.K.; Buhs, S.; Eggert, D.; Oliveira-Ferrer, L.; Müller, V.; Niendorf, A.; Wagener, C.; Nollau, P. Immature O-glycans recognized by the macrophage glycoreceptor CLEC10A (MGL) are induced by 4-hydroxy-tamoxifen, oxidative stress and DNA-damage in breast cancer cells. Cell Commun. Signal. 2019, 17, 1–18. [Google Scholar] [CrossRef] [Green Version]
  94. Neophytou, C.; Boutsikos, P.; Papageorgis, P. Molecular mechanisms and emerging therapeutic targets of triple-negative breast cancer metastasis. Front. Oncol. 2018, 8, 31. [Google Scholar] [CrossRef] [PubMed] [Green Version]
  95. Link, T.; Kuithan, F.; Ehninger, A.; Kuhlmann, J.D.; Kramer, M.; Werner, A.; Gatzweiler, A.; Richter, B.; Ehninger, G.; Baretton, G. Exploratory investigation of PSCA-protein expression in primary breast cancer patients reveals a link to HER2/neu overexpression. Oncotarget 2017, 8, 54592. [Google Scholar] [CrossRef]
  96. Vietri, M.T.; D’elia, G.; Benincasa, G.; Ferraro, G.; Caliendo, G.; Nicoletti, G.F.; Napoli, C. DNA methylation and breast cancer: A way forward. Int. J. Oncol. 2021, 59, 98. [Google Scholar] [CrossRef]
  97. Li, Z.; Wang, D.; Wang, W.; Chen, X.; Tang, A.; Hou, P.; Li, M.; Zheng, J.; Bai, J. Macrophages-stimulated PRMT1-mediated EZH2 methylation promotes breast cancer metastasis. Biochem. Biophys. Res. Commun. 2020, 533, 679–684. [Google Scholar] [CrossRef]
  98. Lai, J.; Wang, H.; Pan, Z.; Su, F. A novel six-microRNA-based model to improve prognosis prediction of breast cancer. Aging (Albany NY) 2019, 11, 649. [Google Scholar] [CrossRef]
  99. Tang, J.; Ma, W.; Zeng, Q.; Tan, J.; Cao, K.; Luo, L. Identification of miRNA-based signature as a novel potential prognostic biomarker in patients with breast cancer. Dis. Markers 2019, 2019, 3815952. [Google Scholar] [CrossRef]
  100. Iorio, M.V.; Ferracin, M.; Liu, C.-G.; Veronese, A.; Spizzo, R.; Sabbioni, S.; Magri, E.; Pedriali, M.; Fabbri, M.; Campiglio, M. MicroRNA gene expression deregulation in human breast cancer. Cancer Res. 2005, 65, 7065–7070. [Google Scholar] [CrossRef] [Green Version]
  101. Lu, L.; Wu, Y.; Feng, M.; Xue, X.; Fan, Y. A novel seven-miRNA prognostic model to predict overall survival in head and neck squamous cell carcinoma patients. Mol. Med. Rep. 2019, 20, 4340–4348. [Google Scholar] [CrossRef] [PubMed]
  102. Goldman, M.J.; Craft, B.; Hastie, M.; Repečka, K.; McDade, F.; Kamath, A.; Banerjee, A.; Luo, Y.; Rogers, D.; Brooks, A.N. Visualizing and interpreting cancer genomics data via the Xena platform. Nat. Biotechnol. 2020, 38, 675–678. [Google Scholar] [CrossRef] [PubMed]
  103. Chu, A.; Robertson, G.; Brooks, D.; Mungall, A.J.; Birol, I.; Coope, R.; Ma, Y.; Jones, S.; Marra, M.A. Large-scale profiling of microRNAs for the cancer genome atlas. Nucleic Acids Res. 2016, 44, e3. [Google Scholar] [CrossRef] [PubMed]
  104. Chang, L.; Zhou, G.; Soufan, O.; Xia, J. miRNet 2.0: Network-based visual analytics for miRNA functional analysis and systems biology. Nucleic Acids Res. 2020, 48, W244–W251. [Google Scholar] [CrossRef] [PubMed]
Figure 1. The overall workflow describing the process involved in the construction of 11TAM-related miRNA signature. (A) Flow chart describing the process involved in developing and validating the prognostic significance of the 11TAM-related miRNA signature. (B) Flow chart showing the prognostic independence evaluation and downstream analysis of high-risk vs. low-risk group assigned by the TRM signature.
Ijms 23 06994 g001
Figure 2. Cox regression analysis. (A) The 16 TAM-related miRNAs with p value < 0.15 and their hazard ratios from univariate Cox proportional hazards regression analysis. (B) Tuning parameter (λ) selection in the LASSO model for OS-relevant miRNAs. (C) The LASSO coefficient profile of the 16 miRNAs. The vertical line indicates the coefficient selected by LASSO.
Ijms 23 06994 g002
Figure 3. Risk score distribution and TRM expression heat map in TCGA-BRCA dataset. (A) Risk score distribution where blue dot signifies low-risk group and red dot signifies high-risk group. Vertical dotted lines indicate the cut-off point for median risk score. (B) Survival time and status for all patients. (C) Heat map of the eleven selected TRM expression in the TRM signature.
Ijms 23 06994 g003
Figure 4. Kaplan–Meier survival analysis and time dependent ROC curves of the risk groups based on TRM signature for training and validation cohorts. KM curves show that the low-risk group has significantly longer overall survival compared to the high-risk group in both the training (A) and validation (B) cohorts. The AUCs of time-dependent ROC curves at 5-year OS were 0.69 and 0.66 for the training (C) and validation (D) cohorts, respectively.
Ijms 23 06994 g004
Figure 5. Kaplan–Meier survival analysis and time-dependent ROC curves of the risk groups based on the TRM signature for the external GEO GSE22220 cohort. (A) Patients of the high-risk group had significantly shorter DRFS (p value < 0.001). (B) AUCs of time -dependent ROC curves at 3-, 5- and 8-year DRFS were 0.54, 0.60 and 0.63, respectively.
Ijms 23 06994 g005
Figure 6. Univariate and multivariate Cox proportional hazards regression analysis for pertinent clinicopathological parameters. (A) Higher pathological stages (stage III and IV), ER and HER2 negative status, higher age and high-risk groups were significant poor prognostic factors in univariate analysis. (B) High-risk group remains an independent poor prognostic factor (p value < 0.001) in the multivariate analysis.
Ijms 23 06994 g006
Figure 7. Correlation between risk score and immune infiltrate populations. M2 macrophages had the highest positive correlation with the risk score, while M1 had the third highest negative correlation, after CD8 T cells and CD4 T cells. * p < 0.05, ** p < 0.01, *** p < 0.001.
Ijms 23 06994 g007
Figure 8. Volcano plot for the differential gene expression. Four genes were upregulated while 59 genes were downregulated in the high-risk group as compared to the low-risk group with the adjusted p value <  0.05 and |Log2(fold change)| > 1.
Ijms 23 06994 g008
Figure 9. Overrepresentation analysis of the 59 downregulated genes by GO–biological process. The downregulated genes were mostly concentrated in the immune pathways, such as classical pathway of complement activation, adaptive immune response and humoral immune response.
Ijms 23 06994 g009
Figure 10. KEGG pathway gene set enrichment analysis for the ranked genes. Size of dots represents the GeneRatio while the color represents the p value. (A) Proteosome, DNA replication, oxidative phosphorylation and base excision repair pathways were significantly activated in the high-risk group as compared to the low-risk group. (B) Immunity pathways such as Th1 and Th2 cell differentiation, JAK-STAT signaling pathway and Th17 cell differentiation were suppressed in the high-risk group as compared to the low-risk group.
Ijms 23 06994 g010
Figure 11. (A,C) Venn diagrams displaying relationship between miRNAs in the TRM signature and regulatory miRNAs inferred from the differentially expressed genes. (B,D) Venn diagrams displaying relationship between differently expressed genes between the high- and low-risk group and predicted target mRNAs of the miRNAs in the TRM signature.
Ijms 23 06994 g011
Table 1. List of TAM-related miRNAs from various cancers.
No miRNACancer Type FunctionRefPrecursor miRNAs
1let-7aLungtransferred from TAMs to lung cancer to inhibit cell proliferation, migration, and invasion[13]let-7a-1
let-7a-2
let-7a-3
2let-7bBreast
Prostate
repolarizes M2 TAMs to M1 in tumor cells
modulates macrophage polarization to promote angiogenesis and mobility
[14]
[15]
3miR-7Ovarianreleased by TAMs to inhibit cell metastasis[16]mir-7-1
mir-7-2
mir-7-3
4miR-9HNSCCinduces M1 TAM polarization and increases tumor radiosensitivity[17]mir-9-1
mir-9-2
mir-9-3
5miR-15bHCCderived from M2 TAMs to promote cancer progression [18]
6miR-16Gastrictransferred from M1 TAMs to cancer cells to inhibit tumor formation[19]mir-16-1
mir-16-2
7miR-18aNasopharynx
Liver
derived from M2 TAMs to promote cancer progression and tumor growth
induces M1 TAMs to inhibit tumor metastasis
[20]
[21]
8miR-19aBreast
Gastric
downregulates M2 TAMs to inhibit cancer progression and metastasis
derived from M2 TAMs to reduce chemosensitivity and tumor cell apoptosis
[22]
[23]
9miR-21Bladder
Breast
promotes cancer progression by polarizing TAMs to M2 phenotype
promotes M2 TAM transformation to induce metastasis
[24]
[25]
10miR-22Gliomaderived from TAMs to promote mesenchymal phenotype and induce radiotherapy resistance[26]
11miR-23aBreastregulates TAM polarization[27]
12miR-24-2Breastregulates M1 and M2 TAM polarization[27]mir-24-1
mir-24-2
13miR-26aEsophagealM2 TAMs downregulate miR-26a to promote invasion and metastasis of cancer[28]mir-26a-1
mir-26a-2
14miR-27aGliomaderived from TAMs to promote mesenchymal phenotype and induce radiotherapy resistance[26]
15miR-29aOSCC
Ovarian
promotes M2 TAMs polarization to enhance proliferation and invasion of cancer cells
derived by TAM to facilitate cancer cell proliferation and immune escape
[29]
[30]
16miR-31OSCCderived by M2 TAMs to facilitate cancer progression[31]
17miR-92aBreast
Liver
suppresses the infiltration of TAMs in tumor cells
derived from TAMs to increase liver cancer cells invasion
[32]
[33]
mir-92a-1
mir-92a-2
18miR-95Prostatederived by M2 TAMs to promote cancer progression [34]
19miR-122PancreaticM2 TAMs increases miR-122-5p expression to inhibit PC progression[35]
20miR-125aHCCinhibits TAMs mediated in cancer stem cells[36]
21miR-125bHCCinhibits TAMs mediated in cancer stem cells[36]mir-125b-1
mir-125b-2
22miR-130aLungsuppresses the polarization of M2 TAMs and enhances M1 polarization[37]
23miR-130bGastrictransferred from M2 TAM to promote survival, migration, invasion, and angiogenesis[38]
24miR-142HCC
Glioblastoma
transferred from TAM to cancer cells to inhibit proliferation, tumor growth and invasion
inhibits glioma growth and induces apoptosis in M2 TAMs
[39]
[40]
25miR-146aBreast
Endometrial
HCC
promotes M2 TAM expression
inhibits M2 TAM polarization
promotes M2 polarization
[41]
[42]
[43]
26miR-146bOvarian
Bladder
inhibits the migration of endothelial cells
promotes M2 TAM infiltration
[44]
[45]
27miR-155Esophageal
Lung
Colon
derived from TAMs to suppress cancer proliferation, migration, invasion and vasculature formation
secreted by M2 TAMs to promote metastasis
derived from M2 TAMs to promote cell migration and invasion
[46]
[47]
[48]
28miR-221Ovarian
Osteosarcoma
Glioma
released from M2 TAMs to promote cancer cell proliferation and progression
derived from M2 TAMs to aggravate cancer growth and metastasis
derived from TAMs to promote mesenchymal phenotype and induce radiotherapy resistance
[49]
[50]
[26]
29miR-222Breast
Ovarian
delivered to TAMs to induce M2 polarization
regulates polarization of M2 TAMs
[51]
[52]
30miR-223Ovarian
Breast
Gastric
derived from TAM to enhance tumor malignancy and chemoresistance
released by M2 TAMs to promote cancer cell invasion
derived by M2 TAMs to promote drug resistance
[53]
[54]
[55]
31miR-326HCCderived by M1 TAMs to inhibit cancer cell proliferation, colony formation, migration and invasion[56]
32miR-365Pancreaticsecreted by M2 TAMs to induce drug resistance and promote cancer progression[57]
[58]
mir-365a
mir-365b
33miR-487aGastricderived from M2 TAMs to promote cancer proliferation and tumorigenesis[59]
34miR-501Pancreatic
Lung
derived by M2 TAMs to inhibit tumor suppressor TGFBR3 gene and facilitate cancer development
derived by M2 TAMs to promote cancer progression
[60]
[61]
35miR-503Breastderived from TAMs to suppress cancer progression[62]
36miR-660Ovarianupregulated in TAMs that promote cancer progression[63]
37miR-720Breastinhibits M2 TAM polarization[64]
38miR-877Breastincreases expression in the late 4T1 tumor TAMs[41]
39miR-940Ovarianinduces M2 TAMs polarization[65]
40miR-4291Breastdownregulated in TAMs that promote cancer progression[66]
41miR-5100Breastinhibits invasion and migration of cancer[66]
42miR-5196Breastdownregulated in TAMs that promote cancer progression[66]
HNSCC: Head and neck squamous cell carcinoma, HCC: Hepatocellular carcinoma, OSCC: Oral squamous cell carcinoma.
Publisher’s Note: MDPI stays neutral with regard to jurisdictional claims in published maps and institutional affiliations.

