Article

Identification and Characterization of Abiotic Stress–Responsive NF-YB Family Genes in Medicago

1
Institute of Animal Science, Chinese Academy of Agricultural Sciences, Beijing 100193, China
2
College of Horticulture, Hunan Agricultural University, Changsha 410128, China
3
West Arid Region Grassland Resource and Ecology Key Laboratory, College of Grassland and Environmental Sciences, Xinjiang Agricultural University, Urumqi 830052, China
*
Author to whom correspondence should be addressed.
Int. J. Mol. Sci. 2022, 23(13), 6906; https://doi.org/10.3390/ijms23136906
Submission received: 17 May 2022 / Revised: 4 June 2022 / Accepted: 5 June 2022 / Published: 21 June 2022

Abstract

:
Nuclear factor YB (NF-YB) are plant-specific transcription factors that play a critical regulatory role in plant growth and development as well as in plant resistance against various stresses. In this study, a total of 49 NF-YB genes were identified from the genomes of Medicago truncatula and Medicago sativa. Multiple sequence alignment analysis showed that all of these NF-YB members contain DNA binding domain, NF-YA interaction domain and NF-YC interaction domain. Phylogenetic analysis suggested that these NF-YB proteins could be classified into five distinct clusters. We also analyzed the exon–intron organizations and conserved motifs of these NF-YB genes and their deduced proteins. We also found many stress-related cis-acting elements in their promoter region. In addition, analyses on genechip for M. truncatula and transcriptome data for M. sativa indicated that these NF-YB genes exhibited a distinct expression pattern in various tissues; many of these could be induced by drought and/or salt treatments. In particular, RT-qPCR analysis revealed that the expression levels of gene pairs MsNF-YB27/MtNF-YB15 and MsNF-YB28/MtNF-YB16 were significantly up-regulated under NaCl and mannitol treatments, indicating that they are most likely involved in salt and drought stress response. Taken together, our study on NF-YB family genes in Medicago is valuable for their functional characterization, as well as for the application of NF-YB genes in genetic breeding for high-yield and high-resistance alfalfa.

1. Introduction

Nuclear factor Y (NF-Y), also called heme-activated protein (HAP) or CCAAT binding factor (CBF), can be found in almost all eukaryotes [1,2]. The NF-Y Transcription Factors binds to cis-elements with the conserved core sequence CCAAT to activate or inhibit the expression of related functional genes in metabolism [3]. The NF-Y family protein consists of three different subunits: NF-YA, NF-YB, and NF-YC [4]. These three subunits are distinguished by conserved structure and protein length, with NF-YAs being longer than NF-YB and NF-YC. In general, NF-YA contains two structural domains, A1 and A2 [5], while the protein structures of NF-YB and NF-YC are similar to H2B and H2A histones, respectively [5]. Subunits NF-YB and NF-YC form dimers in the cytoplasm and then bind to the NF-YA protein and form a trimer in the nucleus [6]. Interestingly, in yeast and mammals, each NF-Y subunit is encoded by a single gene; but in plants, it is encoded by multiple genes, and the number of genes encoding individual subunits are also different from species to species [1].
Recent studies have shown that individual NF-Y subunits in plants are involved in many important growth processes, especially in embryogenesis [7], seed maturation [8], chloroplast synthesis [9], and tissue division [10]. It is worth noting that a large body of evidence has shown that NF-YB genes have multiple functions. For example, AtNF-YB2 promotes the flowering process by increasing the expression of the key flowering genes Flowering locus T (FT) and Suppressor of Over-expression of Constans 1 (SOC1) [11]. AtNF-YB2 and AtNF-YB3 can interact with AtNF-YC3, 4, and 9, which play a crucial role in controlling flowering time via the photoperiod pathway [12]. In contrast to AtNF-YB2, other NF-YB genes in A. thaliana have been shown to function in drought tolerance, abscisic acid signaling transduction, embryo-like structures, and root elongation [13,14,15]. Typically, AtNF-YB1 enhanced drought tolerance, neither in an ABA-dependent manner nor in an ABA-independent manner [13]. Over-expression of AtNF-YB9 in transgenic Arabidopsis activates embryo-specific gene expression and leads to the formation of embryo-like structures in leaves, suggesting a role for AtNF-YB9 in regulating embryonic development [16]. Aside from A. thaliana, the functional characterization of NF-YB genes has also been performed in several other plants species and has shown various biological roles. For example, PdNF-YB7 from poplar increased drought tolerance through up-regulating downstream genes of the ABA-dependent pathway in Arabidopsis [17]. Moreover, SiNF-YB8 can enhance drought and osmotic tolerance in tobacco [18]. Over-expression of PwNF-YB3 from foxtail millet can significantly improve the tolerance of seedlings under salinity, drought, and osmotic stress [19]. These results demonstrated NF-YB genes from plants not only affect plant development but are also associated with plant resistance to abiotic stresses.
Alfalfa (Medicago sativa L.) is a perennial herb in the legume family with an available genome sequence [20]; it known for its high crude protein content and extensive primary root system, making it the most widely distributed cultivated forage grass in the world [21]. However, drought and high-salt soils are the two most important environmental factors that limit the growth of plants; therefore, mining key genes to improve alfalfa resistance to adversity has become one of the most effective approaches in solving this problem [22]. Previous studies have shown that the NF-YB subfamily plays key role in improving drought tolerance in plants such as Arabidopsis [13], tobacco [18], and maize [19]. Gene families such as P450 [23], HD-ZIP [24], SRS [25], and PcG [26] in Medicago have been identified. These families are related to abiotic stress and growth, but the NF-YB gene family has not yet been reported. In light of this, we identified the NF-YB gene family from Medicago truncatula and M. sativa using genome-wide analysis. In total, 49 members of the NF-YB gene family were identified and further characterized, including information on sequence alignment, phylogenetic relationships, chromosome locations, gene structures, conserved motifs, and cis-element of the promoter region. In addition, genechip data for M. truncatula and transcriptome data for M. sativa were analyzed in the expression pattern of NF-YB genes, aiming to search for potential common response genes to drought and salt stress. Moreover, expression analysis under drought and salt stress treatments indicated that some NF-YB genes respond to drought and salt stress, and these genes can serve as candidates for genetic breeding of high resistance in Medicago.

2. Results

2.1. Identification of NF-YB Family Genes in Medicago

The conserved mode of NF-YB and the NF-Y proteins from A. thaliana and O. sativa were used as queries to identify NF-YB genes in M. truncatula and M. sativa. In total, 21 MtNF-YB and 28 MsNF-YB genes were identified and designated according to their location on chromosomes, as shown in Table 1. Previously, 24 MtNF-YB members were deposited in PlantTFDB with V4 genome sequencing results, and three of them were found to be duplicate sequences with the V5 genome sequencing data in the present study. Therefore, these 21 MtNF-YB were named according to their positions on the chromosome and were listed along with the corresponding gene locus deposited in PlantTFDB in Table 1. MtNF-YB and MsNF-YB genes encode proteins ranging from 91 to 257 and 78 to 289 amino acids in length, respectively. The detailed information of NF-YB family genes in Medicago, including sequence ID, chromosome location, amino acid length (aa), protein isoelectric point (PI) value and protein molecular weight (MW) (kDa) are listed in Table 1. Moreover, the corresponding NF-YB homologous genes of M. truncatula or M. sativa were identified based on sequence alignment. Subcellular location analysis showed that NF-YB proteins from M. truncatula and M. sativa were predicated to be located in nuclear (20 out of 21 MtNF-YB; 22 out of 28 MsNF-YB) or extracellular areas. Recent studies demonstrated that miRNAs located in the nucleus could act on CREs (e.g., promoters and enhancers) to regulate gene expression (activation or suppression) [27]. Those localized outside the cell may be closely related to cellular signal reception and transduction [28].

2.2. Multiple Sequence Alignment of NF-YB Genes in Medicago

To further investigate the conserved regions of NF-YB subfamilies in Medicago, multiple protein sequence alignments were analyzed using MEGA-X, and displayed via jalview (Figure 1). The results illustrated that the core regions for MtNF-YB and MsNF-YB were 92 and 88 amino acids in length, respectively, which were close to the average length reported previously [29]. In addition, most NF-YBs from M. truncatula and M. sativa also contained DNA binding α1, NF-YA interaction α2, and NF-YC interaction α3/αC, which have a similar structure as the histone-fold motif (HFM) of the core histone H2B [30]. Among them, MtNF-YB3 lacks the αC domain, MsNF-YB21 and 23 lack α3 and αC domains, MsNF-YB25 lacks the α1 domain, and MsNF-YB24 lacks α1 and α3 domains, which may be due to the genome sequences.

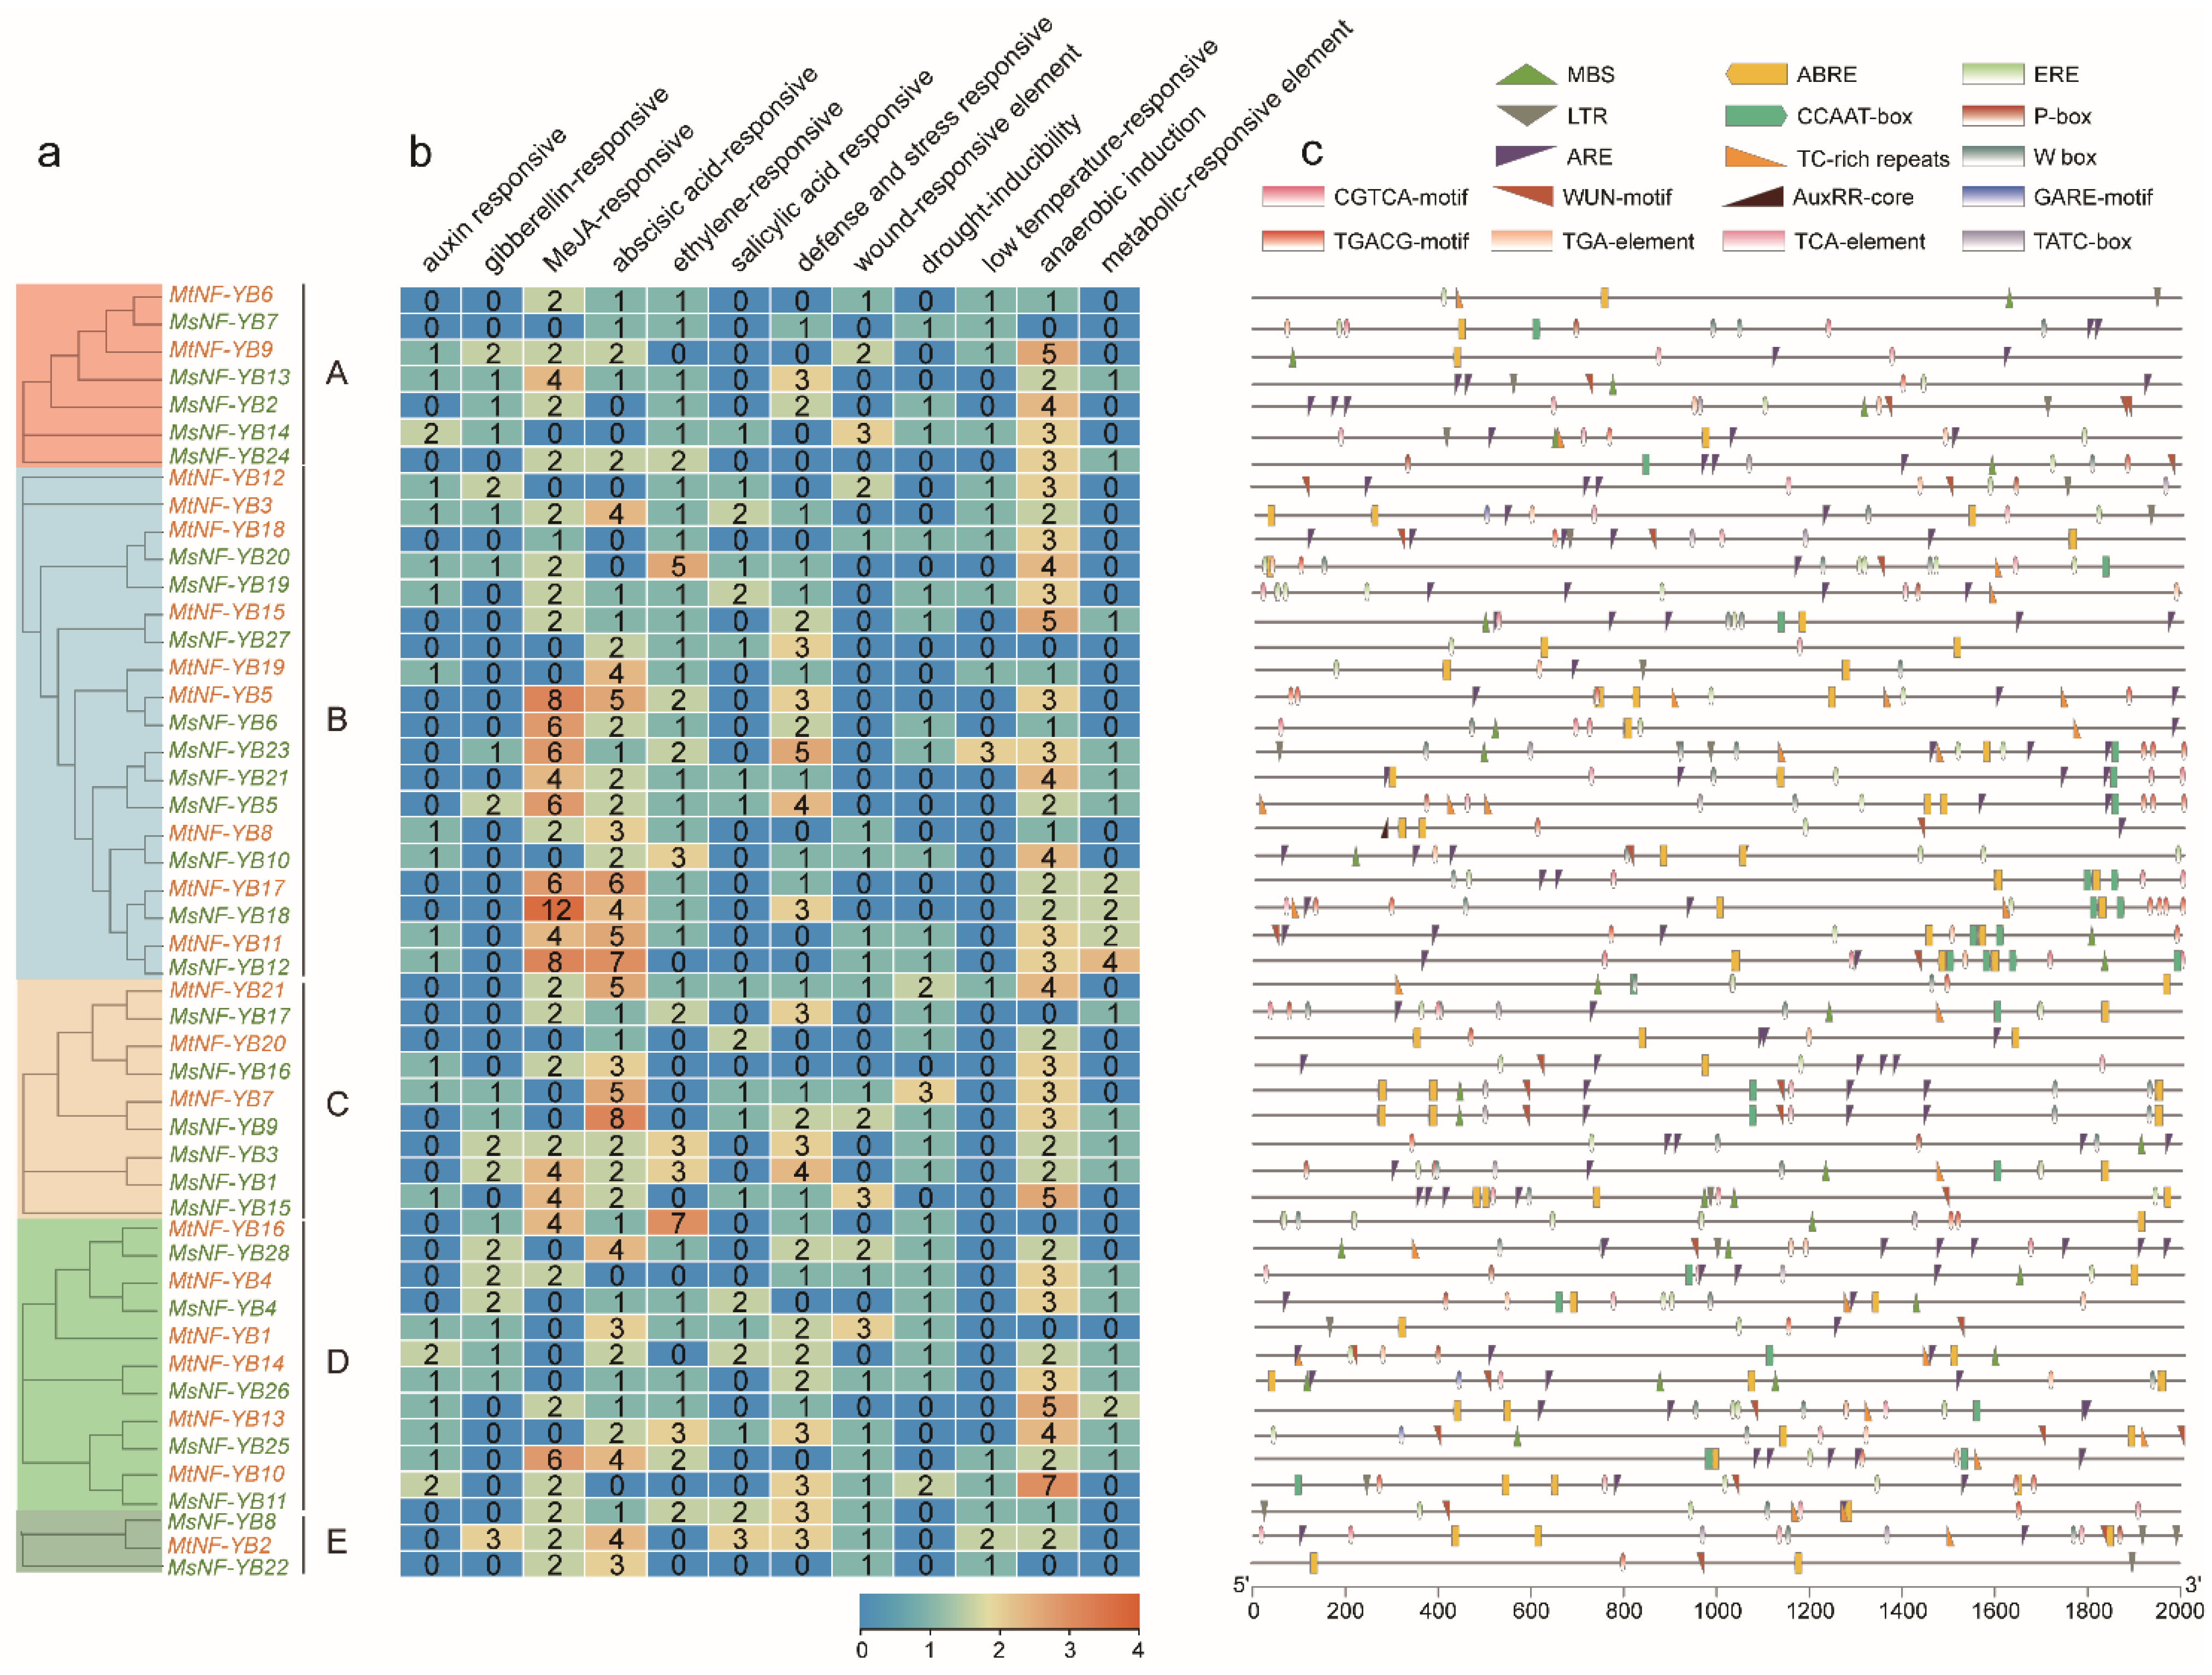
2.3. Phylogenetic Analysis of NF-YB Proteins

To better understand the evolutionary relationships of the NF-YB gene, a neighbor-joining (NJ) phylogenetic tree was constructed with the NF-YB proteins from M. truncatula, M. sativa, A. thaliana, P. vulgaris, P. sativum, and T. pratense. The details are shown in Table S2. The NF-YB proteins were divided into six clades, designated as A, B, C, D, E, and F. The F clade was the largest group, containing 69 NF-YB proteins, whereas the B and C clade were the smallest, consisting of only one member (only MsNF-YB25 in group B and PcNF-YB2 in group C), indicating that NF-YB proteins were distributed unevenly in different clades (Figure 2). Among them, three AtNF-YB members were found in each of clusters A and E. Notably, only two members from M. sativa (MsNF-YB2, 13) and M. truncatula (MtNF-YB2, 13) were present in cluster D, demonstrating that these genes may play specific roles in the evolutionary process (Figure 2).

2.4. Analysis of Gene Structure and Conserved Motifs of NF-YB Genes in Medicago

To comprehensively study the function of NF-YB genes, we performed analysis on gene structure and conserved motifs. We performed another phylogenetic analyses for NF-YB from M. sativa and M. truncatula and found they were regrouped into five clusters. As shown in Figure 3a, all NF-YB proteins were classified into five clades that were consistent with the phylogenetic relationships, as illustrated in Figure 2. The MEME analysis tool was used to predict conserved motifs in NF-YB genes (Figure 3b). A total of 20 motifs were identified; we found that all 21 MtNF-YB members contained motif 1. In total, 23 out of 28 MsNF-YB members contained motif 1, except for MsNF-YB24, 23, 21, 5, and 15. In addition, most NF-YB contained similar motifs, for example, motifs 2 and 3 were widely distributed in most NF-YB. We also found that NF-YB proteins with close phylogenetic relationships exhibited similar motif arrangements, for example, motifs 5, 11, 16, 17, and 18 only present in cluster B. The specificity of these motifs may result in functional differences among NF-YB within each cluster. To elucidate the gene structure of NF-YB family genes, we compared the coding sequences with their corresponding genomic sequences to determine the positions of exons and introns. As shown in Figure 3c, the numbers of exons ranged from one to seven, where genes with one exon accounted for 53% of the total NF-YB genes, most of which were from B and C clades. These results indicate that the intron/exon distribution in NF-YB genes from Medicago is highly variable. In addition, 29 genes lacked one or two of the 5′- or 3′- untranslated region (UTR), particularly in cluster E, which may be due to the genome annotation.

2.5. Analyses of Chromosomal Distribution and Synteny of NF-YB Genes in Medicago

All NF-YB genes were unevenly distributed on chromosomes in M. truncatula and M. sativa (Figure 4a,b). The NF-YB genes of M. truncatula were widely distributed on chr1 with seven members, followed by chr4 with five members (Figure 4a). Notably, chr6 had no NF-YB (Figure 4a). Nine NF-YB genes of M. sativa were also distributed on chr1, and one to six genes were distributed on chr2-6 (Figure 4b).
Tandem duplication, segmental duplication, and whole-genome duplication are the main impetus for gene family expansion [31]. Two pairs of segmental duplication were found in M. truncatula (MtNF-YB8/MtNF-YB15 and MtNF-YB9/MtNF-YB14) and M. sativa (MsNF-YB4/MsNF-YB11 and MsNF-YB11/MsNF-YB13), respectively (Figure 4a,b and Supplementary file S1). Notably, both segmental duplications in M. sativa were homologous to MsNF-YB11, suggesting that this gene may play a unique function in the evolutionary process. In addition, only one pair of tandem repeat events (MsNF-YB1/MsNF-YB2) was found in M. sativa (Figure 4b and Supplementary file S1), while this event was absent in M. truncatula (Figure 4a).
Furthermore, three comparative syntenic maps of A. thaliana, O. sativa, and M. sativa separately associated with M. truncatula were constructed to illustrate the evolutionary relationship of the NF-YB gene family (Figure 4c). Unsurprisingly, M. truncatula and M. sativa had the most collinear gene pairs, with 24 pairs, while M. truncatula and O. sativa had the least number of collinear gene pairs, with only four pairs. Moreover, M. truncatula and the representative plant species Arabidopsis had eight collinear gene pairs (Supplementary file S1). Notably, MtNF-YB8 and MtNF-YB19 had synteny relationships with each of the other three species, which may play a special role in the growth and development of M. truncatula.
Over the course of evolutionary history, duplicated genes have three potential evolutionary fates: non-functionalization, neo-functionalization, and sub-functionalization [32]. In comparing the non-synonymous (Ka) and synonymous substitution (Ks) rates of substitution (Ka/Ks), one could infer the magnitude of selective constraint and positive selection. Generally, Ka/Ks > 1, Ka/Ks = 1, and Ka/Ks < 1 indicate positive selection, neutral evolution, and purifying selection, respectively [33]. In the present study, the Ka, Ks, and Ka/Ks of NF-YB homologous gene pairs were estimated in Medicago (Supplementary file S1). This showed that the MsNF-YB1/MtNF-YB2 homologous gene pairs had Ka/Ks ratios of 1.821, indicating a high degree of positive selection. In sharp contrast to this gene pair, we found that the Ka/Ks ratios of other NF-YB gene homologous pairs were less than 0.5, and that the ratios of another five homologous pairs were even smaller than 0.1, suggesting that NF-YB genes have undergone purifying selection after segmental and whole-genome duplications.

2.6. Analysis of Cis-Elements in the Promoter Sequences of NF-YB Genes in Medicago

The cis-acting element is important for the binding of transcription factors to control the expression of their target genes. In this study, we focused on hormones and abiotic stress related cis-acting elements, including auxin-responsive (AuxRE-core), gibberellin-responsive (GARE-motif, P-box, TATC-box), MeJA-responsive (TGACG-motif, CGTCA-motif), abscisic acid–responsive (ABRE), ethylene-responsive (ERE), salicylic acid–responsive (TCA-element), defense- and stress-responsive (TC-rich repeats, W-box), wound-responsive (WUN motif), MYB binding site involved in drought-inducibility (MBS), low temperature–responsive (LTR), anaerobic induction (ARE) and metabolic-responsive (CCAAT-box) (Figure 5 and Supplementary file S2).
Overall, the promoters of NF-YB genes contained various cis-acting elements with different numbers. In particular, almost all NF-YB genes contain a high number of ARE elements (p < 0.05 for 11 of them with Fisher’s exact test), and they may play a crucial role in anaerobic induction response in roots of Medicago. Methyl jasmonate (MeJA), as a wounding-related phytohormone, is able to stimulate the expression of defense-like genes [34]. Interestingly, NF-YB genes with relatively more MeJA-responsive elements were grouped in cluster B (Figure 5b,c), with 12 in MsNF-YB18 (p < 0.01 with Fisher’s exact test), indicating that NF-YB genes in this cluster play a specific role in resistance against wounding stress. It is generally known that three cis-elements, ABRE, MBS, and W-box, are related with responsiveness to drought-induced signaling and regulation of downstream gene expression [35]. Our results showed that many NF-YB genes contained more ABRE and W-box elements (p < 0.05 for nearly half of them with Fisher’s exact test), while MBS elements were grouped in C and D, indicating that the NF-YB family gene plays a role in drought resistance in Medicago. Notably, the NF-Y family protein binds specifically to the CCAAT cis-acting elements, though it is not widely distributed in the NF-YB family of Medicago (Figure 5b,c).

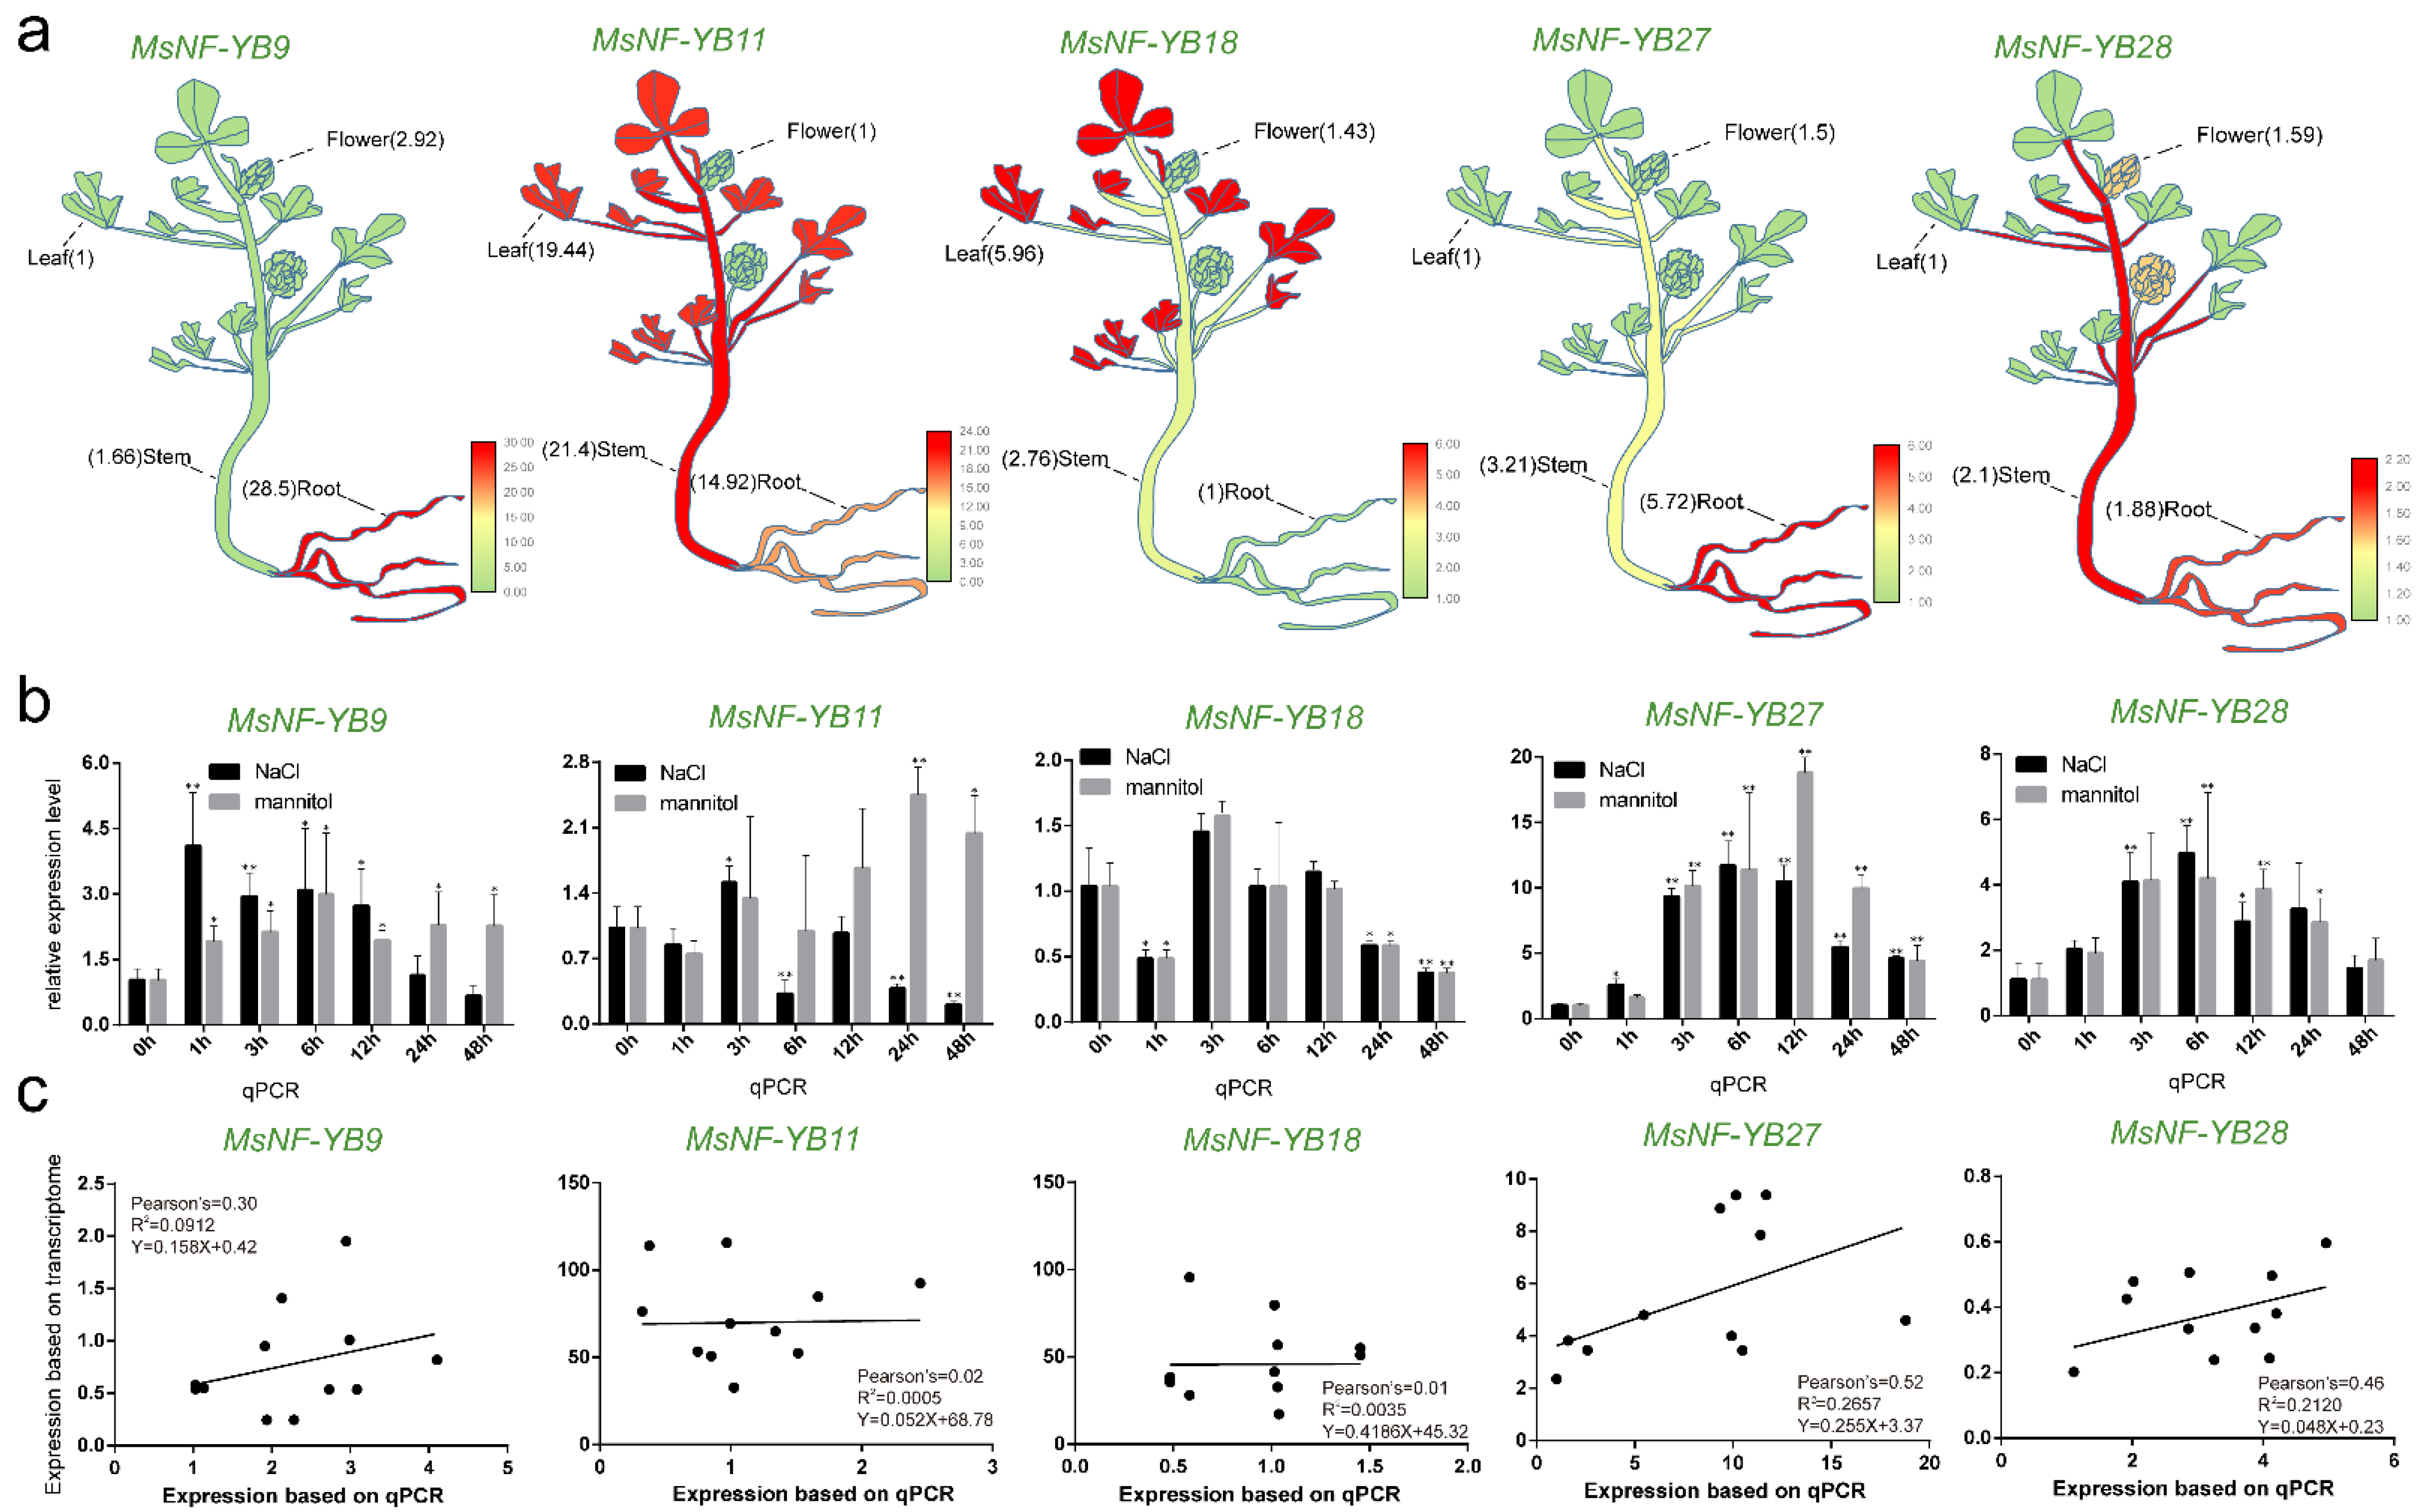
2.7. Expression Patterns of NF-YB Genes in Different Tissues

We investigated the expression patterns of NF-YBs in various tissues of M. truncatula with the genechip dataset from the MtGEA web server, including roots, stems, leaves, flowers, pods, and seeds (Figure 6a). Overall, half (7) of the 14 MtNF-YB genes were expressed at a relatively low level in these tissues, and the other half were expressed at a relatively high level (Figure 6a). Among the lowly expressed seven genes, MtNF-YB16 was highly expressed in seeds, MtNF-YB7 in roots, and MtNF-YB17 in leaves (Figure 6a). Among the highly expressed seven genes, MtNF-YB5 and 11 were lowly expressed in seeds, and MtNF-YB15 and 19 in leaves (Figure 6a).
For M. sativa, gene expression levels in six tissues were analyzed based on transcriptome data, including roots, elongated stems, pre-elongated stems, leaves, flowers, and nodules (Figure 6b). The transcriptome data for MsNF-YBs could be divided into two distinct categories: higher expression genes (from MsNF-YB11 to MsNF-YB6, Figure 6b from top to bottom) and lower expression genes (from MsNF-YB1 to MsNF-YB26, Figure 6b from top to bottom). Compared with other genes, MsNF-YB11 and MsNF-YB22 were highly expressed in all tissues (Figure 6b). Interestingly, the expression of four genes (MsNF-YB10, 8, 19, 26) in nodules was significantly higher than in other tissues or than the remaining MsNF-YB genes, and these genes may play a specific role in nodules.

2.8. Expression Levels of NF-YB Genes in Medicago under Stress

It was reported that NF-YB genes are involved in a number of important processes, such as embryo and seed development, flowering, photosynthesis, and stress responses [36]. Therefore, we also analyzed their expression level with genechip data for M. truncatula, including roots under in vitro culture salinity and hydroponic salinity, as well as roots and shoots under drought treatment. One probe set was selected as representative for each MtNF-YB gene, and 14 out of 21 MtNF-YB genes had their corresponding probe set (Figure 7a and Supplementary file S3).
Meanwhile, transcriptome data of M. sativa for samples from roots under drought and NaCl treatment were also analyzed (Supplementary file S4). Due to extremely low expression of some genes, only 19 MsNF-YB genes were presented in Figure 7f,g. To further screen stress-responsive genes under different stress treatments, the average change folds of each gene under individual treatment (total change folds for all treatments/number of treatments) of MtNF-YB and MsNF-YB genes were calculated (Figure 7, Supplementary files S3 and S4).
In M. truncatula, 11 genes (MtNF-YB13, MtNF-YB6, MtNF-YB19, etc.) and 7 genes (MtNF-YB10, MtNF-YB15, MtNF-YB7, etc.) were highly induced in roots or in shoots under drought treatment, respectively (Figure 7a,b). In contrast, all genes were significantly up-regulated at different levels under NaCl treatment, except MtNF-YB5 and MtNF-YB12 genes, which were down-regulated under hydroponic NaCl treatment (Figure 7c,d). Taken together, as shown in the Venn diagram, ten genes were highly expressed under at least three stress treatments (Figure 7e).
In M. sativa, eleven NF-YB genes (MsNF-YB3, MsNF-YB11, MsNF-YB19, etc.) were highly induced under drought treatment (Figure 7f), and 11 genes (MsNF-YB10, MsNF-YB14, MsNF-YB26, etc.) were highly induced under NaCl treatment with different fold changes (Figure 7g). The Venn diagram showed that 15 genes were highly expressed under both NaCl and drought treatment (Figure 7h).
Homologous genes of 15 NaCl and drought responsive MsNF-YB genes were identified from M. sativa (Figure 7h and Table S3), and they were further compared with the 10 MtNF-YB genes that were screened from Figure 7e. It was revealed that six of them were common genes, as shown in the Venn diagram (Figure 7i and Table S3). Therefore, these six homologous gene pairs from both M. truncatula and M. sativa (MtNF-YB7/MsNF-YB9, MtNF-YB10/MsNF-YB11, MtNF-YB13/MsNF-YB11, MtNF-YB15/MsNF-YB27, MtNF-YB16/MsNF-YB28, and MtNF-YB17/MsNF-YB28) were selected as candidate genes for subsequent investigation.

2.9. Validation of the Expression Profile of Stress-Responsive NF-YB Genes by RT-qPCR

In order to verify the expression profiles of NF-YB genes from genechip for M. truncatula and transcriptome data for M. sativa, RT-qPCR was carried out for the verification of six candidate gene pairs. The expression levels of these above-mentioned six genes in four tissues (roots, stems, leaves, and flowers) were further verified by RT-qPCR, with their lowest expression as a control, as shown in the model figure (Figure 8a and Supplementary file S5). Notably, the expression profile of almost all of these genes was consistent with genechip data (Figure 6a and Figure 8a); for example, MtNF-YB7, MtNF-YB10, and MtNF-YB17 showed the highest expression in roots, leaves, and leaves, respectively. As an exception, MtNF-YB16 was expressed with a significantly higher level in flowers than in other tissues, whereas it was expressed at a similar level to the genechip data in the four tissues (Figure 6a and Figure 8a).
Moreover, seedlings were treated with NaCl or mannitol at 1 h, 3 h, 6 h, 12 h, 24 h, 48 h and used for RT-qPCR analysis. RT-qPCR showed that MtNF-YB7 and MtNF-YB15 were highly induced by both NaCl and mannitol treatment from 3 h to 48 h (Figure 8b and Supplementary file S5). The expression level of MtNF-YB10 was induced by mannitol at 6 h and 12 h, and MtNF-YB13 at 1 h, 3 h, 6 h, 12 h, and 24 h, though the fold change was not more than 2.5-fold (Figure 8b). The expression level of MtNF-YB16 was induced by more than 15-fold and 50-fold at 1 h and 48 h by NaCl treatment (Figure 8b). However, the expression of MtNF-YB17 appeared to be repressed by both treatments, except for a slight increase by the mannitol treatment at 3 h (Figure 8b).
For M. sativa, the expression levels detected by RT-qPCR for MsNF-YB9, 11, and 28 were relatively consistent with the transcriptome data (Figure 6a and Figure 9b): the expression level of MsNF-YB9 was significantly higher in roots than in the other three tissues; MsNF-YB11 was expressed at a relatively high level in all four tissues (Figure 9a and Supplementary file S5). Unlike transcriptome data, RT-qPCR data showed that MsNF-YB18 had a significantly higher expression level in leaves than in other tissues. Meanwhile, RT-qPCR data showed that MsNF-YB27 was significantly expressed in roots, while transcriptome data showed its expression was the highest in pre-elongated stems (Figure 9a). Since the treatment timepoints for RT-qPCRs were the same as for the transcriptome data, we compared the transcriptome data and RT-qPCR data with the correlation analysis. RT-qPCR data showed that MsNF-YB9, 27, and 28 showed a significant increase in gene expression under both NaCl and mannitol treatment (Figure 9b and Supplementary file S5), which was the same as for transcriptome data, and they were positively correlated (Figure 9c). Notably, MsNF-YB9/MtNF-YB7, MsNF-YB27/MtNF-YB15, and MsNF-YB28/MtNF-YB16 were homologous gene pairs, and their expression was consistent under the two stress treatments, indicating that these genes play the same role in M. truncatula and M. sativa. Moreover, the expression level of MsNF-YB11 was transiently elevated under NaCl treatment and then reduced greatly, which was inconsistent with its significant elevation as shown by the transcriptome data. The expression of MsNF-YB18 detected by RT-qPCR was consistent with the changes of the transcriptome data (Figure 9c).

3. Discussion

Previous studies have demonstrated that NF-YB proteins play an important role in plant resistance to abiotic stresses [13]. The function of NF-YB in abiotic resistance was previously analyzed in several plant species, including A. thaliana, rice, wheat, tung tree, soybean, canola, grape, and tomato [9]. However, a genome-wide identification and characterization of NF-YB genes in Medicago is still lacking. In the present study, we conducted an integrated investigation on the NF-YBs, and a total of 21 NF-YB members from M. truncatula and 28 NF-YB members from M. sativa were identified.
Multiple sequence alignment confirmed that almost all M. truncatula and M. sativa NF-YB members contained DNA binding as well as NF-YA interaction and NF-YC interaction domains (Figure 1), and they shared highly conserved amino acid length, which was consistent with model plants such as rice [37]. Phylogenetic analysis indicated that they are highly homologous to NF-YB proteins from Arabidopsis (Figure 2), but one particular sub-cluster E was only presented in Medicago, which may play a special role in evolution. The same sub-clusters are more closely related, and the type and position of their patterns are similar (Figure 2 and Figure 3). These findings suggest that these motifs may be involved in the functional diversity of NF-YB proteins. In analyzing gene structure, we found that many NF-YB genes in Medicago had only one exon and no introns (Figure 3), which is consistent with the findings for Arabidopsis and Brassica napus. [30]. Previous studies have postulated that an intron-rich gene would lose multiple introns simultaneously by retrotransposition, thereby producing intron-less ancestral genes [38]. Thus, several NF-YB genes in Medicago may experience the loss of multiple introns during gene family diversification. Genome-wide analyses have shown that the loss and gain of introns were extensive during the process of eukaryotic diversification.
Duplication and divergence play a critical role in the expansion and evolution of gene families [39]. We found two segmental duplications (MtNF-YB8/MtNF-YB15, MtNF-YB9/MtNF-YB14) among 21 MtNF-YB genes (Figure 4), while two segmental duplication events (MsNF-YB4/MsNF-YB11/MsNF-YB15) among 28 MsNF-YBs were found in M. sativa. The gain and loss of genes or the expansion or contraction of gene families is common following polyploidization [40]. Unlike M. truncatula, M. sativa has tandem duplicated gene pairs (MsNF-YB1/MsNF-YB2). Thus, the expansion of the MsNF-YB gene family could be an indication that MsNF-YB genes play roles in additional biological processes or have novel functions. Previous studies have demonstrated that NF-YB plays an important role in drought resistance [13]. In our studies, ARE (anaerobic induction), TGACG-motif (MeJA-responsive), and ABRE (abscisic acid-responsive) elements were found widely distributed in NF-YB genes, and all of these elements were involved in response to drought stress, suggesting that the NF-YBs of Medicago are increased in response to drought stress.
High-salinity or drought soil is the most serious abiotic stress [41]. It is urgent to improve the salinity and drought tolerance of alfalfa to increase yield. Genechip data and transcriptome data under NaCl and drought treatments, along with expression profiles in various tissues, suggested that the expressions of six homologous gene pairs were highly induced or drastically changed in Medicago (Figure 6 and Figure 7). Previous studies have reported that NF-YB genes are also involved in plant developmental processes, including embryogenesis, flowering time, etc. [42]. In the present study, we identified the tissue-specific expression patterns of six NF-YB genes in Medicago in a variety of tissues, and the results showed that NF-YB genes were expressed ubiquitously, with the exception of a few genes that are expressed in specific tissues: MtNF-YB16 is specifically expressed in flowers (Figure 8a), and MsNF-YB9 in roots (Figure 9a). This observation was consistent with previous studies for NF-YB genes in rice [43], suggesting that NF-YB genes are multifunctional and are involved in a wide range of biological processes [44]. Subsequently, the expression pattern of all six genes was verified under NaCl and mannitol treatments in M. truncatula and M. sativa by RT-qPCR analyses (Figure 8b and Figure 9b), and the results suggested that several genes are involved in NaCl and/or mannitol induction. Correspondingly, three gene pairs (MsNF-YB9/MtNF-YB7, MsNF-YB27/MtNF-YB15, and MsNF-YB28/MtNF-YB16) were significantly up-regulated under NaCl and mannitol treatments, and their expression patterns were the same in M. truncatula and M. sativa. This evidence indicated that these genes are likely key genes in response to abiotic stress.
In the phylogenetic analysis, NF-YB genes were divided into five branches in addition to the E branch, which includes Arabidopsis-specific NF-YB genes. Among them, NF-YB1, NF-YB2, NF-YB3, NF-YB6, and NF-YB9 have been extensively studied in Arabidopsis. Previous studies have shown that NF-YB1 not only regulates drought resistance but also interacts with CO (CONSTANS) to affect the transcript levels of two key integrators (FT and SOC1) in the flowering pathway, therefore adjusting flowering time [45]. Interestingly, MtNF-YB18 clustered with AtNF-YB1, indicating that it may have similar functions as AtNF-YB1. Moreover, MsNF-YB2, 27 and MtNF-YB11, 15 were observed to cluster with AtNF-YB2 (Figure 2), which has been reported to regulate the photoperiod-dependent flowering time [46]. However, in our study, the homologous gene pair MtGRF15/MsGRF27 showed significant high expression under both salt and mannitol treatments (Figure 8b and Figure 9b), suggesting that this gene pair may also play a role in coping with abiotic stresses.
In Arabidopsis, LEAFY COTYLEDON1 (LEC1) is a central regulator that controls many different aspects of embryo development. Early in embryogenesis, LEC1 is required to maintain the fate of embryonic cells that constitute the suspensor and to specify the identity of cotyledons, the embryonic leaves [47]. While previous studies have shown that NF-YB proteins of Arabidopsis can be divided into two classes, LEC1-like (LEC1 or AtNF-YB9; LEC1-LIKE or AtNF-YB6) and non-LEC1-like. NF-YB9/LEC1 was the first NF-YB gene identified and studied in A. thaliana and has been shown to be required for the embryonic maintenance of cell fate, where the ectopic expression of NF-YB9 can induce somatic embryos from vegetative cells [16]. In addition, NF-YB9 has also been shown to play an essential role in embryogenesis and seed maturation [48]. LEC1 and LEC1-LIKE (NF-YB6) regulated embryo development by activating the expression of genes required for embryogenesis and cellular differentiation [16]. In the present study, MsNF-YB28 was grouped with AtNF-YB9, while MtNF-YB16 was grouped with AtNF-YB6 (Figure 2), suggesting they may share similar functions.
Furthermore, the homologous gene pairs (MtNF-YB16/MsNF-YB28) were all highly expressed under NaCl and mannitol treatment as evidenced by RT-qPCR (Figure 8b and Figure 9b). Thus, the homologous pairs may be involved in regulating embryonic development, as well as in response to abiotic stress. Therefore, these two candidate homologous genes (MtGRF15/MsGRF27 and MtNF-YB16/MsNF-YB28) were considered as key candidates for in-depth study of NF-YB genes in Medicago.

4. Materials and Methods

4.1. Identification of NF-YB Family Members in Medicago

Based on the genome database, the sequence of NF-YB genes of M. truncatula and M. sativa were downloaded from the genome websites https://figshare.com/articles/dataset/Medicago_sativa_genome_and_annotation_files/12623960 (accessed on 1 September 2021) and https://www.jcvi.org/research/medicago-truncatula-genome-database (accessed on 1 January 2020), respectively. Moreover, the NFYB (PF00808) model profiles downloaded from Pfam (https://pfam.xfam.org/) were employed to identify putative NF-Y genes from M. truncatula and M. sativa. A further BLASTP search with an E-value cutoff of e−10 was performed to sort NF-Y family members using the AtNF-YB [2] and OsNF-YB [37] amino acid sequences as queries, which were retrieved from TAIR (http://www.arabidopsis.org) (accessed on 11 September 2020) and RICEDATA (http://www.ricedata.cn/gene) (accessed on 11 September 2020), respectively. In order to ensure the correctness of the selected genes, output putative NF-YB protein sequences were submitted to InterProScan (https://www.ebi.ac.uk/interpro/search/sequence-search) (accessed on 12 September 2020), CDD (https://www.ncbi.nlm.nih.gov/Structure/bwrpsb/bwrpsb.cgi) (accessed on 12 September 2020), Pfam (https://pfam.xfam.org/) (accessed on 13 September 2020), and SMART (http://smart.embl-heidelberg.de/) (accessed on 13 September 2020). Finally, 21 MtNF-YB and 28 MsNF-YB genes were identified, and they were assigned based on their locations on chromosomes. Correspondingly, the molecular weight (MW) and isoelectric point (pI) of the deduced amino acid sequences were predicted with the Expert Protein Analysis System (ExPASy) on the proteomics server (http://www.expasy.ch/tools/protparam.html) (accessed on 15 September 2020). The subcellular localization was predicted using the Softberry Home Page (http://www.softberry.com/) (accessed on 16 September 2020).

4.2. Analyses of Sequence, Conserved Motif, and Structural Characterization

To exhibit the structural divergence of NF-YB proteins, the conserved motifs were performed with Multiple Em for Motif Elicitation (MEME) 5.0.2 online program (https://meme-suite.org/meme/tools/meme) (accessed on 25 September 2020) [49]. The following parameters were employed: the maximum number of motifs was 20, minimum motif width was 10 (aa), and maximum motif width was 200 (aa). Subsequently, sequence alignment analysis of NF-YB protein sequences was carried out using jalview (https://issues.jalview.org/secure/Dashboard.jspa) (accessed on 25 September 2020). The visualization of exon–intron positions and conserved motifs was performed through TBtools software (Guangzhou, China) [50].

4.3. Analyses of Phylogenetic Relationship

NF-YB proteins from five plant species (M. truncatula, M. sativa, A. thaliana, and O. sativa) were used in a multiple alignment in ClustalW [51]. Phylogenetic trees were constructed by the neighbor-joining method using the program MEGA-X with a bootstrap of 1000 replicates. Meanwhile, subfamily clustering on the phylogenetic tree was determined based on Arabidopsis member clustering. Subsequently, EvolView (https://evolgenius.info/evolview-v2/) (accessed on 29 September 2020) was used to view the phylogenetic tree.

4.4. Analysis of Chromosome Locations and Collinearity

The loci of NF-YB genes were obtained from the genome annotation data. TBtools was applied to map the chromosome locations for each gene. Next, these sequences were analyzed to identify collinearity blocks against the whole genome using MCSCAN [52]. Moreover, the intraspecific synteny relationship (M. truncatula and M. sativa) and interspecific synteny relationship (M. truncatula, M. sativa, A. thaliana, and O. sativa) were analyzed, and they were mapped to the chromosomes of M. truncatula and M. sativa using TBtools, respectively. Lastly, the synonymous (Ks) and nonsynonymous (Ka) substitution rates were estimated using TBtools [53].

4.5. Identification of Stress-Response Cis-Elements of the NF-YB Promoter

The promoter sequences (length, 2 kb) of NF-YBs were collected by TBtools, and the cis-elements in the promoters were predicted using PlantCARE (http://bioinformatics.psb.ugent.be/webtools/plantcare/html/) (accessed on 2 October 2020). The visualized models of cis-elements in the promoters were made with TBtools [54].

4.6. Analysis of Gene Expression Profile

Genechip data from roots and shoots and those under drought and salt stress conditions for MtNF-YB genes were downloaded from the M. truncatula Gene Expression Atlas. The expression levels of MtNF-YB genes in different tissues were also analyzed. Amazing HeatMap software was used to generate the heatmap [50]. The original transcriptome data from M. sativa under NaCl and mannitol treatments at 0 h, 1 h, 3 h, 6 h, 12 h, and 24 h (SRR7160314-15, 22-23, 25-49, 51-52, 56-57) were downloaded from the NCBI database [55]. Then, the data were converted to fastq files using the SRA-Toolkit v2.9 [56]. Raw reads were trimmed using Trimmomatic-0.39 [57]. Gene expression level was determined by mapping cleaned reads to the corresponding alfalfa reference genomes using the StringTie v2.1.3 package and the log2(FPKM) values [58].

4.7. Plant Materials and Treatments

M. truncatula (cv. Jemalong A17) and M. sativa (cv. Zhongmu No.1) plants used in this study were stored at the Institute of Animal Sciences of the Chinese Academy of Agricultural Sciences, Beijng, China. Roots, stems, leaves, and flowers of mature M. truncatula and M. sativa plants were collected separately for RNA extraction and RT-qPCR analysis. To investigate the expression pattern of NF-YB genes in response to NaCl and mannitol stress, seeds were germinated and transferred into the MS liquid medium (MS basal salts supplemented with 30 g/L sucrose), then kept in a growth chamber at 25 °C under a photoperiod using a 16/8 light/dark regime. When the third leaf was fully expanded, seedlings were transferred to fresh MS liquid medium supplied with 300 mM NaCl and 15% mannitol, respectively, and the whole plants were collected at 0 h, 1 h, 3 h, 6 h, 12 h, 24 h, and 48 h for each treatment, and plants without treatment were used as controls. The samples were frozen in liquid nitrogen and stored at −80 °C for subsequent analysis.

4.8. Gene Expression Analyses by RT-qPCR

Total RNAs were extracted using Eastep® Super total RNA Extraction kit (Promega, Shanghai, China) according to the manufacturer’s instructions. First-strand cDNA synthesis was performed using Trans® Script One-Step gDNA Removal and cDNA Synthesis SuperMix (TransGen Biotech, Beijing, China) per the manufacturer’s recommendations. RT-qPCRs were performed with a 2’RealStar Green Fast Mixture (GeneStar, Shanghai, China) on an ABI Q7 QuantStudioTM Real-Time PCR Detection System (Applied Biosystems, CA, USA). PCRs were performed with the following program: 94 °C for 30 s, followed by 40 cycles of 94 °C for 5 s and 60 °C for 34 s. Melting curve analysis was performed using ABI Q7 QuantStudioTM Real-Time PCR Software with the RT-qPCR data. The transcript levels of each gene were determined by relative quantification using the 2-ΔΔCt method and normalized with the actin gene as a reference. Data are the average of three independent biological samples ± SE, and vertical bars indicate standard deviation. Student’s t test was used to compare the difference between two treatments (n = 3, * p < 0.05, ** p < 0.01) [59]. The primer sequences used in this study are shown in Table S1.

Supplementary Materials

The following are available online at https://www.mdpi.com/article/10.3390/ijms23136906/s1.

Author Contributions

Conceptualization, W.D. and Y.P.; methodology, W.D. and Q.L.; software, W.D. and J.Y.; validation, W.D., C.H. and Q.L.; formal analysis, W.D.; investigation, W.D.; resources, Y.P.; data curation, W.D.; writing—original draft preparation, W.D.; writing—review and editing, Y.P.; visualization, W.D.; supervision, Y.P.; project administration, Y.P.; funding acquisition, Y.P. All authors have read and agreed to the published version of the manuscript.

Funding

This project was supported by the Key Projects in Science and Technology of Inner Mongolia (2021ZD0031), the National Nature Science Foundation of China (U1906201 and 31901386), and Fundamental Research Funds for Central Non-profit Scientific Institution (2021XC11). The funding body played no role in the design of the study, analysis and interpretation of data, and in writing the manuscript.

Institutional Review Board Statement

Not applicable.

Informed Consent Statement

Not applicable.

Data Availability Statement

All data in the present study are available in the public database as referred in the Material and Method part.

Conflicts of Interest

The authors declare that they have no known competing financial interests or personal relationships that could have appeared to influence the work reported in this paper.

References

  1. Edwards, D.D.; Murray, J.A.; Smith, A.G. Multiple genes encoding the conserved CCAAT-box transcription factor complex are expressed in Arabidopsis. Plant Physiol. 1998, 117, 1015–1022. [Google Scholar] [CrossRef] [PubMed] [Green Version]
  2. Siefers, N.; Dang, K.K.; Kumimoto, R.W.; Bynum, W.E.; Tayrose, G.; Holt, B.F. Tissue-specific expression patterns of Arabidopsis NF-Y transcription factors suggest potential for extensive combinatorial complexity. Plant Physiol. 2009, 149, 625–641. [Google Scholar] [CrossRef] [PubMed] [Green Version]
  3. Myers, Z.A.; Holt, B.F. NUCLEAR FACTOR-Y: Still complex after all these years? Curr. Opin. Plant Biol. 2018, 45, 96–102. [Google Scholar] [CrossRef] [PubMed]
  4. Romier, C.; Cocchiarella, F.; Mantovani, R.; Moras, D. The NF-YB/NF-YC structure gives insight into DNA binding and transcription regulation by CCAAT factor NF-Y. J. Biol. Chem. 2003, 278, 1336–1345. [Google Scholar] [CrossRef] [PubMed] [Green Version]
  5. Nardone, V.; Chaves-Sanjuan, A.; Nardini, M. Structural determinants for NF-Y/DNA interaction at the CCAAT box. Biochim. Biophys. Acta Gene Regul. Mech. 2017, 1860, 571–580. [Google Scholar] [CrossRef] [Green Version]
  6. Laloum, T.; De Mita, S.; Gamas, P.; Baudin, M.; Niebel, A. CCAAT-box binding transcription factors in plants: Y so many? Trends Plant Sci. 2013, 18, 157–166. [Google Scholar] [CrossRef]
  7. Mei, X.P.; Liu, C.X.; Yu, T.T.; Liu, X.L.; Xu, D.; Wang, J.Q.; Wang, G.Q.; Cai, Y.L. Identification and characterization of paternal-preferentially expressed gene NF-YC8 in maize endosperm. Mol. Genet. Genom. 2015, 290, 1819–1831. [Google Scholar] [CrossRef]
  8. Junker, A.; Monke, G.; Rutten, T.; Keilwagen, J.; Seifert, M.; Thi, T.M.; Renou, J.P.; Balzergue, S.; Viehover, P.; Hahnel, U.; et al. Elongation-related functions of LEAFY COTYLEDON1 during the development of Arabidopsis thaliana. Plant J. 2012, 71, 427–442. [Google Scholar] [CrossRef] [Green Version]
  9. Stephenson, T.J.; McIntyre, C.L.; Collet, C.; Xue, G.P. Genome-wide identification and expression analysis of the NF-Y family of transcription factors in Triticum aestivum. Plant Mol. Biol. 2007, 65, 77–92. [Google Scholar] [CrossRef] [Green Version]
  10. Combier, J.P.; Frugier, F.; de Billy, F.; Boualem, A.; El-Yahyaoui, F.; Moreau, S.; Vernie, T.; Ott, T.; Gamas, P.; Crespi, M.; et al. MtHAP2-1 is a key transcriptional regulator of symbiotic nodule development regulated by microRNA169 in Medicago truncatula. Genes Dev. 2006, 20, 3084–3088. [Google Scholar] [CrossRef] [Green Version]
  11. Cai, X.; Ballif, J.; Endo, S.; Davis, E.; Liang, M.; Chen, D.; DeWald, D.; Kreps, J.; Zhu, T.; Wu, Y. A putative CCAAT-binding transcription factor is a regulator of flowering timing in Arabidopsis. Plant Physiol. 2007, 145, 98–105. [Google Scholar] [CrossRef] [PubMed] [Green Version]
  12. Kumimoto, R.W.; Zhang, Y.; Siefers, N.; Holt, B.F. NF-YC3, NF-YC4 and NF-YC9 are required for CONSTANS-mediated, photoperiod-dependent flowering in Arabidopsis thaliana. Plant J. 2010, 63, 379–391. [Google Scholar] [CrossRef] [PubMed]
  13. Nelson, D.E.; Repetti, P.P.; Adams, T.R.; Creelman, R.A.; Wu, J.; Warner, D.C.; Anstrom, D.C.; Bensen, R.J.; Castiglioni, P.P.; Donnarummo, M.G.; et al. Plant nuclear factor Y (NF-Y) B subunits confer drought tolerance and lead to improved corn yields on water-limited acres. Proc. Natl. Acad. Sci. USA 2007, 104, 16450–16455. [Google Scholar] [CrossRef] [PubMed] [Green Version]
  14. Warpeha, K.M.; Upadhyay, S.; Yeh, J.; Adamiak, J.; Hawkins, S.I.; Lapik, Y.R.; Anderson, M.B.; Kaufman, L.S. The GCR1, GPA1, PRN1, NF-Y signal chain mediates both blue light and abscisic acid responses in Arabidopsis. Plant Physiol. 2007, 143, 1590–1600. [Google Scholar] [CrossRef] [Green Version]
  15. Ballif, J.; Endo, S.; Kotani, M.; MacAdam, J.; Wu, Y. Over-expression of HAP3b enhances primary root elongation in Arabidopsis. Plant Physiol. Biochem. 2011, 49, 579–583. [Google Scholar] [CrossRef]
  16. Lotan, T.; Ohto, M.; Yee, K.M.; West, M.A.; Lo, R.; Kwong, R.W.; Yamagishi, K.; Fischer, R.L.; Goldberg, R.B.; Harada, J.J. Arabidopsis LEAFY COTYLEDON1 is sufficient to induce embryo development in vegetative cells. Cell 1998, 93, 1195–1205. [Google Scholar] [CrossRef] [Green Version]
  17. Han, X.; Tang, S.; An, Y.; Zheng, D.C.; Xia, X.L.; Yin, W.L. Overexpression of the poplar NF-YB7 transcription factor confers drought tolerance and improves water-use efficiency in Arabidopsis. J. Exp. Bot. 2013, 64, 4589–4601. [Google Scholar] [CrossRef] [Green Version]
  18. Feng, Z.J.; He, G.H.; Zheng, W.J.; Lu, P.P.; Chen, M.; Gong, Y.M.; Ma, Y.Z.; Xu, Z.S. Foxtail millet NF-Y families: Genome-wide survey and evolution analyses identified two functional genes important in abiotic stresses. Front. Plant Sci. 2015, 6, 1142. [Google Scholar] [CrossRef] [Green Version]
  19. Wang, B.; Li, Z.; Ran, Q.; Li, P.; Peng, Z.; Zhang, J. ZmNF-YB16 overexpression improves drought resistance and yield by enhancing photosynthesis and the antioxidant capacity of maize plants. Front. Plant Sci. 2018, 9, 709. [Google Scholar] [CrossRef] [PubMed] [Green Version]
  20. Shen, C.; Du, H.; Chen, Z.; Lu, H.; Zhu, F.; Chen, H.; Meng, X.; Liu, Q.; Liu, P.; Zheng, L.; et al. The Chromosome-Level Genome Sequence of the Autotetraploid Alfalfa and Resequencing of Core Germplasms Provide Genomic Resources for Alfalfa Research. Mol. Plant 2020, 13, 1250–1261. [Google Scholar] [CrossRef] [PubMed]
  21. Dai, H.P.; Shan, C.J.; Zhao, H.; Li, J.C.; Jia, G.L.; Jiang, H.; Wu, S.Q.; Wang, Q. The difference in antioxidant capacity of four alfalfa cultivars in response to Zn. Ecotoxicol. Environ. Saf. 2015, 114, 312–317. [Google Scholar] [CrossRef] [PubMed]
  22. Chen, L.; Beiyuan, J.; Hu, W.; Zhang, Z.; Duan, C.; Cui, Q.; Zhu, X.; He, H.; Huang, X.; Fang, L. Phytoremediation of potentially toxic elements (PTEs) contaminated soils using alfalfa (Medicago sativa L.): A comprehensive review. Chemosphere 2022, 293, 133577. [Google Scholar] [CrossRef] [PubMed]
  23. Xia, Y.; Yang, J.; Ma, L.; Yan, S.; Pang, Y. Genome-Wide Identification and Analyses of Drought/Salt-Responsive Cytochrome P450 Genes in Medicago truncatula. Int. J. Mol. Sci. 2021, 22, 9957. [Google Scholar] [CrossRef] [PubMed]
  24. Li, Z.; Gao, Z.; Li, R.; Xu, Y.; Kong, Y.; Zhou, G.; Meng, C.; Hu, R. Genome-wide identification and expression profiling of HD-ZIP gene family in Medicago truncatula. Genomics 2020, 112, 3624–3635. [Google Scholar] [CrossRef]
  25. Yang, Y.; Qi, L.; Nian, L.; Zhu, X.; Yi, X.; Jiyu, Z.; Qiu, J. Genome-Wide Identification and Expression Analysis of the SRS Gene Family in Medicago sativa. DNA Cell Biol. 2021, 40, 1539–1553. [Google Scholar] [CrossRef]
  26. Zhao, Y.; Zhang, J.; Sun, Z.; Tang, Y.; Wu, Y. Genome-Wide Identification and Analysis of the Polycomb Group Family in Medicago truncatula. Int. J. Mol. Sci. 2021, 22, 7537. [Google Scholar] [CrossRef]
  27. Fan, J.; Zhang, X.; Nie, X.; Li, H.; Yuan, S.; Dai, B.; Zhan, J.; Wen, Z.; Jiang, J.; Chen, C.; et al. Nuclear miR-665 aggravates heart failure via suppressing phosphatase and tensin homolog transcription. Sci. China Life Sci. 2020, 63, 724–736. [Google Scholar] [CrossRef]
  28. Wu, P.H.; Isaji, M.; Carthew, R.W. Functionally diverse microRNA effector complexes are regulated by extracellular signaling. Mol. Cell 2013, 52, 113–123. [Google Scholar] [CrossRef] [Green Version]
  29. Maity, S.N.; Crombrugghe, B. Biochemical analysis of the B subunit of the heteromeric CCAAT-binding factor. J. Biol. Chem. 1992, 267, 8286–8292. [Google Scholar] [CrossRef]
  30. Liang, M.; Yin, X.; Lin, Z.; Zheng, Q.; Liu, G.; Zhao, G. Identification and characterization of NF-Y transcription factor families in Canola (Brassica napus L.). Planta 2014, 239, 107–126. [Google Scholar] [CrossRef]
  31. Xu, G.; Guo, C.; Shan, H.; Kong, H. Divergence of duplicate genes in exon-intron structure. Proc. Natl. Acad. Sci. USA 2012, 109, 1187–1192. [Google Scholar] [CrossRef] [PubMed] [Green Version]
  32. Lynch, M.; Conery, J.S. The evolutionary fate and consequences of duplicate genes. Science 2000, 290, 1151–1155. [Google Scholar] [CrossRef] [PubMed] [Green Version]
  33. Zhang, Z.; Li, J.; Zhao, X.Q.; Wang, J.; Wong, G.K.; Yu, J. KaKs_calculator: Calculating Ka and Ks through model selection and model averaging. Genom. Proteom. Bioinform. 2006, 4, 259–263. [Google Scholar] [CrossRef] [Green Version]
  34. Bertini, L.; Palazzi, L.; Proietti, S.; Pollastri, S.; Arrigoni, G.; Polverino de Laureto, P.; Caruso, C. Proteomic analysis of meJa-induced defense responses in rice against wounding. Int. J. Mol. Sci. 2019, 20, 2525. [Google Scholar] [CrossRef] [Green Version]
  35. Lee, S.C.; Kim, S.Y.; Kim, S.R. Drought inducible OsDhn1 promoter is activated by OsDREB1A and OsDREB1D. J. Plant Biol. 2013, 56, 115–121. [Google Scholar] [CrossRef]
  36. Zanetti, M.E.; Ripodas, C.; Niebel, A. Plant NF-Y transcription factors: Key players in plant-microbe interactions, root development and adaptation to stress. Biochim. Biophys. Acta Gene Regul. Mech. 2017, 1860, 645–654. [Google Scholar] [CrossRef]
  37. Yang, W.; Lu, Z.; Xiong, Y.; Yao, J. Genome-wide identification and co-expression network analysis of the OsNF-Y gene family in rice. Crop J. 2017, 5, 21–31. [Google Scholar] [CrossRef] [Green Version]
  38. Xie, Z.; Li, X.; Glover, B.J.; Bai, S.; Rao, G.Y.; Luo, J.; Yang, J. Duplication and functional diversification of HAP3 genes leading to the origin of the seed-developmental regulatory gene, LEAFY COTYLEDON1 (LEC1), in nonseed plant genomes. Mol. Biol. Evol. 2008, 25, 1581–1592. [Google Scholar] [CrossRef]
  39. Hughes, A.L. The evolution of functionally novel proteins after gene duplication. Proc. Biol. Sci. 1994, 256, 119–124. [Google Scholar]
  40. Van de Peer, Y.; Fawcett, J.A.; Proost, S.; Sterck, L.; Vandepoele, K. The flowering world: A tale of duplications. Trends Plant Sci. 2009, 14, 680–688. [Google Scholar] [CrossRef]
  41. Shannon, M.C.; Rhoades, J.D.; Draper, J.H.; Scardaci, S.C.; Spyres, M.D. Assessment of Salt Tolerance in Rice Cultivars in Response to Salinity Problems in California. Crop Ecol. Prod. Manag. 1998, 38, 394–398. [Google Scholar] [CrossRef]
  42. Zhao, H.; Wu, D.; Kong, F.; Lin, K.; Zhang, H.; Li, G. The Arabidopsis thaliana Nuclear Factor Y Transcription Factors. Front. Plant Sci. 2016, 7, 2045. [Google Scholar] [CrossRef] [PubMed] [Green Version]
  43. Thirumurugan, T.; Ito, Y.; Kubo, T.; Serizawa, A.; Kurata, N. Identification, characterization and interaction of HAP family genes in rice. Mol. Genet. Genom. 2008, 279, 279–289. [Google Scholar] [CrossRef] [PubMed]
  44. Zimmermann, P.; Hirsch-Hoffmann, M.; Hennig, L.; Gruissem, W. GENEVESTIGATOR. Arabidopsis microarray database and analysis toolbox. Plant Physiol. 2004, 136, 2621–2632. [Google Scholar] [CrossRef] [PubMed] [Green Version]
  45. Cao, S.; Kumimoto, R.W.; Gnesutta, N.; Calogero, A.M.; Mantovani, R.; Holt, B.F. A distal CCAAT/NUCLEAR FACTOR Y complex promotes chromatin looping at the FLOWERING LOCUS T promoter and regulates the timing of flowering in Arabidopsis. Plant Cell 2014, 26, 1009–1017. [Google Scholar] [CrossRef] [Green Version]
  46. Kumimoto, R.W.; Adam, L.; Hymus, G.J.; Repetti, P.P.; Reuber, T.L.; Marion, C.M.; Hempel, F.D.; Ratcliffe, O.J. The Nuclear Factor Y subunits NF-YB2 and NF-YB3 play additive roles in the promotion of flowering by inductive long-day photoperiods in Arabidopsis. Planta 2008, 228, 709–723. [Google Scholar] [CrossRef]
  47. Lee, H.; Fischer, R.; Goldberg, R.; Harada, J. Arabidopsis LEAFY COTYLEDON1 represents a functionally specialized subunit of the CCAAT biinding transcription factor. Proc. Natl. Acad. Sci. USA 2003, 18, 2152–2156. [Google Scholar] [CrossRef] [Green Version]
  48. Huang, M.; Hu, Y.; Liu, X.; Li, Y.; Hou, X. Arabidopsis LEAFY COTYLEDON1 controls cell fate determination during post-embryonic development. Front. Plant Sci. 2015, 6, 955. [Google Scholar] [CrossRef] [Green Version]
  49. Bailey, T.L.; Johnson, J.; Grant, C.E.; Noble, W.S. The MEME Suite. Nucleic Acids Res. 2015, 43, W39–W49. [Google Scholar] [CrossRef] [Green Version]
  50. Chen, C.J.; Chen, H.; Zhang, Y.; Thomas, H.R.; Frank, M.H.; He, Y.H.; Xia, R. TBtools: An integrative toolkit developed for interactive analyses of big biological data. Mol. Plant 2020, 13, 1194–1202. [Google Scholar] [CrossRef]
  51. Kakar, K.U.; Nawaz, Z.; Kakar, K.; Ali, E.; Almoneafy, A.A.; Ullah, R.; Ren, X.L.; Shu, Q.Y. Comprehensive genomic analysis of the CNGC gene family in Brassica oleracea: Novel insights into synteny, structures, and transcript profiles. BMC Genom. 2017, 18, 869. [Google Scholar] [CrossRef] [PubMed] [Green Version]
  52. Yang, Z.; Gong, Q.; Qin, W.; Yang, Z.; Cheng, Y.; Lu, L.; Ge, X.; Zhang, C.; Wu, Z.; Li, F. Genome-wide analysis of WOX genes in upland cotton and their expression pattern under different stresses. BMC Plant Biol. 2017, 17, 113. [Google Scholar] [CrossRef] [PubMed]
  53. Yang, J.F.; Ma, L.; Jiang, W.B.; Yao, Y.; Tang, Y.H.; Pang, Y.Z. Comprehensive identification and characterization of abiotic stress and hormone responsive glycosyl hydrolase family 1 genes in Medicago truncatula. Plant Physiol. Biochem. 2021, 158, 21–33. [Google Scholar] [CrossRef] [PubMed]
  54. Lescot, M.; Déhais, P.; Thijs, G.; Marchal, K.; Moreau, Y.; Van, P.Y.; Rouzé, P.; Rombauts, S. PlantCARE, a database of plant cis-acting regulatory elements and a portal to tools for in silico analysis of promoter sequences. Nucleic Acids Res. 2002, 30, 325–327. [Google Scholar] [CrossRef]
  55. Luo, D.; Zhou, Q.; Wu, Y.; Chai, X.; Liu, W.; Wang, Y.; Yang, Q.; Wang, Z.; Liu, Z. Full-length transcript sequencing and comparative transcriptomic analysis to evaluate the contribution of osmotic and ionic stress components towards salinity tolerance in the roots of cultivated alfalfa (Medicago sativa L.). BMC Plant Biol. 2019, 19, 32. [Google Scholar] [CrossRef] [PubMed] [Green Version]
  56. Kim, T.; Seo, H.D.; Hennighausen, L.; Lee, D.; Kang, K. Octopus-toolkit: A workflow to automate mining of public epigenomic and transcriptomic next-generation sequencing data. Nucleic Acids Res. 2018, 46, e53. [Google Scholar] [CrossRef] [PubMed] [Green Version]
  57. Bolger, A.M.; Lohse, M.; Usadel, B. Trimmomatic: A flexible trimmer for Illumina sequence data. Bioinformatics 2014, 30, 2114–2120. [Google Scholar] [CrossRef] [Green Version]
  58. Pertea, M.; Pertea, G.M.; Antonescu, C.M.; Chang, T.C.; Mendell, J.T.; Salzberg, S.L. StringTie enables improved reconstruction of a transcriptome from RNA-seq reads. Nat. Biotechnol. 2015, 33, 290–295. [Google Scholar] [CrossRef] [Green Version]
  59. Livak, K.J.; Schmittgen, T.D. Analysis of relative gene expression data using real-time quantitative PCR and the 2(-Delta Delta C(T)) Method. Methods 2001, 25, 402–408. [Google Scholar] [CrossRef]
Figure 1. Multiple sequence alignment of MtNF-YBs and MsNF-YBs. The figure only showed partial sequences containing α1, α2, α3, and αC domains. The alignment was constructed by MEGA-X and visualized by Jalview. Residues with more than 50% similarity are shaded. Conserved regions (DNA binding, NF-YA interaction, and NF-YC interaction) are indicated at the top. (a) Multiple sequence alignment of NF-YB from M. truncatula. (b) Multiple sequence alignment of NF-YB from M. sativa.
Ijms 23 06906 g001
Figure 2. Phylogenetic analysis of NF-YB proteins from M. truncatula, M. sativa, Arabidopsis, P. vulgaris, P. sativum, and T. pratense. Full-length protein sequences of NF-YBs were used to construct the tree by using MEGA-X based on the Neighbor-Joining (NJ) method with a bootstrap value of 1000 replicates. Subfamilies are highlighted with different colors. The green solid pentagrams, orange solid pentagrams, hollow circles, violent diamonds, red triangles, and blank squares represent NF-YB proteins from M. truncatula (Mt), M. sativa (Ms), A. thaliana (At), P. vulgaris (Pv), P. sativum (Ps), and T. pretense (Tp), respectively.
Ijms 23 06906 g002
Figure 3. Phylogenetic relationships, motifs, and gene structure of NF-YB genes from M. truncatula and M. sativa (ac). The groups and color of the phylogenetic tree are the same as in Figure 2. The motifs are indicated in different colored boxes with different numbers, and sequence information for each motif is provided in Supplementary Figure S1. Blue boxes indicate 5′- and 3′- untranslated regions; green boxes indicate exons; black lines indicate introns.
Ijms 23 06906 g003
Figure 4. Chromosome distributions of NF-YBs in M. truncatula and M. sativa. The chromosomal location and interchromosomal relationship of M. truncatula (a) and M. sativa (b). The segmentally duplicated and tandem duplicated genes are connected by red curves. (c) Synteny analysis of NF-YB genes between A. thaliana and M. truncatula, O. sativa and M. truncatula, M. sativa and M. truncatula. Gray lines in background indicate the collinear blocks between M. truncatula and A. thaliana/O. sativa/M. sativa, and red lines highlight syntenic NF-YB gene pairs.
Ijms 23 06906 g004
Figure 5. Putative cis-elements and transcription factor binding sites in the promoter regions of NF-YB genes from M. truncatula and M. sativa. (a) The groups and color are as indicated in Figure 2. (b) The color and number of the grid indicate numbers of different cis-acting elements in these NF-YB genes. (c) The colored blocks represent different types of cis-acting elements and their locations in each NF-YB gene.
Ijms 23 06906 g005
Figure 6. Expression profiles of NF-YB genes in different tissues of Medicago. (a) Expression profiles with the log2(FPKM) values of MtNF-YB genes in different tissues retrieved from the genechip dataset. (b) Expression profiles with the log2 (FPKM) values of MsNF-YB genes in different tissues retrieved from transcriptome data. Red represents high expression and blue represents low expression.
Ijms 23 06906 g006
Figure 7. Genechip data of MtNF-YB, transcriptome data of MsNF-YB, and gene expression profiles of different treatments and different times. Each column represents a treatment, each row represents a gene, and each member is normalized in the same column. The relative expression levels are log2-transformed and visualized for heatmap. The color of the circles from blue to red shows the expression level from negative to positive values after normalization. The size of the circles represents the amount of gene expression. The red box indicates genes with increased expression. (a,b) Expression level of MtNF-YB genes in roots (a) or shoots (b) under different drought treatment times. (c,d) Expression levels of MtNF-YB genes in roots under different treatment times for NaCl-culture (c) or NaCl-hydroponic time (d). (e) Venn diagram of gene expression levels of MtNF-YB genes after four different treatments. (f) Expression levels of MsNF-YB genes under different drought treatment time. (g) Expression levels of MsNF-YB genes under NaCl treatment at different time points. (h) Venn diagram of expression levels of MsNF-YB genes after two different treatments. (i) Venn diagram of genes whose expression levels were increased by stress treatment; these genes were selected based on the homolog listed in Table 1.
Ijms 23 06906 g007
Figure 8. Quantification of gene expression levels of selected NF-YB genes from M. truncatula using RT-qPCR. (a) Expression level of MtNF-YB genes in different tissues. (b) Expression level of MtNF-YB genes under NaCl and mannitol stress. Data are average of three independent biological samples ± SE, and vertical bars indicate standard deviation. ** indicates p < 0.01, and * indicates p < 0.05.
Ijms 23 06906 g008
Figure 9. Quantification of gene expression levels of selected NF-YB genes from M. sativa using RT-qPCR. (a) Expression level of MsNF-YB genes in different tissues. (b) Expression level of MsNF-YB genes under NaCl and mannitol stress. Data are average of three independent biological samples ± SE, and vertical bars indicate standard deviation. ** indicates p < 0.01, and * indicates p < 0.05. (c) Correlation analysis of RT-qPCR and transcriptome (NaCl and mannitol) results for MsNF-YB genes. Pearson’s r indicates the Pearson correlation coefficient.
Ijms 23 06906 g009
Table 1. Properties of the predicted NF-YB genes in M. truncatula and M. sativa.
Gene NameTIGR LocusHomologous GenePIMW (kDa)Protein LengthSubcellular LocalizationPlant TFDB
MtNF-YB1MtrunA17Chr1g0158951MsNF-YB44.6412.44112NuclearMedtr1g028480.1
MtNF-YB2MtrunA17Chr1g0159271MsNF-YB15.2811.57108NuclearMedtr1g029070.1
MtNF-YB3MtrunA17Chr1g0159291MsNF-YB24.6610.3691NuclearMedtr1g029100.1
MtNF-YB4MtrunA17Chr1g0165041MsNF-YB45.5921.65191NuclearMedtr1g039040.1
MtNF-YB5MtrunA17Chr1g0185911MsNF-YB65.7519.25175NuclearMedtr1g072790.2
MtNF-YB6MtrunA17Chr1g0191981MsNF-YB76.9014.46128NuclearMedtr1g083070.1
MtNF-YB7MtrunA17Chr1g0195851MsNF-YB95.7222.24195NuclearMedtr1g088860.1
MtNF-YB8MtrunA17Chr2g0290491MsNF-YB105.7817.99167NuclearMedtr2g026710.1
MtNF-YB9MtrunA17Chr2g0296321MsNF-YB268.8828.96257NuclearMedtr0392s0020.1
MtNF-YB10MtrunA17Chr2g0307551MsNF-YB114.6317.43157NuclearMedtr2g056000.1
MtNF-YB11MtrunA17Chr3g0102351MsNF-YB126.2120.11191NuclearMedtr3g058980.1
MtNF-YB12MtrunA17Chr4g0026311MsNF-YB145.2515.54141NuclearMedtr4g052950.1
MtNF-YB13MtrunA17Chr4g0062271MsNF-YB114.8017.48157NuclearMedtr4g112380.1
MtNF-YB14MtrunA17Chr4g0067091MsNF-YB266.3124.94218NuclearMedtr4g119500.1
MtNF-YB15MtrunA17Chr4g0076321MsNF-YB275.3615.33137NuclearMedtr4g133938.1
MtNF-YB16MtrunA17Chr4g0076381MsNF-YB286.2626.78241NuclearMedtr4g133952.1
MtNF-YB17MtrunA17Chr5g0446491MsNF-YB185.9619.98185NuclearMedtr5g095740.1
MtNF-YB18MtrunA17Chr5g0446601MsNF-YB204.5721.16192ExtracellularMedtr5g095900.1
MtNF-YB19MtrunA17Chr7g0263601MsNF-YB66.1018.77172NuclearMedtr7g100650.1
MtNF-YB20MtrunA17Chr8g0382931MsNF-YB165.8022.55204NuclearMedtr8g091720.1
MtNF-YB21MtrunA17Chr8g0384451MsNF-YB176.0424.96215NuclearMedtr8g093920.1
MsNF-YB1MsG0180001010.01.T01MtNF-YB25.2518.87173Nuclear
MsNF-YB2MsG0180001011.01.T01MtNF-YB35.1722.86204Extracellular
MsNF-YB3MsG0180001031.01.T01MtNF-YB25.0920.95192Nuclear
MsNF-YB4MsG0180001571.01.T01MtNF-YB45.3221.27188Nuclear
MsNF-YB5MsG0180003209.01.T01MtNF-YB174.4710.7699Nuclear
MsNF-YB6MsG0180004009.01.T01MtNF-YB55.7519.26175Nuclear
MsNF-YB7MsG0180004588.01.T01MtNF-YB66.5510.897Nuclear
MsNF-YB8MsG0180004726.01.T01MtNF-YB146.4221.34182Nuclear
MsNF-YB9MsG0180004882.01.T01MtNF-YB75.5121.18186Nuclear
MsNF-YB10MsG0280007510.01.T01MtNF-YB85.7817.67163Nuclear
MsNF-YB11MsG0280009235.01.T01MtNF-YB106.0226.5235Nuclear
MsNF-YB12MsG0380014538.01.T01MtNF-YB116.2120.18191Nuclear
MsNF-YB13MsG0380014546.01.T02MtNF-YB176.1622.05194Extracellular
MsNF-YB14MsG0480020531.01.T01MtNF-YB125.4014.64130Extracellular
MsNF-YB15MsG0480020532.01.T01MtNF-YB127.6715.19135Extracellular
MsNF-YB16MsG0480023372.01.T01MtNF-YB205.8021.81197Nuclear
MsNF-YB17MsG0480023477.01.T02MtNF-YB216.1426.18226Nuclear
MsNF-YB18MsG0580029966.01.T01MtNF-YB174.9215.87144Nuclear
MsNF-YB19MsG0580029976.01.T01MtNF-YB184.5120.54188Nuclear
MsNF-YB20MsG0580029978.01.T01MtNF-YB184.6420.68187Nuclear
MsNF-YB21MsG0680031203.01.T01MtNF-YB178.6688.3980Nuclear
MsNF-YB22MsG0780040897.01.T01MtNF-YB198.6790.71289Extracellular
MsNF-YB23MsG0880043949.01.T01MtNF-YB179.348.5278Nuclear
MsNF-YB24MsG0880046588.01.T01MtNF-YB136.9231.34277Extracellular
MsNF-YB25MsG0880046644.01.T01MtNF-YB134.7013.72124Nuclear
MsNF-YB26MsG0880047027.01.T01MtNF-YB145.2714.69130Nuclear
MsNF-YB27MsG0880047742.01.T01MtNF-YB155.3515.28137Nuclear
MsNF-YB28MsG0880047744.01.T01MtNF-YB166.2523.97214Nuclear
Publisher’s Note: MDPI stays neutral with regard to jurisdictional claims in published maps and institutional affiliations.

