
Trehalose Treatment in Zebrafish Model of Lafora Disease

 ,
,  , , , ,
  , and
, and 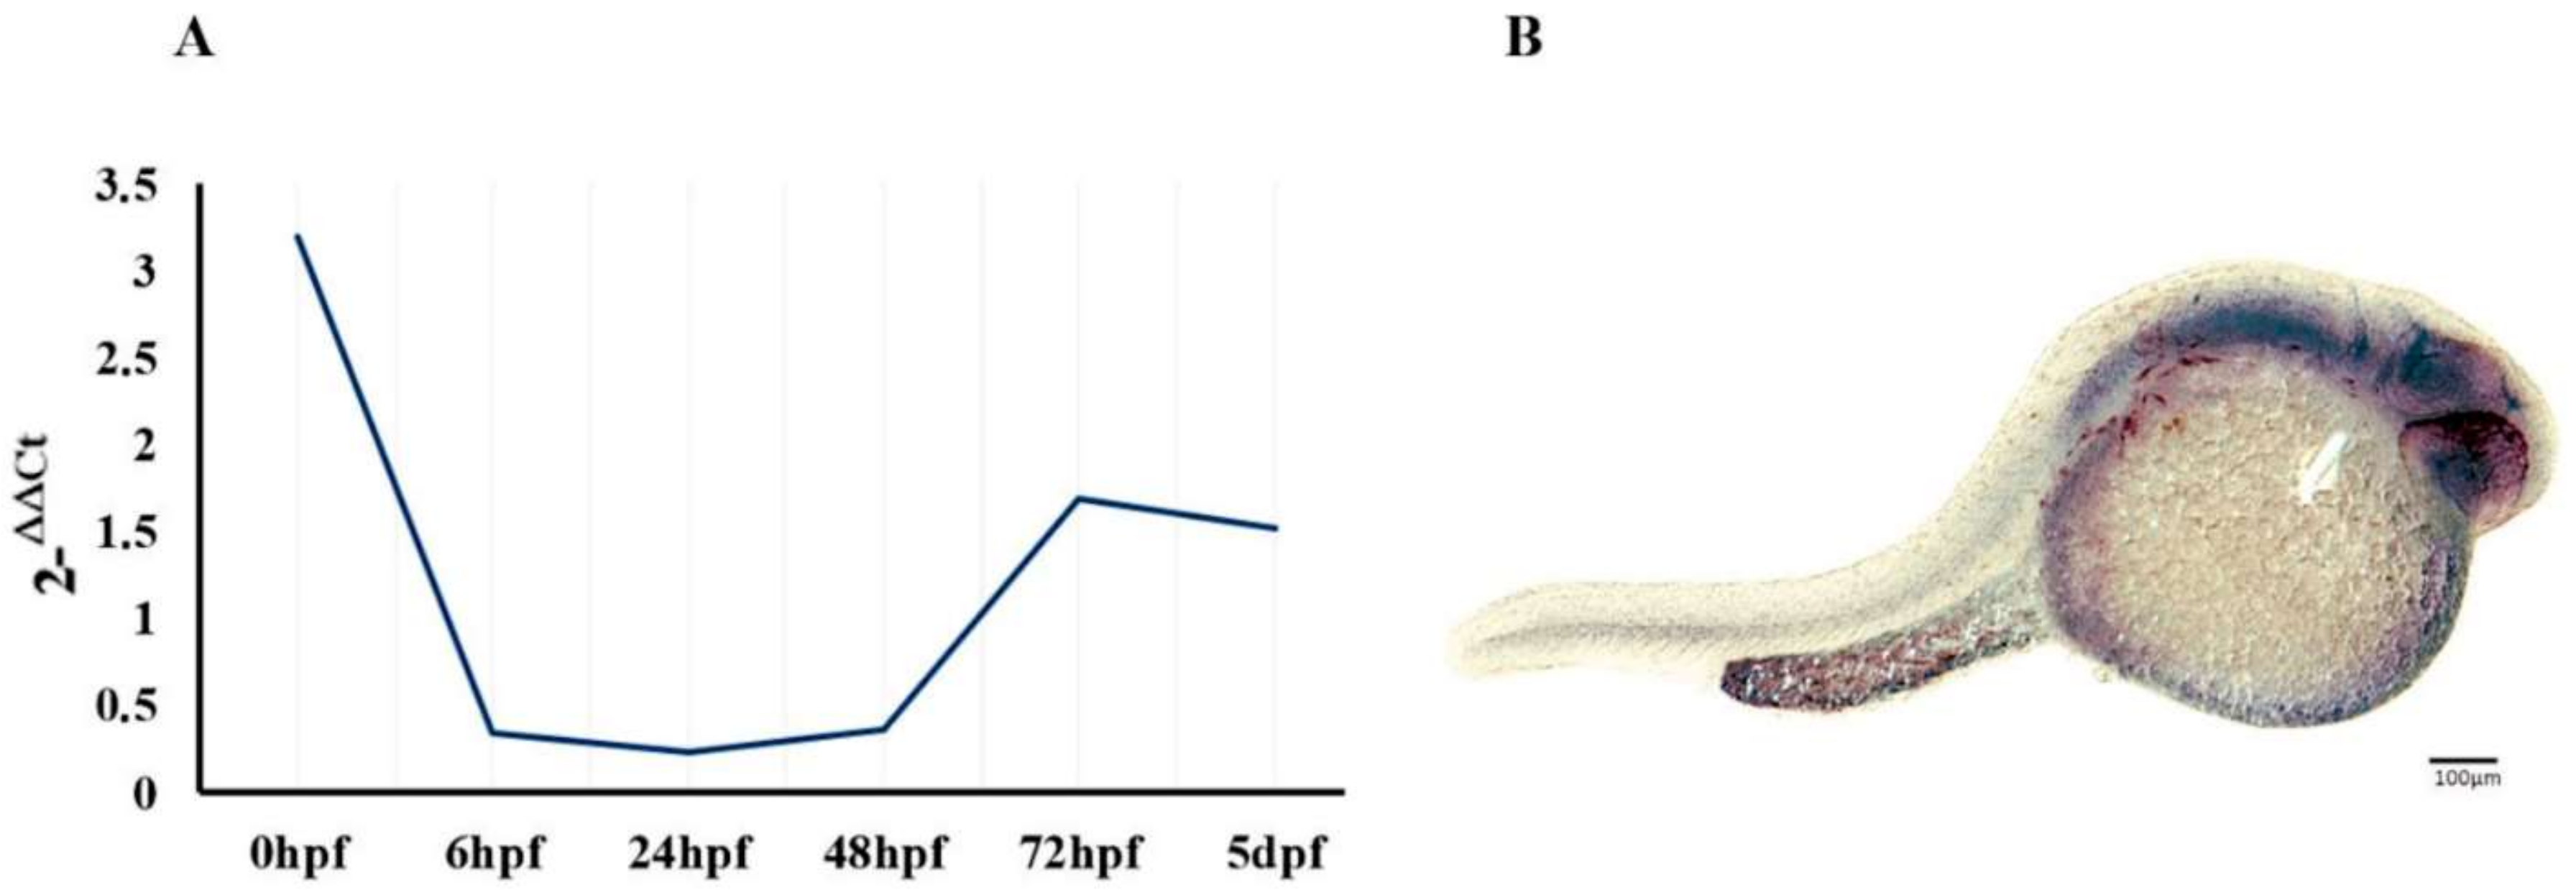
Abstract
1. Introduction
2. Results
2.1. Regional and Developmental Expression of the epm2a Gene
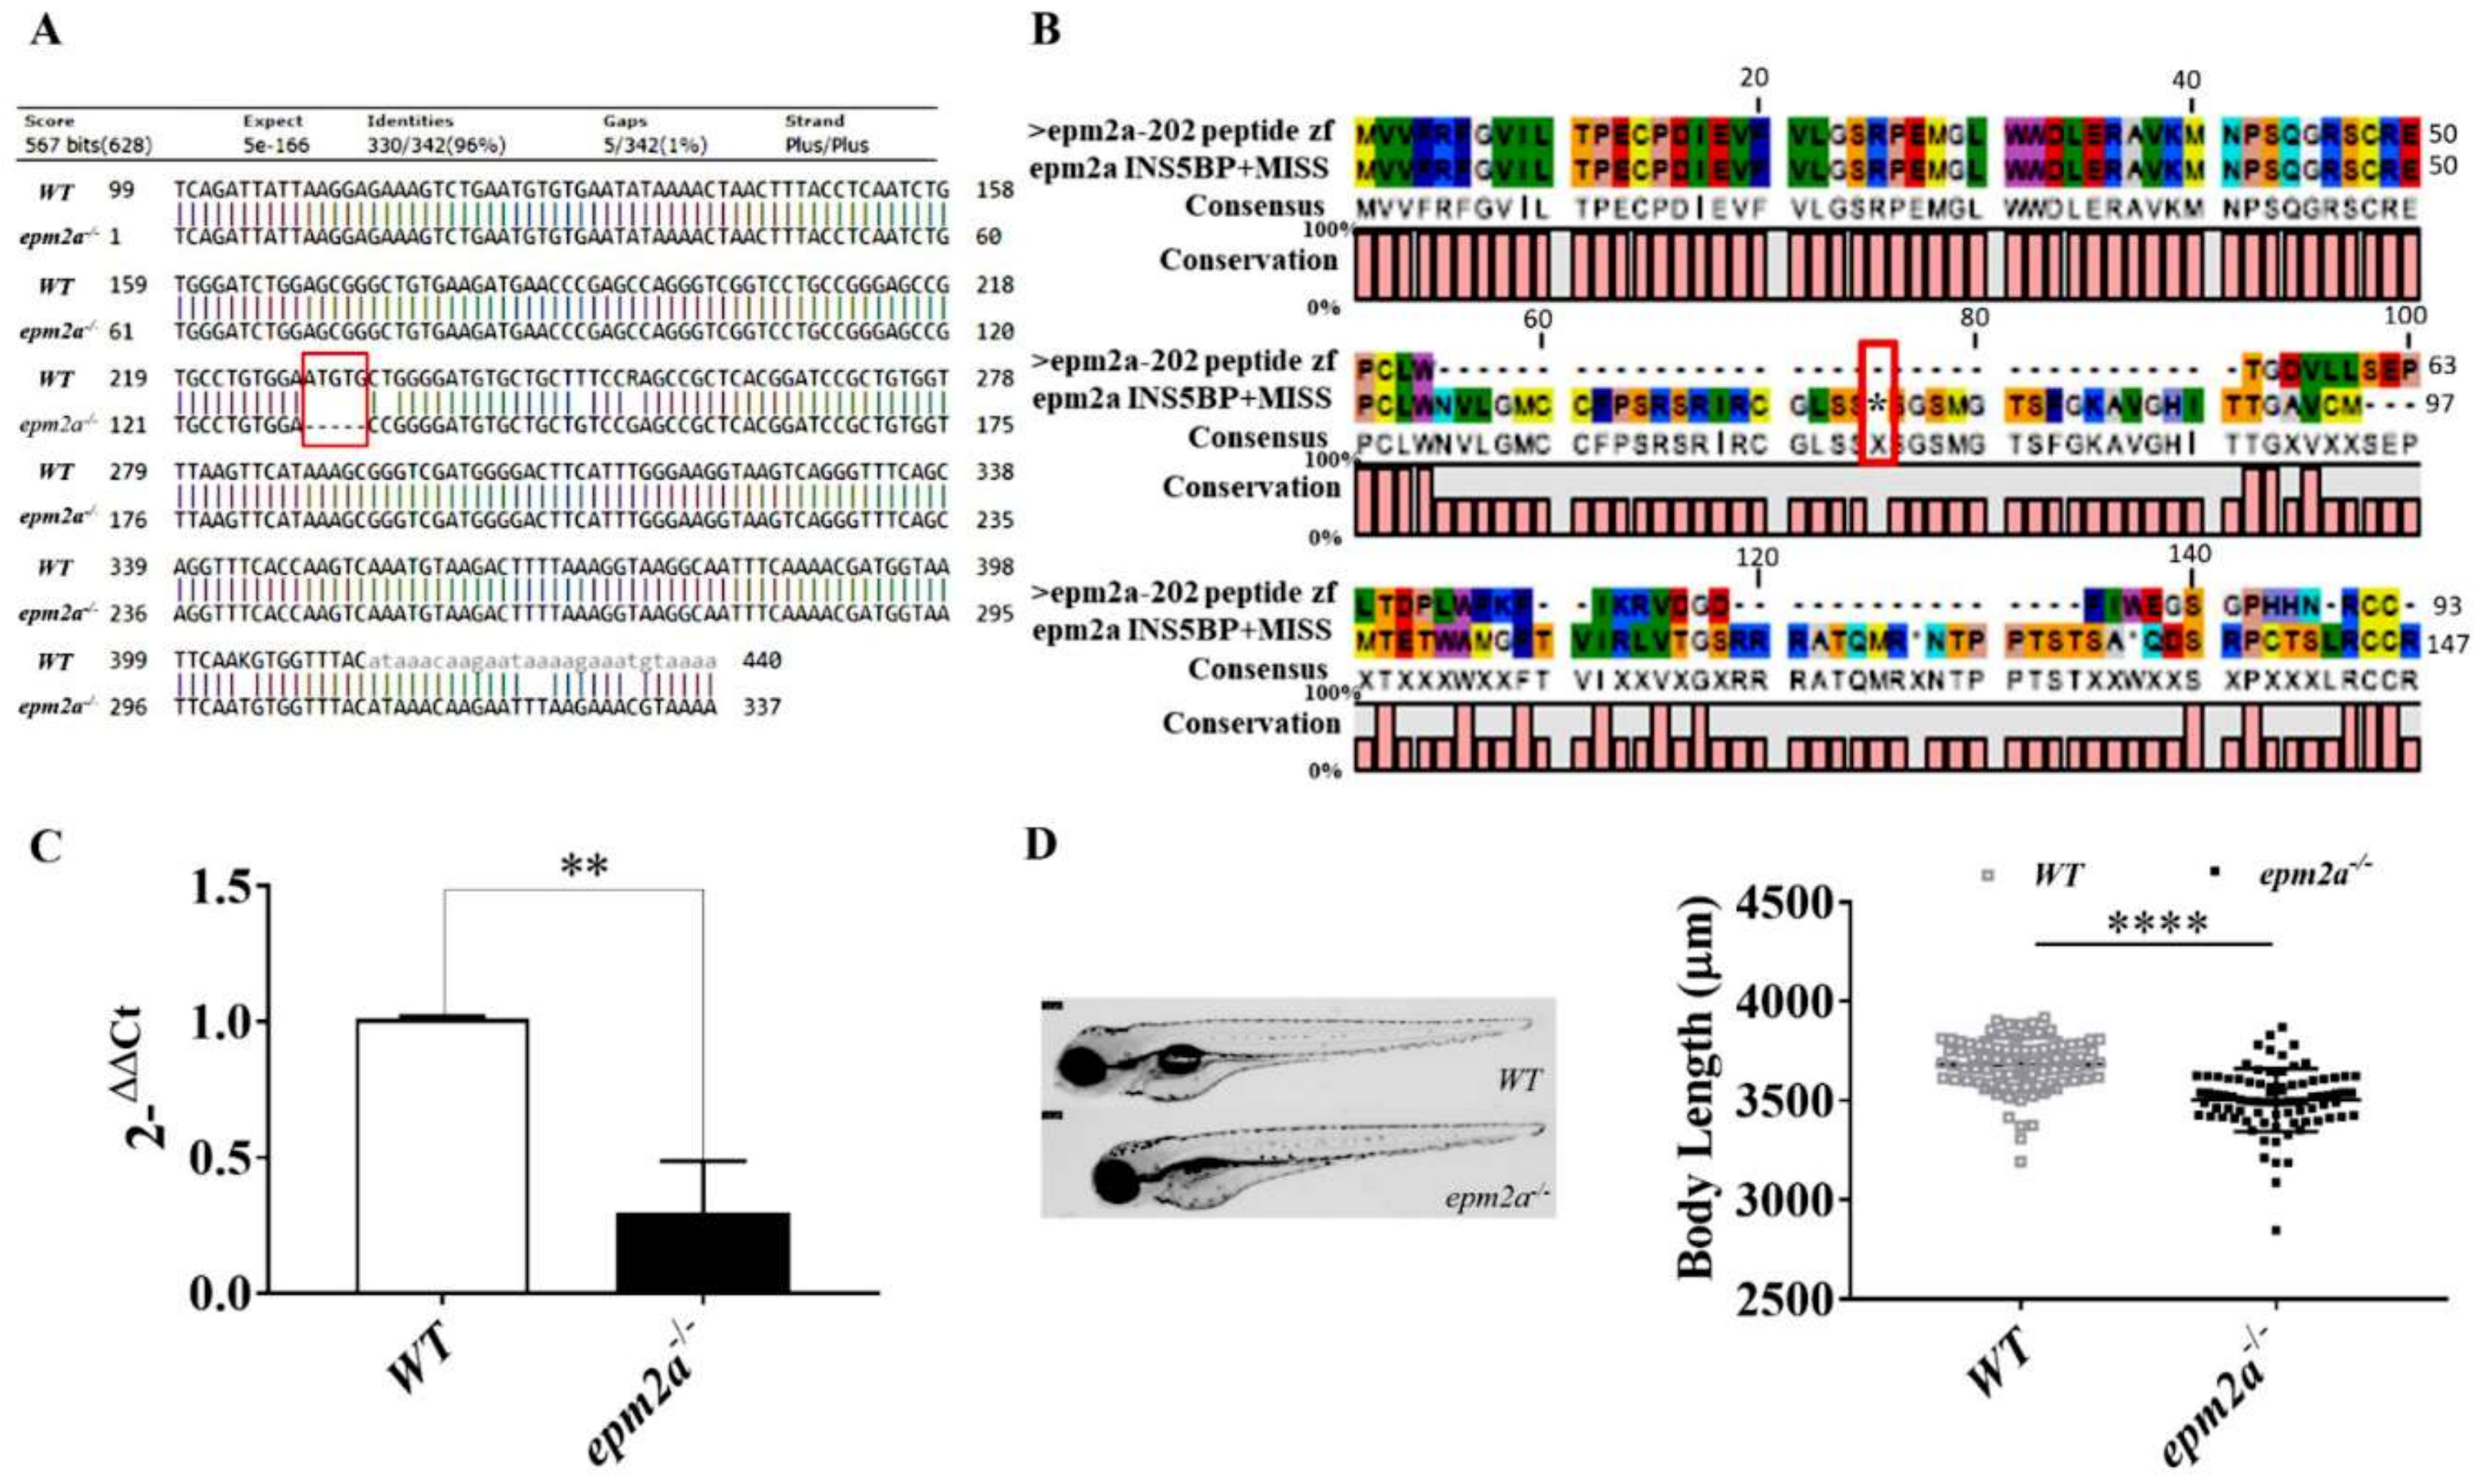
2.2. Generation of epm2a−/− Mutant Zebrafish
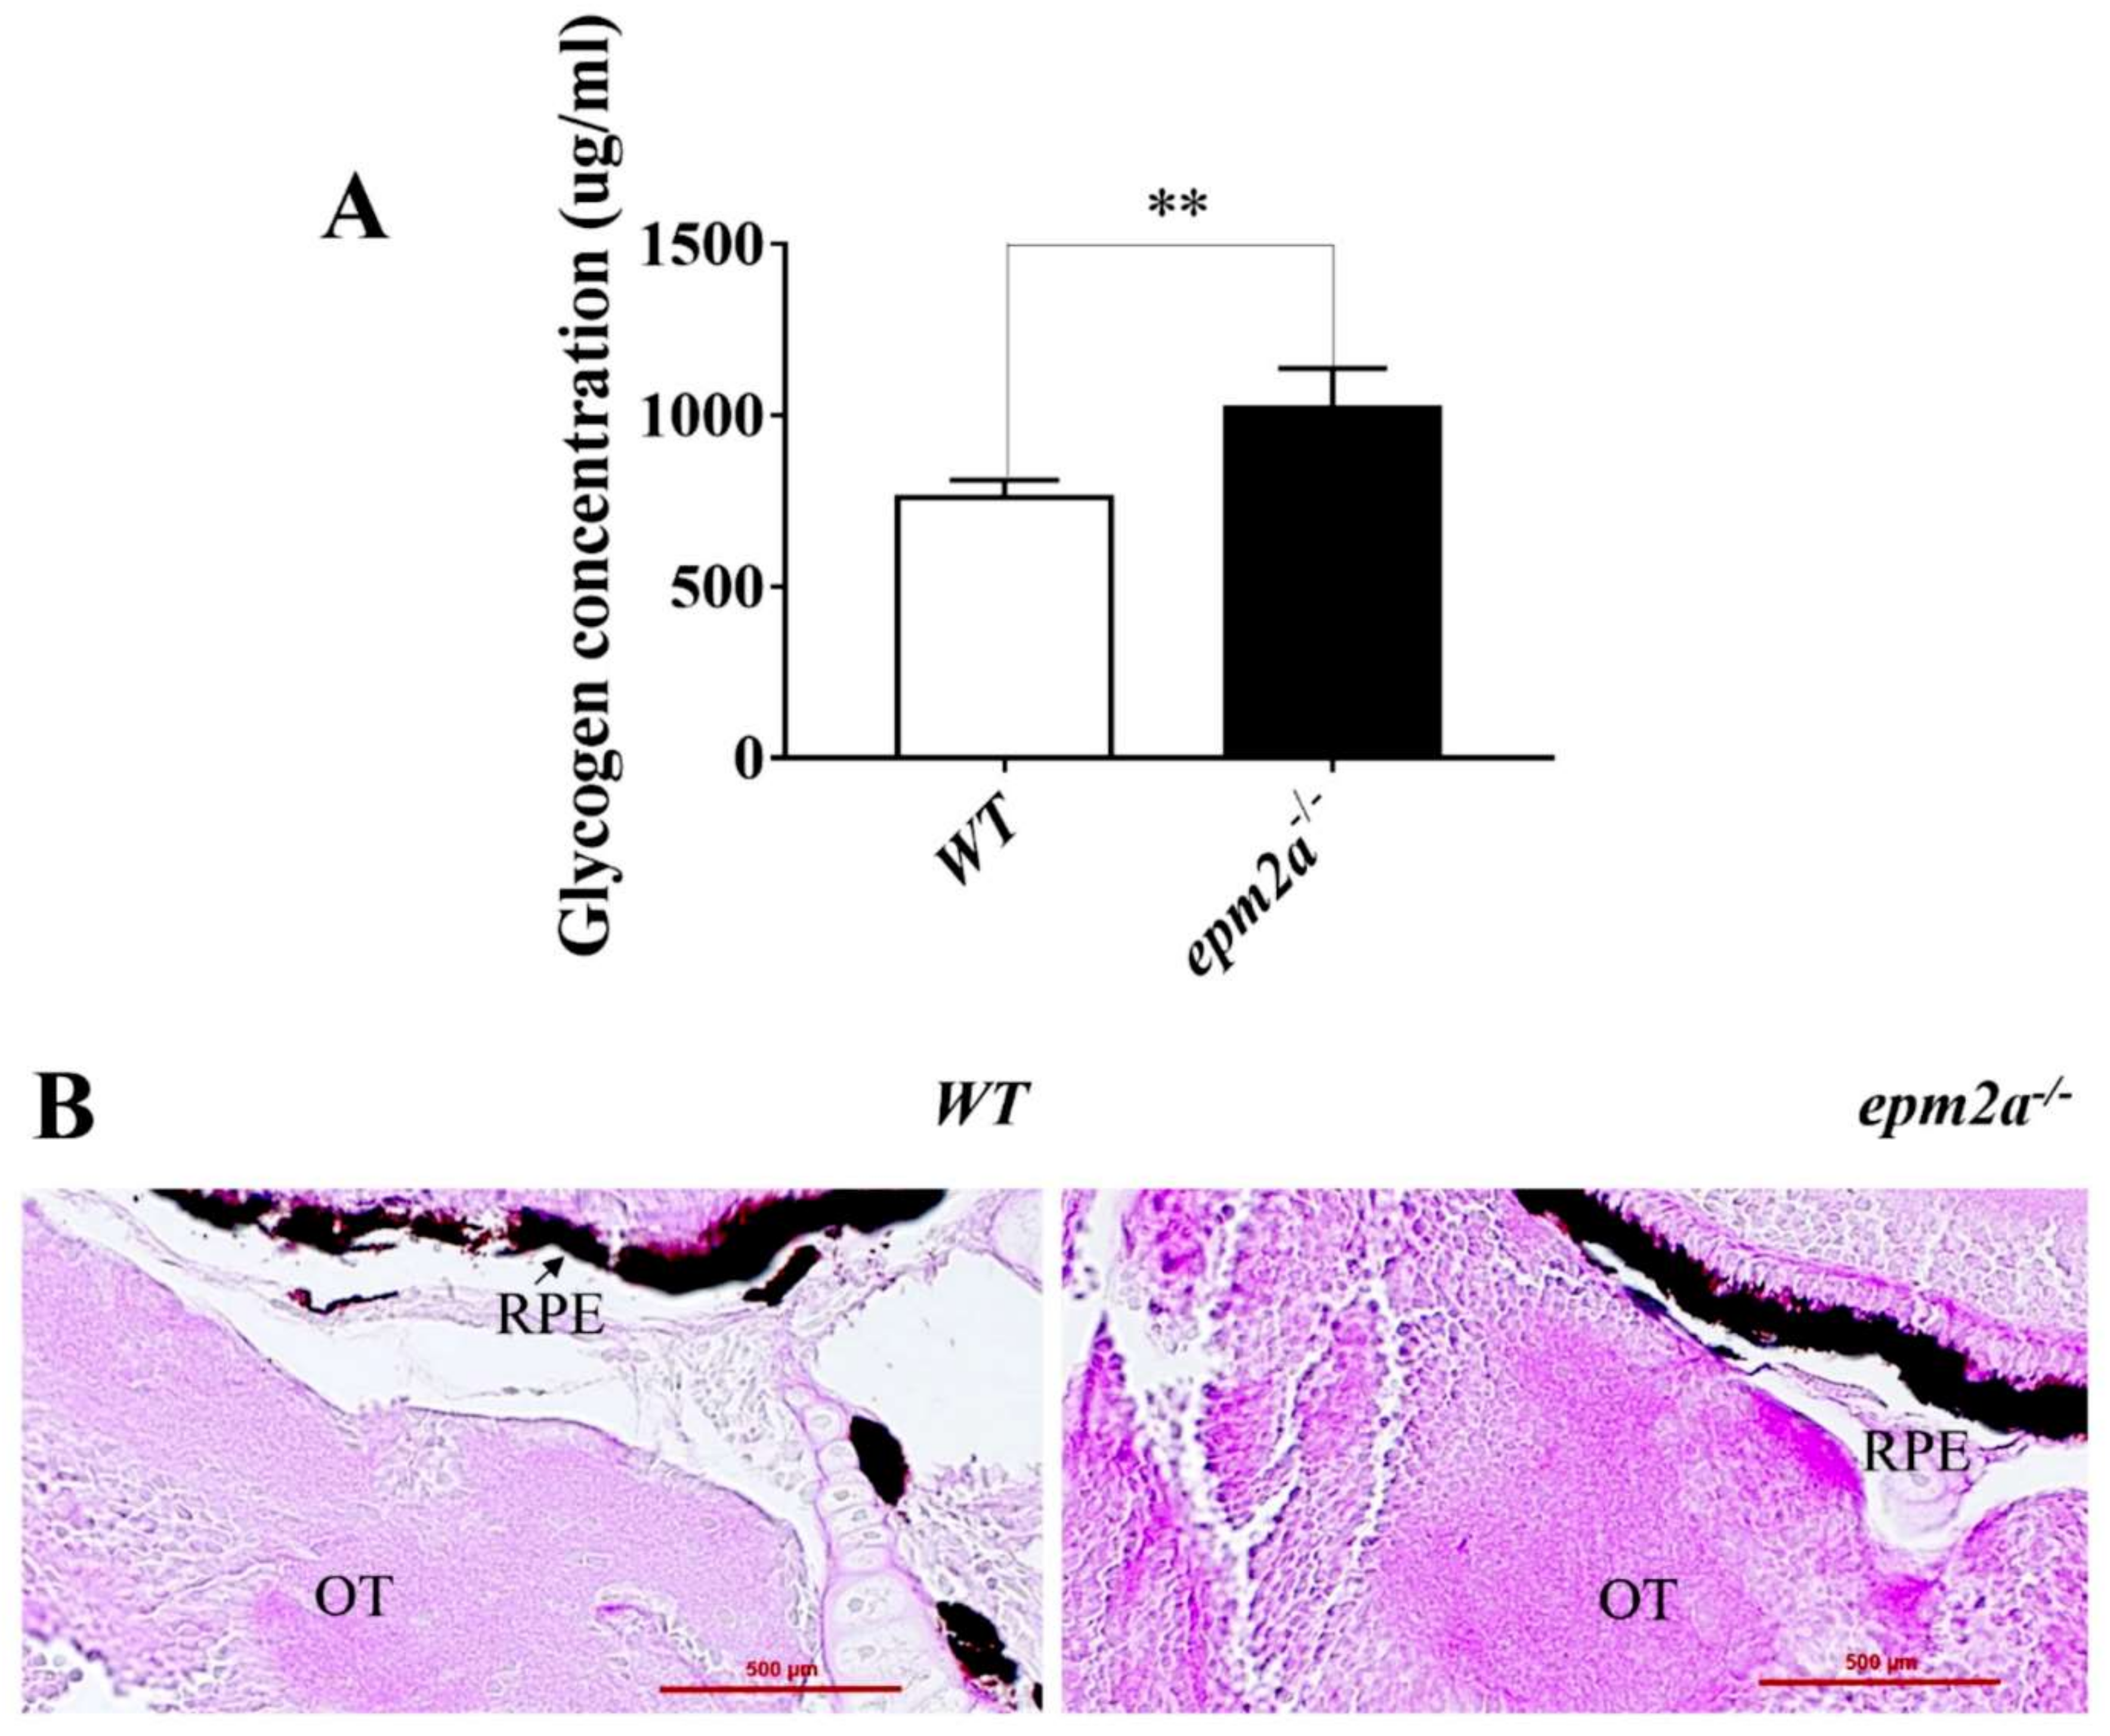
2.3. Glycogen Accumulation and Lafora Body Formation
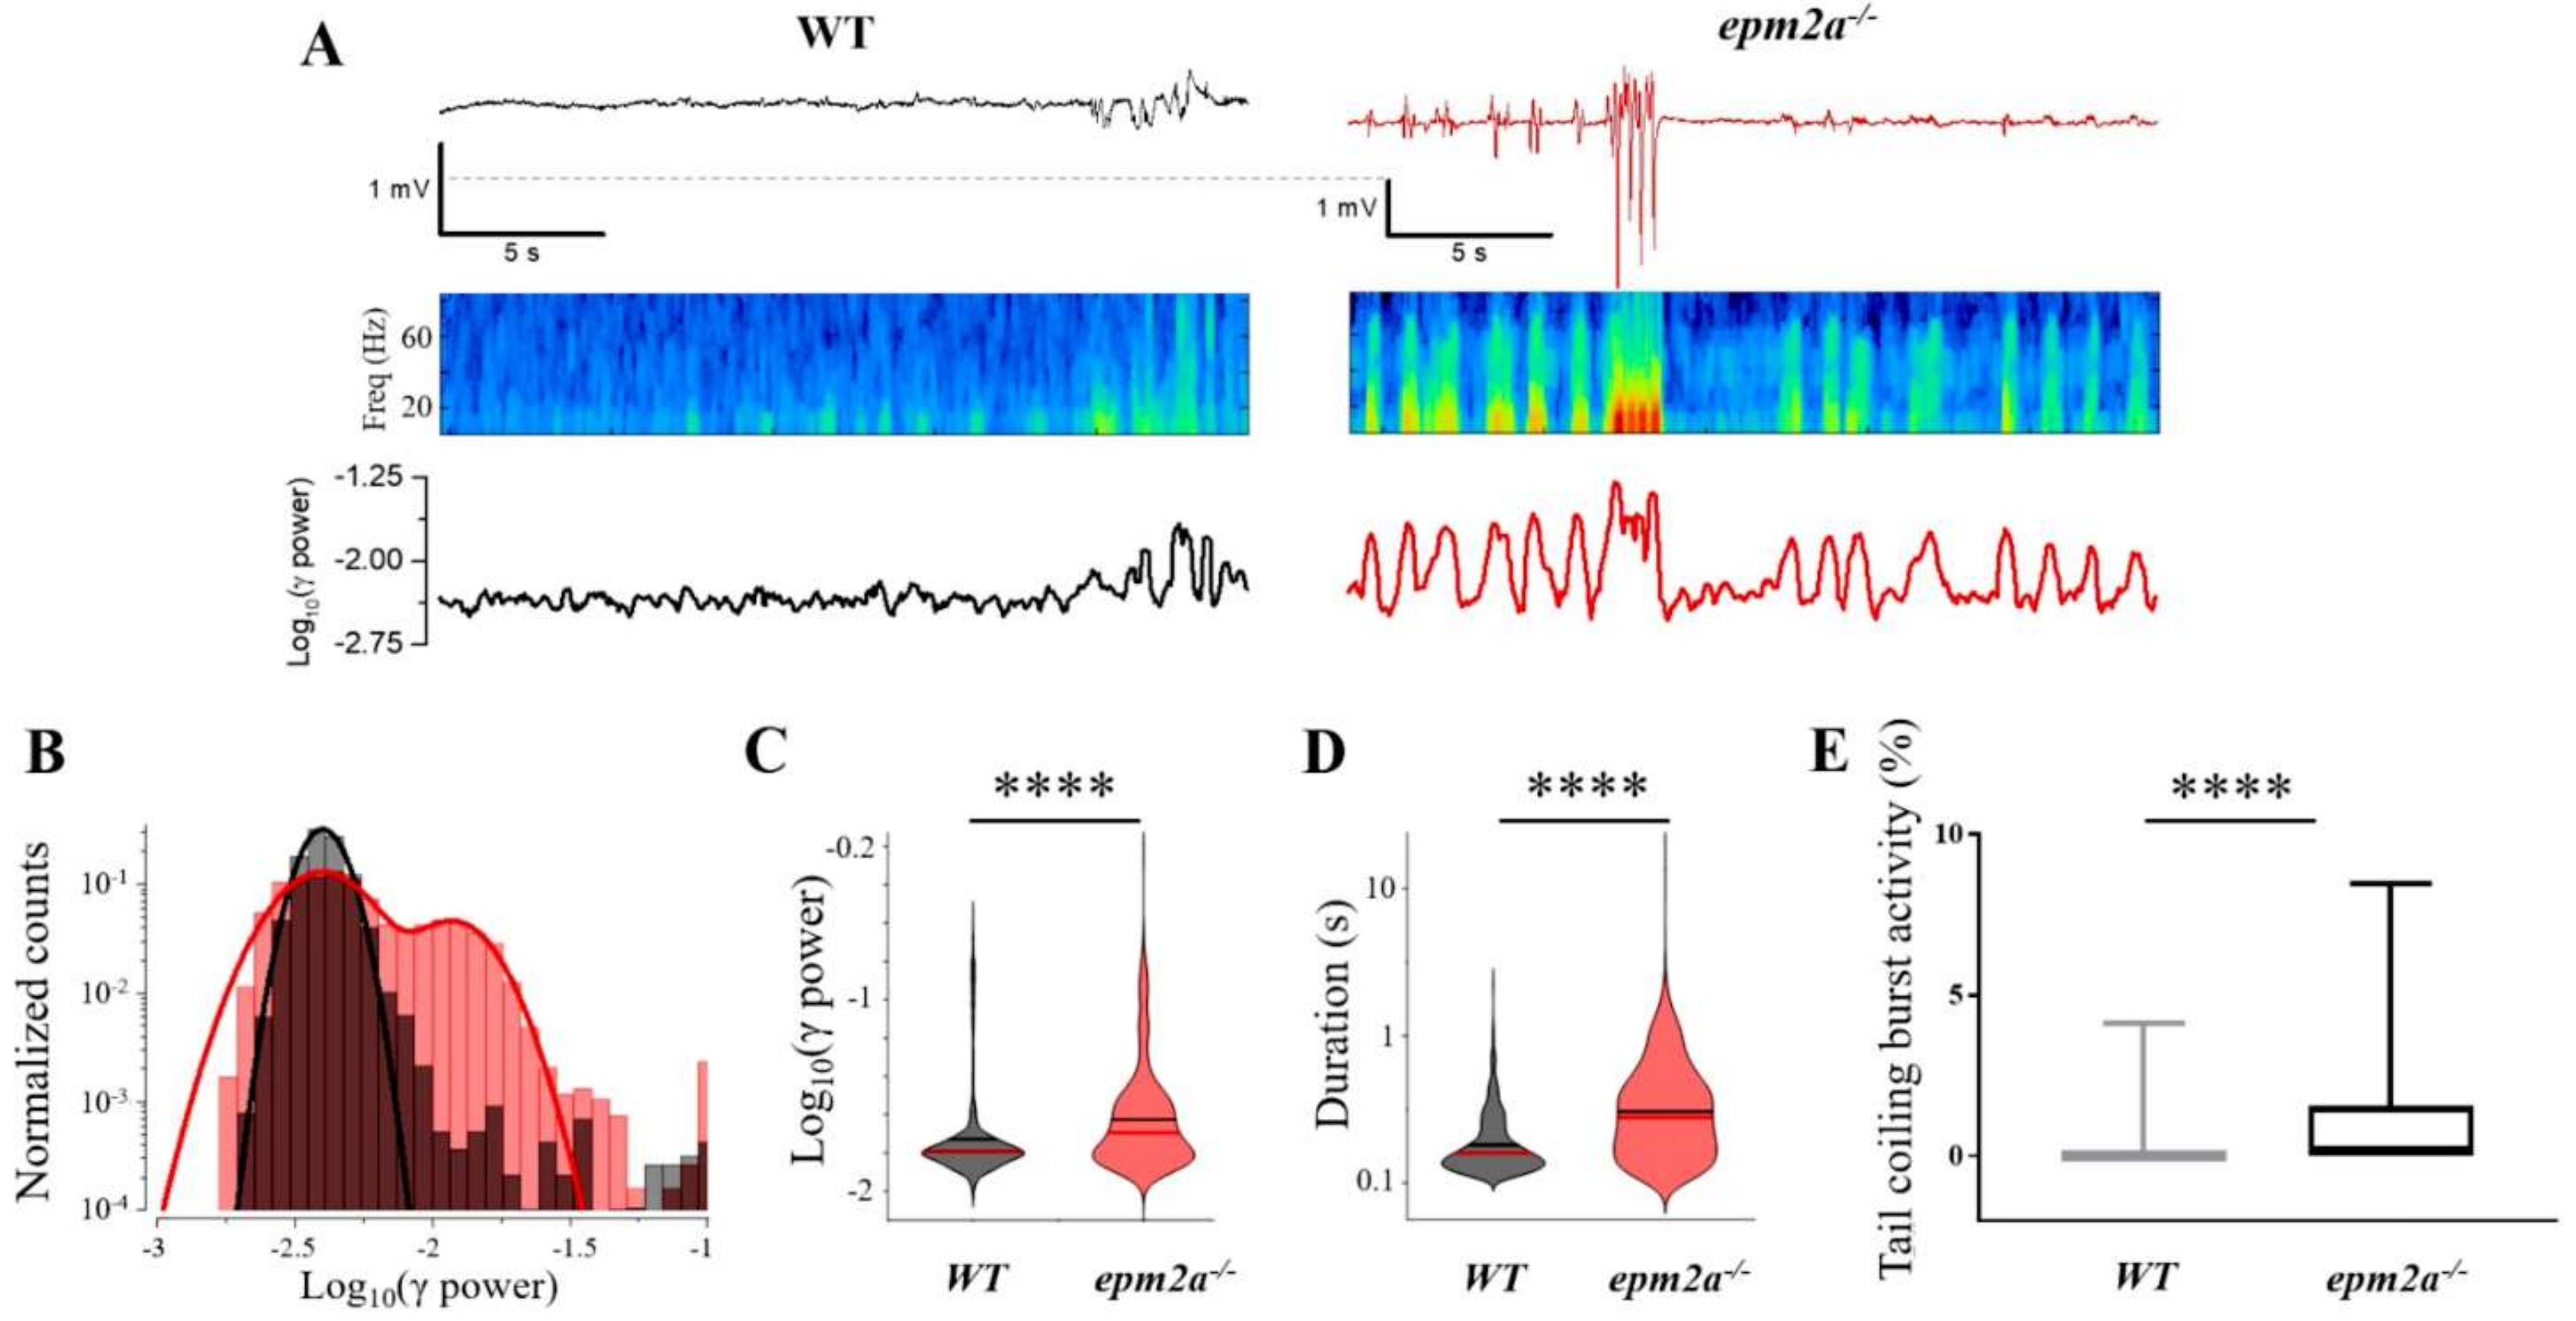
2.4. Mutant Zebrafish Displays Neuronal Hyperexcitability and Spontaneous Seizures
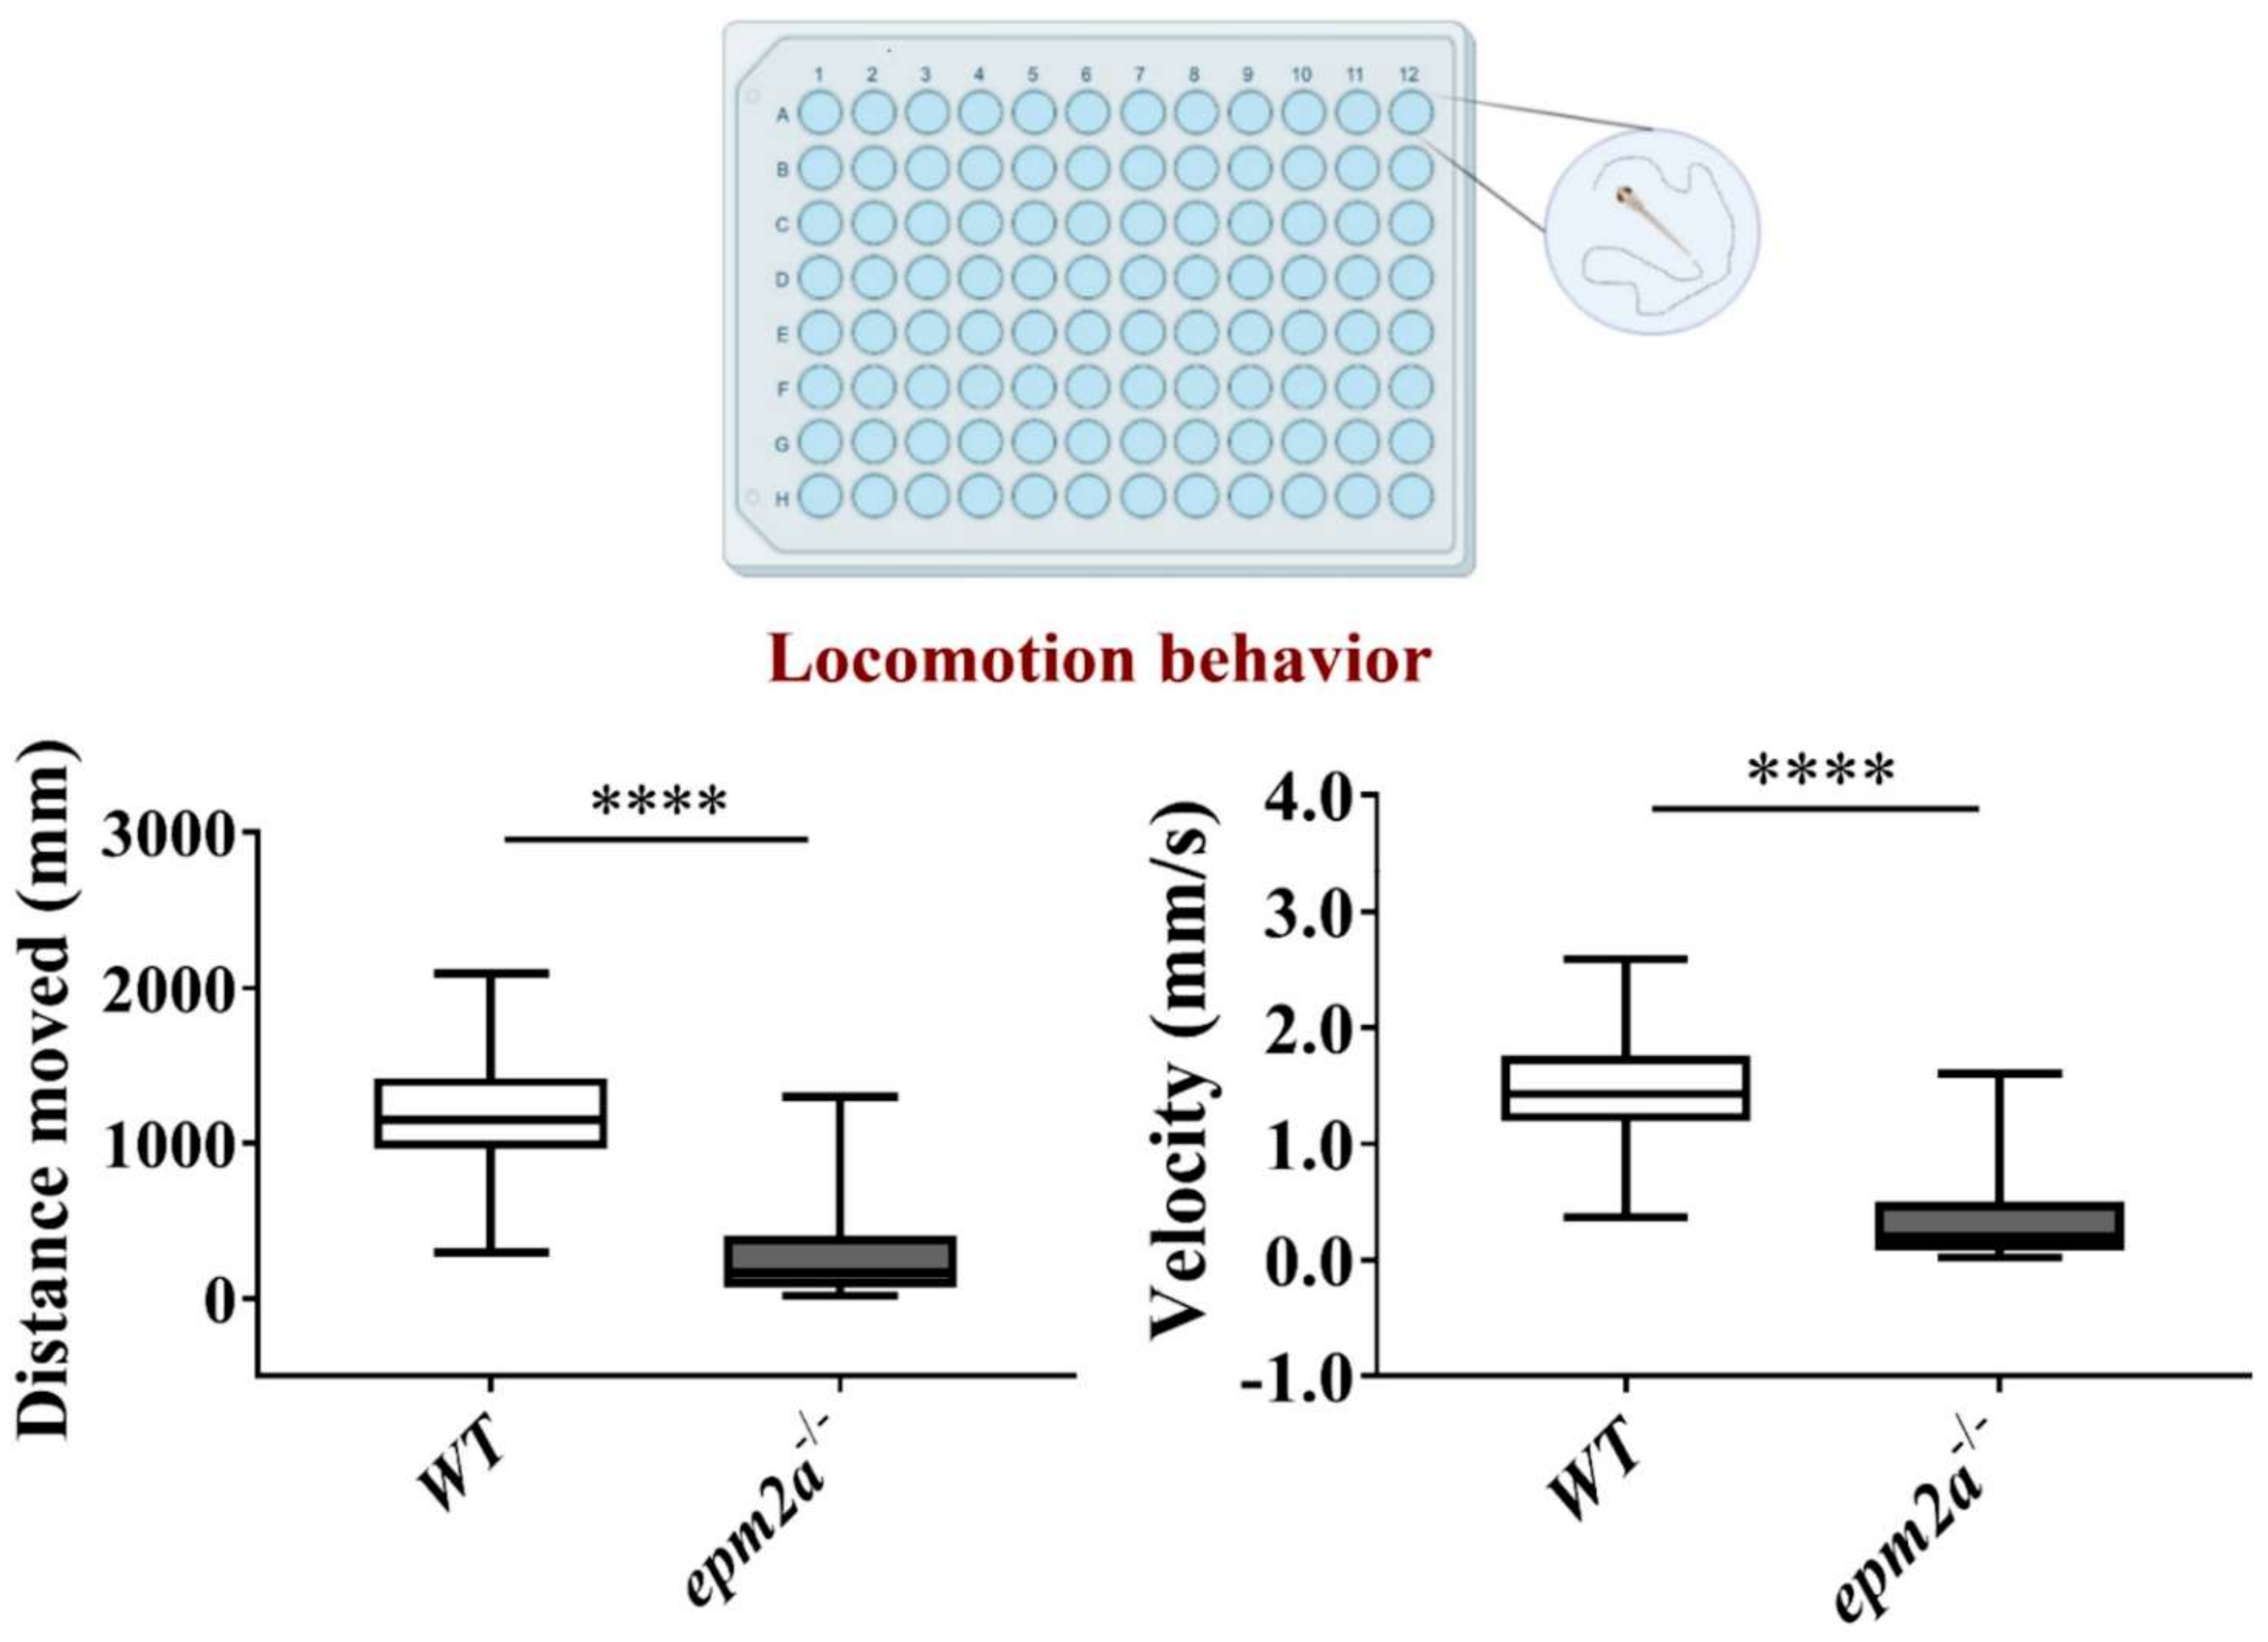
2.5. Motor Impairment in epm2a−/− Mutant Zebrafish
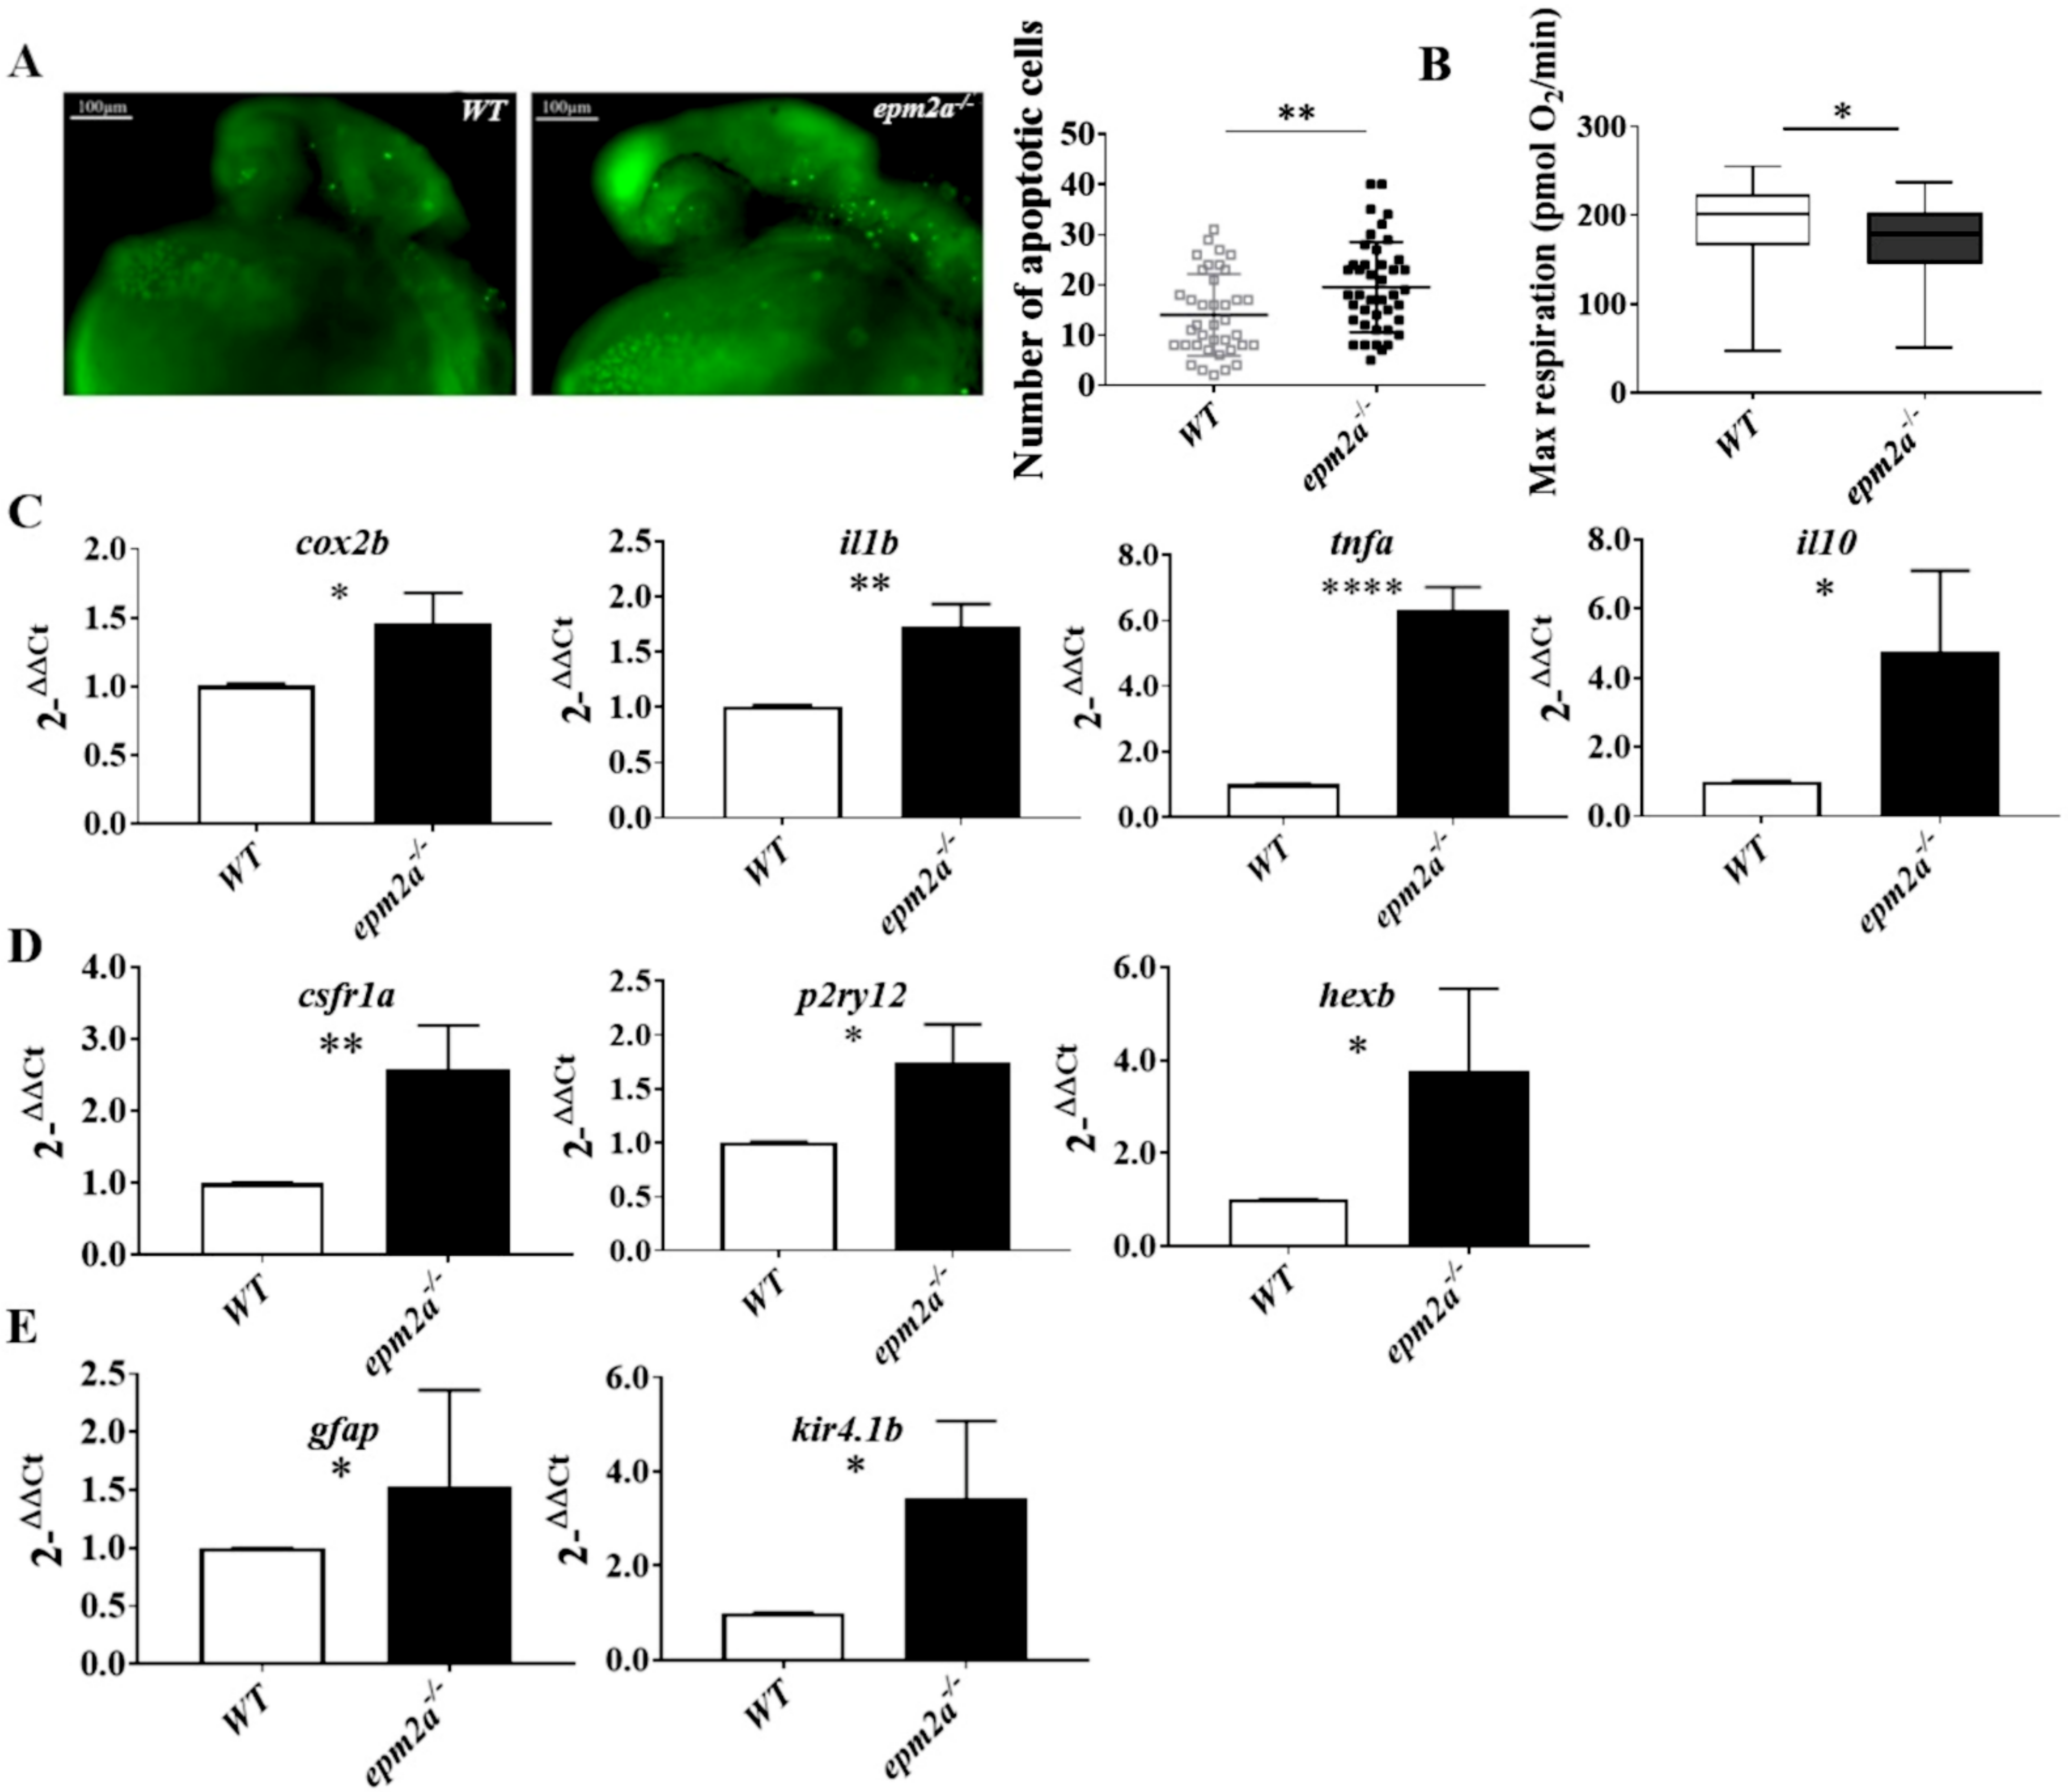
2.6. Neuroinflammation, Apoptotic Death, and Mitochondrial Dysfunction in epm2a−/− Zebrafish Larvae
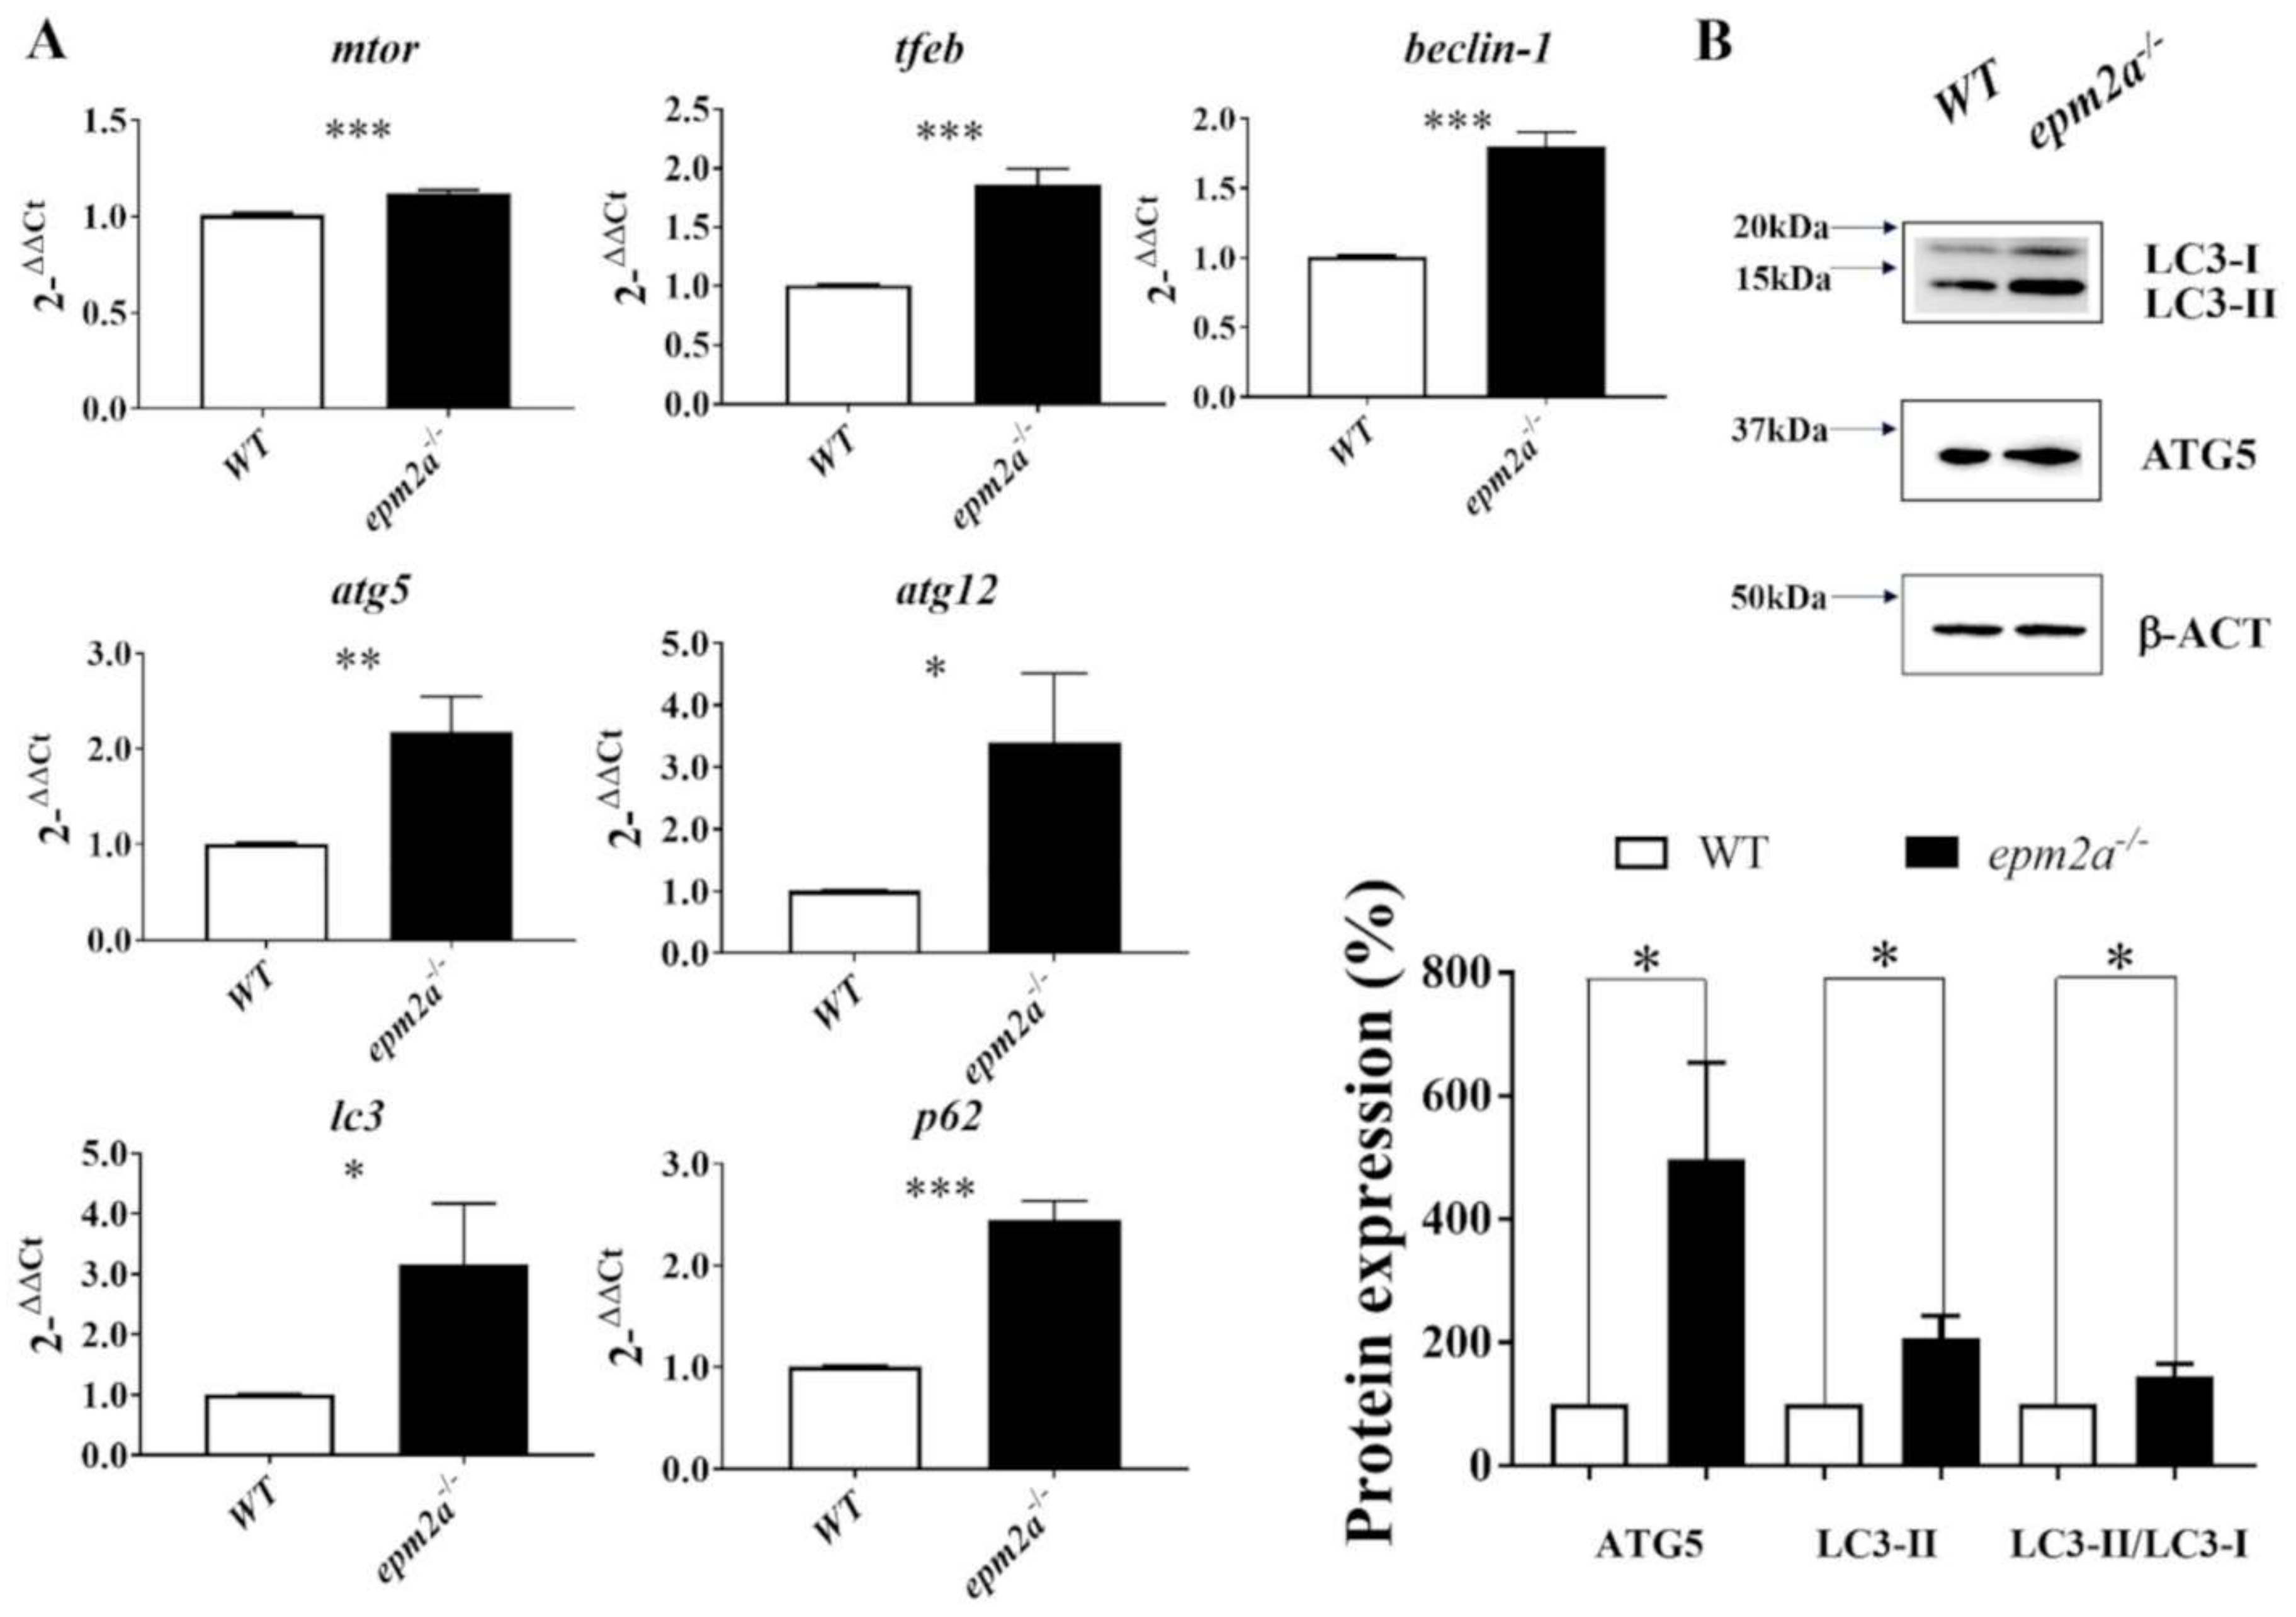
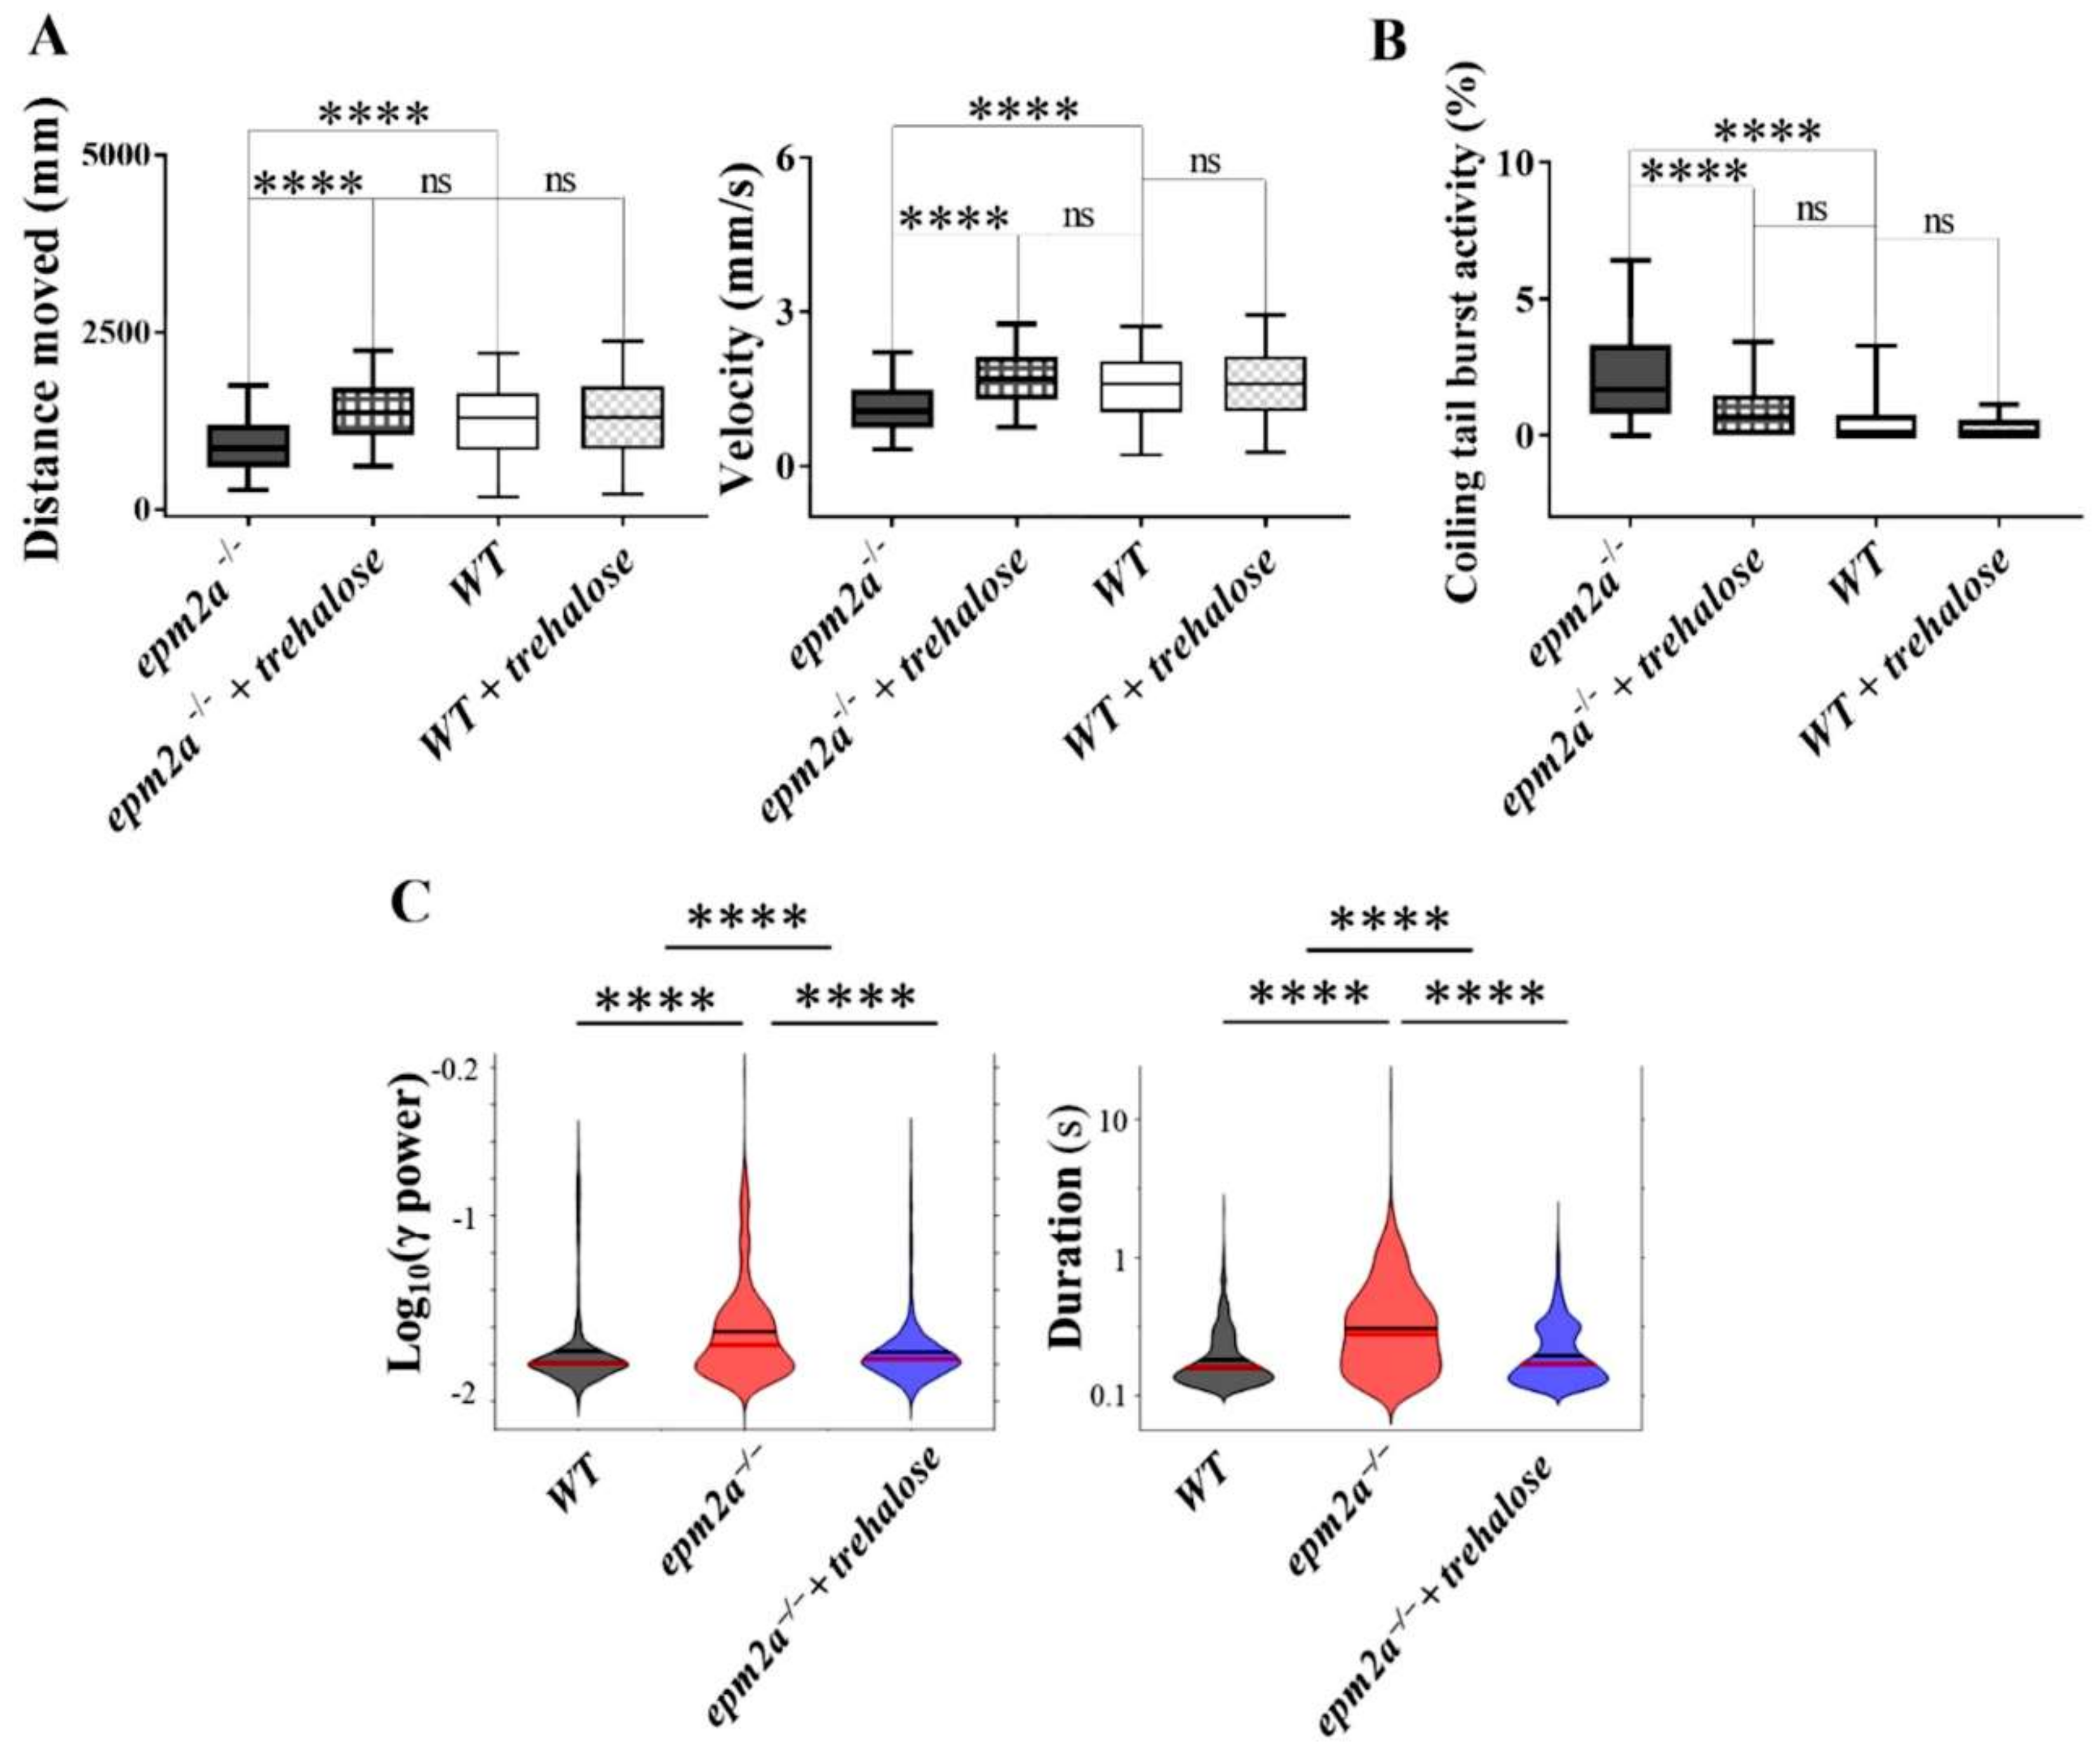
2.7. Autophagy Impairment and Trehalose Treatment in epm2a−/− Larvae
3. Discussion
4. Materials and Methods
4.1. Zebrafish Maintenance
4.2. Establishing Mutant Lines
4.3. Genotyping
4.4. In Situ Hybridization
4.5. Analysis of Larval Morphology
4.6. Quantitative (q)RT-PCR
4.7. Western Blotting
4.8. Glycogen Assay
4.9. Histological Preparation for Periodic Acid-Schiff (PAS) Staining
4.10. Immunohistochemistry Staining of Whole-Mount Zebrafish Embryos
4.11. Detection of Apoptotic Cells
4.12. Mitochondrial Respiratory Analysis
4.13. Locomotor Behavior
4.14. LFP Recordings and Analysis
4.15. Pharmacological Treatments
4.16. Statistics
Supplementary Materials
Author Contributions
Funding
Institutional Review Board Statement
Informed Consent Statement
Data Availability Statement
Acknowledgments
Conflicts of Interest
References
- Turnbull, J.; Tiberia, E.; Striano, P.; Genton, P.; Carpenter, S.; Ackerley, C.A.; Minassian, B.A. Lafora disease. Epileptic Disord. 2016, 18, S38–S62. [Google Scholar] [CrossRef] [PubMed]
- Minassian, B.A.; Lee Jeffrey, R.; Herbrick, J.A.; Huizenga, J.; Soder, S.; Mungall, A.J.; Dunham, I.; Gardner, R.; Fong, C.Y.G.; Carpenter, S.; et al. Mutations in a gene encoding a novel protein tyrosine phosphatase cause progressive myoclonus epilepsy. Nat. Genet. 1998, 20, 171–174. [Google Scholar] [CrossRef] [PubMed]
- Chan, E.M.; Young, E.J.; Ianzano, L.; Munteanu, I.; Zhao, X.; Christopoulos, C.C.; Avanzini, G.; Elia, M.; Ackerley, C.A.; Jovic, N.J.; et al. Mutations in NHLRC1 cause progressive myoclonus epilepsy. Nat. Genet. 2003, 35, 125–127. [Google Scholar] [CrossRef] [PubMed]
- Turnbull, J.; Girard, J.M.; Lohi, H.; Chan, E.M.; Wang, P.; Tiberia, E.; Omer, S.; Ahmed, M.; Bennett, C.; Chakrabarty, A.; et al. Early-onset Lafora body disease. Brain 2012, 135, 2684–2698. [Google Scholar] [CrossRef] [PubMed]
- Minassian, B.A. Lafora’s disease: Towards a clinical, pathologic, and molecular synthesis. Pediatr. Neurol. 2001, 25, 21–29. [Google Scholar] [CrossRef]
- Ganesh, S.; Puri, R.; Singh, S.; Mittal, S.; Dubey, D. Recent advances in the molecular basis of Lafora’s progressive myoclonus epilepsy. J. Hum. Genet. 2006, 51, 1–8. [Google Scholar] [CrossRef] [PubMed]
- Orsini, A.; Valetto, A.; Bertini, V.; Esposito, M.; Minassian, B.A.; Bonuccelli, A.; Peroni, D.; Michelucci, R.; Striano, P. The best evidence for progressive myoclonic epilepsy: A pathway to precision therapy. Seizure 2020, 71, 247–257. [Google Scholar] [CrossRef] [PubMed]
- d’Orsi, G.; Lalla, A.; Palumbo, O.; Di Claudio, M.T.; Valenzano, A.; Sabetta, A.; Lopopolo, A.; Di Muro, E.; Palumbo, P.; Copetti, M.; et al. The presenting symptoms of Lafora Disease: An electroclinical and genetic study in five Apulian (Southern Italy) families. Seizure 2020, 83, 145–153. [Google Scholar] [CrossRef] [PubMed]
- Striano, P.; Zara, F.; Turnbull, J.; Girard, J.M.; Ackerley, C.A.; Cervasio, M.; De Rosa, G.; Del Basso-De Caro, M.L.; Striano, S.; Minassian, B.A. Typical progression of myoclonic epilepsy of the Lafora type: A case report. Nat. Clin. Pract. Neurol. 2008, 4, 106–111. [Google Scholar] [CrossRef] [PubMed]
- Franceschetti, S.; Michelucci, R.; Canafoglia, L.; Striano, P.; Gambardella, A.; Magaudda, A.; Tinuper, P.; La Neve, A.; Ferlazzo, E.; Gobbi, G.; et al. Progressive myoclonic epilepsies Definitive and still undetermined causes. Neurology 2014, 82, 405–411. [Google Scholar] [CrossRef] [PubMed]
- Pondrelli, F.; Muccioli, L.; Licchetta, L.; Mostacci, B.; Zenesini, C.; Tinuper, P.; Vignatelli, L.; Bisulli, F. Natural history of Lafora disease: A prognostic systematic review and individual participant data meta-analysis. Orphanet J. Rare Dis. 2021, 16, 1–10. [Google Scholar] [CrossRef] [PubMed]
- Tagliabracci, V.S.; Girard, J.M.; Segvich, D.; Meyer, C.; Turnbull, J.; Zhao, X.; Minassian, B.A.; DePaoli-Roach, A.A.; Roach, P.J. Abnormal metabolism of glycogen phosphate as a cause for Lafora disease. J. Biol. Chem. 2008, 283, 33816–33825. [Google Scholar] [CrossRef]
- Nitschke, F.; Sullivan, M.A.; Wang, P.; Zhao, X.; Chown, E.E.; Perri, A.M.; Israelian, L.; Juana-López, L.; Bovolenta, P.; Rodríguez de Córdoba, S.; et al. Abnormal glycogen chain length pattern, not hyperphosphorylation, is critical in Lafora disease. EMBO Mol. Med. 2017, 9, 906–917. [Google Scholar] [CrossRef] [PubMed]
- Nitschke, F.; Wang, P.; Schmieder, P.; Girard, J.M.; Awrey, D.E.; Wang, T.; Israelian, J.; Zhao, X.; Turnbull, J.; Heydenreich, M.; et al. Hyperphosphorylation of glucosyl c6 carbons and altered structure of glycogen in the neurodegenerative epilepsy lafora disease. Cell Metab. 2013, 17, 756–767. [Google Scholar] [CrossRef] [PubMed]
- Sullivan, M.A.; Nitschke, S.; Steup, M.; Minassian, B.A.; Nitschke, F. Pathogenesis of lafora disease: Transition of soluble glycogen to insoluble polyglucosan. Int. J. Mol. Sci. 2017, 18, 1743. [Google Scholar] [CrossRef]
- Criado, O.; Aguado, C.; Gayarre, J.; Duran-Trio, L.; Garcia-Cabrero, A.M.; Vernia, S.; San Millán, B.; Heredia, M.; Romá-Mateo, C.; Mouron, S.; et al. Lafora bodies and neurological defects in malin-deficient mice correlate with impaired autophagy. Hum. Mol. Genet. 2012, 21, 1521–1533. [Google Scholar] [CrossRef] [PubMed]
- Rao, S.N.R.; Maity, R.; Sharma, J.; Dey, P.; Shankar, S.K.; Satishchandra, P.; Jana, N.R. Sequestration of chaperones and proteasome into Lafora bodies and proteasomal dysfunction induced by Lafora disease-associated mutations of malin. Hum. Mol. Genet. 2010, 19, 4726–4734. [Google Scholar] [CrossRef] [PubMed]
- Sinadinos, C.; Valles-Ortega, J.; Boulan, L.; Solsona, E.; Tevy, M.F.; Marquez, M.; Duran, J.; Lopez-Iglesias, C.; Calbó, J.; Blasco, E.; et al. Neuronal glycogen synthesis contributes to physiological aging. Aging Cell 2014, 13, 935–945. [Google Scholar] [CrossRef] [PubMed]
- Mitra, S.; Gumusgoz, E.; Minassian, B.A. Lafora disease: Current biology and therapeutic approaches. Rev. Neurol. 2022, 178, 315–325. [Google Scholar] [CrossRef] [PubMed]
- Parihar, R.; Rai, A.; Ganesh, S. Lafora disease: From genotype to phenotype. J. Genet. 2018, 97, 611–624. [Google Scholar] [CrossRef]
- Aguado, C.; Sarkar, S.; Korolchuk, V.I.; Criado, O.; Vernia, S.; Boya, P.; Sanz, P.; de Córdoba, S.R.; Knecht, E.; Rubinsztein, D.C. Laforin, the most common protein mutated in Lafora disease, regulates autophagy. Hum. Mol. Genet. 2010, 19, 2867–2876. [Google Scholar] [CrossRef] [PubMed]
- Romá-Mateo, C.; Aguado, C.; García-Giménez, J.L.; Ibáñez-Cabellos, J.S.; Seco-Cervera, M.; Pallardó, F.V.; Knecht, E.; Sanz, P. Increased Oxidative Stress and Impaired Antioxidant Response in Lafora Disease. Mol. Neurobiol. 2015, 51, 932–946. [Google Scholar] [CrossRef] [PubMed]
- López-González, I.; Viana, R.; Sanz, P.; Ferrer, I. Inflammation in Lafora Disease: Evolution with Disease Progression in Laforin and Malin Knock-out Mouse Models. Mol. Neurobiol. 2017, 54, 3119–3130. [Google Scholar] [CrossRef]
- Lahuerta, M.; Gonzalez, D.; Aguado, C.; Fathinajafabadi, A.; García-Giménez, J.L.; Moreno-Estellés, M.; Romá-Mateo, C.; Knecht, E.; Pallardó, F.V.; Sanz, P. Reactive Glia-Derived Neuroinflammation: A Novel Hallmark in Lafora Progressive Myoclonus Epilepsy That Progresses with Age. Mol. Neurobiol. 2020, 57, 1607–1621. [Google Scholar] [CrossRef]
- Gentry, M.S.; Dowen, R.H.; Worby, C.A.; Mattoo, S.; Ecker, J.R.; Dixon, J.E. The phosphatase laforin crosses evolutionary boundaries and links carbohydrate metabolism to neuronal disease. J. Cell Biol. 2007, 178, 477–488. [Google Scholar] [CrossRef] [PubMed]
- Gentry, M.S.; Pace, R.M. Conservation of the glucan phosphatase laforin is linked to rates of molecular evolution and the glucan metabolism of the organism. BMC Evol. Biol. 2009, 9, 138. [Google Scholar] [CrossRef]
- Garyali, P.; Siwach, P.; Singh, P.K.; Puri, R.; Mittal, S.; Sengupta, S.; Parihar, R.; Ganesh, S. The malin-laforin complex suppresses the cellular toxicity of misfolded proteins by promoting their degradation through the ubiquitin-proteasome system. Hum. Mol. Genet. 2009, 18, 688–700. [Google Scholar] [CrossRef] [PubMed]
- Mittal, S.; Dubey, D.; Yamakawa, K.; Ganesh, S. Lafora disease proteins malin and laforin are recruited to aggresomes in response to proteasomal impairment. Hum. Mol. Genet. 2007, 16, 753–762. [Google Scholar] [CrossRef] [PubMed]
- Vernia, S.; Rubio, T.; Heredia, M.; Rodríguez de Córdoba, S.; Sanz, P. Increased endoplasmic reticulum stress and decreased proteasomal function in Lafora disease models lacking the phosphatase laforin. PLoS ONE 2009, 4, e5907. [Google Scholar] [CrossRef] [PubMed]
- Knecht, E.; Criado-García, O.; Aguado, C.; Gayarre, J.; Duran-Trio, L.; Garcia-Cabrero, A.M.; Vernia, S.; San Millán, B.; Heredia, M.; Romá-Mateo, C.; et al. Malin knockout mice support a primary role of autophagy in the pathogenesis of Lafora disease. Autophagy 2012, 8, 701–703. [Google Scholar] [CrossRef][Green Version]
- Knecht, E.; Aguado, C.; Sarkar, S.; Korolchuk, V.I.; Criado-García, O.; Vernia, S.; Boya, P.; Sanz, P.; De Córdoba, S.R.; Rubinsztein, D.C. Impaired autophagy in Lafora disease. Autophagy 2010, 6, 991–993. [Google Scholar] [CrossRef]
- Lahuerta, M.; Aguado, C.; Sánchez-Martín, P.; Sanz, P.; Knecht, E. Degradation of altered mitochondria by autophagy is impaired in Lafora disease. FEBS J. 2018, 285, 2071–2090. [Google Scholar] [CrossRef]
- Romá-Mateo, C.; Aguado, C.; García-Giménez, J.L.; Knecht, E.; Sanz, P.; Pallardó, F.V. Oxidative stress, a new hallmark in the pathophysiology of Lafora progressive myoclonus epilepsy. Free Radic. Biol. Med. 2015, 88, 30–41. [Google Scholar] [CrossRef] [PubMed]
- Markussen, K.H.; Macedo, J.K.A.; Machío, M.; Dolce, A.; Goldberg, Y.P.; Vander Kooi, C.W.; Gentry, M.S. The 6th International Lafora Epilepsy Workshop: Advances in the search for a cure. Epilepsy Behav. 2021, 119, 107975. [Google Scholar] [CrossRef]
- Sánchez-Elexpuru, G.; Serratosa, J.M.; Sanz, P.; Sánchez, M.P. 4-Phenylbutyric acid and metformin decrease sensitivity to pentylenetetrazol-induced seizures in a malin knockout model of Lafora disease. Neuroreport 2017, 28, 268–271. [Google Scholar] [CrossRef]
- Sánchez-Elexpuru, G.; Serratosa, J.M.; Sánchez, M.P. Sodium selenate treatment improves symptoms and seizure susceptibility in a malin-deficient mouse model of Lafora disease. Epilepsia 2017, 58, 467–475. [Google Scholar] [CrossRef]
- Sinha, P.; Verma, B.; Ganesh, S. Dexamethasone-induced activation of heat shock response ameliorates seizure susceptibility and neuroinflammation in mouse models of Lafora disease. Exp. Neurol. 2021, 340, 113656. [Google Scholar] [CrossRef]
- Sinha, P.; Verma, B.; Ganesh, S. Trehalose Ameliorates Seizure Susceptibility in Lafora Disease Mouse Models by Suppressing Neuroinflammation and Endoplasmic Reticulum Stress. Mol. Neurobiol. 2021, 58, 1088–1101. [Google Scholar] [CrossRef]
- Stewart, A.M.; Braubach, O.; Spitsbergen, J.; Gerlai, R.; Kalueff, A.V. Zebrafish models for translational neuroscience research: From tank to bedside. Trends Neurosci. 2014, 37, 264–278. [Google Scholar] [CrossRef]
- Saleem, S.; Kannan, R.R. Zebrafish: An emerging real-time model system to study Alzheimer’s disease and neurospecific drug discovery. Cell Death Discov. 2018, 4, 45. [Google Scholar] [CrossRef]
- Gawel, K.; Langlois, M.; Martins, T.; van der Ent, W.; Tiraboschi, E.; Jacmin, M.; Crawford, A.D.; Esguerra, C.V. Seizing the moment: Zebrafish epilepsy models. Neurosci. Biobehav. Rev. 2020, 116, 1–20. [Google Scholar] [CrossRef] [PubMed]
- de Abreu, M.S.; Genario, R.; Giacomini, A.C.V.V.; Demin, K.A.; Lakstygal, A.M.; Amstislavskaya, T.G.; Fontana, B.D.; Parker, M.O.; Kalueff, A.V. Zebrafish as a Model of Neurodevelopmental Disorders. Neuroscience 2020, 445, 3–11. [Google Scholar] [CrossRef] [PubMed]
- Liu, J.; Zhou, Y.; Qi, X.; Chen, J.; Chen, W.; Qiu, G.; Wu, Z.; Wu, N. CRISPR/Cas9 in zebrafish: An efficient combination for human genetic diseases modeling. Hum. Genet. 2017, 136, 1–12. [Google Scholar] [CrossRef]
- Ganesh, S.; Agarwala, K.L.; Amano, K.; Suzuki, T.; Delgado-Escueta, A.V.; Yamakawa, K. Regional and developmental expression of Epm2a gene and its evolutionary conservation. Biochem. Biophys. Res. Commun. 2001, 283, 1046–1053. [Google Scholar] [CrossRef]
- Puri, R.; Suzuki, T.; Yamakawa, K.; Ganesh, S. Dysfunctions in endosomal–lysosomal and autophagy pathways underlie neuropathology in a mouse model for Lafora disease. Hum. Mol. Genet. 2012, 21, 175–184. [Google Scholar] [CrossRef]
- Duran, J.; Gruart, A.; García-Rocha, M.; Delgado-García, J.M.; Guinovart, J.J. Glycogen accumulation underlies neurodegeneration and autophagy impairment in Lafora disease. Hum. Mol. Genet. 2014, 23, 3147–3156. [Google Scholar] [CrossRef]
- Jung, C.H.; Ro, S.H.; Cao, J.; Otto, N.M.; Kim, D.H. mTOR regulation of autophagy. FEBS Lett. 2010, 584, 1287–1295. [Google Scholar] [CrossRef]
- Zhao, E.; Czaja, M.J. Transcription factor EB: A central regulator of both the autophagosome and lysosome. Hepatology 2012, 55, 1632–1634. [Google Scholar] [CrossRef]
- Kaur, S.; Changotra, H. The beclin 1 interactome: Modification and roles in the pathology of autophagy-related disorders. Biochimie 2020, 175, 34–49. [Google Scholar] [CrossRef]
- Glick, D.; Barth, S.; Macleod, K.F. Autophagy: Cellular and molecular mechanisms. J. Pathol. 2010, 221, 3–12. [Google Scholar] [CrossRef]
- Lee, H.J.; Yoon, Y.S.; Lee, S.J. Mechanism of neuroprotection by trehalose: Controversy surrounding autophagy induction. Cell Death Dis. 2018, 9, 1–12. [Google Scholar] [CrossRef]
- Rusmini, P.; Cortese, K.; Crippa, V.; Cristofani, R.; Cicardi, M.E.; Ferrari, V.; Vezzoli, G.; Tedesco, B.; Meroni, M.; Messi, E.; et al. Trehalose induces autophagy via lysosomal-mediated TFEB activation in models of motoneuron degeneration. Autophagy 2019, 15, 631–651. [Google Scholar] [CrossRef] [PubMed]
- Sarkar, S.; Davies, J.E.; Huang, Z.; Tunnacliffe, A.; Rubinsztein, D.C. Trehalose, a novel mTOR-independent autophagy enhancer, accelerates the clearance of mutant huntingtin and α-synuclein. J. Biol. Chem. 2007, 282, 5641–5652. [Google Scholar] [CrossRef] [PubMed]
- Brewer, M.K.; Uittenbogaard, A.; Austin, G.L.; Segvich, D.M.; Roach, P.J.; Mccarthy, J.J.; Simmons, Z.R.; Jason, A.; Zhou, Z.; Zeller, J.; et al. Targeting Pathogenic Lafora Bodies in Lafora Disease Using an Antibody-Enzyme Fusion. Cell Metab. 2019, 30, 689–705. [Google Scholar] [CrossRef] [PubMed]
- Zhou, Z.; Austin, G.L.; Shaffer, R.; Armstrong, D.D.; Gentry, M.S. Antibody-Mediated Enzyme Therapeutics and Applications in Glycogen Storage Diseases. Trends Mol. Med. 2019, 25, 1094–1109. [Google Scholar] [CrossRef] [PubMed]
- Austin, G.L.; Simmons, Z.R.; Klier, J.E.; Rondon, A.; Hodges, B.L.; Shaffer, R.; Aziz, N.M.; McKnight, T.R.; Pauly, J.R.; Armstrong, D.D.; et al. Central Nervous System Delivery and Biodistribution Analysis of an Antibody-Enzyme Fusion for the Treatment of Lafora Disease. Mol. Pharm. 2019, 16, 3791–3801. [Google Scholar] [CrossRef]
- Ahonen, S.; Nitschke, S.; Grossman, T.R.; Kordasiewicz, H.; Wang, P.; Zhao, X.; Guisso, D.R.; Kasiri, S.; Nitschke, F.; Minassian, B.A. Gys1 antisense therapy rescues neuropathological bases of murine Lafora disease. Brain 2021, 144, 2985–2993. [Google Scholar] [CrossRef]
- Vemana, H.P.; Saraswat, A.; Bhutkar, S.; Patel, K.; Dukhande, V.V. A novel gene therapy for neurodegenerative Lafora disease via EPM2A-loaded DLinDMA lipoplexes. Nanomedicine 2021, 16, 1081–1095. [Google Scholar] [CrossRef]
- Ibrahim, F.; Murr, N. Lafora Disease. StatPearls. [Internet] Treasure Isl. StatPearls Publ. 2021. Available online: https://www.ncbi.nlm.nih.gov/books/NBK482229 (accessed on 25 July 2021).
- Ganesh, S.; Delgado-Escueta, A.V.; Sakamoto, T.; Avila, M.R.; Machado-Salas, J.; Hoshii, Y.; Akagi, T.; Gomi, H.; Suzuki, T.; Amano, K.; et al. Targeted disruption of the Epm2a gene causes formation of Lafora inclusion bodies, neurodegeneration, ataxia, myoclonus epilepsy and impaired behavioral response in mice. Hum. Mol. Genet. 2002, 11, 1251–1262. [Google Scholar] [CrossRef]
- García-Cabrero, A.M.; Marinas, A.; Guerrero, R.; De Córdoba, S.R.; Serratosa, J.M.; Sánchez, M.P. Laforin and malin deletions in mice produce similar neurologic impairments. J. Neuropathol. Exp. Neurol. 2012, 71, 413–421. [Google Scholar] [CrossRef]
- Gayarre, J.; Duran-Trío, L.; Criado Garcia, O.; Aguado, C.; Juana-López, L.; Crespo, I.; Knecht, E.; Bovolenta, P.; Rodríguez De Córdoba, S. The phosphatase activity of laforin is dispensable to rescue Epm2a–/–mice from lafora disease. Brain 2014, 137, 806–818. [Google Scholar] [CrossRef] [PubMed]
- Seki, T.; Takahashi, H.; Adachi, N.; Abe, N.; Shimahara, T.; Saito, N.; Sakai, N. Aggregate formation of mutant protein kinase C gamma found in spinocerebellar ataxia type 14 impairs ubiquitin-proteasome system and induces endoplasmic reticulum stress. Eur. J. Neurosci. 2007, 26, 3126–3140. [Google Scholar] [CrossRef] [PubMed]
- Wang, Y.; Liu, Y.; Wu, C.; Zhang, H.; Zheng, X.; Zheng, Z.; Geiger, T.L.; Nuovo, G.J.; Liu, Y.; Zheng, P. Epm2a suppresses tumor growth in an immunocompromised host by inhibiting Wnt signaling. Cancer Cell 2006, 10, 179–190. [Google Scholar] [CrossRef] [PubMed]
- Machado-Salas, J.; Avila-Costa, M.R.; Guevara, P.; Guevara, J.; Durón, R.M.; Bai, D.; Tanaka, M.; Yamakawa, K.; Delgado-Escueta, A.V. Ontogeny of Lafora bodies and neurocytoskeleton changes in Laforin-deficient mice. Exp. Neurol. 2012, 236, 131–140. [Google Scholar] [CrossRef] [PubMed][Green Version]
- Song, W.M.; Colonna, M. The identity and function of microglia in neurodegeneration. Nat. Immunol. 2018, 274, 1048–1058. [Google Scholar] [CrossRef] [PubMed]
- Wang, W.; Tan, M.; Yu, J.; Tan, L. Role of pro-inflammatory cytokines released from microglia in Alzheimer’s disease. Ann. Transl. Med. 2015, 3, 136. [Google Scholar] [CrossRef]
- Akiyama, H.; Nishimura, T.; Kondo, H.; Ikeda, K.; Hayashi, Y.; McGeer, P.L. Expression of the receptor for macrophage colony stimulating factor by brain microglia and its upregulation in brains of patients with Alzheimer’s disease and amyotrophic lateral sclerosis. Brain Res. 1994, 639, 171–174. [Google Scholar] [CrossRef]
- Otero, K.; Turnbull, I.R.; Poliani, P.L.; Vermi, W.; Cerutti, E.; Aoshi, T.; Tassi, I.; Takai, T.; Stanley, S.L.; Miller, M.; et al. Macrophage colony-stimulating factor induces the proliferation and survival of macrophages via a pathway involving DAP12 and b -catenin. Nat. Immunol. 2009, 10, 734–743. [Google Scholar] [CrossRef]
- Wright, A.L.; Zinn, R.; Hohensinn, B.; Konen, L.M.; Beynon, S.B.; Tan, R.P.; Clark, I.A.; Abdipranoto, A.; Vissel, B. Neuroinflammation and Neuronal Loss Precede Aβ Plaque Deposition in the hAPP-J20 Mouse Model of Alzheimer’s Disease. PLoS ONE 2013, 8, e59856. [Google Scholar] [CrossRef]
- Cherry, J.D.; Olschowka, J.A.; O’Banion, M.K. Neuroinflammation and M2 microglia: The good, the bad and the inflamed. J. Neuroinflammation 2014, 11, 98. [Google Scholar] [CrossRef]
- Illes, P.; Rubini, P.; Ulrich, H.; Zhao, Y.; Tang, Y. Regulation of Microglial Functions by Purinergic Mechanisms in the Healthy and Diseased CNS. Cells 2020, 9, 1108. [Google Scholar] [CrossRef]
- Rivera, A.; Vanzulli, I.; Butt, A.M. A central role for ATP signaling in glial interactions in the CNS. Curr. Drug Targets 2016, 17, 1829–1833. [Google Scholar] [CrossRef] [PubMed]
- Fekete, R.; Cserép, C.; Lénárt, N.; Tóth, K.; Orsolits, B.; Martinecz, B.; Méhes, E.; Szabó, B.; Németh, V.; Gönci, B.; et al. Microglia control the spread of neurotropic virus infection via P2Y12 signalling and recruit monocytes through P2Y12-independent mechanisms. Acta Neuropathol. 2018, 136, 461–482. [Google Scholar] [CrossRef] [PubMed]
- Gómez Morillas, A.; Besson, V.C.; Lerouet, D. Microglia and Neuroinflammation: What Place for P2RY12? Int. J. Mol. Sci. 2021, 22, 1636. [Google Scholar] [CrossRef] [PubMed]
- Keilani, S.; Lun, Y.; Stevens, A.C.; Williams, H.N.; Sjoberg, E.R.; Khanna, R.; Valenzano, K.J.; Checler, F.; Buxbaum, J.D.; Yanagisawa, K.; et al. Lysosomal Dysfunction in a Mouse Model of Sandhoff Disease Leads to Accumulation of Ganglioside-Bound Amyloid-β Peptide. J. Neurosci. 2012, 32, 5223–5236. [Google Scholar] [CrossRef]
- Walker, D.G. Defining activation states of microglia in human brain tissue: An unresolved issue for Alzheimer’s disease. Neuroimmunol. Neuroinflamm. 2020, 7, 194–214. [Google Scholar] [CrossRef]
- Keren-Shaul, H.; Spinrad, A.; Weiner, A.; Matcovitch-Natan, O.; Dvir-Szternfeld, R.; Ulland, T.K.; David, E.; Baruch, K.; Lara-Astaiso, D.; Toth, B.; et al. A Unique Microglia Type Associated with Restricting Development of Alzheimer’s Disease. Cell 2017, 169, 1276–1290. [Google Scholar] [CrossRef]
- Rangaraju, S.; Dammer, E.B.; Raza, S.A.; Gao, T.; Xiao, H.; Betarbet, R.; Duong, D.M.; Webster, J.A.; Hales, C.M.; Lah, J.J.; et al. Quantitative proteomics of acutely-isolated mouse microglia identifies novel immune Alzheimer’s disease-related proteins. Mol. Neurodegener. 2018, 13, 34. [Google Scholar] [CrossRef]
- Duran, J.; Hervera, A.; Markussen, K.H.; Varea, O.; López-Soldado, I.; Sun, R.C.; Del Río, J.A.; Gentry, M.S.; Guinovart, J.J. Astrocytic glycogen accumulation drives the pathophysiology of neurodegeneration in Lafora disease. Brain 2021, 144, 2349–2360. [Google Scholar] [CrossRef]
- Sicca, F.; Ambrosini, E.; Marchese, M.; Sforna, L.; Servettini, I.; Valvo, G.; Brignone, M.S.; Lanciotti, A.; Moro, F.; Grottesi, A.; et al. Gain-of-function defects of astrocytic Kir4.1 channels in children with autism spectrum disorders and epilepsy. Sci. Rep. 2016, 6, 34325. [Google Scholar] [CrossRef]
- D’Adamo, M.C.; Catacuzzeno, L.; Di Giovanni, G.; Franciolini, F.; Pessia, M. K+ channelepsy: Progress in the neurobiology of potassium channels and epilepsy. Front. Cell. Neurosci. 2013, 7, 134. [Google Scholar] [CrossRef]
- Della Vecchia, S.; Marchese, M.; Santorelli, F.M.; Sicca, F. Kir4.1 Dysfunction in the Pathophysiology of Depression: A Systematic Review. Cells 2021, 10, 2628. [Google Scholar] [CrossRef]
- Scheib, J.; Byrd-jacobs, C. Zebrafish Astroglial Morphology in the Olfactory Bulb Is Altered with Repetitive Peripheral Damage. Front. Neuroanat. 2020, 14, 4. [Google Scholar] [CrossRef]
- Jurisch-Yaksi, N.; Yaksi, E.; Kizil, C. Radial glia in the zebrafish brain: Functional, structural and physiological comparison with the mammalian glia. Glia 2020, 68, 2451–2470. [Google Scholar] [CrossRef]
- Wager, K.; Zdebik, A.A.; Fu, S.; Cooper, J.D.; Harvey, R.J.; Russell, C. Neurodegeneration and Epilepsy in a Zebrafish Model of CLN3 Disease (Batten Disease). PLoS ONE 2016, 11, e0157365. [Google Scholar] [CrossRef]
- Bhattarai, P.; Thomas, A.K.; Cosacak, M.I.; Papadimitriou, C.; Mashkaryan, V.; Froc, C.; Reinhardt, S.; Kurth, T.; Dahl, A.; Zhang, Y.; et al. IL4/STAT6 Signaling Activates Neural Stem Cell Proliferation and Neurogenesis upon Amyloid-β42 Aggregation in Adult Zebrafish Brain. Cell Rep. 2016, 17, 941–948. [Google Scholar] [CrossRef]
- Klionsky, D.J.; Abdel-Aziz, A.K.; Abdelfatah, S.; Abdellatif, M.; Abdoli, A.; Abel, S.; Abeliovich, H.; Abildgaard, M.H.; Abudu, Y.P.; Acevedo-Arozena, A.; et al. Guidelines for the use and interpretation of assays for monitoring autophagy (4th edition). Autophagy 2021, 17, 1–382. [Google Scholar] [CrossRef]
- Adams, J.; Feuerborn, M.; Molina, J.A.; Wilden, A.R.; Adhikari, B.; Budden, T.; Lee, S.Y. Autophagy–lysosome pathway alterations and alpha-synuclein up-regulation in the subtype of neuronal ceroid lipofuscinosis, CLN5 disease. Sci. Rep. 2019, 9, 151. [Google Scholar] [CrossRef]
- Kimura, S.; Fujita, N.; Noda, T.; Yoshimori, T. Monitoring autophagy in mammalian cultured cells through the dynamics of LC3. Meth. Enzymol. 2009, 452, 1–12. [Google Scholar] [CrossRef]
- Cortes, C.J.; La Spada, A.R. TFEB dysregulation as a driver of autophagy dysfunction in neurodegenerative disease: Molecular mechanisms, cellular processes, and emerging therapeutic opportunities. Neurobiol. Dis. 2019, 122, 83–93. [Google Scholar] [CrossRef]
- Sardiello, M.; Palmieri, M.; di Ronza, A.; Medina, D.L.; Valenza, M.; Gennarino, V.A.; Di Malta, C.; Donaudy, F.; Embrione, V.; Polishchuk, R.S.; et al. A gene network regulating lysosomal biogenesis and function. Science 2009, 325, 473–477. [Google Scholar] [CrossRef] [PubMed]
- Martina, J.A.; Chen, Y.; Gucek, M.; Puertollano, R. MTORC1 functions as a transcriptional regulator of autophagy by preventing nuclear transport of TFEB. Autophagy 2012, 8, 903–914. [Google Scholar] [CrossRef] [PubMed]
- Khalifeh, M.; Barreto, G.E.; Sahebkar, A. Therapeutic potential of trehalose in neurodegenerative diseases: The knowns and unknowns. Neural. Regen. Res. 2021, 16, 2026–2027. [Google Scholar] [CrossRef]
- Xu, C.; Chen, X.; Sheng, W.B.; Yang, P. Trehalose restores functional autophagy suppressed by high glucose. Reprod. Toxicol. 2019, 85, 51–58. [Google Scholar] [CrossRef]
- Westerfield, M. The Zebrafish Book. In A Guide for the Laboratory Use of Zebrafish (Danio Rerio), 4th ed.; University of Oregon Press: Eugene, OR, USA, 2000. [Google Scholar]
- Varshney, G.K.; Carrington, B.; Pei, W.; Bishop, K.; Chen, Z.; Fan, C.; Xu, L.; Jones, M.; LaFave, M.C.; Ledin, J.; et al. A high-throughput functional genomics workflow based on CRISPR/Cas9-mediated targeted mutagenesis in zebrafish. Nat. Protoc. 2016, 11, 2357–2375. [Google Scholar] [CrossRef] [PubMed]
- Rupprecht, P.; Prendergast, A.; Wyart, C.; Friedrich, R.W. Remote z-scanning with a macroscopic voice coil motor for fast 3D multiphoton laser scanning microscopy. Biomed. Opt. Express 2016, 7, 1656–1671. [Google Scholar] [CrossRef] [PubMed]
- Thisse, C.; Thisse, B. High-resolution in situ hybridization to whole-mount zebrafish embryos. Nat. Protoc. 2008, 3, 59–69. [Google Scholar] [CrossRef] [PubMed]
- Müller, J.S.; Burns, D.T.; Griffin, H.; Wells, G.R.; Zendah, R.A.; Munro, B.; Schneider, C.; Horvath, R. RNA exosome mutations in pontocerebellar hypoplasia alter ribosome biogenesis and p53 levels. Life Sci. Alliance 2020, 3, 1–17. [Google Scholar] [CrossRef]
- Marchese, M.; Pappalardo, A.; Baldacci, J.; Verri, T.; Doccini, S.; Cassandrini, D.; Bruno, C.; Fiorillo, C.; Garcia-Gil, M.; Bertini, E.; et al. Dolichol-phosphate mannose synthase depletion in zebrafish leads to dystrophic muscle with hypoglycosylated α-dystroglycan. Biochem. Biophys. Res. Commun. 2016, 477, 137–143. [Google Scholar] [CrossRef]
- Livak, K.J.; Schmittgen, T.D. Analysis of relative gene expression data using real-time quantitative PCR and the 2 (-Delta Delta C(T)) method. Methods 2001, 25, 402–408. [Google Scholar] [CrossRef]
- Di Nottia, M.; Marchese, M.; Verrigni, D.; Mutti, C.D.; Torraco, A.; Oliva, R.; Fernandez-Vizarra, E.; Morani, F.; Trani, G.; Rizza, T.; et al. A homozygous MRPL24 mutation causes a complex movement disorder and affects the mitoribosome assembly. Neurobiol. Dis. 2020, 141, 104880. [Google Scholar] [CrossRef] [PubMed]
- D’Amore, A.; Tessa, A.; Naef, V.; Bassi, M.T.; Citterio, A.; Romaniello, R.; Fichi, G.; Galatolo, D.; Mero, S.; Battini, R.; et al. Loss of ap4s1 in zebrafish leads to neurodevelopmental defects resembling spastic paraplegia 52. Ann. Clin. Transl. Neurol. 2020, 7, 584–589. [Google Scholar] [CrossRef] [PubMed]
- Bragato, C.; Carra, S.; Blasevich, F.; Salerno, F.; Brix, A.; Bassi, A.; Beltrame, M.; Cotelli, F.; Maggi, L.; Mantegazza, R.; et al. Glycogen storage in a zebrafish Pompe disease model is reduced by 3-BrPA treatment. Biochim. Biophys. Acta Mol. Basis Dis. 2020, 1866, 165662. [Google Scholar] [CrossRef] [PubMed]
- Sabaliauskas, N.A.; Foutz, C.A.; Mest, J.R.; Budgeon, L.R.; Sidor, A.T.; Gershenson, J.A.; Joshi, S.B.; Cheng, K.C. High-throughput zebrafish histology. Methods 2006, 39, 246–254. [Google Scholar] [CrossRef] [PubMed]
- Kani, S.; Bae, Y.K.; Shimizu, T.; Tanabe, K.; Satou, C.; Parsons, M.J.; Scott, E.; Higashijima, S.I.; Hibi, M. Proneural gene-linked neurogenesis in zebrafish cerebellum. Dev. Biol. 2010, 343, 1–17. [Google Scholar] [CrossRef] [PubMed]
- Xia, Q.; Wei, L.; Zhang, Y.; Kong, H.; Shi, Y.; Wang, X.; Chen, X.; Han, L.; Liu, K. Psoralen Induces Developmental Toxicity in Zebrafish Embryos/Larvae Through Oxidative Stress, Apoptosis, and Energy Metabolism Disorder. Front. Pharmacol. 2018, 9, 1457. [Google Scholar] [CrossRef] [PubMed]
- Namikawa, K.; Dorigo, A.; Zagrebelsky, M.; Russo, G.; Kirmann, T.; Fahr, W.; Dübel, S.; Korte, M.; Köster, R.W. Modeling neurodegenerative spinocerebellar ataxia type 13 in zebrafish using a Purkinje neuron specific tunable coexpression system. J. Neurosci. 2019, 39, 3948–3969. [Google Scholar] [CrossRef]
- Baraban, S.C. Forebrain electrophysiological recording in larval zebrafish. J. Vis. Exp. 2013, 50104. [Google Scholar] [CrossRef]
- Cozzolino, O.; Sicca, F.; Paoli, E.; Trovato, F.; Santorelli, F.M.; Ratto, G.M.; Marchese, M. Evolution of Epileptiform Activity in Zebrafish by Statistical-Based Integration of Electrophysiology and 2-Photon Ca2+ Imaging. Cells 2020, 9, 769. [Google Scholar] [CrossRef]
- Hoffmann, H. Violin Plot. MATLAB Central File Exchange. 2022. Available online: https://www.mathworks.com/matlabcentral/fileexchange/45134-violin-plot (accessed on 8 January 2022).


Publisher’s Note: MDPI stays neutral with regard to jurisdictional claims in published maps and institutional affiliations. |
© 2022 by the authors. Licensee MDPI, Basel, Switzerland. This article is an open access article distributed under the terms and conditions of the Creative Commons Attribution (CC BY) license (https://creativecommons.org/licenses/by/4.0/).
Share and Cite
Della Vecchia, S.; Ogi, A.; Licitra, R.; Abramo, F.; Nardi, G.; Mero, S.; Landi, S.; Battini, R.; Sicca, F.; Ratto, G.M.; et al. Trehalose Treatment in Zebrafish Model of Lafora Disease. Int. J. Mol. Sci. 2022, 23, 6874. https://doi.org/10.3390/ijms23126874
Della Vecchia S, Ogi A, Licitra R, Abramo F, Nardi G, Mero S, Landi S, Battini R, Sicca F, Ratto GM, et al. Trehalose Treatment in Zebrafish Model of Lafora Disease. International Journal of Molecular Sciences. 2022; 23(12):6874. https://doi.org/10.3390/ijms23126874
Chicago/Turabian StyleDella Vecchia, Stefania, Asahi Ogi, Rosario Licitra, Francesca Abramo, Gabriele Nardi, Serena Mero, Silvia Landi, Roberta Battini, Federico Sicca, Gian Michele Ratto, and et al. 2022. "Trehalose Treatment in Zebrafish Model of Lafora Disease" International Journal of Molecular Sciences 23, no. 12: 6874. https://doi.org/10.3390/ijms23126874
APA StyleDella Vecchia, S., Ogi, A., Licitra, R., Abramo, F., Nardi, G., Mero, S., Landi, S., Battini, R., Sicca, F., Ratto, G. M., Santorelli, F. M., & Marchese, M. (2022). Trehalose Treatment in Zebrafish Model of Lafora Disease. International Journal of Molecular Sciences, 23(12), 6874. https://doi.org/10.3390/ijms23126874