1. Introduction
Oxidative stress is involved in cell senescence, aging and in many diverse genetic and acquired conditions [
1]. Oxidative stress may be initiated and amplified by a variety of oxygen (O
2) reactive species (ROS), mostly free radicals, i.e., highly reactive chemicals with unpaired electrons [
2].
Biologically relevant ROS derived from O
2 metabolism include superoxide anion radicals (O
2−), hydrogen peroxide (H
2O
2) and hydroxyl radicals (OH
.) [
1]. O
2− is a relatively unreactive species that can interact with other molecules to generate H
2O
2 and other ROS through enzyme- or metal-catalyzed processes [
3]. H
2O
2 is not a free radical, as it lacks unpaired electrons, but diffuses easily through membranes and has a relatively long half-life [
4], allowing H
2O
2 to undergo metal-catalyzed reactions that yield the OH
. radical. OH
. is one of the strongest free radicals and reacts readily with cellular components, including DNA, proteins, lipids and carbohydrates, thus being one of the most potentially damaging ROS [
2].
On the other hand, ROS also serve important regulatory roles, mediated by intercellular and intracellular signaling, including the adaptation to endogenous and exogenous stress and the destruction of invading pathogens [
5].
The role of ROS in bacterial metabolism and stress responses is a very important issue in physiological and pathological processes. ROS are unavoidable byproducts of O
2 exposure and utilization by bacterial cells [
6]. ROS generation under aerobic conditions may induce oxidative stress in bacteria and damage multiple cellular targets, including iron-sulfur clusters, cysteine and methionine protein residues, and DNA [
7].
The gene-dependent regulatory responses to O
2− and H
2O
2 in
E. coli are mostly mediated by the induction of superoxide dismutases (SOD) and catalases, respectively.
E. coli has three SODs, MnSOD (sodA), FeSOD (sodB) and CuZnSOD (sodC), that dismutate O
2− to H
2O
2. Catalases, belonging to the peroxidase family of enzymes, further degrade H
2O
2 to H
2O and O
2 [
6].
E. coli has two catalases, hydroperoxidase I (HPI) and hydroperoxidase II (HPII), encoded by
katG and
katE [
8,
9]. The SOD and catalase genes of
E. coli are members of two important regulators of oxidative stress, the OxyR and the SoxRS regulons, respectively [
10].
Flow cytometry has become a choice method for bacterial research. In bacterial models, fluorescent probes are used in attempts to define the role of ROS production [
11,
12,
13,
14]. However, the detection of ROS is a complex task due to the low concentration, short half-life, and extensive interactions of ROS, as well as the intrinsic limitations of both probes and experimental conditions [
15]. In addition, the efficiency and specificity of different dyes for detecting ROS in vitro have rarely been established with any confidence [
15], much less in bacteria. Such limitations and potential sources of artifacts cause the quantitative measurement of the intracellular generation of ROS to be a difficult challenge, and solving this issue requires the careful design of experiments and the cautious interpretation of the results [
16].
While using bacteria to study oxidative stress may be advantageous, functional cytometric assays in live bacteria are still limited. This is due mostly to the cell wall impairing penetration of vital dyes in bacteria, thus imposing permeabilization procedures. These time-consuming manipulations affect cell physiology and may result in aggregation or cell lysis. In previous studies by our laboratory [
11,
12], we assessed the application of
E. coli B strain as an alternative to permeabilization steps in flow cytometry functional assays.
E. coli B has been and is still extensively used for mutagenic assays [
17,
18,
19,
20], while the
E. coli K12 strain is applied mostly to genetic and biochemical studies. Multi-omic analysis confirmed the different cell-wall and outer-membrane composition of
E.coli B, and predicted this strain to be more favorable for both protein secretion and the uptake of exogenous chemicals [
21]. In accordance with this, our previous work showed that the
E. coli B strain IC188 exhibited more efficient staining with vital fluorochromes than the
E. coli K-12 strain AB1157 while maintaining a similar membrane potential. In addition, we found the IC188 strain to be more sensitive than AB1157 for revealing oxidative stress when challenged with prooxidants, supporting its suitability as a biosensor of oxidative stress [
11,
12].
In order to extend our previous findings, and to provide a suitable bacterial model for the accurate detection of ROS, we characterized two novel biosensors derived from the
E. coli B parental wild type (strain IC188) which are deficient either in the OxyR function (strain IC203) or simultaneously in OxyR, SodA and SodB functions (strain IC5233). Based on these models, we quantified the intracellular levels of ROS by means of flow cytometry using ROS-sensitive fluorescent probes after exposure to three relevant peroxidative xenobiotics, namely hydrogen peroxide (H
2O
2), tert-butyl hydroperoxide (t-BOOH) and cumene hydroperoxide (CHP), differing in solubility and prooxidant mechanisms [
20].
3. Discussion
The aim of the present study was to assess issues of specificity in fluorescent probes and the involvement of different ROS in a relevant model of oxidative stress, based on the action of several exogenous peroxides differing in water or lipid solubility and reactivity. Because of their relevance in oxidative stress studies, we chose to apply the widely used H
2DCF-DA and HE and the relatively new MitoPY1 as ROS-sensitive fluorescent probes in different strains of
E. coli WP2 deficient in key genes for antioxidant defense, namely
oxyR,
sodA and
sodB [
11,
12,
18,
19,
20].
Supplemental Figure S1 shows a scheme of the genetic modifications induced on wildtype strain IC188 to generate the strains IC203 (deficient in oxyR) and IC5233 (deficient in oxyR, sodA and sodB).
The very first point to address in functional cytometry is whether to avoid or quantify the influence of the probes on the experimental system. In the case of oxidative stress, all reduced fluorogenic substrates are subject to auto-oxidation, which usually produces singlet oxygen, superoxide, and by its dismutation, H
2O
2. If the auto-oxidation rate is significant, it may result in the artifactual detection of ROS and higher background, a problem especially important for probes such as HE [
16]. The concentration of the probe is also relevant, as it may affect the stoichiometry of the process under study. In fact, the probes themselves may affect the activity of ROS-producing enzymes [
16]. Finally, fluorescent probes at a high concentration may be toxic to the cells [
16].
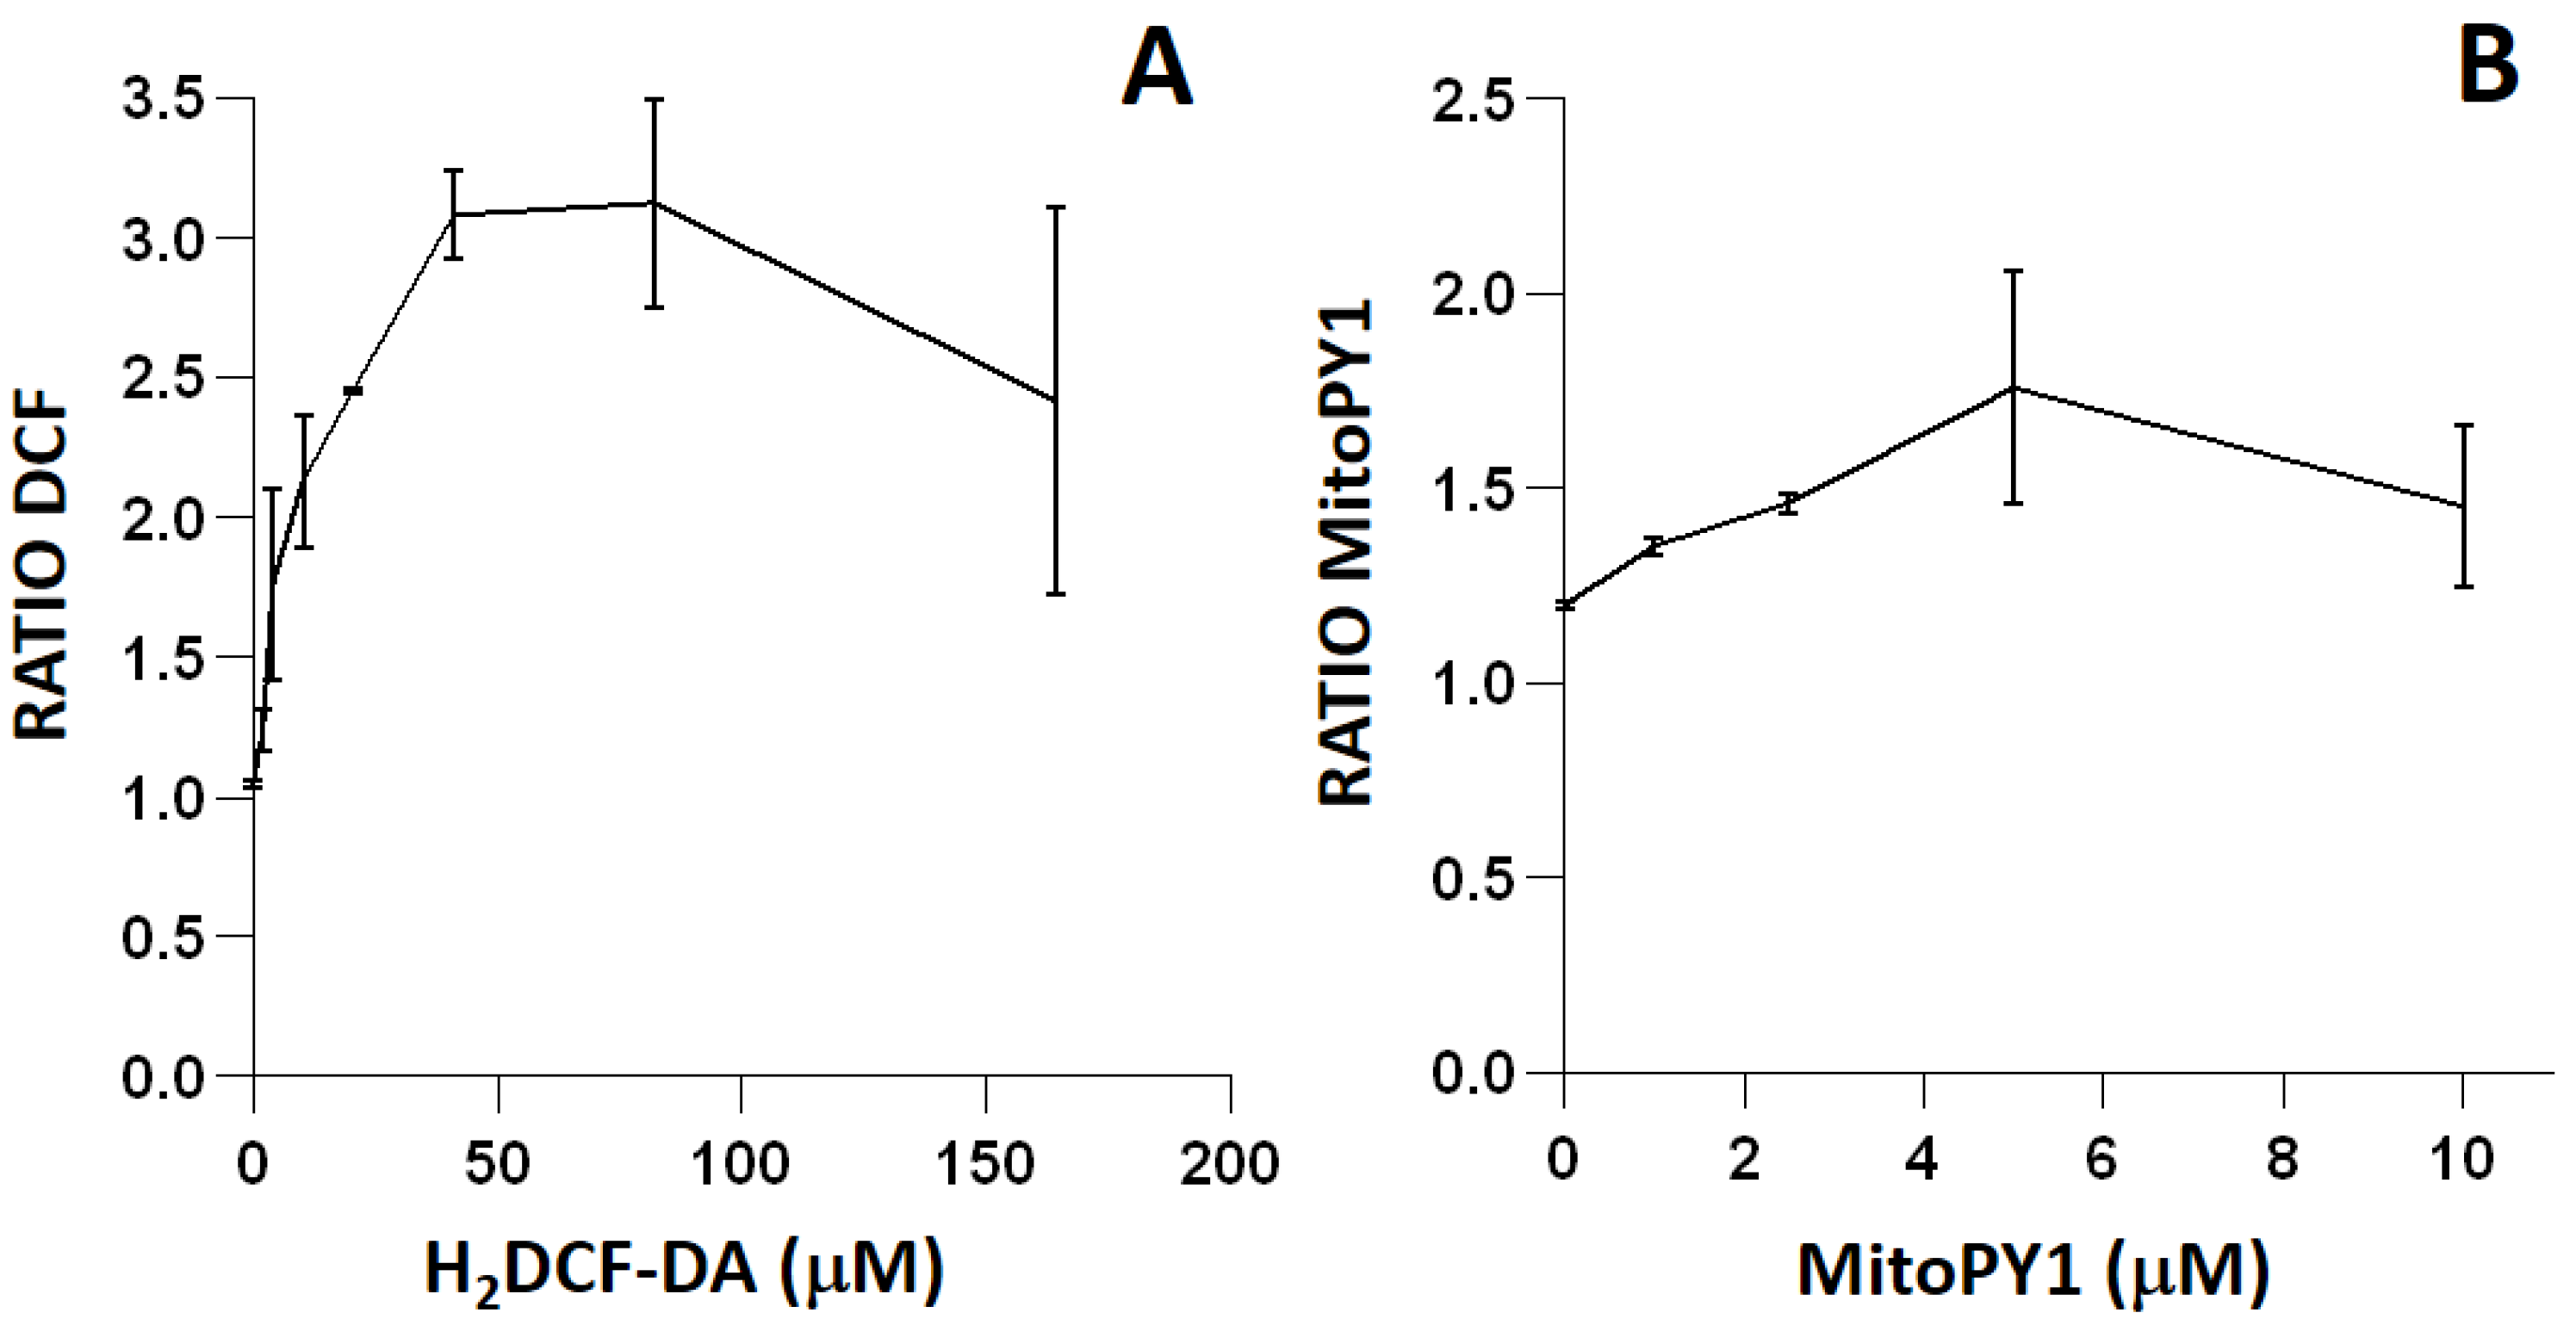
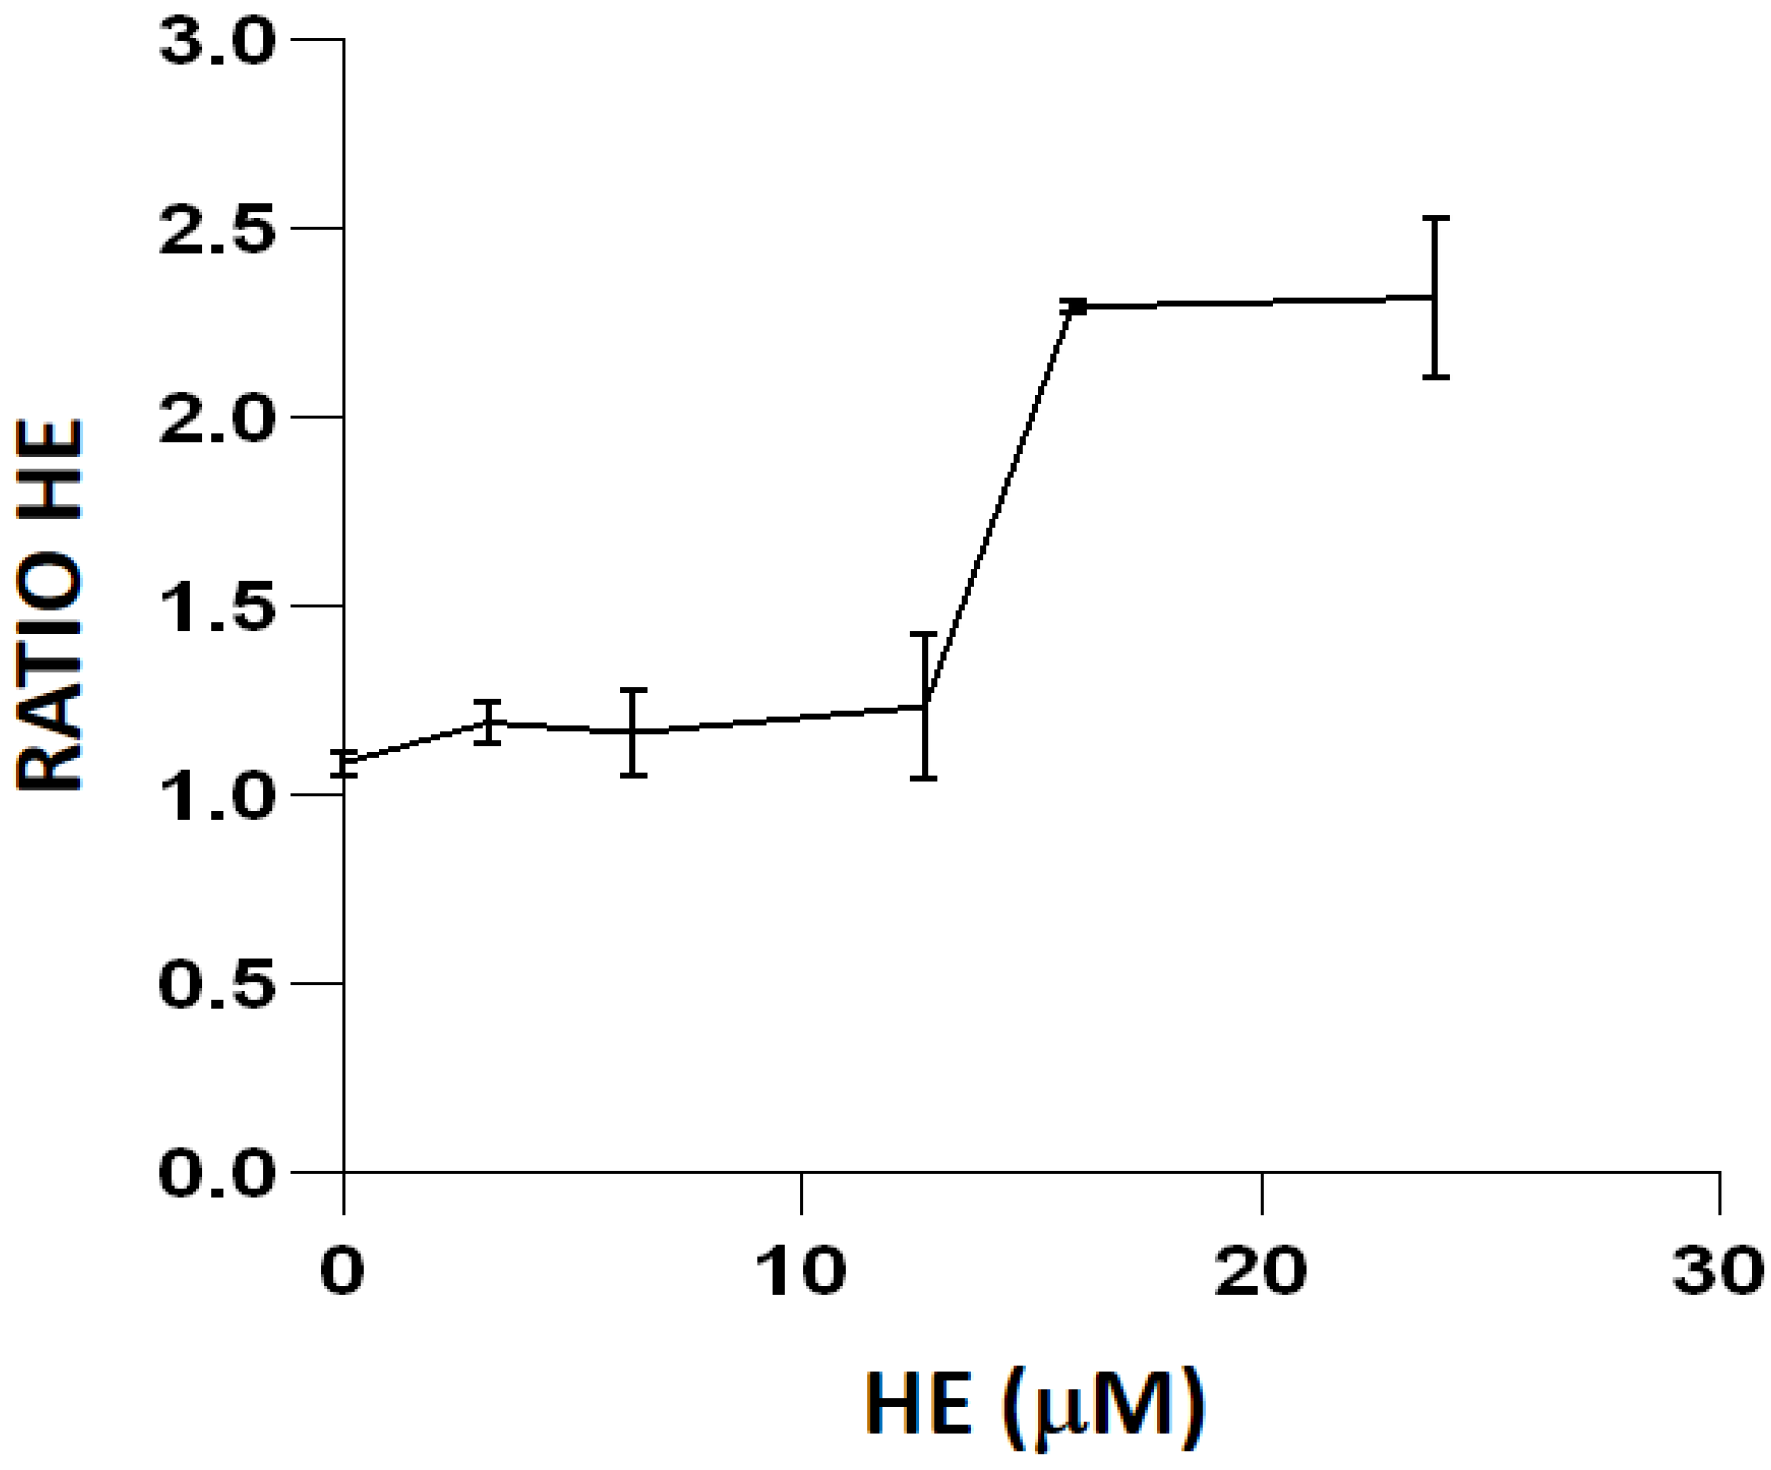
To minimize artifacts derived from an excessive probe concentration, we initially titrated all of the fluorescent reagents used in the study (
Figure 2 and
Figure 3). Fluorochrome titration is an essential procedure when setting up a florescence-based determination in flow cytometry in order to define their optimal concentration for staining [
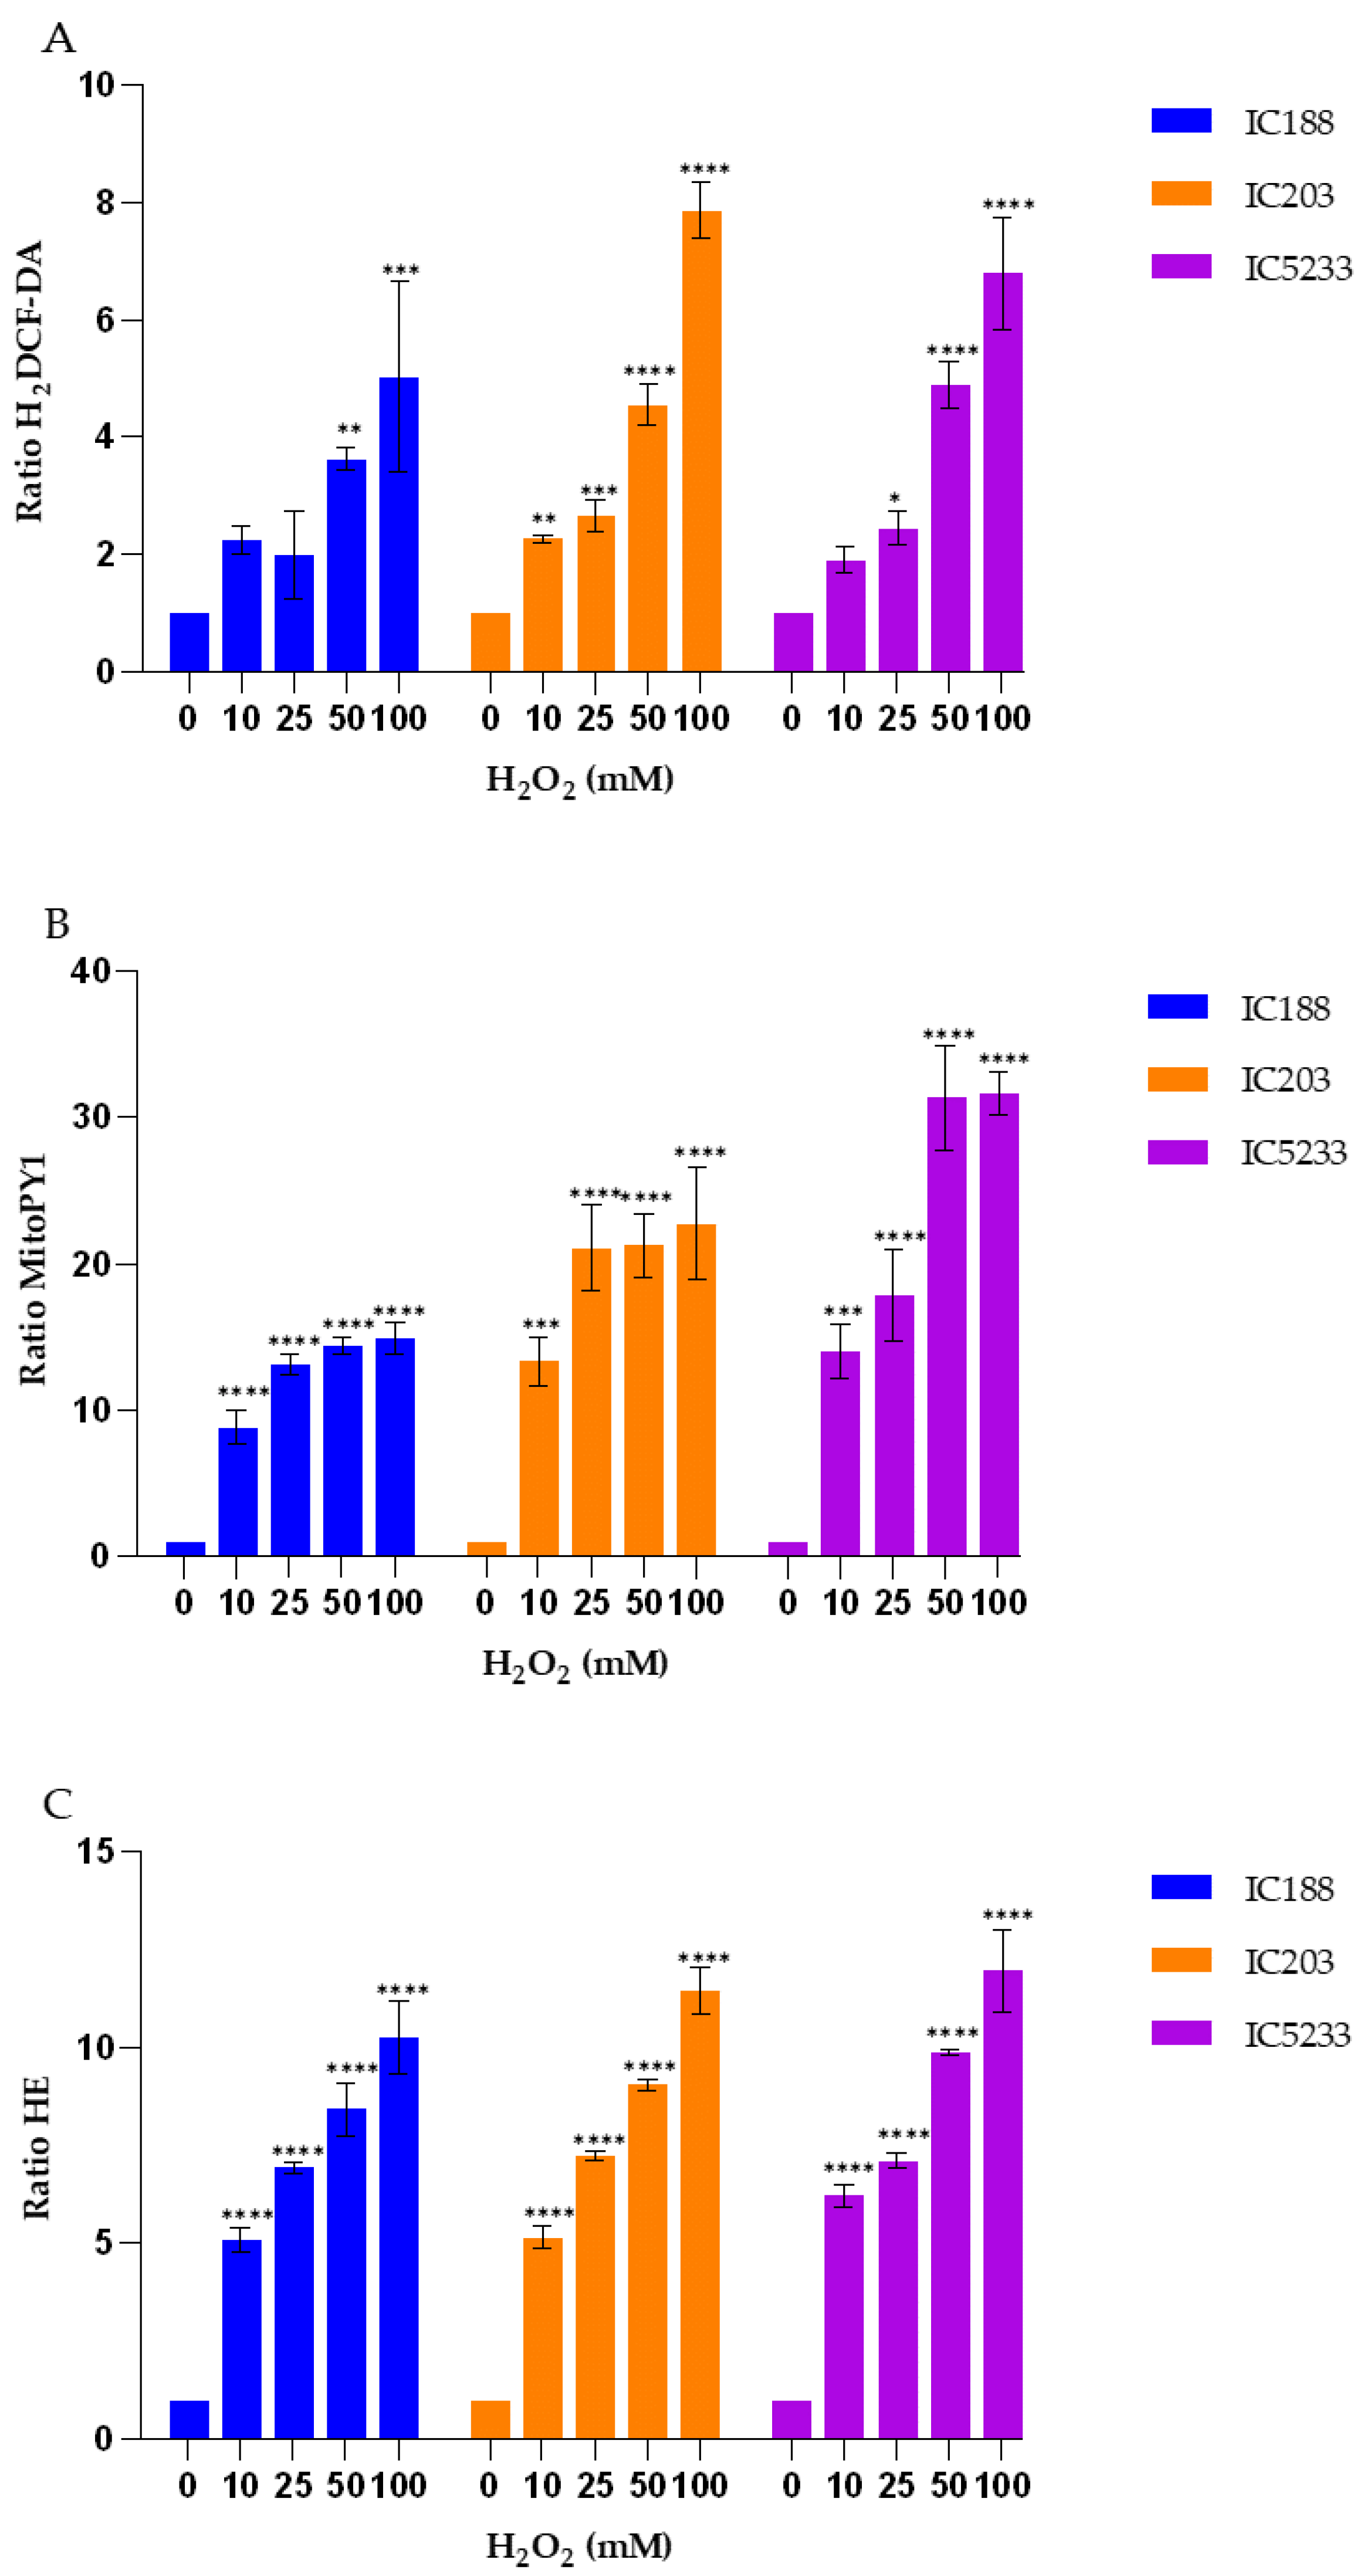
23]. By defining on bacteria the minimal concentration of a given fluorescent probe required for the sensitive detection of a given ROS, we could minimize the non-specific detection of ROS, as demonstrated by the low level of intracellular fluorescence observed in cells not exposed to exogenous peroxides (
Figure 5,
Figure 7 and
Figure 9).
An important point in the study was to determine both the sensitivity and the specificity of the fluorescent probes, as it is becoming evident that probes once considered as specific for a given ROS may indeed react with a variety of ROS and free radical species [
15,
16]. For this purpose, we designed a rational experimental setup made of:
Three E. coli B strains with different capacity for H2O2 and O2− detoxification.
Three exogenous peroxides differing in solubility and reactivity.
Three fluorescent reagents differing in optical properties and specificity for ROS.
A major drawback for flow cytometric studies of bacterial function is the structural barrier of the cell wall that limits the uptake of vital dyes and requires transient or permanent permeabilization [
27]. These manipulations are time consuming and may affect the physiology of the bacterial cell and result in cell aggregation or lysis. Our group developed a series of genetically modified strains of
E. coli B [
18,
19,
20]. As confirmed by multi-omic analysis [
21],
E.coli B strains express constitutively an altered cell-wall lipopolysaccharide resulting in increased membrane permeability, improving the uptake of exogenous chemicals. We have previously shown that flow cytometric analysis of
E. coli B strains is a convenient alternative for cytometric assays of bacterial function [
11,
12].
Oxidative stress responses coordinated by specific regulators ensure bacterial survival during exposure to ROS, either exogenous or generated during normal respiration. OxyR protects
E. coli against normally lethal concentrations of hydrogen peroxide or against thermal killing [
10]. The
oxyR deficiency blocks the synthesis of antioxidant enzymes induced by oxidative stress and results in increased intracellular content of ROS [
10,
18,
19,
20].
Strain IC203, deficient in
oxyR, and its
oxyR proficient parent WP2 uvrA/pKM101 (strain IC188) are the basis for a bacterial reversion assay developed by our group, the WP2 Mutoxitest, applied successfully to evaluate the oxidative mutagenicity of a large series of chemical compounds [
20]. We found that many oxidative mutagens could be recognized by their greater mutagenic response in IC203 than in IC188, including the three peroxides used in our study. Interestingly for our results, this previous study by our group demonstrated that mutagenesis by t-BOOH and CHP was not inhibited by catalase, indicating that secondary H
2O
2 generation was not involved in the oxidative mechanisms of these organic hydroperoxides [
20]. These results are consistent with the higher sensitivity and specificity of the MitoPY1 probe for the detection of H
2O
2, as supported by its very low capacity for the organic hydroperoxides, as shown in
Figure 5,
Figure 7 and
Figure 9. Indeed, MitoPY1 is a chemoselective fluorescent indicator of the arylboronate family, with improved selectivity for H
2O
2 over other ROS based on the selective H
2O
2-mediated transformation of arylboronates to phenols [
28,
29]. Thus, our overall data obtained with the IC203 strain allow us to extend the specificity of MitoPY1 to H
2O
2 already reported with mammalian cells [
30] to a controlled bacterial model of intracellular peroxidative activity.
On the other hand, the results presented in
Figure 5,
Figure 7 and
Figure 9 confirm the caveats regarding H
2DCF-DA, a fluorescent probe most widely used for detecting intracellular oxidative stress [
16]. Intracellular H
2DCF is assumed traditionally to be oxidized by H
2O
2 and organic peroxides and has been used for assaying peroxides. However, H
2DCF does not react directly with H
2O
2 in the absence of peroxidases, and the intracellular fluorescence of its product DCF is not a direct measure of H
2O
2 [
15,
31]. Even if H
2DCF oxidation also occurs by means of the action of H
2O
2 or O
2− in the presence of Fe
2+, the strong OH
. radical species is responsible for such oxidation. This is in accordance with the fact that in the IC203 strain, catalase-sensitive oxidative mutagens were poor inducers of mutations derived from 8-oxoguanine lesions, whereas organic hydroperoxides efficiently induced such mutations [
20].
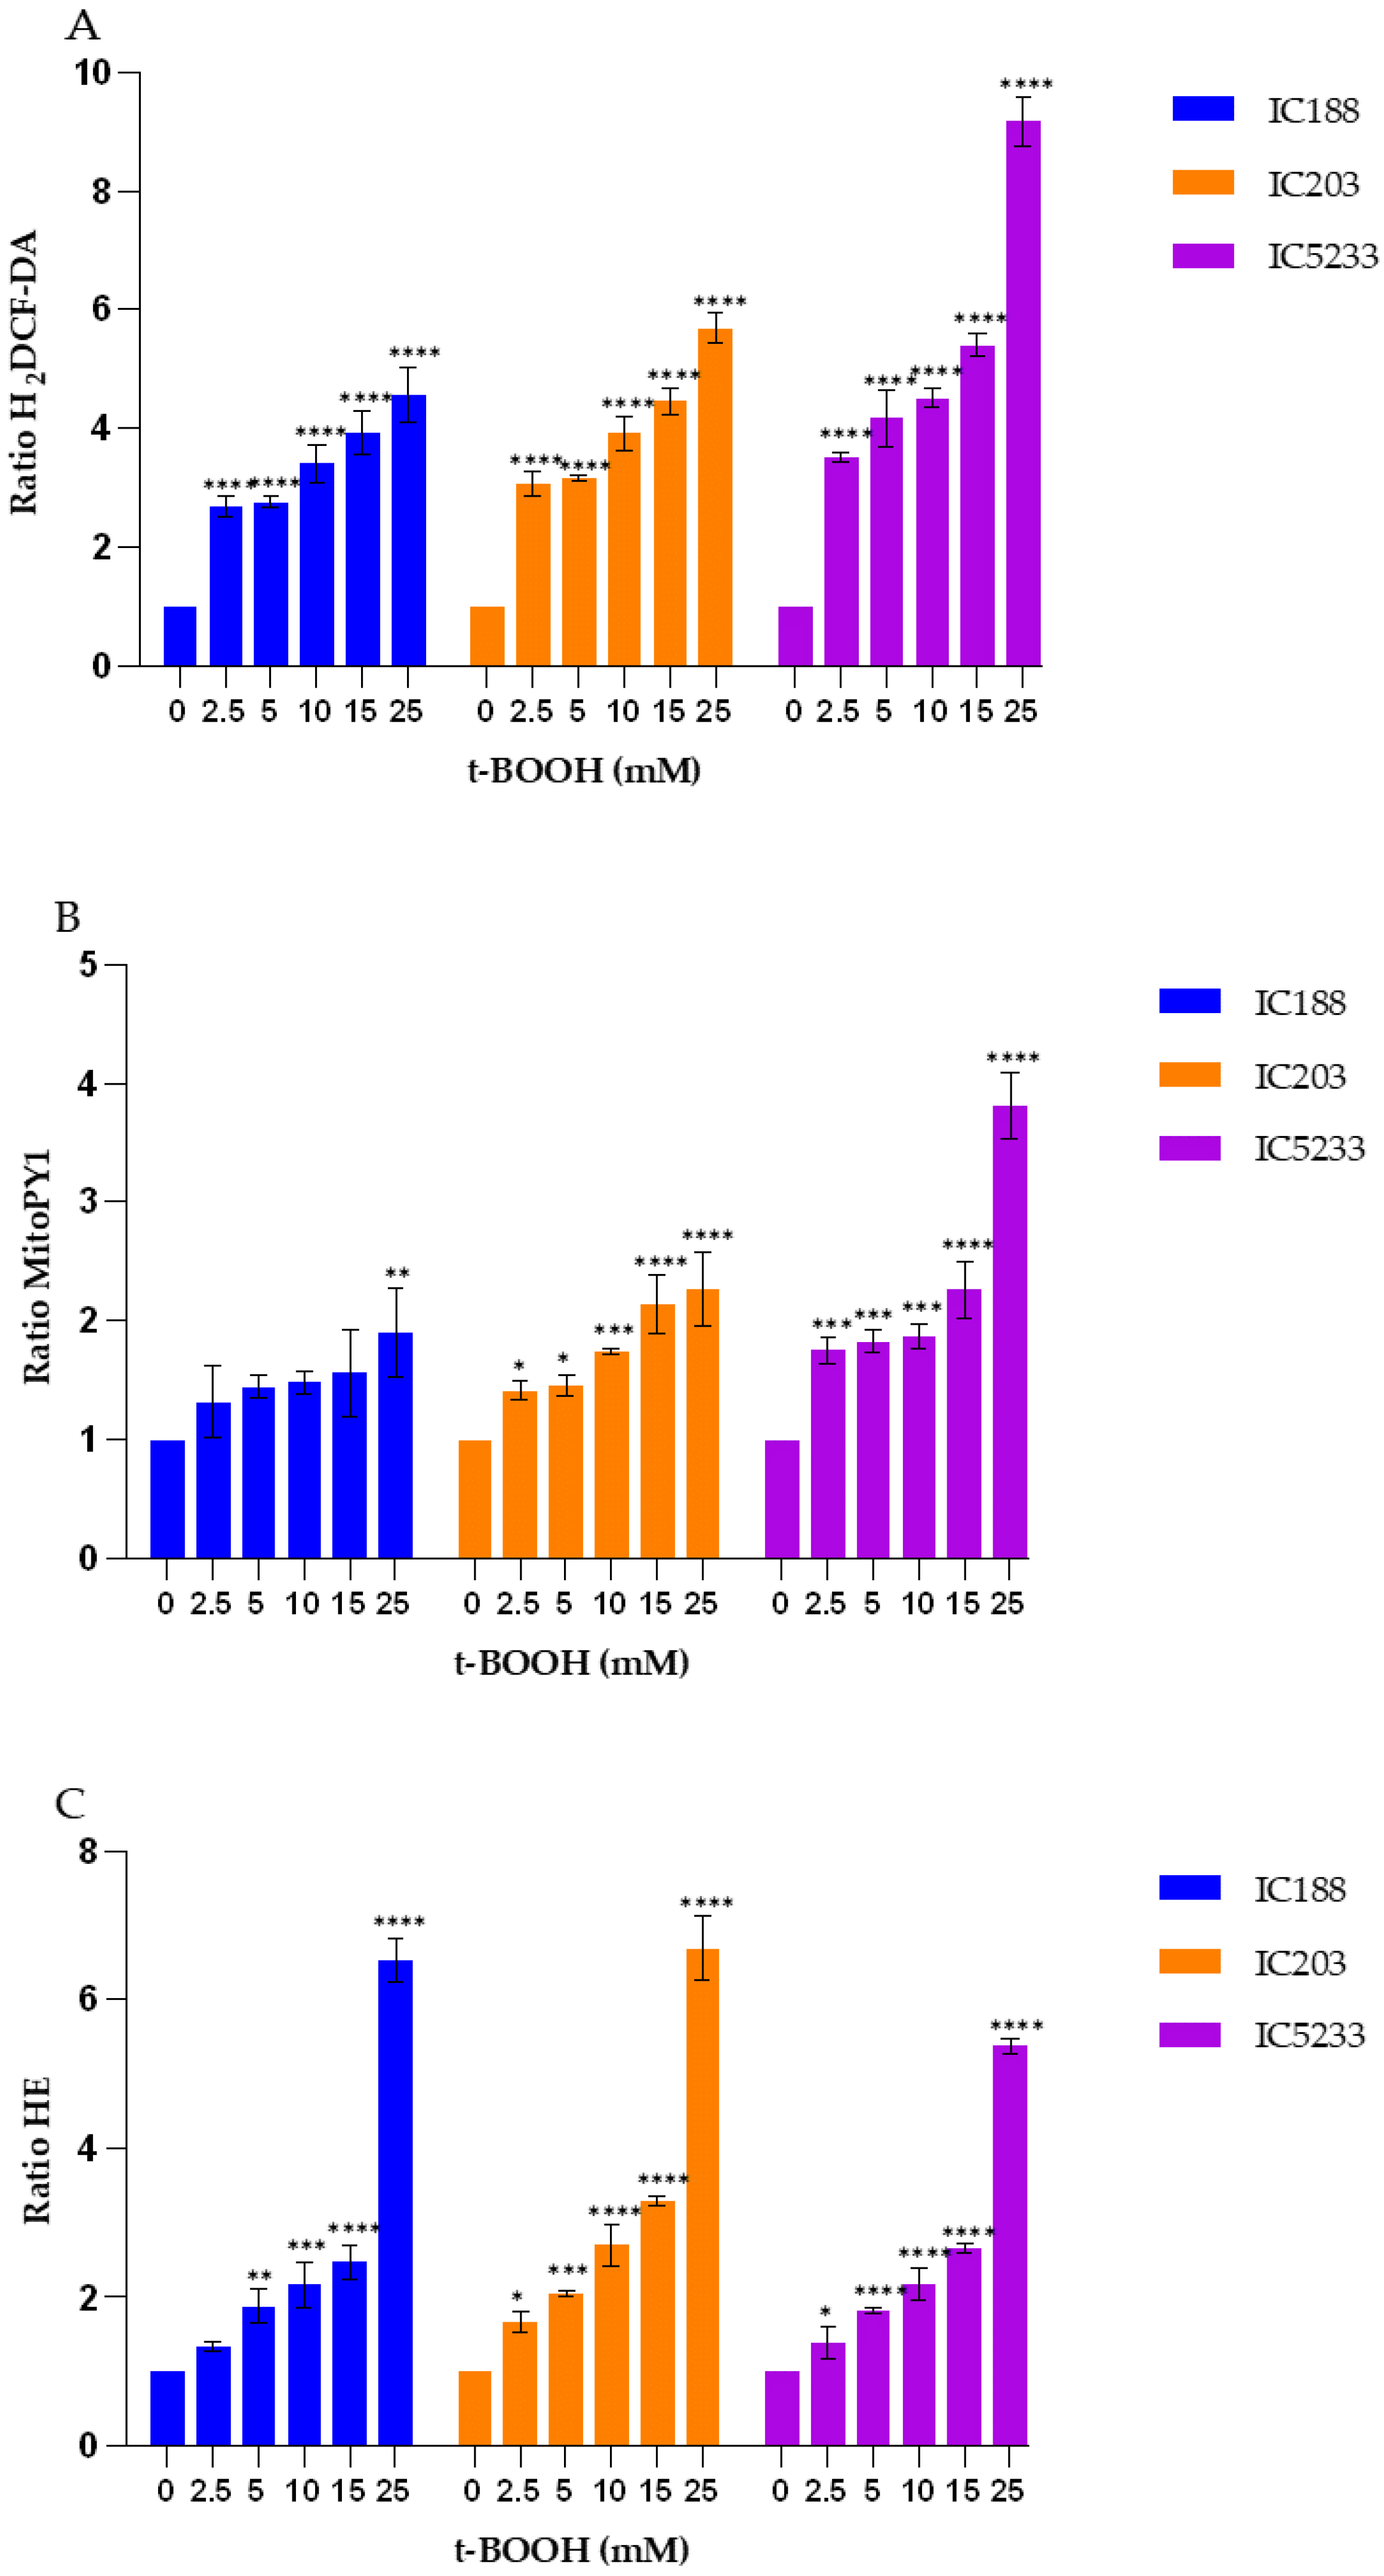
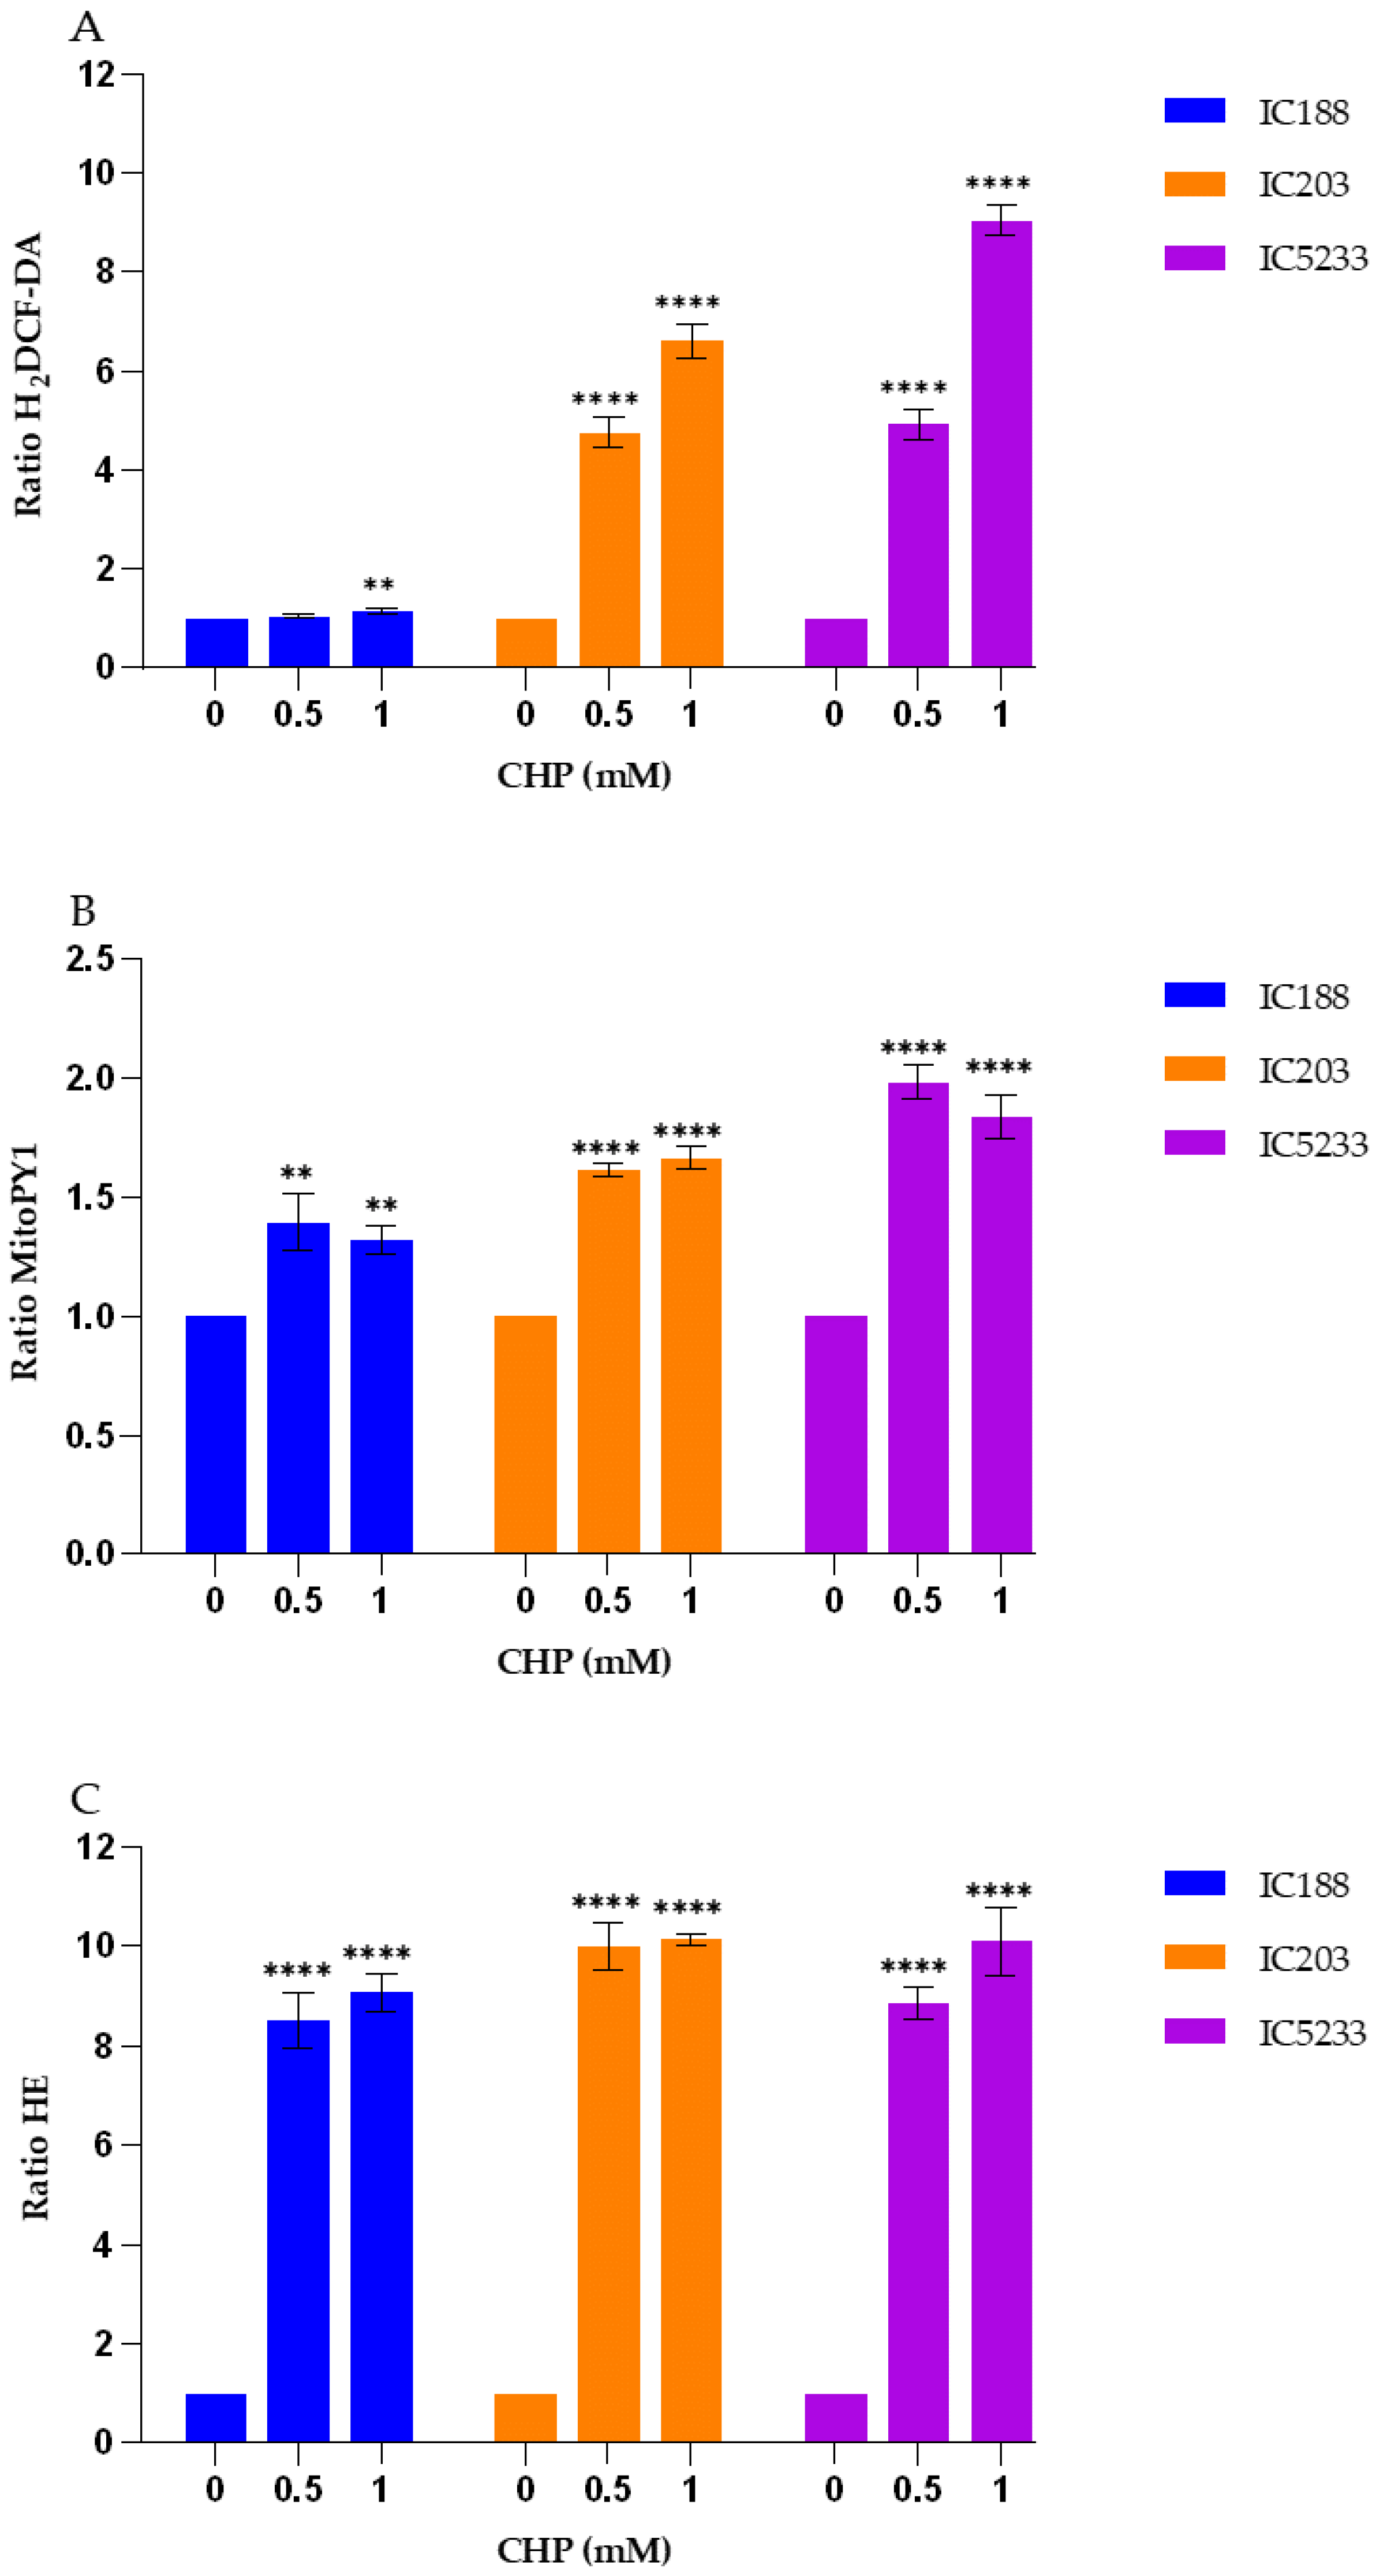
Our data (
Figure 5,
Figure 7 and
Figure 9) show that H
2DCF-DA is more sensitive for the organic peroxides t-BOOH and CHP than for H
2O
2, confirming the lack of selectivity of H
2DCF for H
2O
2. Therefore, this probe should be used rather than MitoPY1 for studies involving organic peroxides acting through H
2O
2-indepent mechanisms.
Including strain IC5233 (WP2
uvrA Δ
oxyR/
sodAB-/pKM101) in our study increased the relevance of our data. Isoenzymes of SOD are key antioxidant enzymes that are associated with different metal co-factors. The deletion of the
sodA and
sodB genes in addition to oxyR makes strain IC5233 hypersensitive with respect to mutability by H
2O
2 and superoxide, because of the intracellular accumulation of both H
2O
2 and O
2− following treatment with a wide range of prooxidants. Accumulation of both prooxidants may lead to the generation of the strong oxidant OH
. radical through the Haber–Weiss reaction, catalyzed by Fe3+ ions [
15,
16]. Consistent with this mechanism, the strain IC5233 produced the highest changes in fluorescence ratios of both H
2DCF-DA and MitoPY1 probes (
Figure 5,
Figure 7 and
Figure 9), for all exogenous peroxides, except for H
2O
2 detection by H
2DCF-DA.
These results further support the utility of the series of mutant strains of E. coli B developed in our laboratory and allow us to suggest two alternative combinations of strain/fluorescent probe suitable for in vitro studies of peroxidative activity by flow cytometry. On the one hand, H2O2-dependent peroxidative processes may be investigated using the IC5233 strain and the fluorescent probe MitoPY1. On the other hand, H2O2-independent mechanisms may be investigated with the IC5233 strain and H2DCF-DA.
The analysis of the results obtained with the O
2−-sensitive probe HE (
Figure 5,
Figure 7 and
Figure 9) provides interesting insights into both the specificity of this probe and the involvement of O
2− radicals in the actions of the exogenous peroxides tested. HE is the most popular fluorogenic probe used for detecting intracellular O
2− radical [
16]. The reaction between O
2− and HE generates a highly specific red fluorescent product, 2-hydroxyethidium (2-OH-E+). However, in biological systems, another red fluorescent product, ethidium (E+), is also formed, usually at a much higher concentration than 2-OH-E+ [
16].
While most previous reports indicate that HE does not react readily with H
2O
2 in cell-free solution, organic peroxides are able to oxidize HE with the formation of a fluorescent product in the presence of complexes of iron and/or heme proteins (e.g., cytochromes) or in cellular systems [
16]. In addition, HE can be oxidized by H
2O
2 in the presence of iron or copper via the OH
. radical or higher oxidants of iron. Such specific formation of 2-OH-E+ during the oxidation of HE by Fenton’s reaction is SOD-inhibitable, and so the formation of 2-OH-E+ in this system should be attributed to O
2− formation [
16]. This assumption is not consistent with the lack of significant effect of the OxyR and SodA/SodB deficiencies in the fluorescence ratio of HE after exposure to t-BOOH or CHP (
Figure 7 and
Figure 9). As seen, the IC5233 triple mutant, in which the levels of both H
2O
2 and O
2− are the highest, shows similar or lower HE fluorescence ratios than the oxyR deficient strain IC203 and, more surprisingly, the wild-type strain IC188 after treatment with organic peroxides. In both cases, however, the fluorescence ratios are dependent on the concentration of exogenous peroxides, pointing towards a O
2−-independent oxidation of HE to form E+, as the fluorescent species. Only after treatment with H
2O
2 could we observe both a dose-dependent and a strain-dependent increase in the HE fluorescence ratio, suggesting that in these conditions, superoxide-dependent oxidation of HE was involved and the specific generation of 2-OH-E+ might explain the slight difference between the IC5233 and IC203 response (
Figure 5). See
Supplemental Figure S2, for a scheme of the oxidative processes we believe are involved in the interaction among the fluorescent probes and the peroxides used in this study.
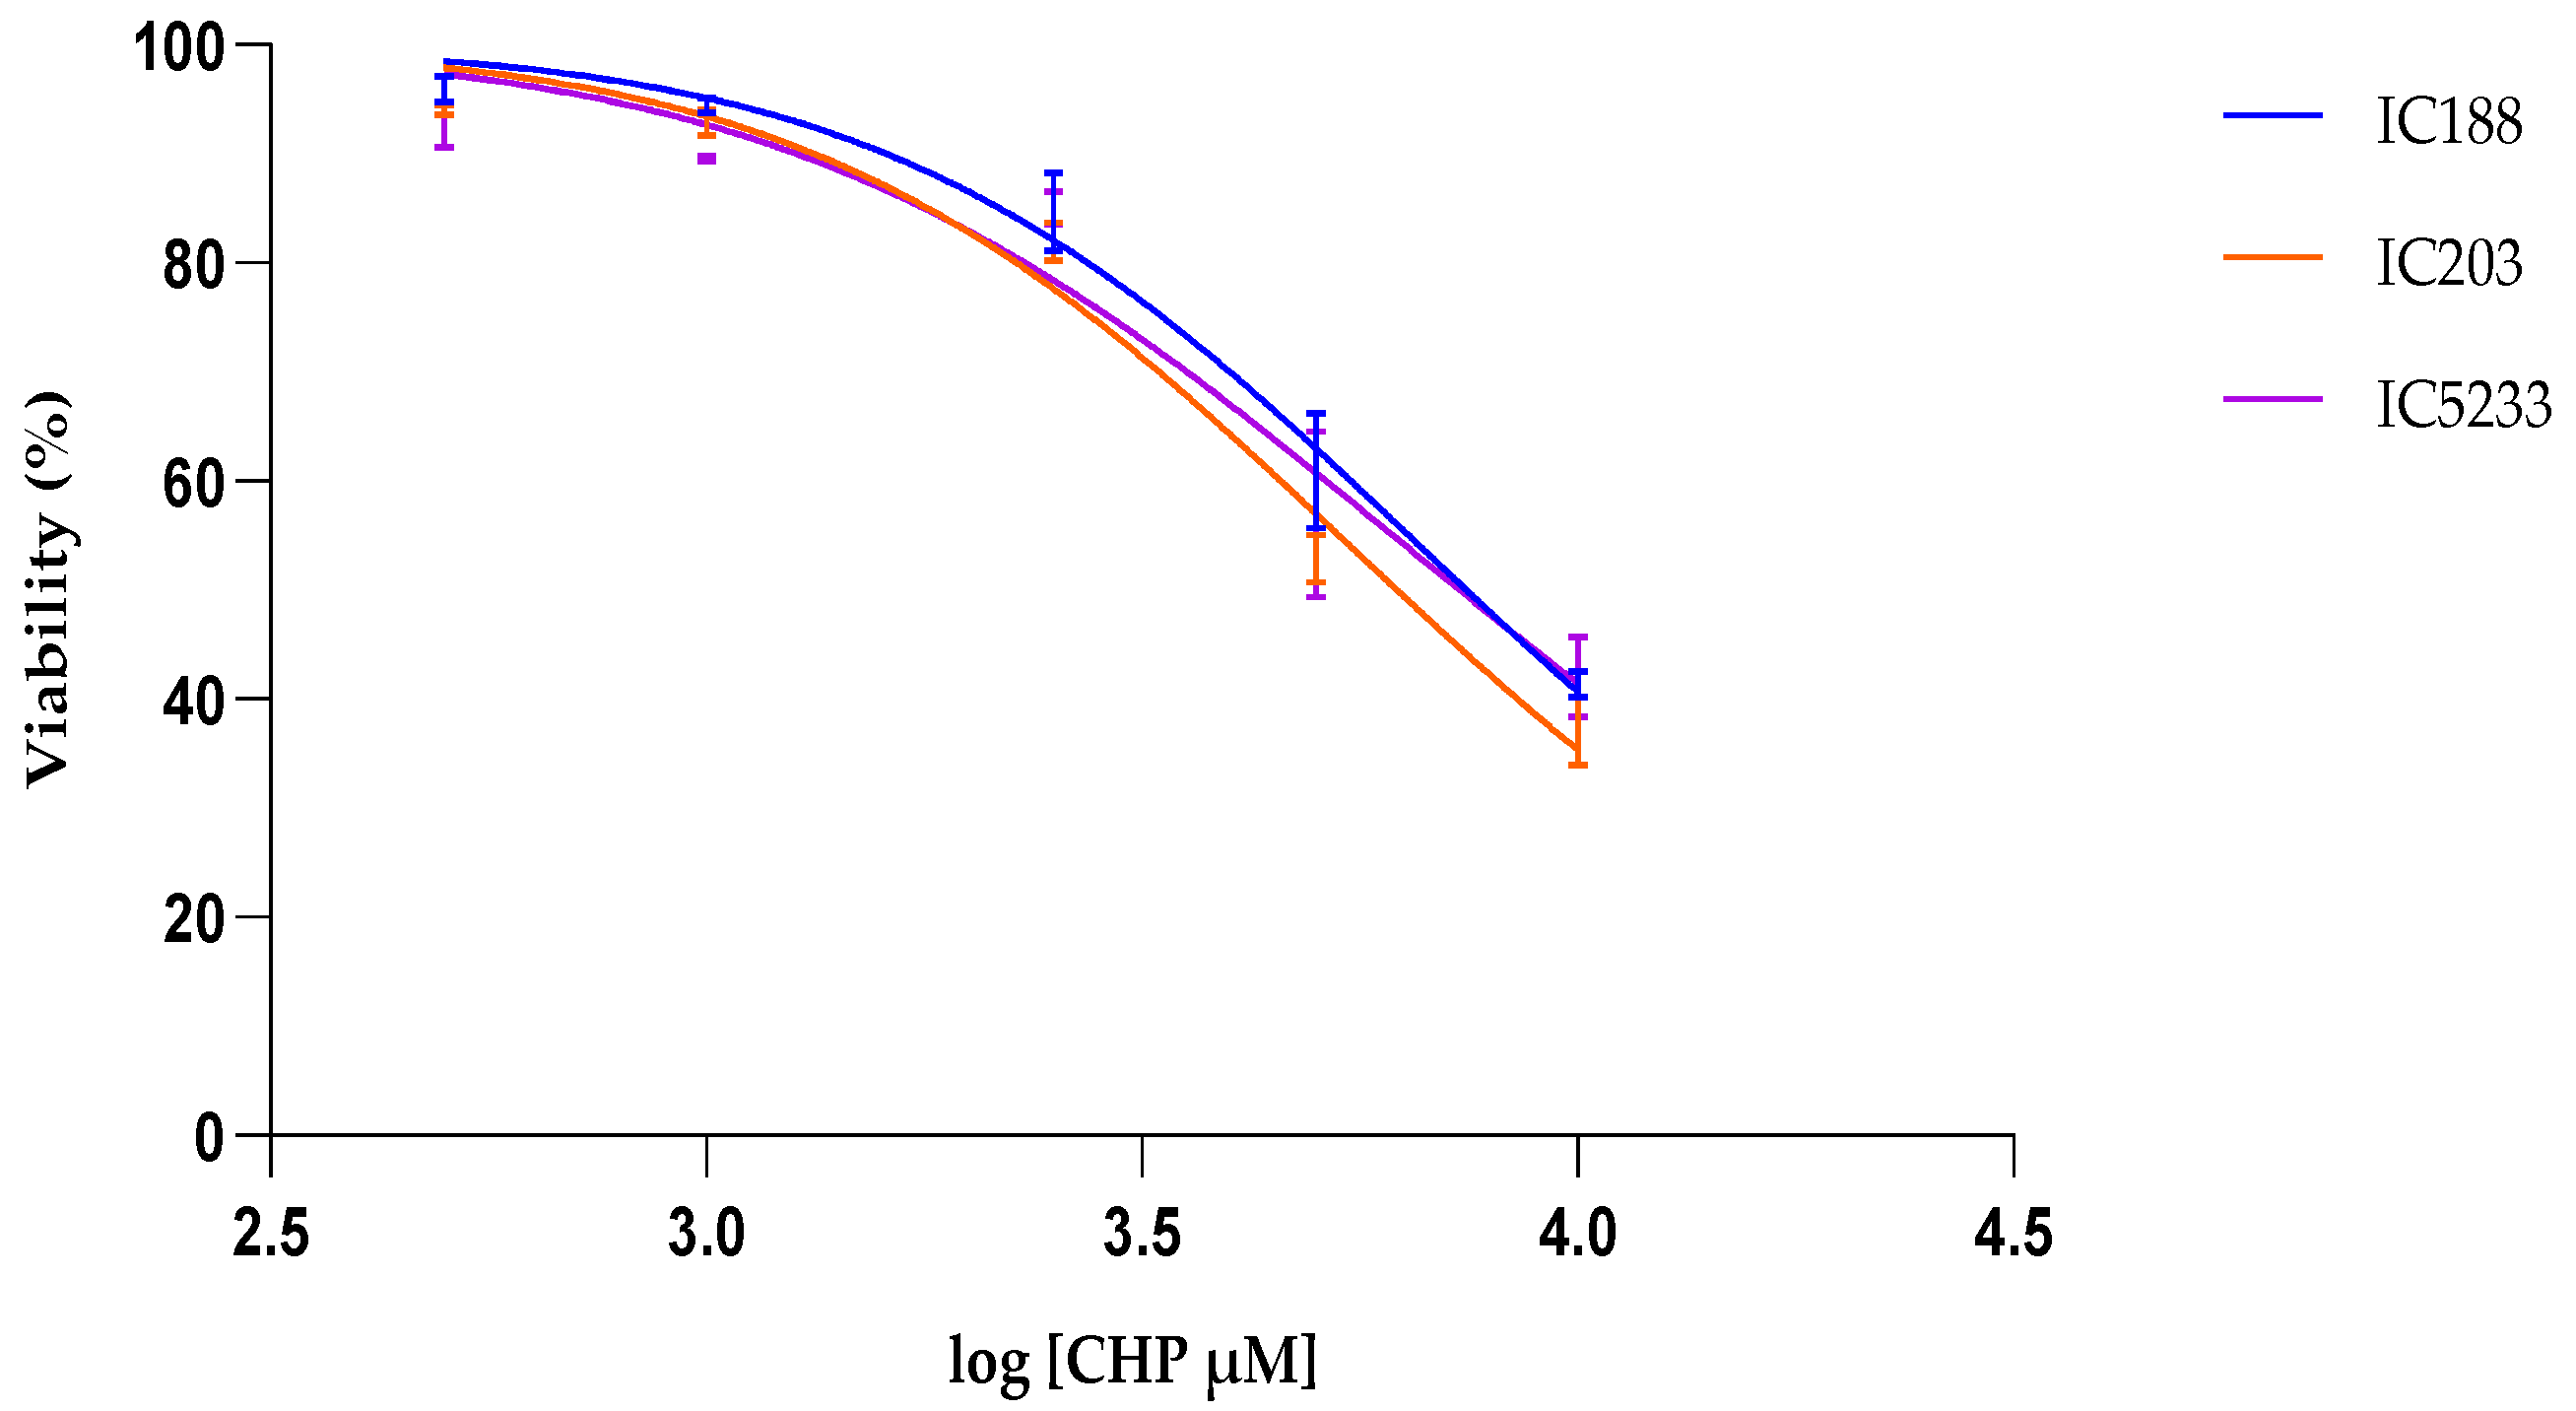
In order to understand the effects of active molecules with such different physical-chemical characteristics as H
2O
2 and the organic peroxides t-BOOH and CHP, it is important to consider the role of their lipophilicity and their ability to penetrate or transport through membranes. In this regard, a previous study [
32] demonstrated kinetic differences in the oxidative effects of CHP and H
2O
2 in a simple erythrocyte model. At comparable oxidant concentrations, the oxidative stress induced in the membrane was always much higher for CHP, while intracellular oxidative effects were observed with H
2O
2. The intracellular action of CHP was gradual, generating radicals that produced membrane-initiated oxidative stress, which increased over time to a maximum and then decreased. On the contrary, H
2O
2 reacted rapidly, generating radicals highly reactive to intracellular components as main targets. H
2O
2-induced oxidative stress was maximal immediately after addition and rapidly disappeared.
The relative lipophilicity of a chemical compound is expressed by its partition coefficient (Kow), which is the concentration ratio of the compound between the aqueous phase (w) and the organic phase (o) in a two-solvent system (typically, octanol and water), immiscible at equilibrium.
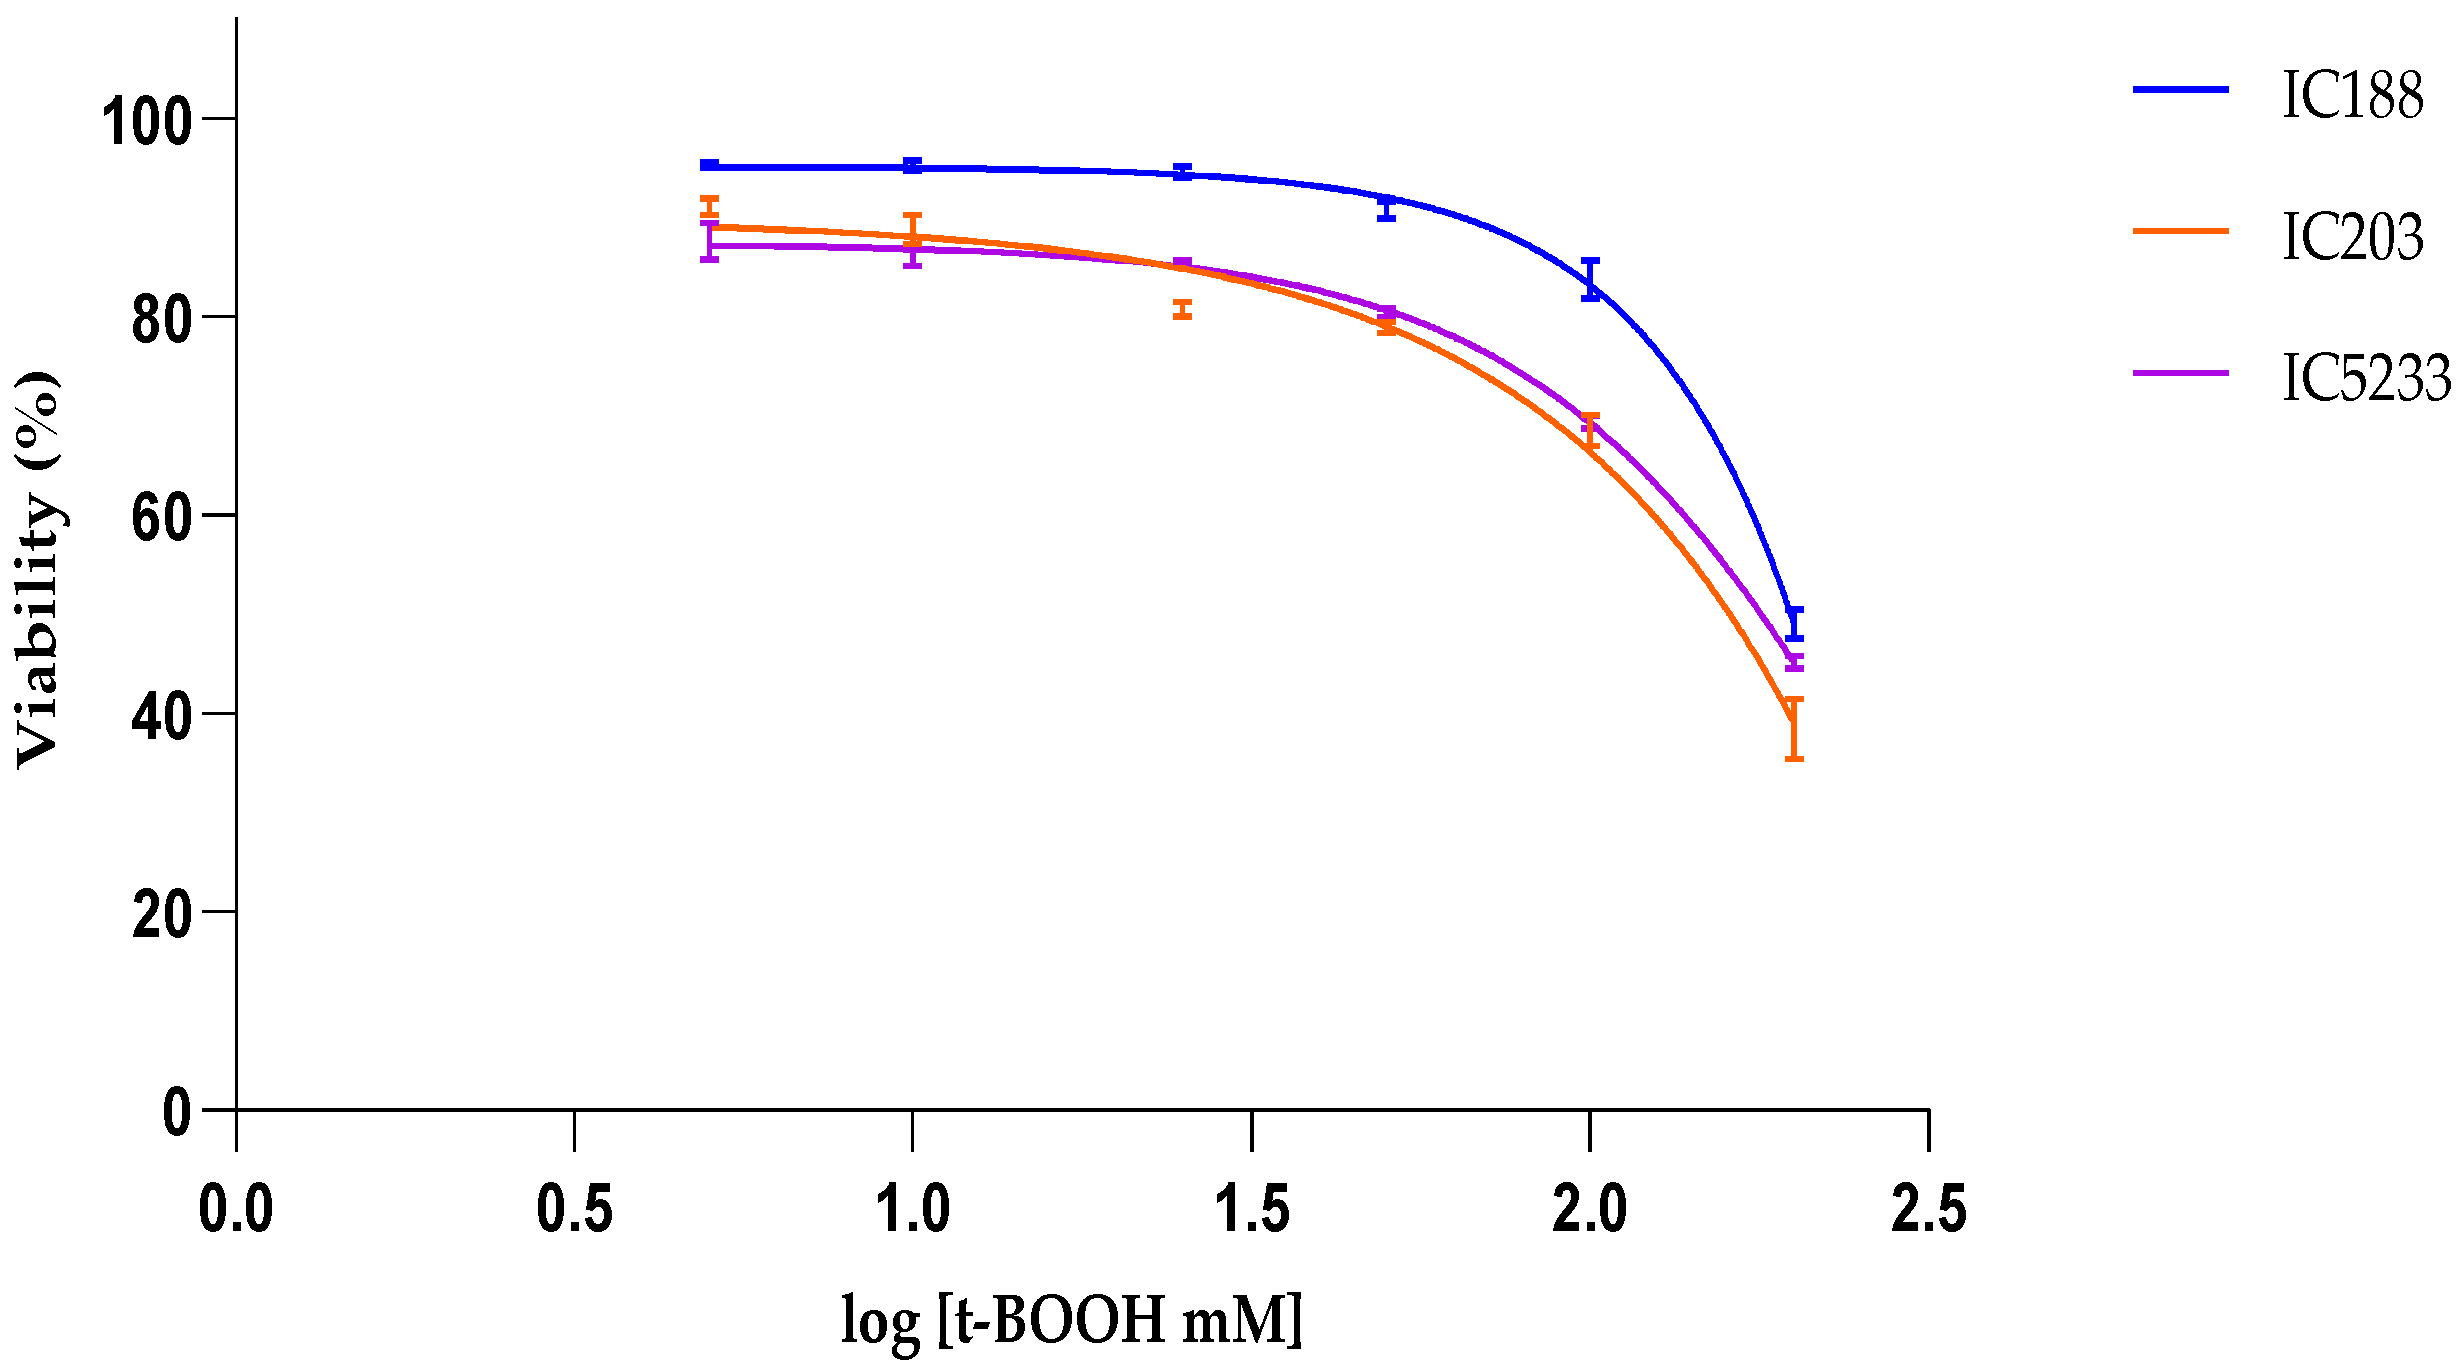
Table 2 allows for comparing the lipophilicity of the peroxides used in our study and their cytotoxicity on
E.coli strains. The data show a clear positive correlation between the lipophilicity of the peroxides and their toxicity to
E. coli, suggesting greater quantitative importance of the peroxidative effects on the bacterial membrane and/or greater efficiency of the protection systems (
oxyR-dependent or independent) against the intracellular effects of H
2O
2 than against the membrane oxidative stress induced by organic peroxides.
The results of our study aim to systematically assess issues of specificity in fluorescent probes and the involvement of ROS in a bacterial model of oxidative stress, extending the previous findings of McBee et al. [
13]. Their data showed that properly controlled flow cytometry using selective fluorescent probes resulted in precise and accurate analysis of ROS generation and metabolic changes in stressed bacteria. In addition, our results may be relevant to prevent or minimize possible sources of error, and to provide recommendations for the proper design of cytometric studies of oxidative stress, in accordance with current recommendations and guidelines [
16,
23].
4. Materials and Methods
4.1. Bacterial Strains and Culture Conditions
The genetically modified strains of
E. coli B used in this study were the strains IC188 (WP2
uvrA
oxyR+/pKM101), IC203 (WP2
uvrA Δ
oxyR30/pKM101) and IC5233 (WP2
uvrA Δ
oxyR30
sodAB-/pKM101). All of these strains were obtained from the collection of the former Instituto de Investigaciones Citológicas of Valencia, now hosted in the Príncipe Felipe Research Center (Valencia, Spain) [
18,
19]. Overnight cultures were prepared from 100 μL of frozen permanent cultures inoculated into 9 mL of LB medium: NaCl, 10 g/L; Gibco Bacto tryptone (Thermo Fisher, Waltham, MA, USA), 10 g/L; Gibco Yeast extract (Thermo Fisher, Waltham, MA, USA), 50 g/L and incubated for 24 h at 37 °C. PROVIDERS OF MEDIA
4.2. Verification of Bacterial Phenotypes
The phenotype determined by the outer membrane of the different
E. coli strains was verified using the rough specific bacteriophage C21. One hundred microliters of the overnight cultures was mixed with 3 mL of molten top agar: Bacto Agar (Becton Dickinson, Franklin Lakes, NJ, USA), 6 g/L; NaCl, 5 g/L) and poured into LA medium (20 g agar per liter of LB medium) in 10 cm Petri dishes. A drop of phage C21 suspension (obtained from Dr. P. Quillardet, Institut Pasteur, Paris, France) and a sterile 5 mm Whatman paper disk with 10 µL of 1 mg/mL Crystal Violet stain (CV, Sigma Aldrich, Saint Louis, MO, USA) were placed on separate areas of the lawn of cells and the plates were incubated overnight at 37 °C.
E. coli K-12 was resistant to the C21 phage and the CV stain, and
E. coli B wild-type was sensitive to the C21 phage and resistant to the CV stain [
18,
19,
20].
4.3. Verification of Strain Sensitivity to Peroxidative Xenobiotics
The sensitivity of control strain IC188 and deficient strains IC203 and IC5233 was evaluated by disk determination of plate growth inhibition, as follows. One hundred microliters of a stationary culture was mixed with 3 mL of soft agar and the different bacterial strains seeded on plates with LA medium. Sterile Whatman paper disks (6 mm diameter) were placed on the surface of the plates impregnated with 300 μg/disk of each compound: H
2O
2, t-BOOH and CHP, obtained from Sigma Aldrich (Saint Louis, MO, USA). The growth inhibition halo around the filter was measured after the incubation of plates for 24 h at 37 °C [
18,
19].
4.4. Treatment with Peroxidative Xenobiotics for Flow Cytometry Analysis
Bacteria were grown in LB medium until the culture reached the mid-exponential growth phase, with an optical density at 600 nm (OD) of approximately 0.6. Bacterial cultures in the exponential state were diluted at 1/10 with LB culture medium and treated for 60 min at 37 °C with concentrations of H
2O
2 (0–100 mM), t-BOOH (0–25 mM) or CHP (0–1 mM). After treatment, cultures were washed once, resuspended in LB with the appropriate fluorescent probes and analyzed by means of flow cytometry [
11,
12].
4.5. Fluorescent Probes and Procedures for Assesing Bacterial Viability by Flow Cytometry
Determining cell viability is an important step when evaluating a cell’s response to prooxidants. Dead cells can generate artifacts because of non-specific staining with probes or, conversely, by impaired intracellular retention of fluorescent products [
16]. The viability fluorescent probes propidium iodide (PI, Sigma Aldrich, Saint Louis, MO, USA; cat. P4170) and Helix NP
TMGreen (BioLegend, San Diego, CA, USA; cat. 425303) were stored frozen as stock solutions, as follows: Helix NP
TM Green (5 mM in DMSO) and PI (1.50 mM in dH2O). The final assay concentration was 0.50 µM Helix NP
TM Green and 7.5 µM PI.
PI and Helix NP
TMGreen are membrane-impermeant dyes excluded from viable cells. Both bind to double stranded DNA by intercalating between base pairs. PI is excited at 488 nm and emits at a maximum wavelength of 617 nm [
35]. Helix NP
TMGreen is a green-emitting dye with excitation/emission at 495 nm/519 nm [
36].
Bacterial cultures in an exponential state were diluted at 1/10 with LB medium and treated for 60 min at 37 °C with H2O2 (0 to 1200 mM), t -BOOH (0 to 200 mM) and CHP (0 to 10 mM). The cultures treated with the prooxidants were centrifuged for 10 min at 4500× g and resuspended in 500 µL LB. PI or Helix NPTM Green (for HE-stained samples) were added to sample tubes and incubated for 5 min immediately prior to flow cytometric analysis.
4.6. Fluorescent Probes and Staining Procedures for ROS Detection by Flow Cytometry
The following fluorescent probes were purchased from Sigma Aldrich (Saint Louis, MO, USA): 2′,7′-dichlorodihydrofluorescein diacetate, also known as 2′,7′-dichlorofluorescin diacetate (H2DCF-DA, cat. D6883); dihydroethidium, also known as hydroethidine (HE, cat. D7008); mitochondrial peroxy yellow 1 (MitoPY1, cat. SML0734); and propidium iodide (PI, cat. P4170). The fluorescent probe Helix NPTMGreen was purchased from BioLegend (San Diego, CA, USA; cat. 425303). The fluorescent probes were stored frozen as stock solutions at the indicated concentrations in DMSO: H2DCF-DA (20.5 mM); HE (3.17 mM); MitoPY1 (1.05 mM) and Helix NP Green (5 mM). PI was stored frozen at 1.50 mM in dH2O. The final assay concentration for each fluorochrome was as follows: H2DCF-DA: 41.04 µM; HE: 15.88 µM; MitoPY1: 5 µM; Helix NP Green: 0.50 µM; and PI: 7.5 µM.
The cell-permeant H
2DCF-DA is one of the most commonly fluorogenic substrates used for studies related to ROS generation. Upon cleavage of its acetate groups by intracellular esterases, oxidation of intracellular 2′,7′- dichlorodihydrofluorescein (DCFH) produces 2′,7′ dichlorofluorescein (DCF), a fluorescent product with excitation at 498 nm and emission at 522 nm [
37,
38].
MitoPY1 is a boronate-based fluorescent probe that selectively targets mitochondria and senses local H
2O
2 generation [
39]. MitoPY1 can be excited by the 488 argon-ion laser, and its green fluorescence is detected at around 520 nm [
29].
HE has been widely used as a fluorogenic substrate to detect O
2− [
16]. HE is membrane-permeable and once oxidized by O
2−, it generates a fluorescent compound retained in the nucleus by intercalating with DNA, which increases its fluorescence, with excitation at 520 nm and orange emission at 610 nm [
24].
Bacterial cultures in an exponential state were diluted at 1/10 with LB medium and treated for 60 min at 37 °C with H
2O
2 (0 to 100 mM), t -BOOH (0 to 25 mM) and CHP (0 to 1 mM). The cultures treated with the prooxidants were centrifuged for 10 min at 4500×
g and resuspended in 500 µL LB medium. The fluorescent probes H
2DCF-DA, MitoPY1 or HE were added, and samples were incubated for 30 min at 37 °C in the dark [
11,
12]. PI or Helix NP
TM Green (for HE-stained samples) were added for 5 min prior to flow cytometric analysis.
4.7. Titration of ROS-Sensitive Fluorescent Probes for Flow Cytometry Analysis
When setting up a fluorescence-based determination in flow cytometry, it is essential to titrate the fluorescent probes properly in order to define their appropriate concentration for staining, thus minimizing saturation and suboptimal detection of the relevant biological parameters [
23]. To define the final concentration of the different fluorochromes, we selected the most appropriate oxidant, according to the preferential sensitivity of the fluorescent probe. Thus, for the probes H
2DCF-DA and MitoPY1, cell suspensions were exposed to t-BOOH. For the titration of the probe HE, cell suspensions were treated with menadione, which generates O
2− by redox cycling [
22].
Bacterial cultures in an exponential state were diluted at 1/10 with LB medium and treated for 60 min at 37 °C with 10 mM t-BOOH or for 120 min with 0.29 mM menadione. The cultures were then centrifuged for 10 min at 4500× g and resuspended in 500 µL LB medium. The fluorescent probes H2DCF-DA (0 to 164.16 µM), MitoPY1 (0 to 10 µM) or HE (0 to 23.81 µM) were added and samples were incubated for 30 min at 37 °C in the dark. PI or HelixNP Green (for HE-stained samples) were added 5 min immediately prior to flow cytometric analysis.
4.8. Flow Cytometric Analysis
As a general principle, we followed the current guidelines and recommendations for performing flow cytometric analysis [
23].
Parameter selection and cytometer settings were optimized for analysis on a Gallios flow cytometer (Beckman Coulter, Brea, CA, USA) equipped with three lasers emitting at 405, 488 and 638 nm. The fluorescent intracellular products of the probes H2DCF-DA, MitoPY1 and Helix NPTM Green were excited by the blue laser (488 nm) and detected with a 525/40 nm band-pass emission filter. HE and PI were detected with a 620/30 nm band-pass emission filter after excitation by the blue laser.
Prior to analysis, unlabeled bacteria were run to optimize voltage settings, and the flow rate was set on low. Bacterial events were discriminated from debris using forward scatter (FSC) and side scatter (SSC) signals. Doublets were excluded from analysis by FSC-A and FSC-peak. Gates applied for population discrimination were set manually based on control samples. For each sample, 20,000 ungated events were collected. For further analysis, the cytometric data were exported to Kaluza 2.1 software (Beckman Coulter, Brea, CA, USA).
The mean fluorescence intensities (MFI) were expressed as relative fluorescence units (RFU). To obtain normalized fluorescence ratio values, the fluorescence intensity of the treated samples was divided by the fluorescence intensity of the basal condition. The results of the different experiments involving fluorescence quantitation shown are the averages ± SD of the ratios for three separate experiments.
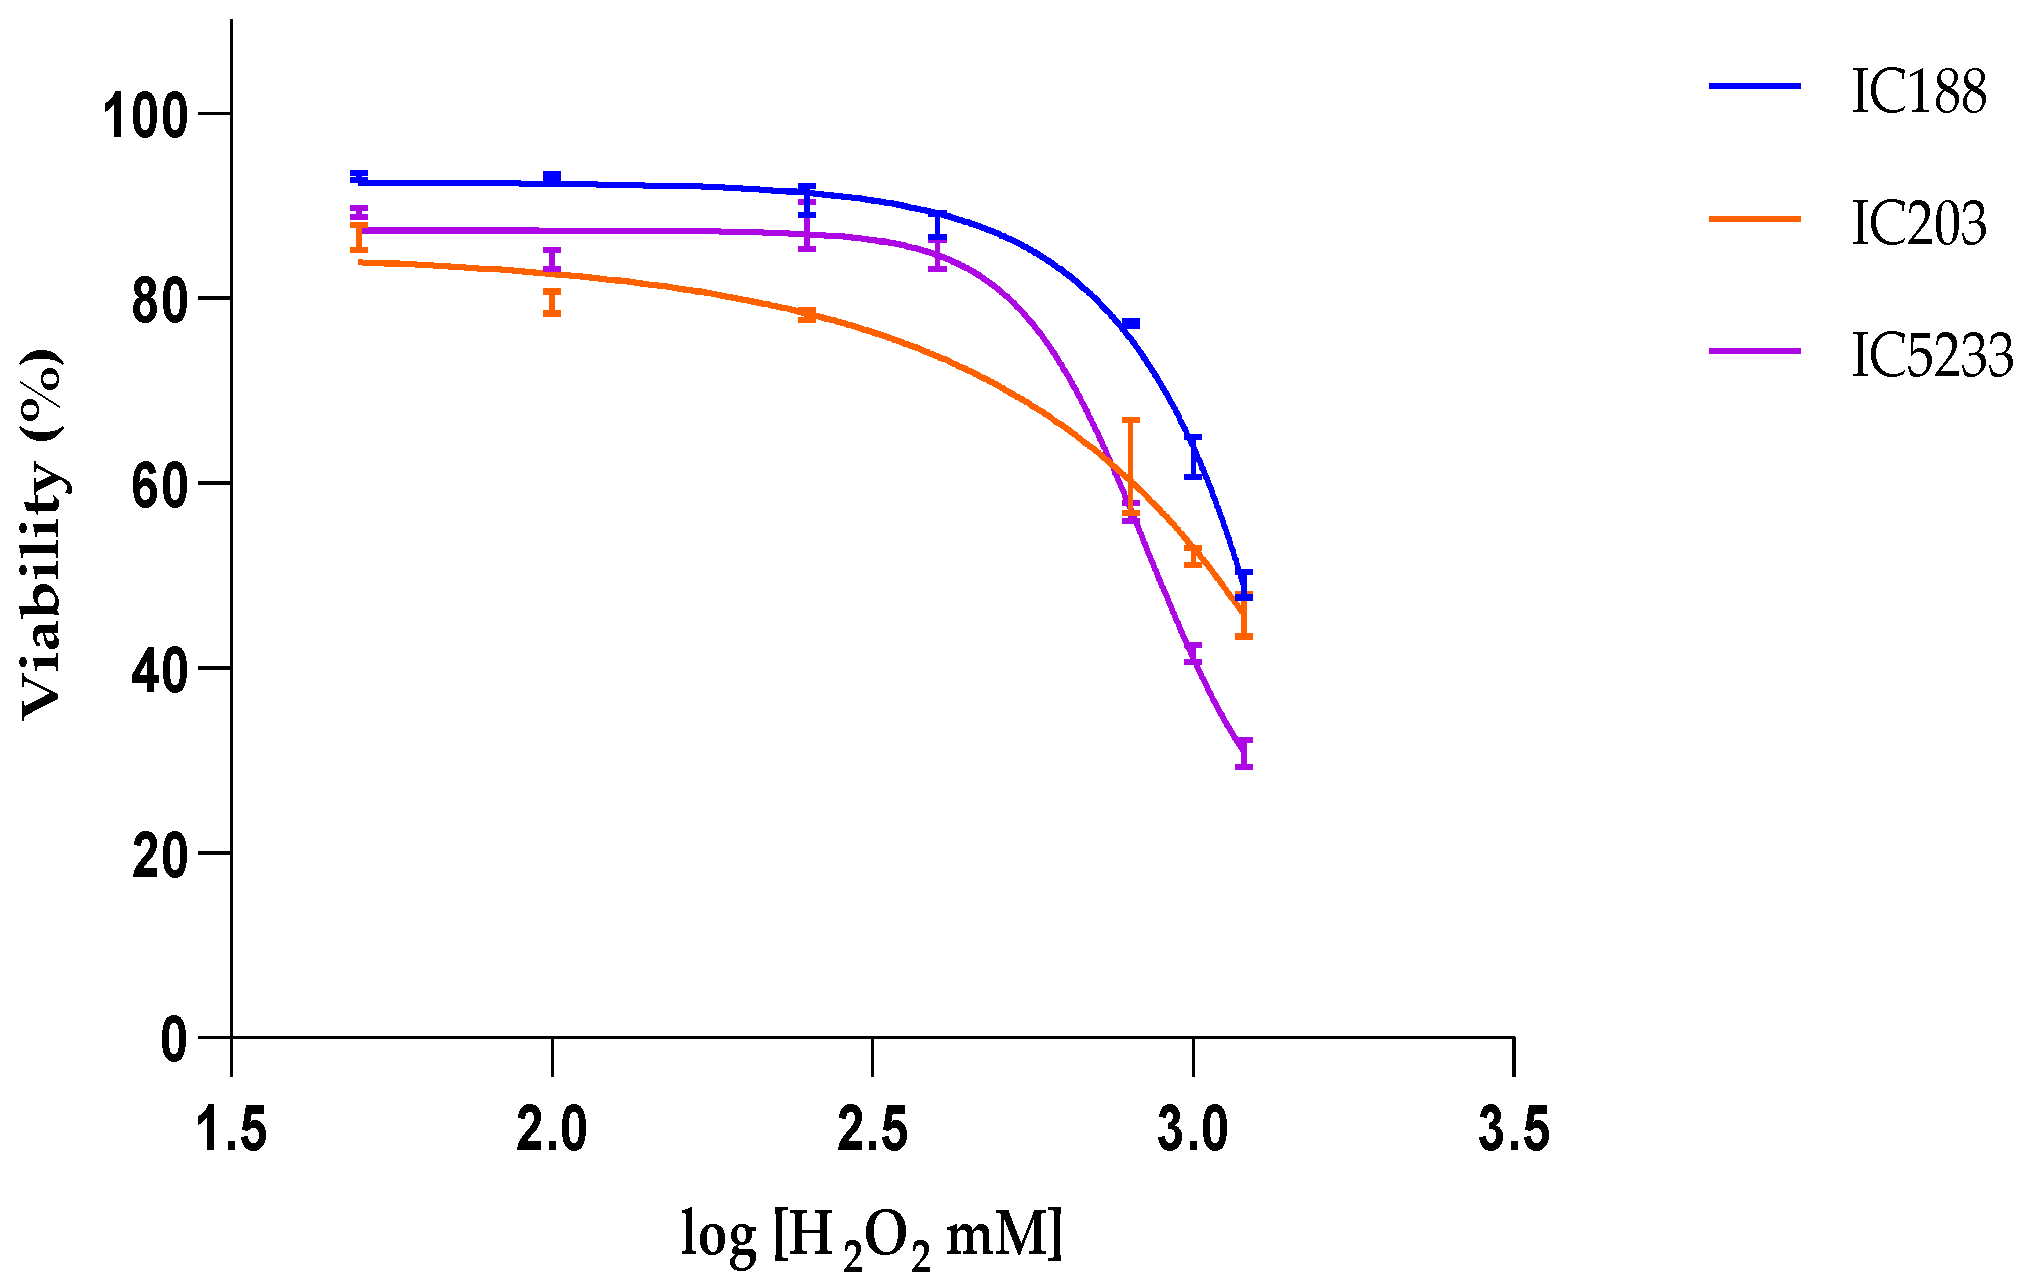
In viability experiments, the cytotoxic potency of xenobiotics was determined by their IC50 values, i.e., the concentration of xenobiotic at which cell viability is inhibited by 50%, as calculated by curve fitting and determination by the correlation coefficient (R2).
4.9. Statistical Analysis
Statistical analysis was carried out with GraphPad Prism (La Jolla, CA, USA) version 9.0 software for Windows and flow cytometric graphs were generated using Kaluza analysis software.
In order to choose the appropriate statistical test to carry out the hypothesis contrast, we previously checked the normality in the groups. Normality was determined using the Shapiro–Wilk test for sample size. When the assumption of normality was met, we checked whether there was homoscedasticity or equality of variances using the Levene test. With equal variances, the t-Student test for two independent samples was applied in the comparisons between the control strain IC188 and the mutant strains. For comparisons between more than two groups, the one-way analysis of variance (ANOVA) test was performed, with Dunnett’s multiple comparisons. This test was applied to study the differences in the concentrations of each fluorochrome with respect to its corresponding baseline. Statistical significance was considered when p < 0.05.


