
Inhibition of Carbonic Anhydrase 2 Overcomes Temozolomide Resistance in Glioblastoma Cells


 , ,
, ,  and
and 
Abstract
1. Introduction
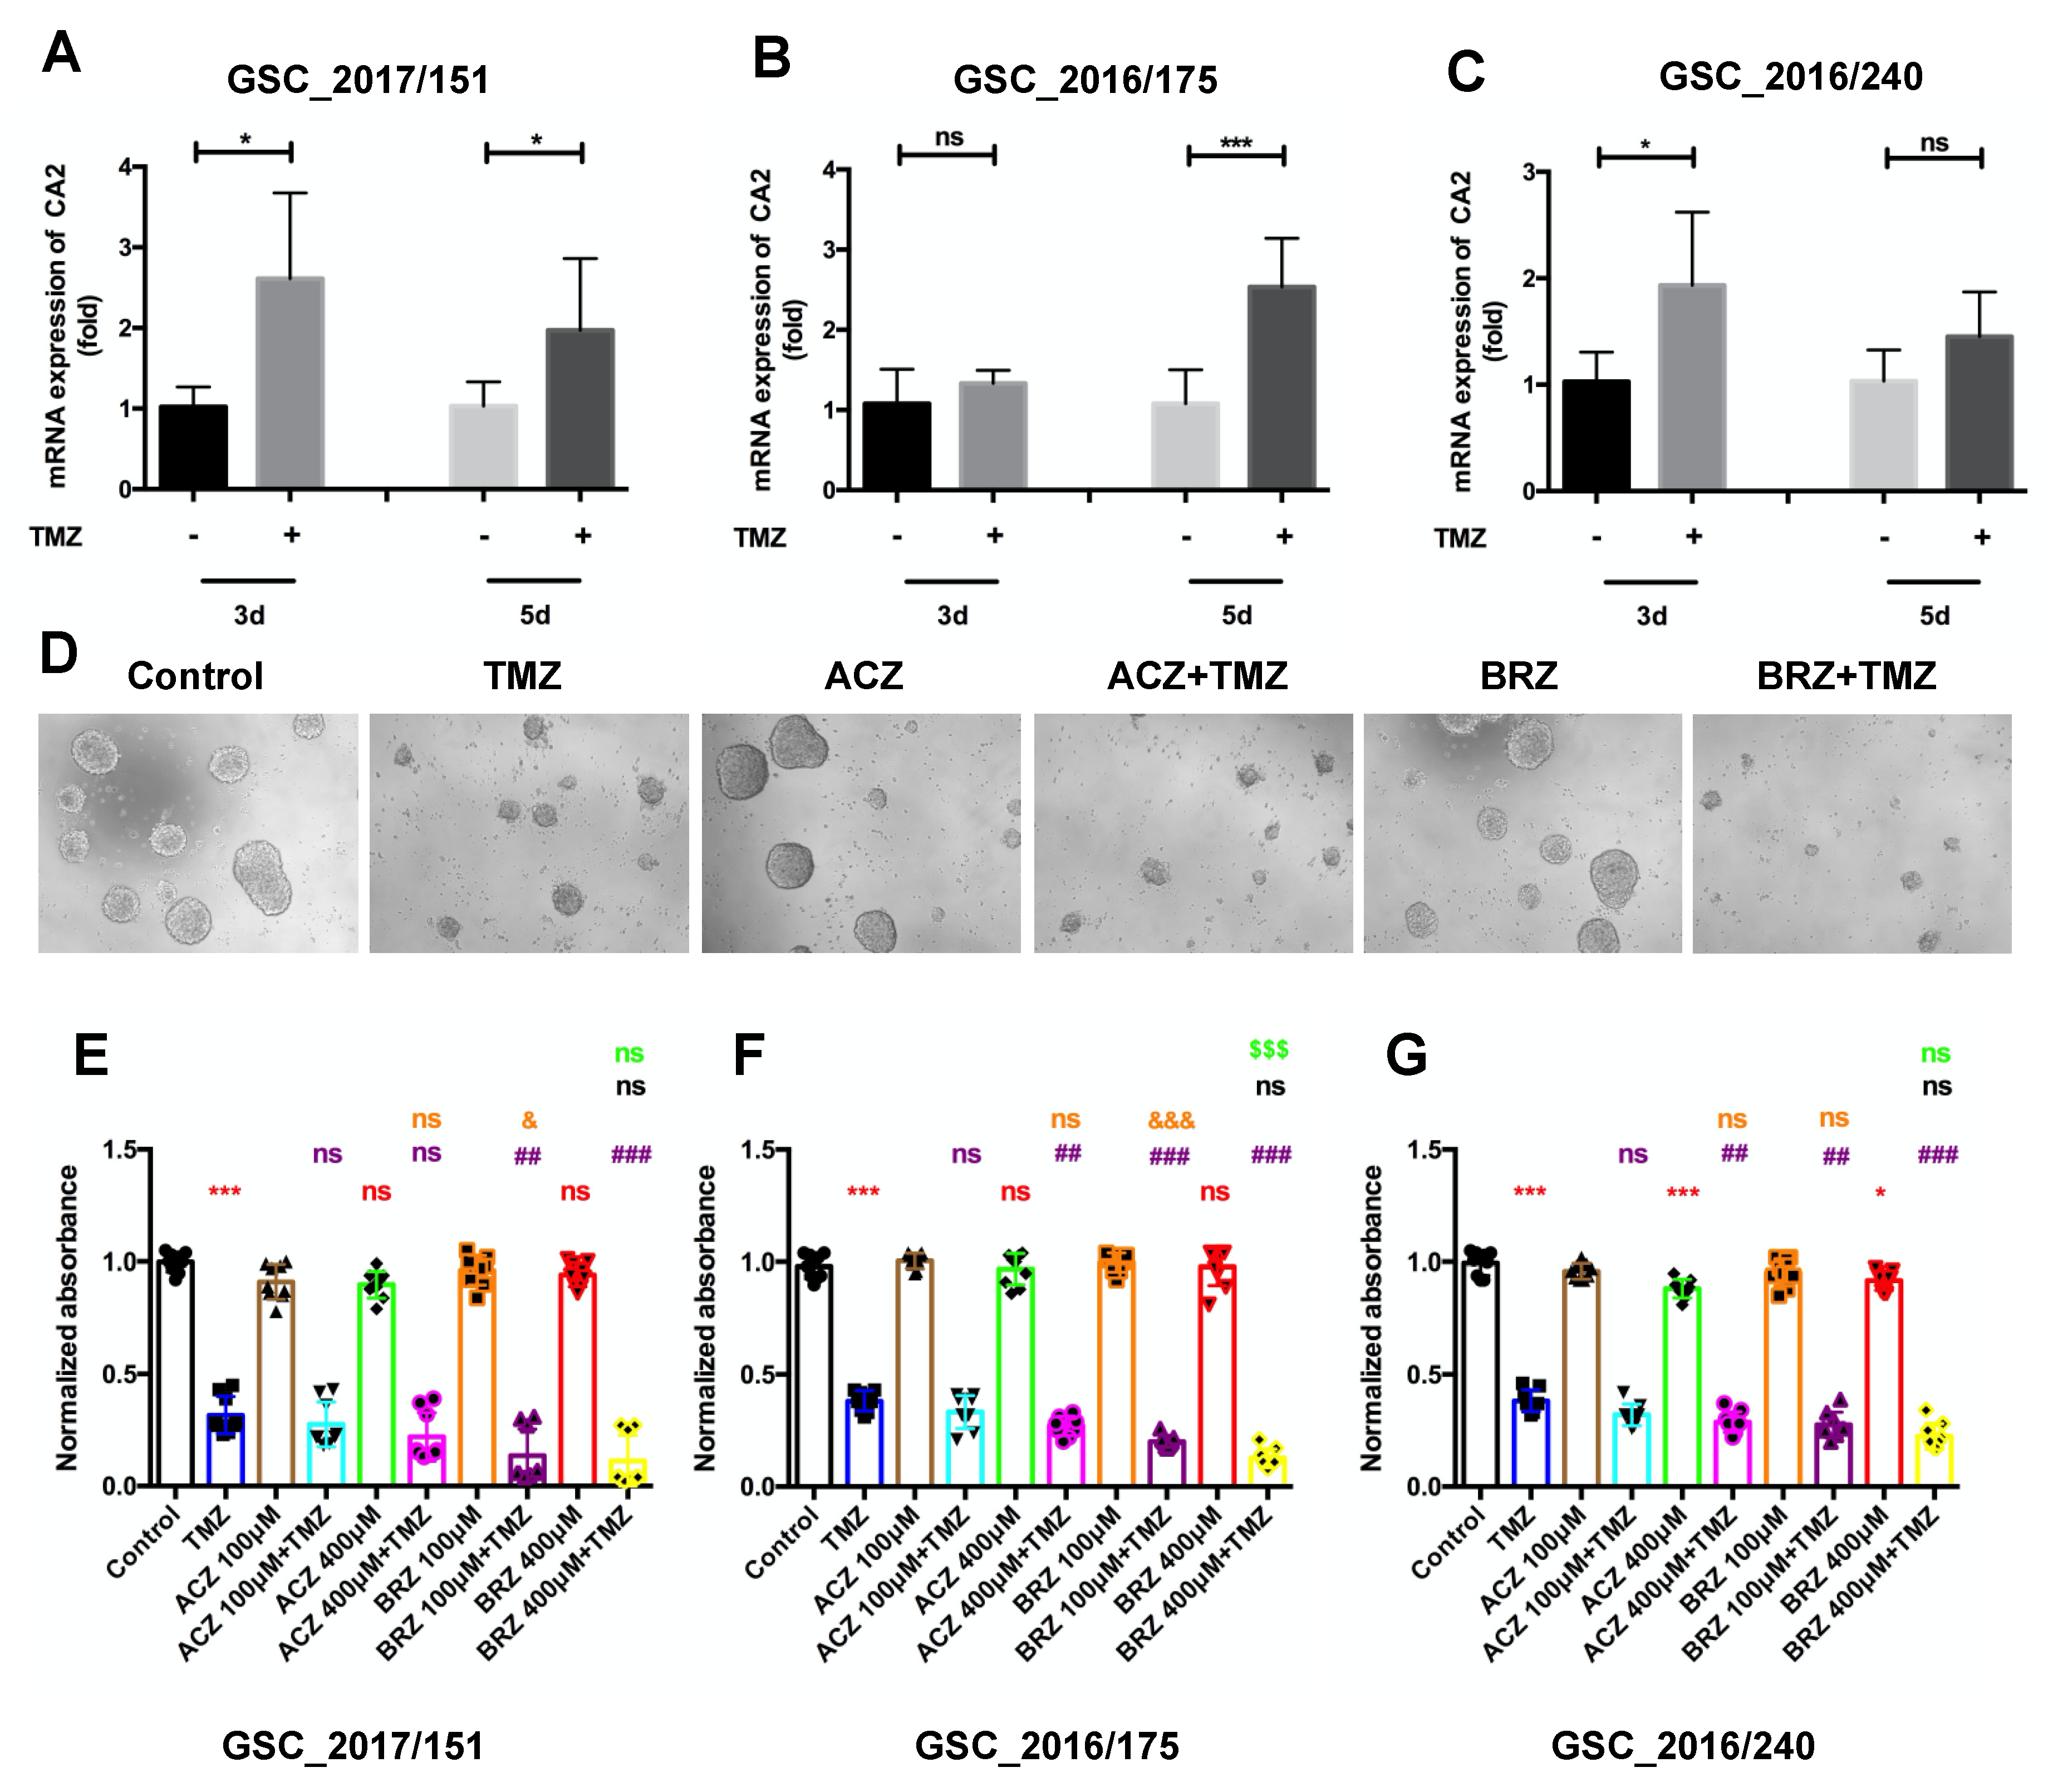
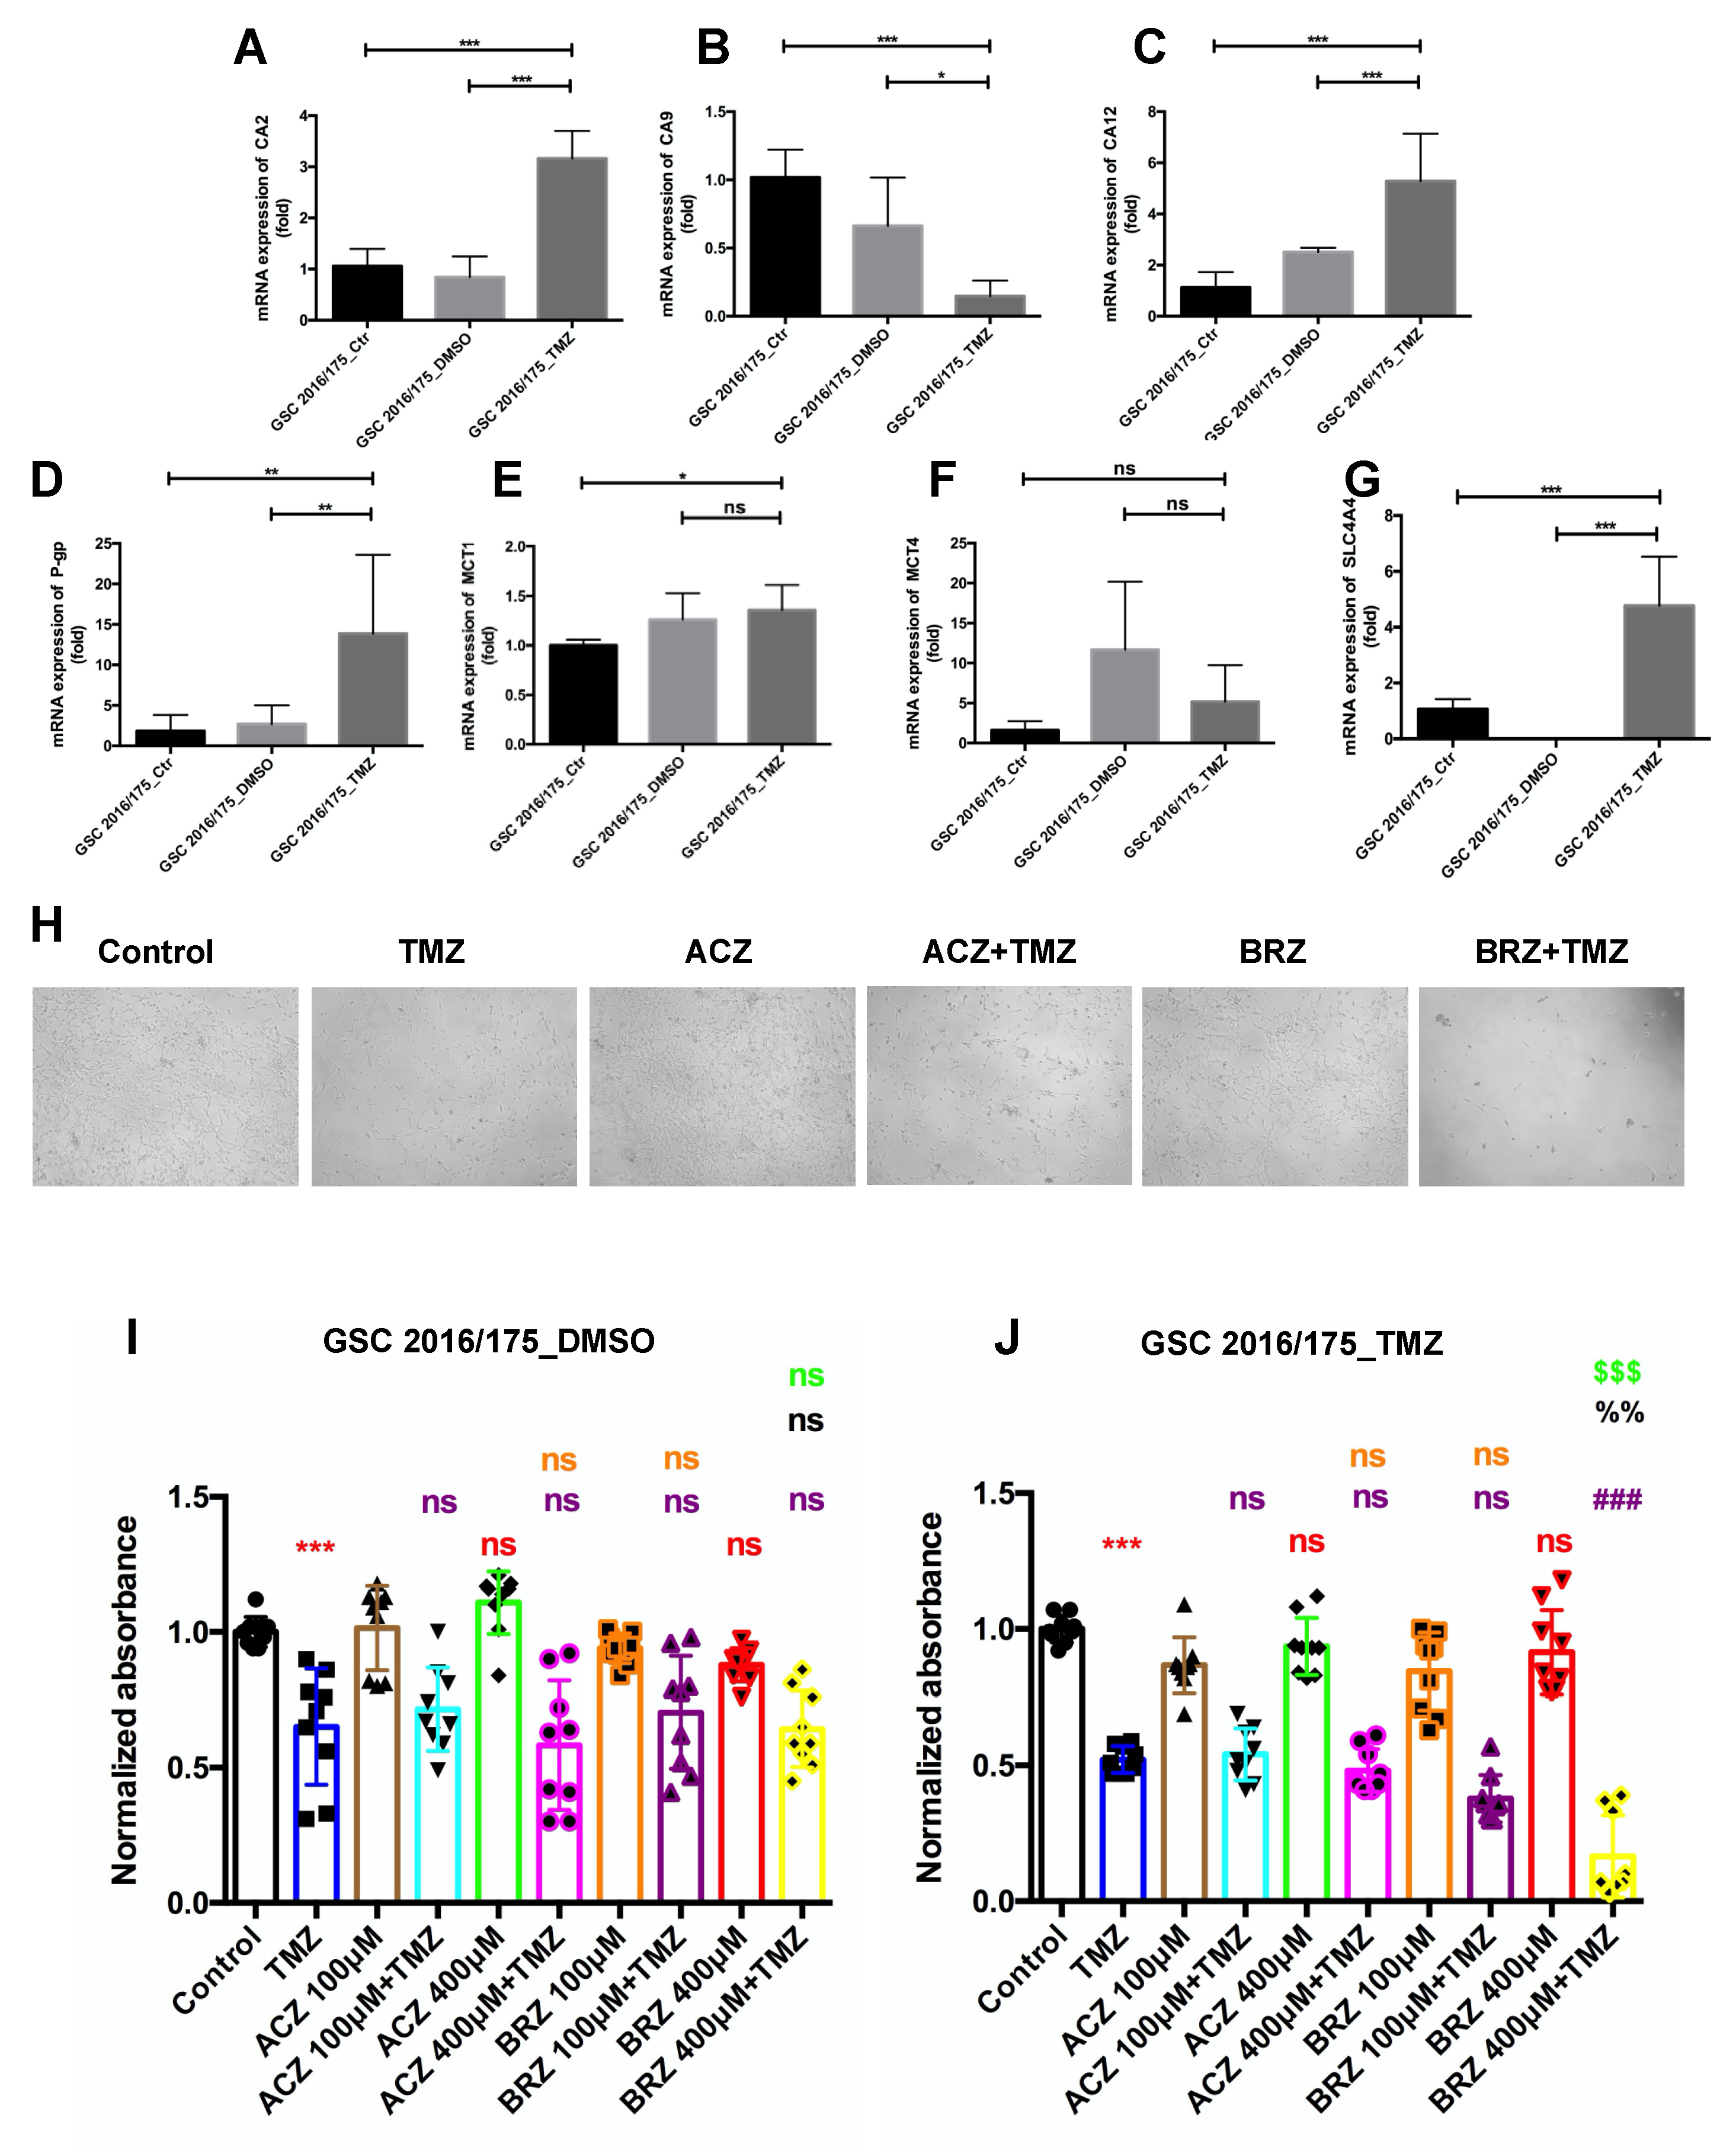
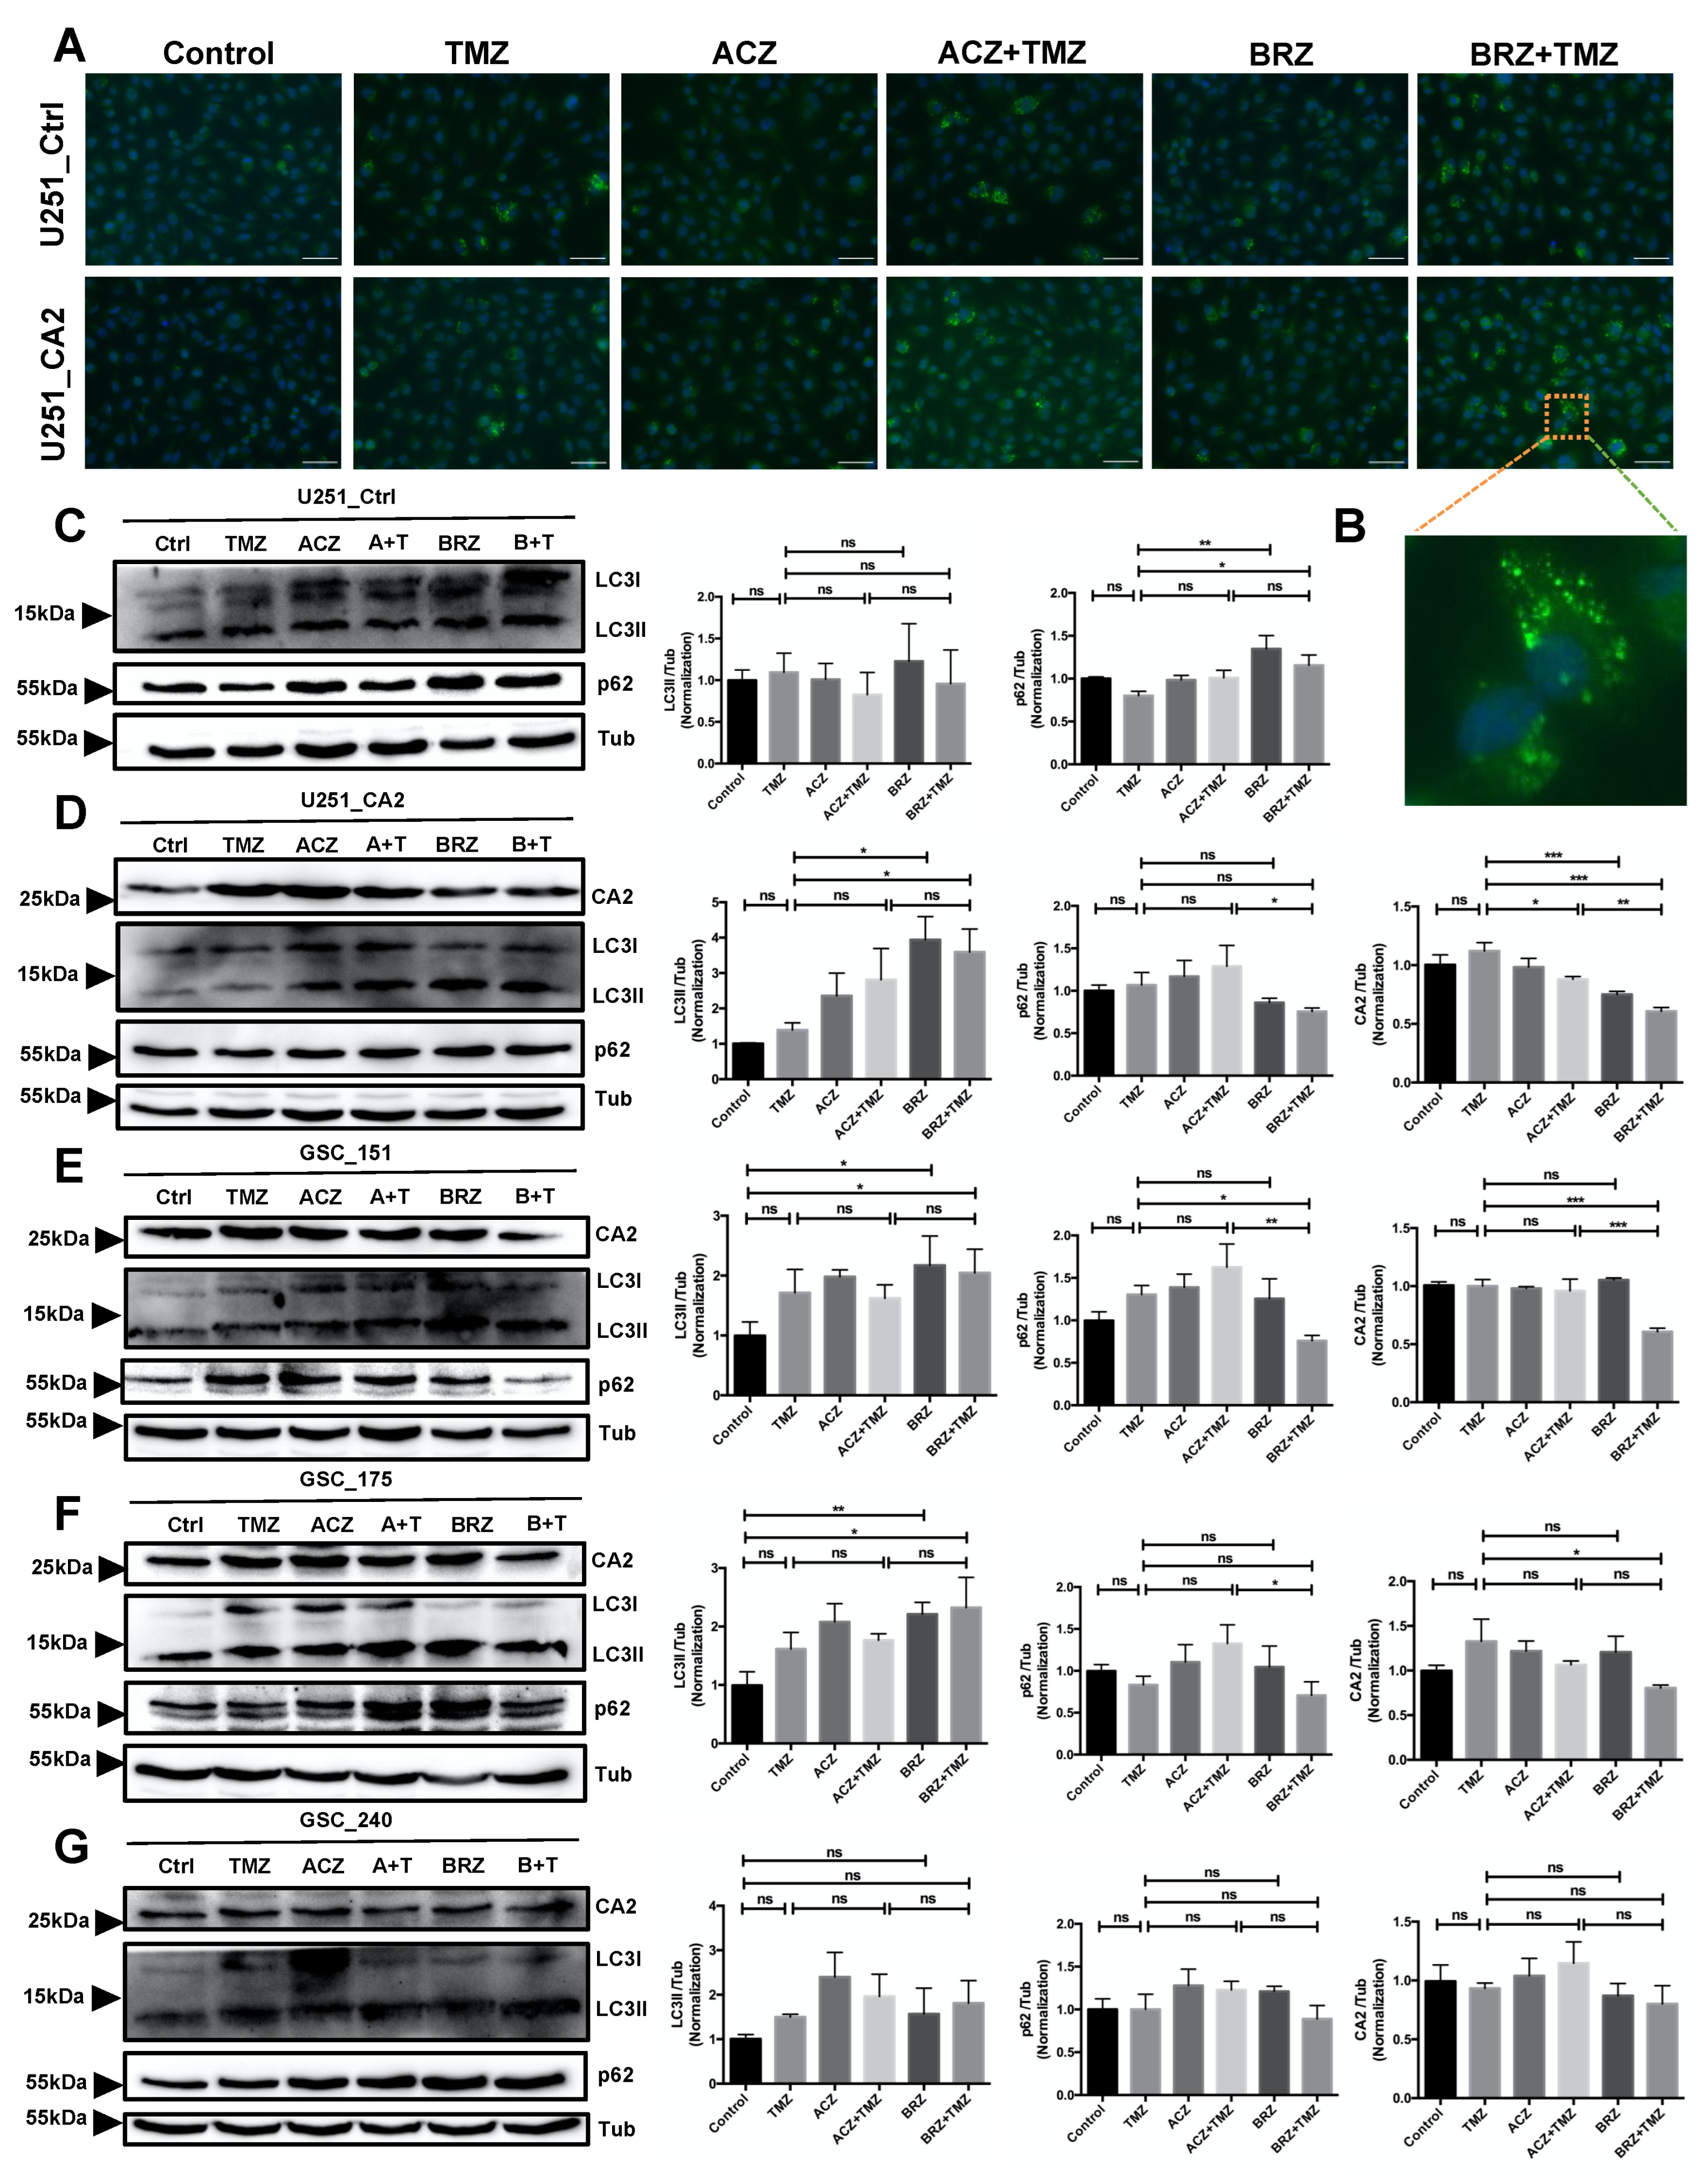
2. Results
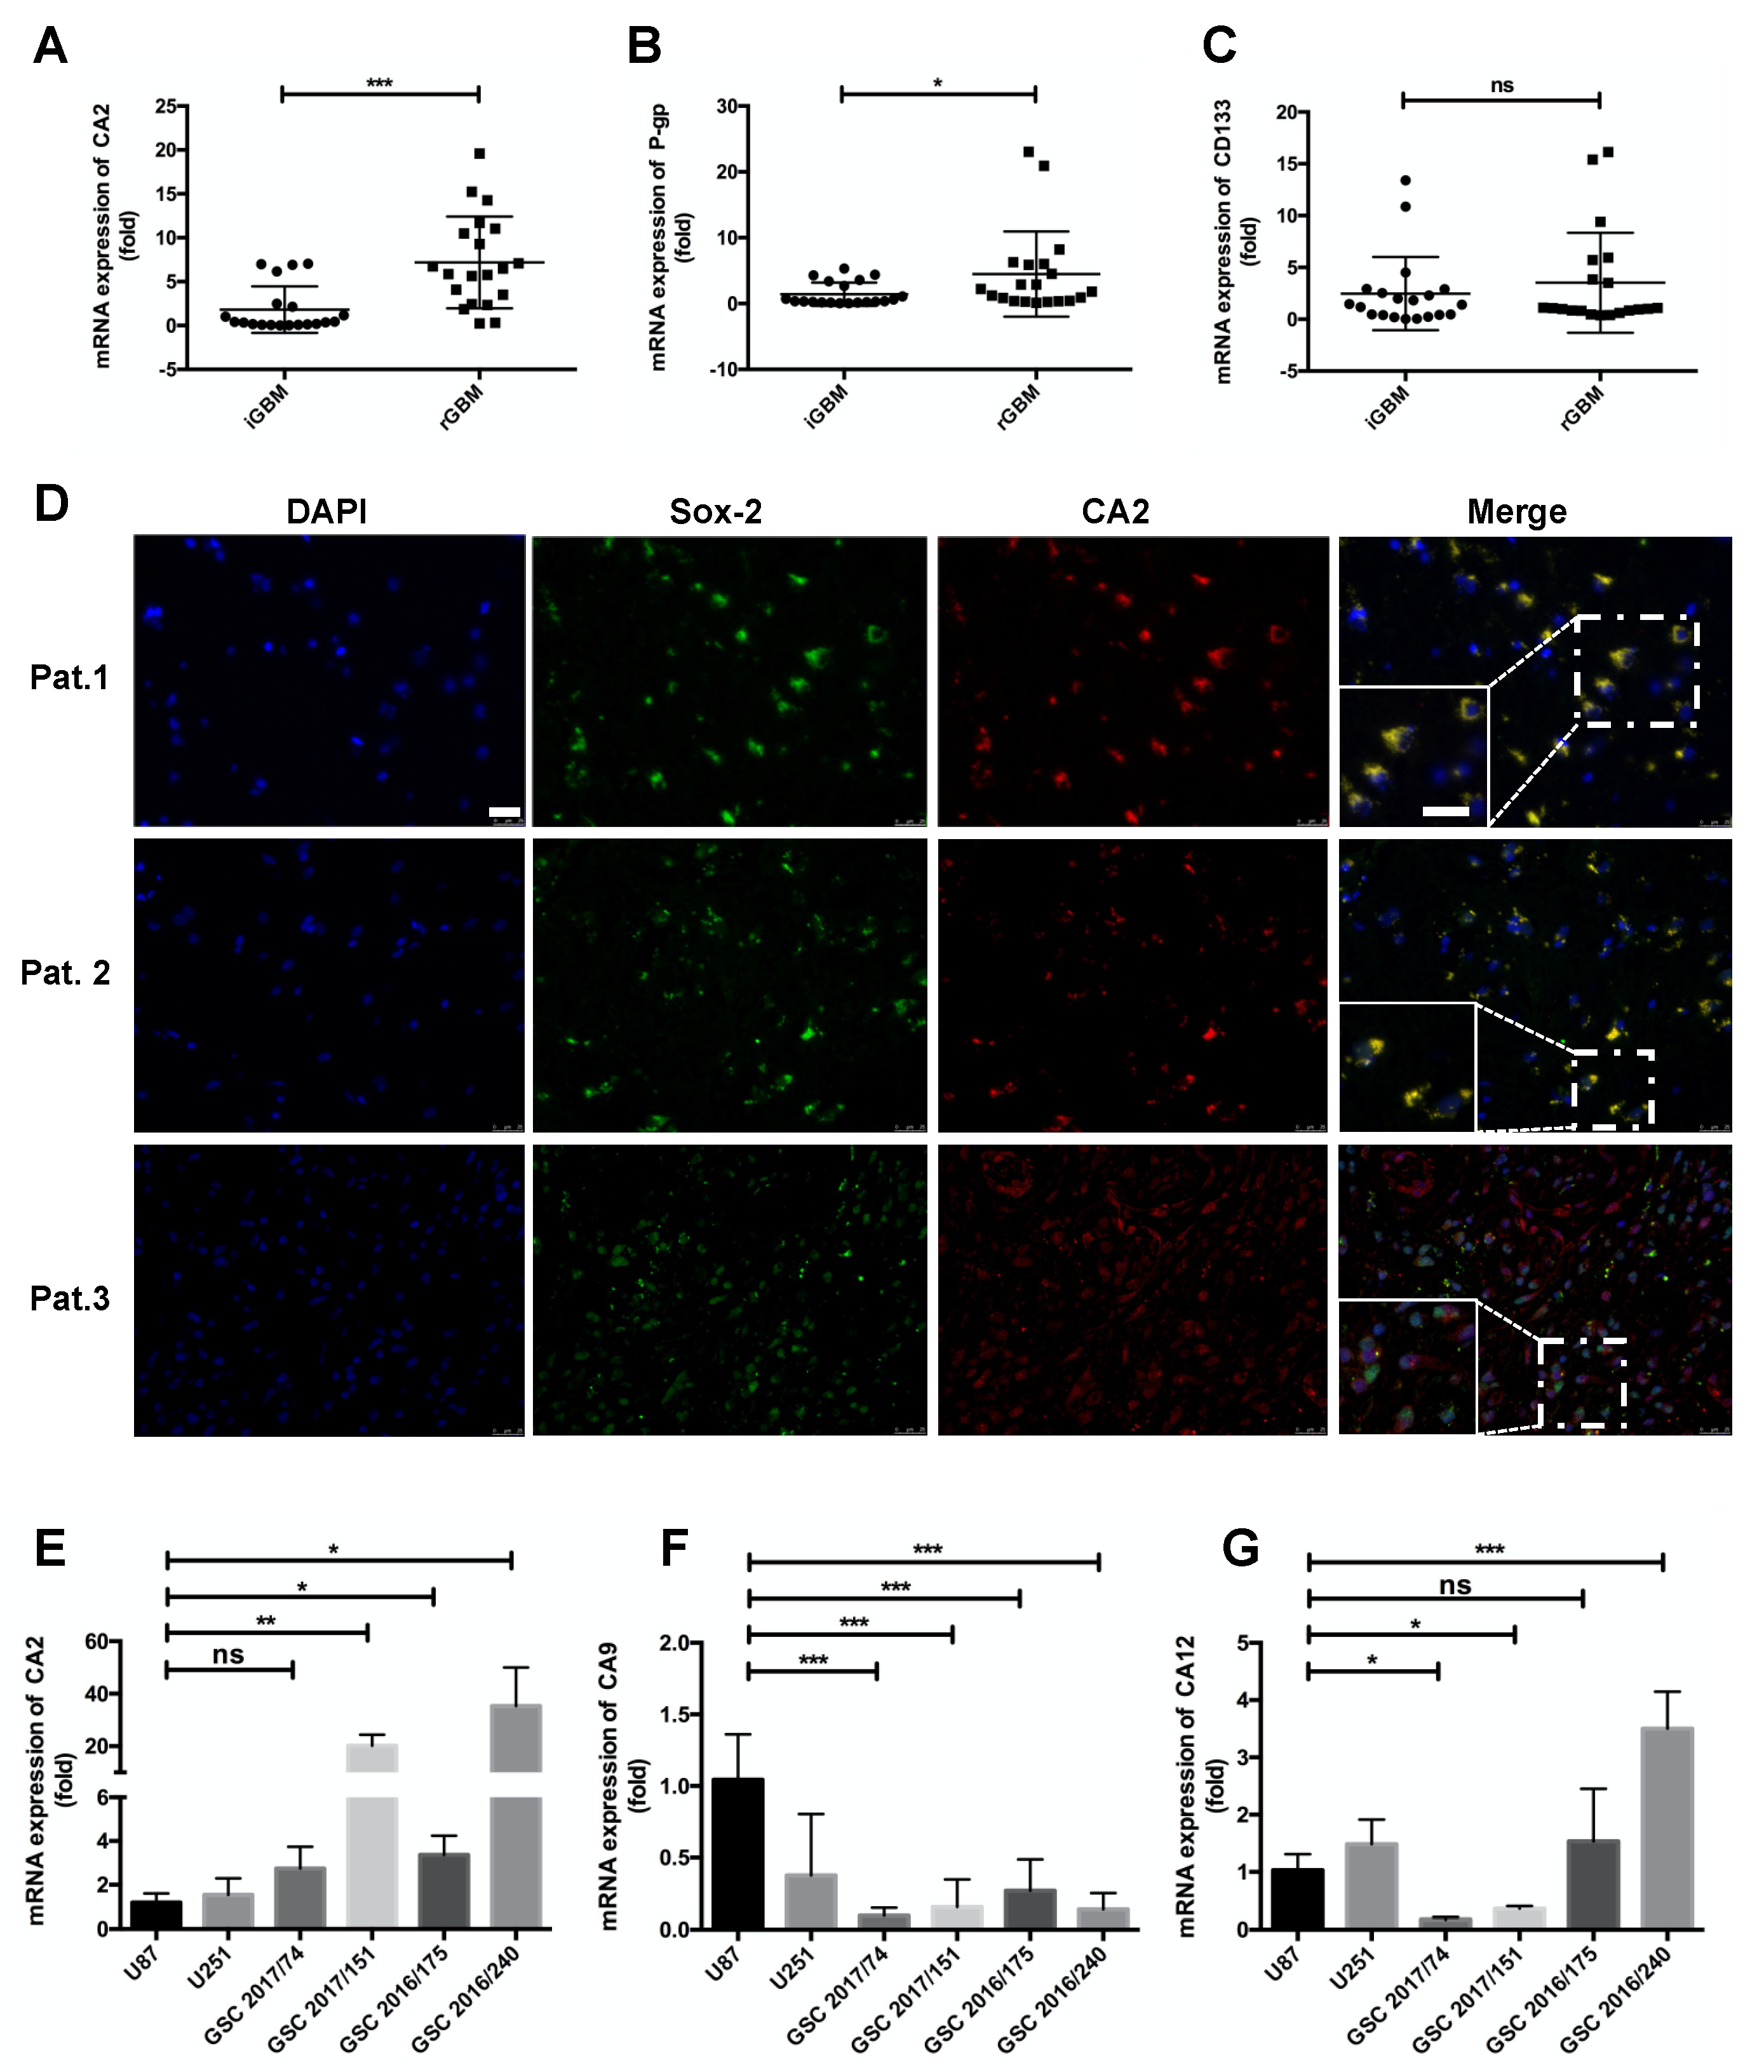
Expression of CA2 in GBM Patients and GBM Stem-like Cells
3. Discussion
4. Materials and Methods
4.1. Clinical Specimens
4.2. Gene Expression Analysis
4.3. Cell Culture
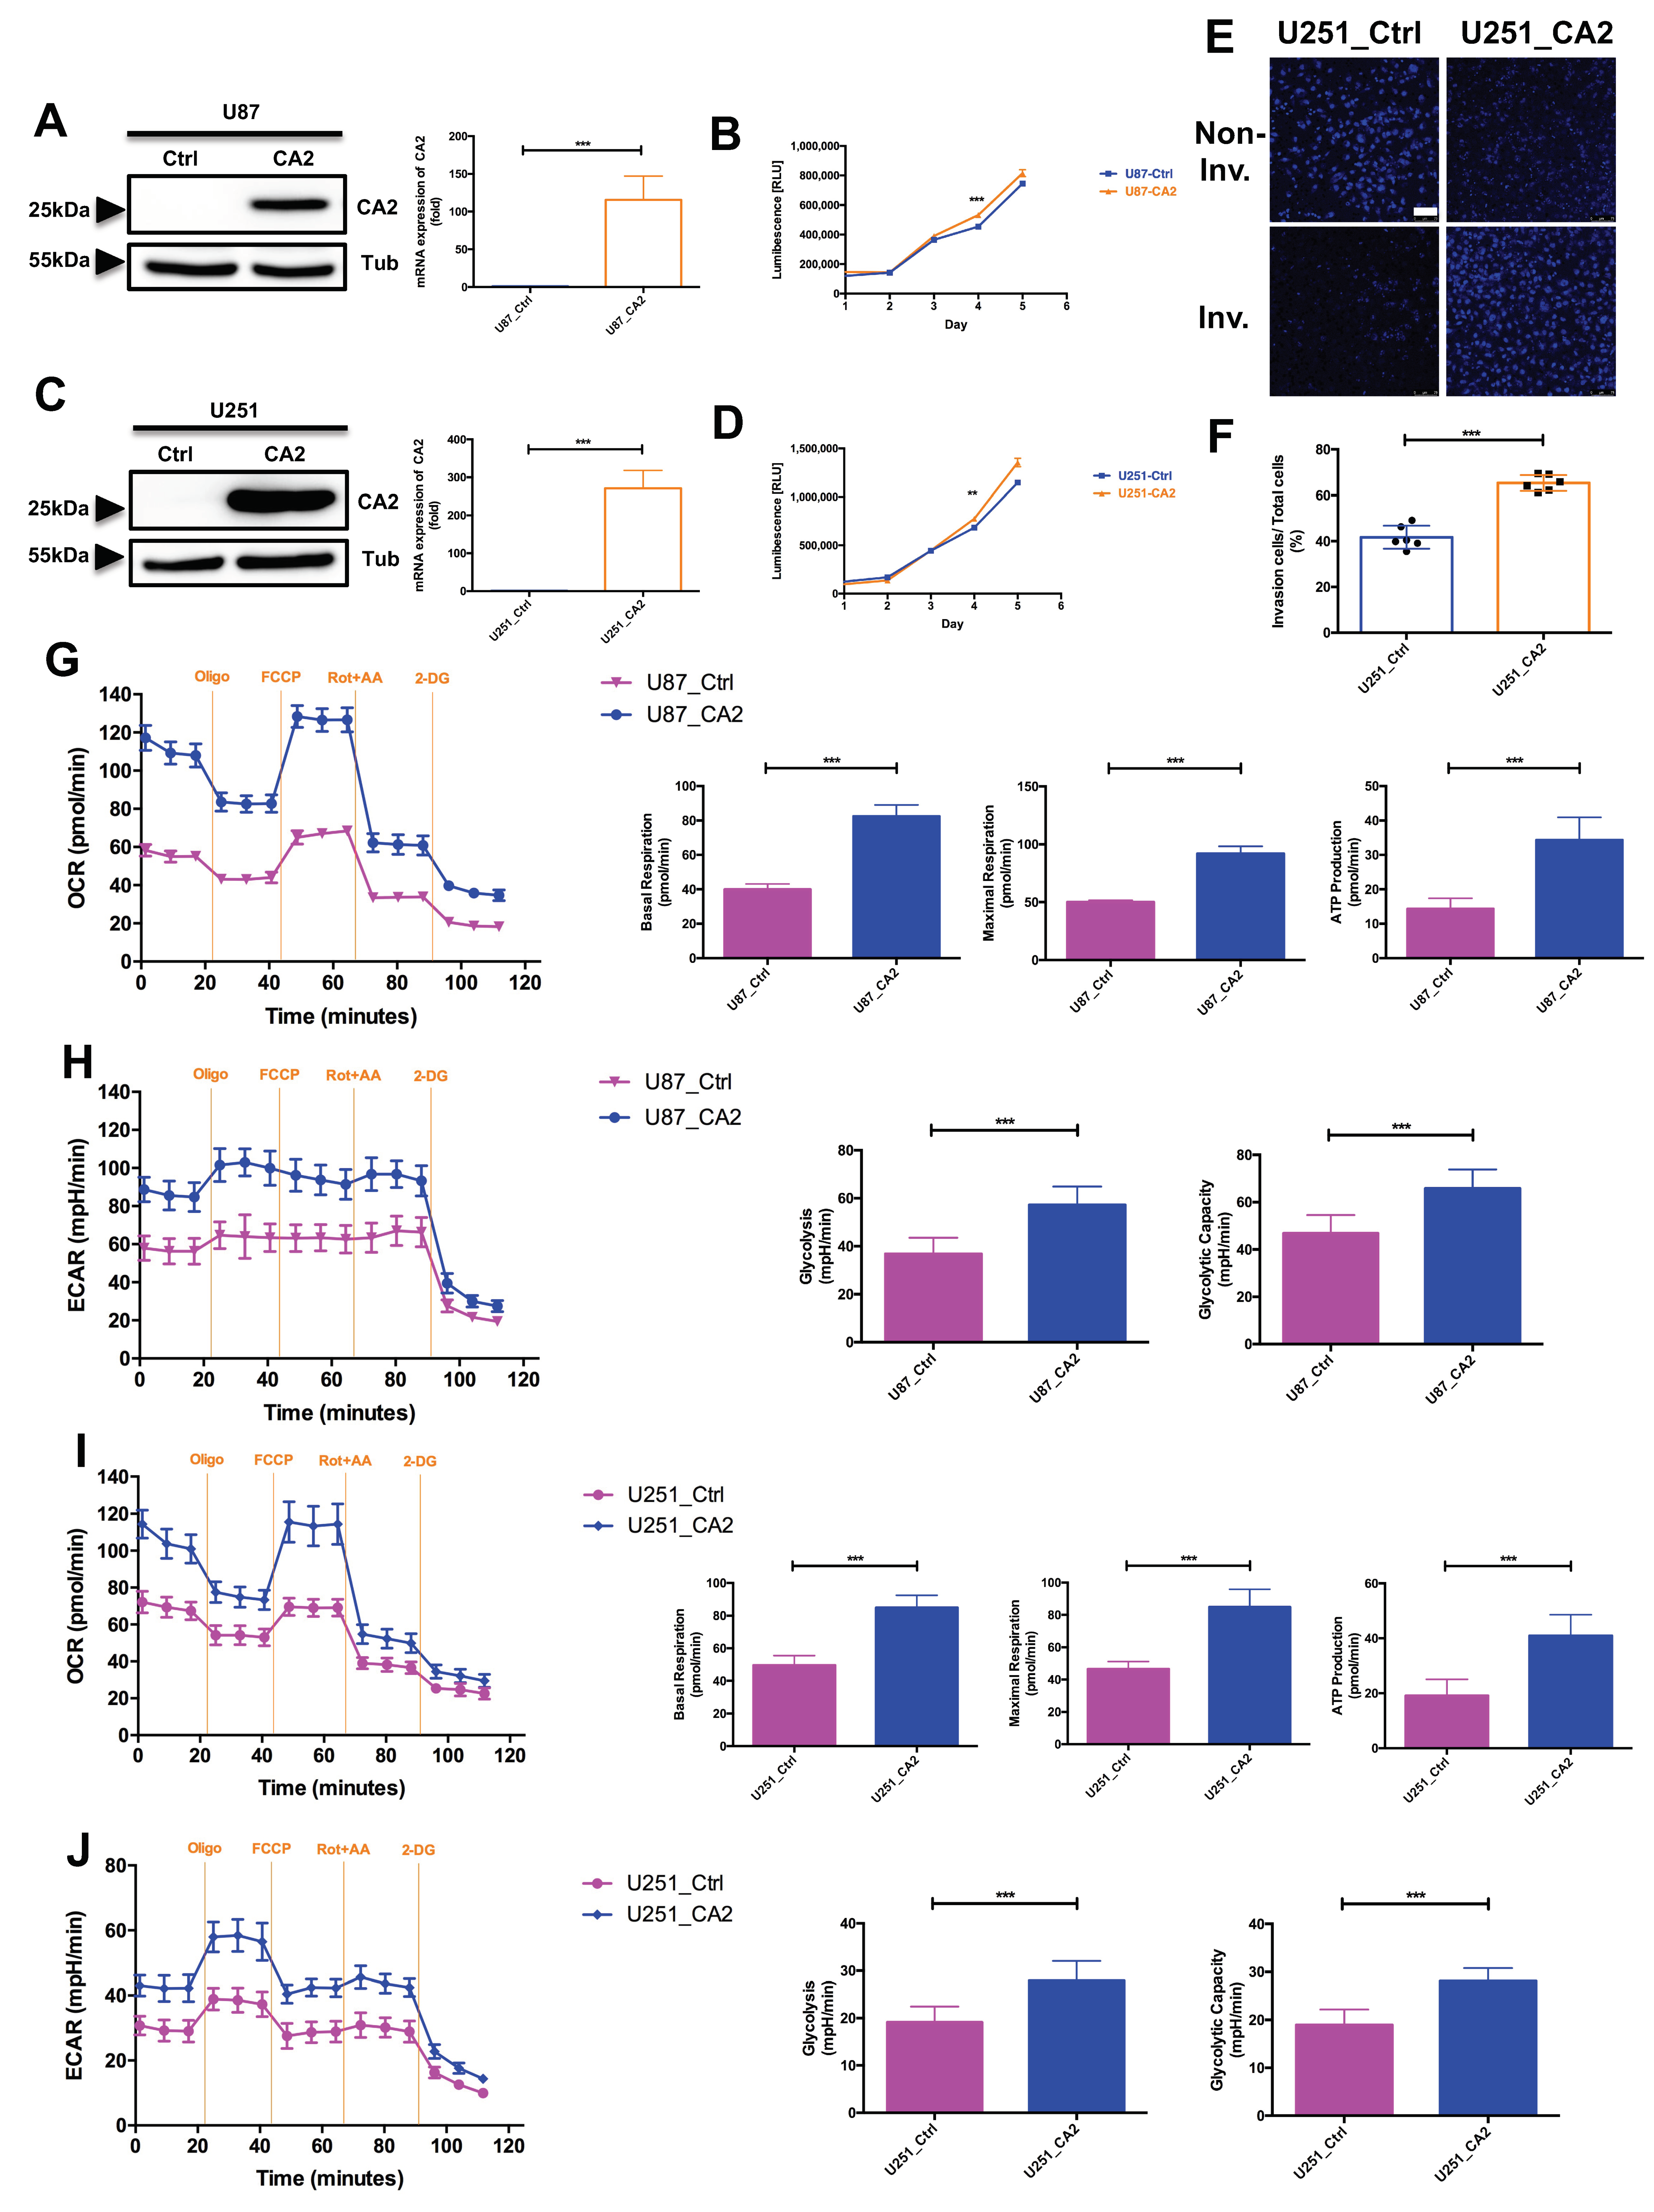
4.4. Generation of CA2 Expressing Stable GBM Cell Lines
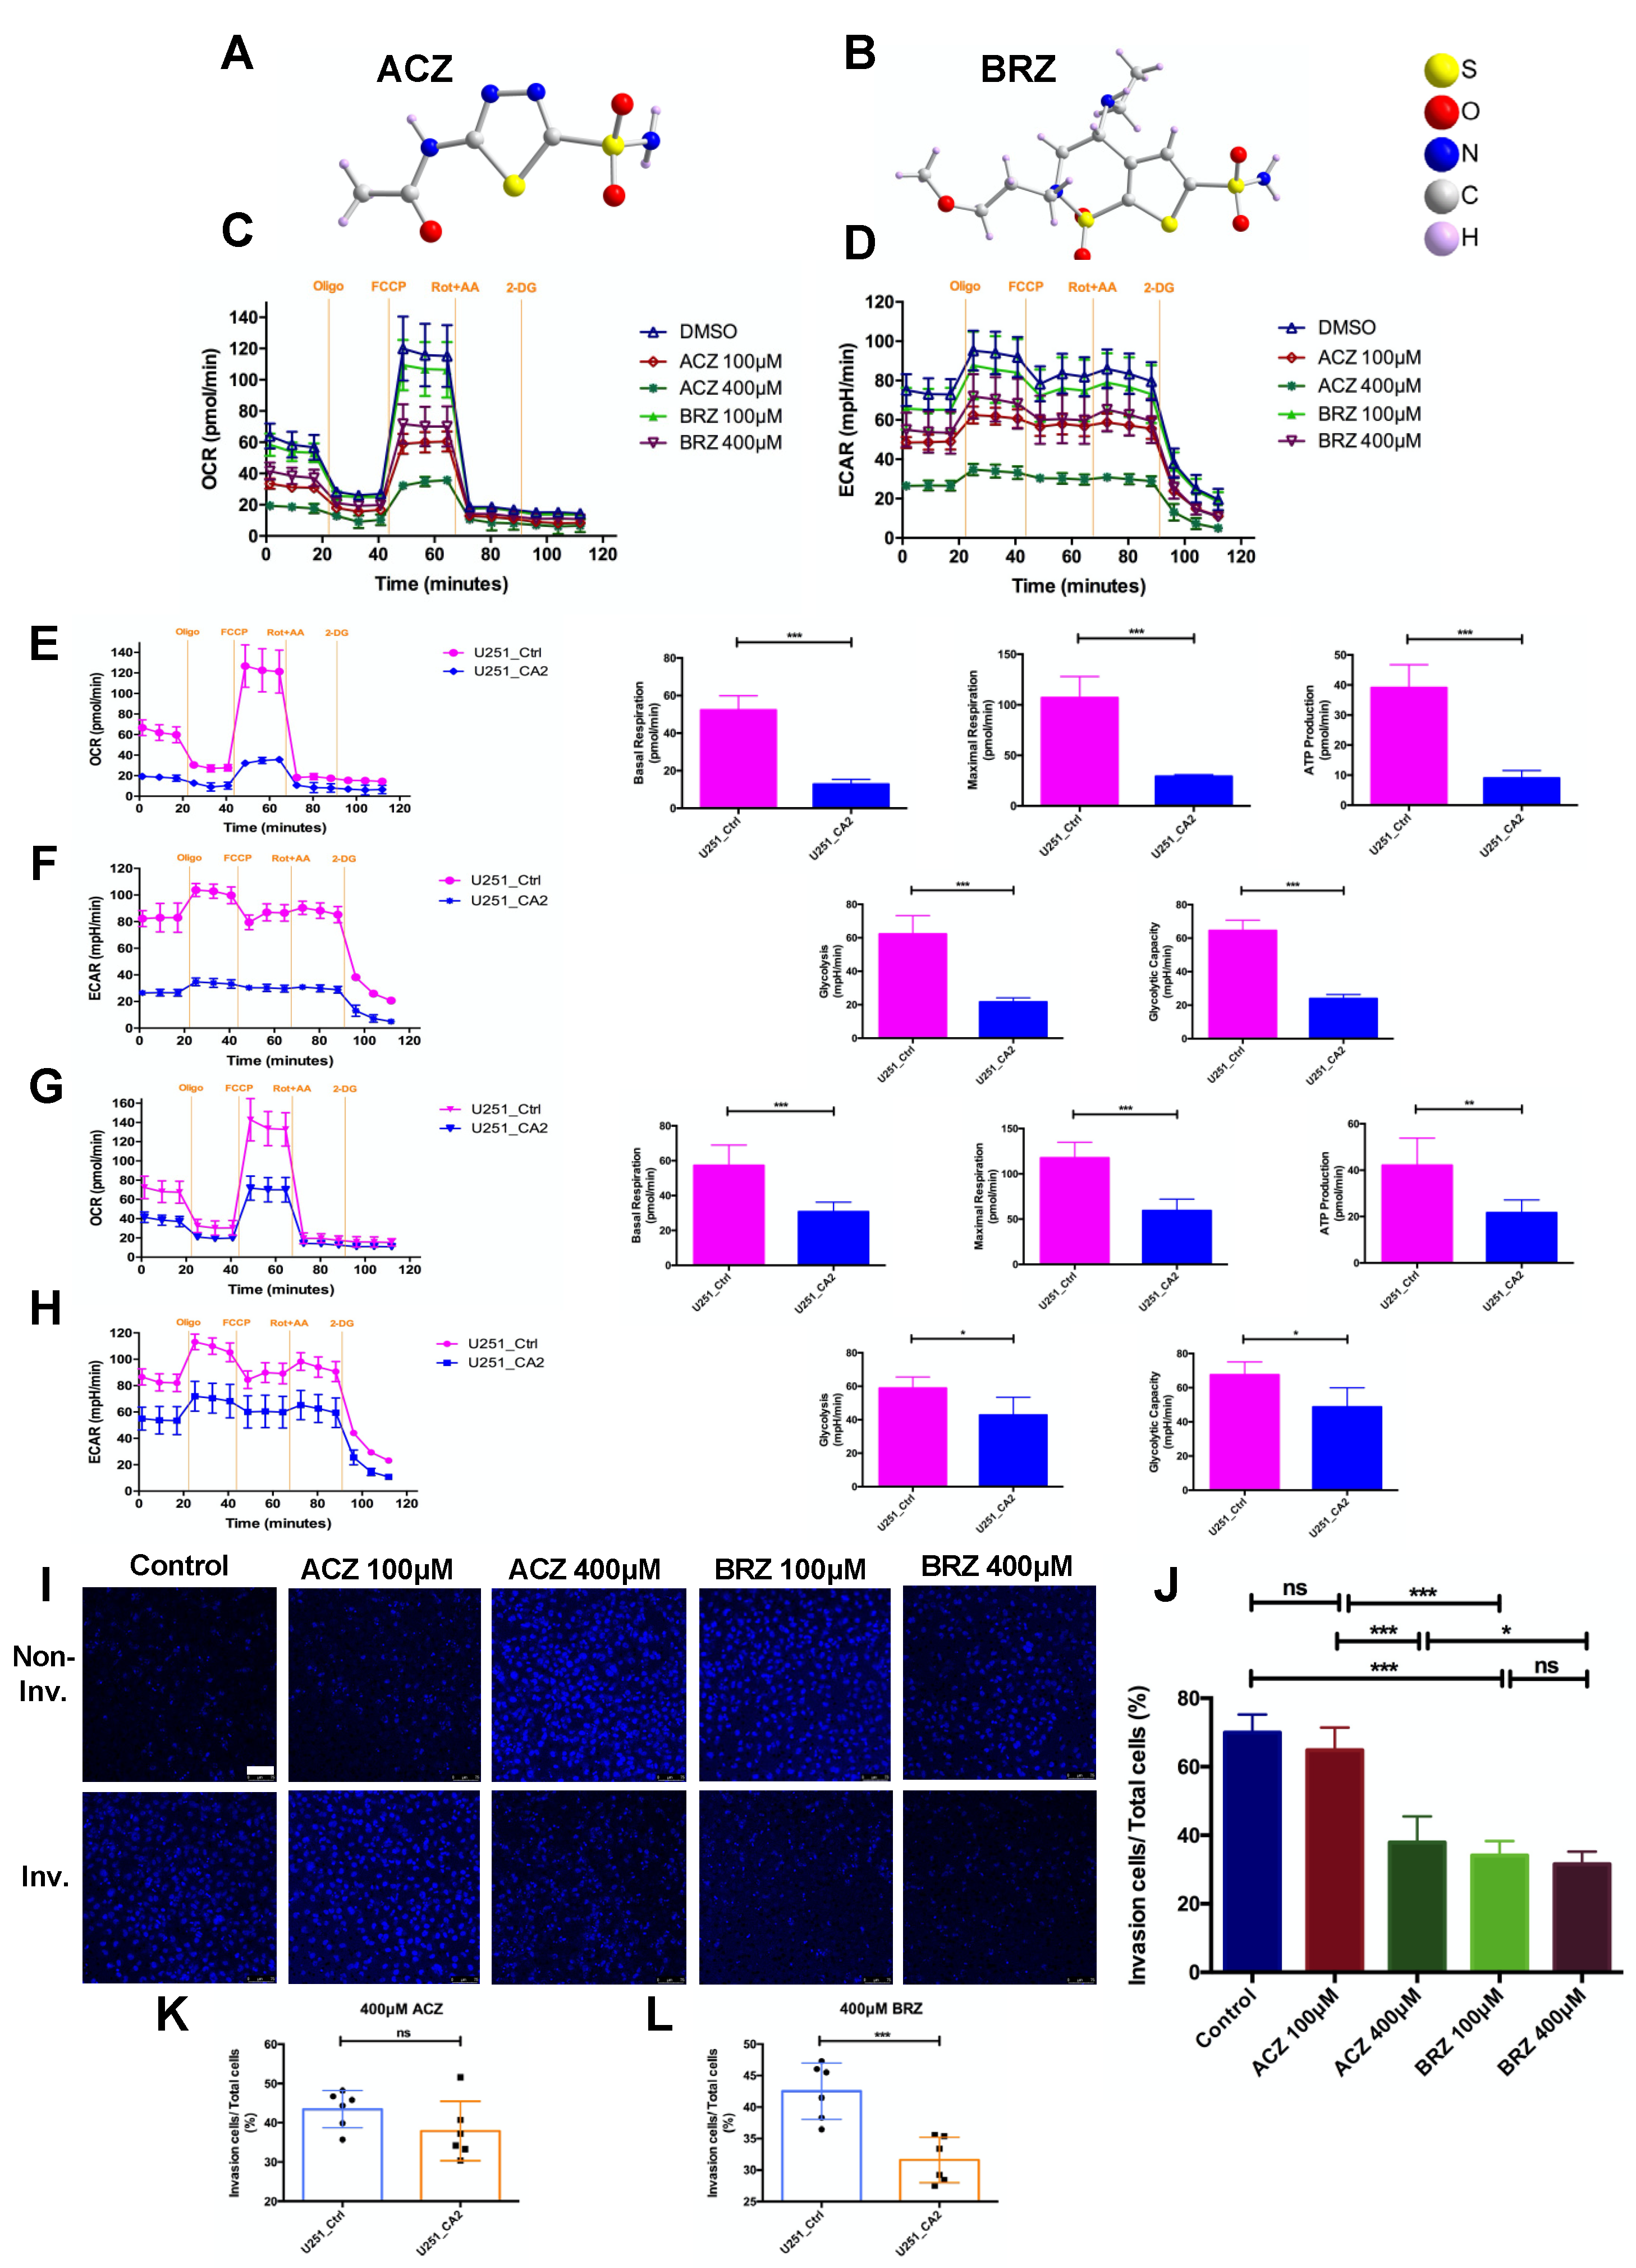
4.5. Invasion Assay
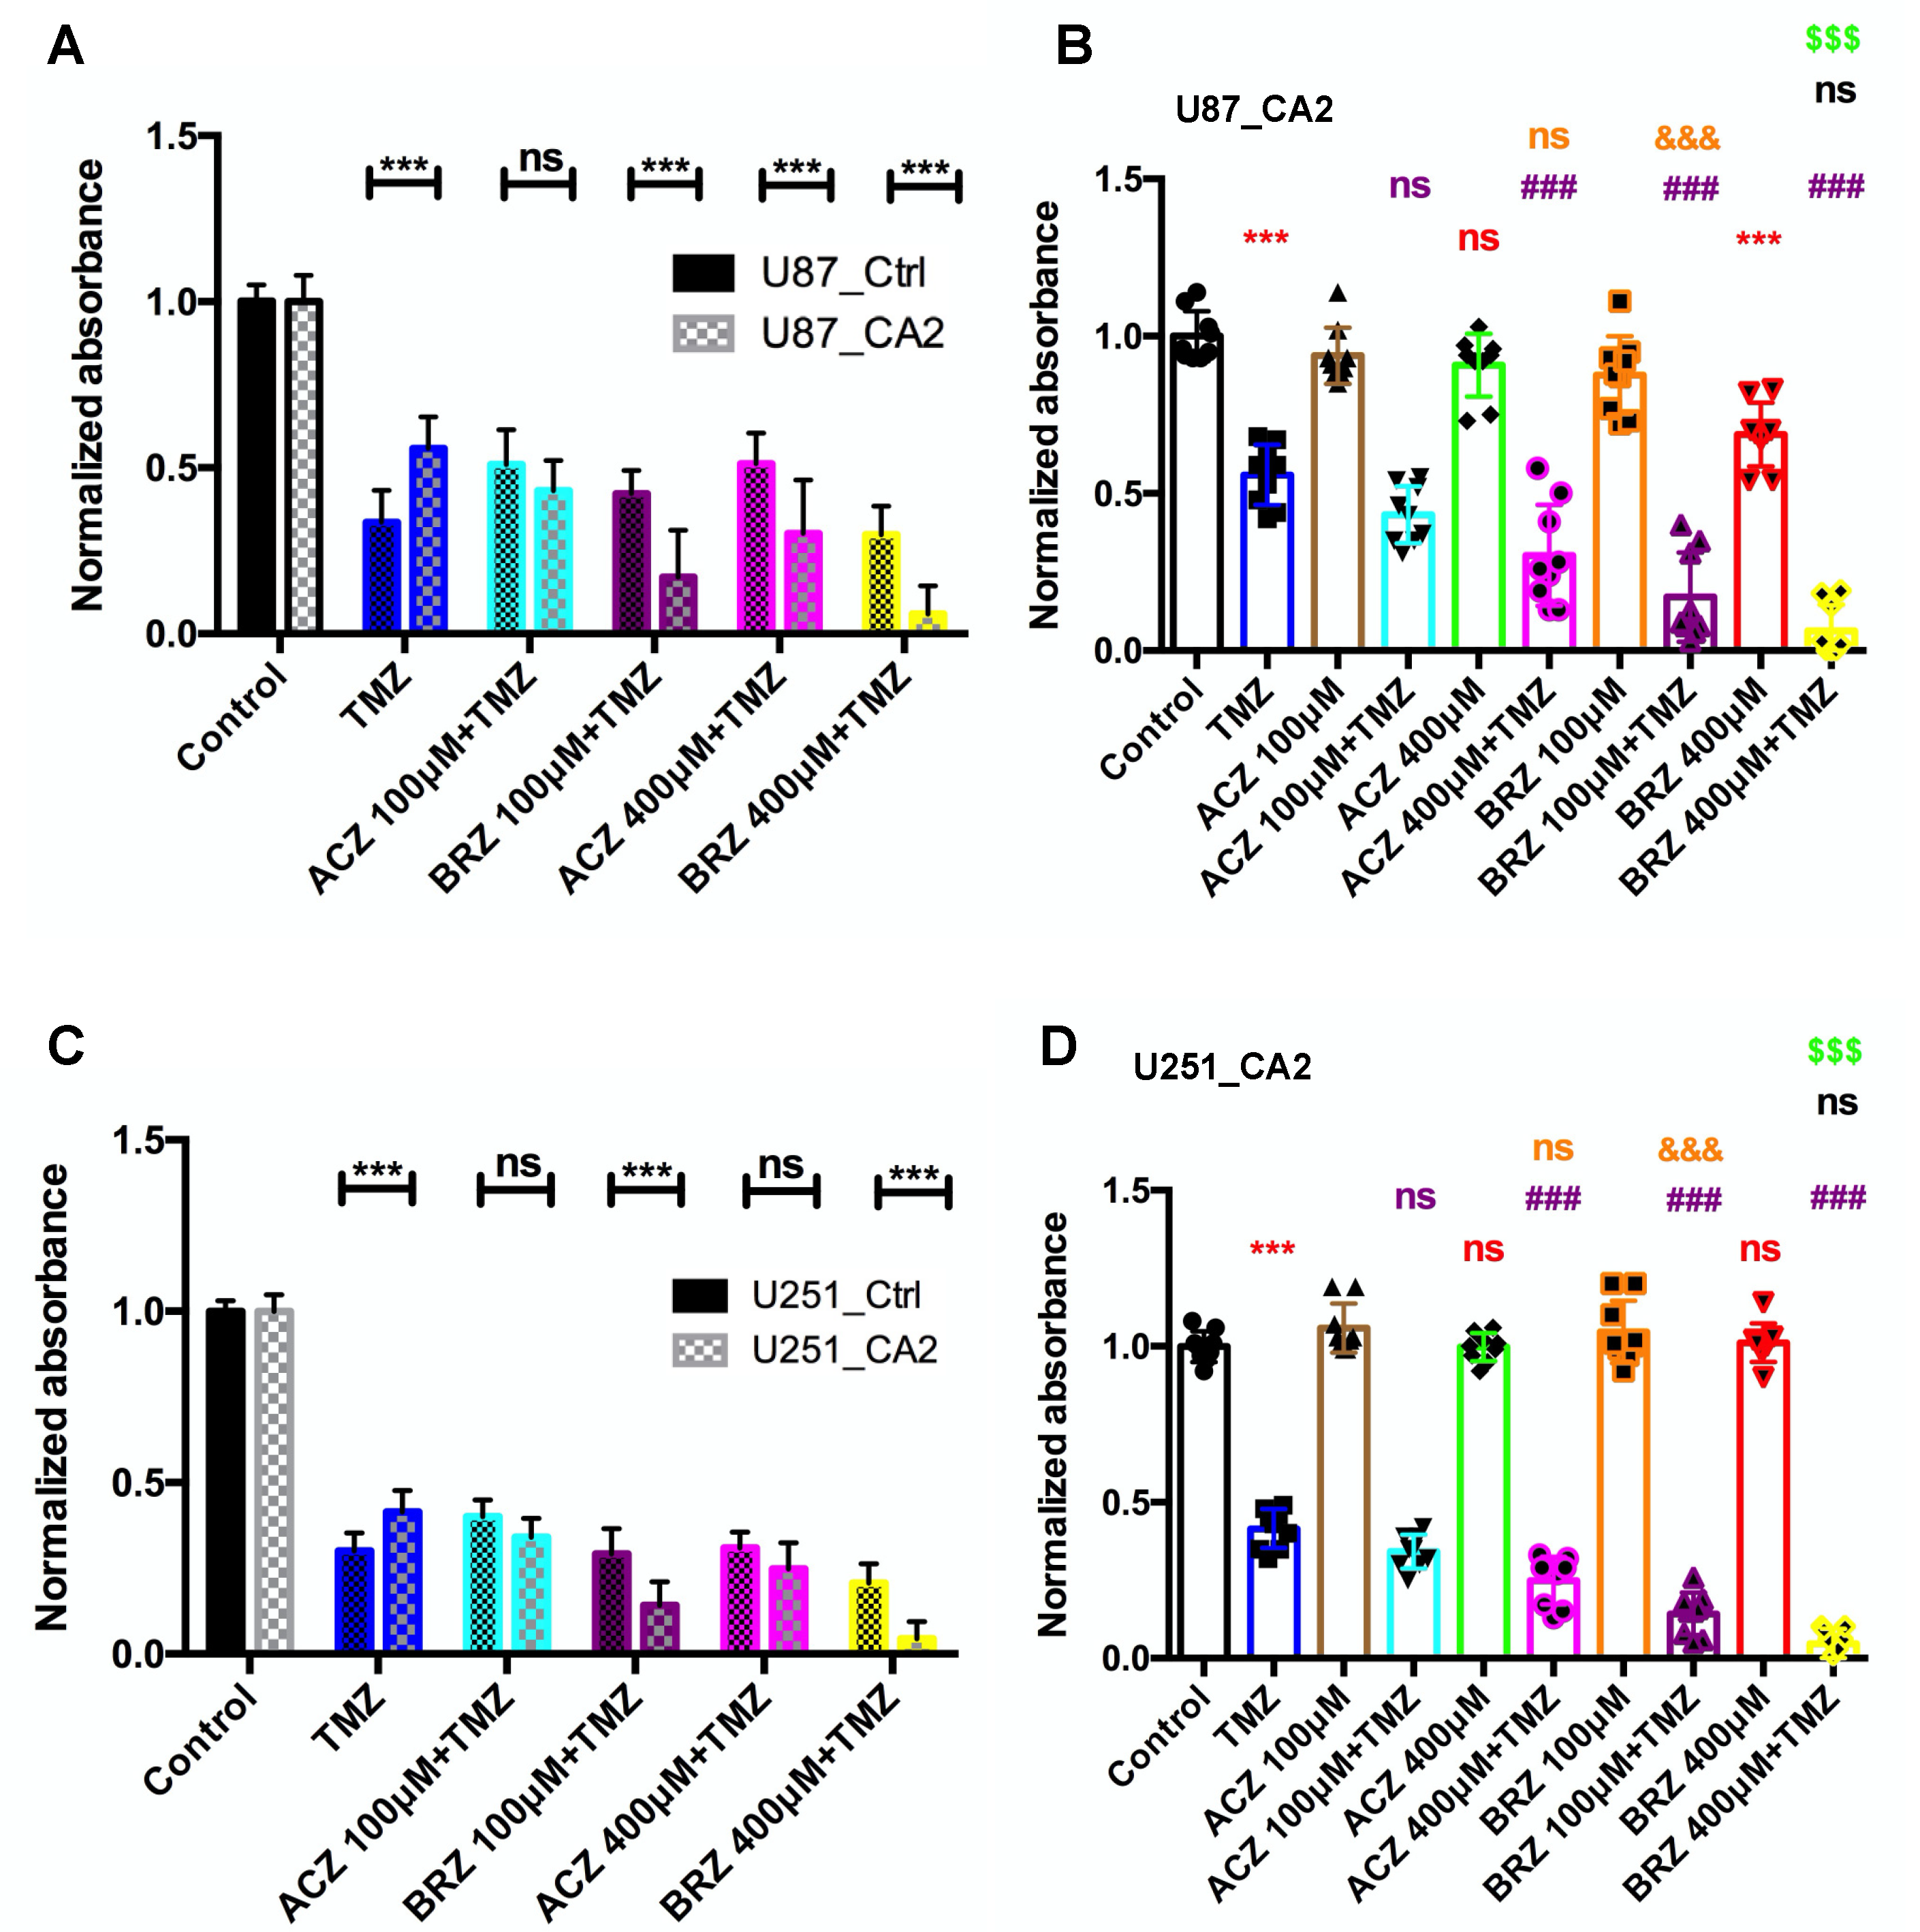
4.6. Cell Viability Assay
4.7. Seahorse Assay
4.8. RNA Isolation, Reverse Transcription, and Quantitative Real-Time PCR
4.9. Protein Extraction and Western Blot Analysis
4.10. Immunofluorescence Staining
4.11. Statistical Analyses
5. Conclusions
Supplementary Materials
Author Contributions
Funding
Institutional Review Board Statement
Informed Consent Statement
Data Availability Statement
Acknowledgments
Conflicts of Interest
References
- Gramatzki, D.; Dehler, S.; Rushing, E.J.; Zaugg, K.; Hofer, S.; Yonekawa, Y.; Bertalanffy, H.; Valavanis, A.; Rohrmann, S.; Oberle, J.; et al. Glioblastoma in the Canton of Zurich, Switzerland, revisited (2005–2009). J. Clin. Oncol. 2015, 33, e13025. [Google Scholar] [CrossRef]
- Rajaratnam, V.; Islam, M.M.; Yang, M.; Slaby, R.; Ramirez, H.M.; Mirza, S.P. Glioblastoma: Pathogenesis and current status of chemotherapy and other novel treatments. Cancers 2020, 12, 937. [Google Scholar] [CrossRef] [PubMed]
- Stupp, R.; Mason, W.P.; van den Bent, M.J.; Weller, M.; Fisher, B.; Taphoorn, M.J.B.; Belanger, K.; Brandes, A.A.; Marosi, C.; Bogdahn, U.; et al. Radiotherapy plus concomitant and adjuvant temozolomide for glioblastoma. N. Engl. J. Med. 2005, 352, 987–996. [Google Scholar] [CrossRef] [PubMed]
- Kim, J.; Lee, I.H.; Cho, H.J.; Park, C.K.; Jung, Y.S.; Kim, Y.; Nam, S.H.; Kim, B.S.; Johnson, M.D.; Kong, D.S.; et al. Spatiotemporal evolution of the primary glioblastoma genome. Cancer Cell 2015, 28, 318–328. [Google Scholar] [CrossRef]
- Campos, B.; Olsen, L.R.; Urup, T.; Poulsen, H.S. A comprehensive profile of recurrent glioblastoma. Oncogene 2016, 35, 5819–5825. [Google Scholar] [CrossRef]
- Stieber, D.; Golebiewska, A.; Evers, L.; Lenkiewicz, E.; Brons, N.H.; Nicot, N.; Oudin, A.; Bougnaud, S.; Hertel, F.; Bjerkvig, R.; et al. Glioblastomas are composed of genetically divergent clones with distinct tumourigenic potential and variable stem cell-associated phenotypes. Acta Neuropathol. 2014, 127, 203–219. [Google Scholar] [CrossRef]
- Dey, M.; Ulasov, I.V.; Lesniak, M.S. Virotherapy against malignant glioma stem cells. Cancer Lett 2010, 289, 1–10. [Google Scholar] [CrossRef]
- Lathia, J.D.; Mack, S.C.; Mulkearns-Hubert, E.E.; Valentim, C.L.L.; Rich, J.N. Cancer stem cells in glioblastoma. Genes Dev. 2015, 29, 1203–1217. [Google Scholar] [CrossRef]
- Ahmad, G.; Amiji, M.M. Cancer stem cell-targeted therapeutics and delivery strategies. Expert Opin. Drug Deliv. 2017, 14, 997–1008. [Google Scholar] [CrossRef]
- Sharifzad, F.; Ghavami, S.; Verdi, J.; Mardpour, S.; Mollapour Sisakht, M.; Azizi, Z.; Taghikhani, A.; Aos, M.J.; Fakharian, E.; Ebrahimi, M.; et al. Glioblastoma cancer stem cell biology: Potential theranostic targets. Drug Resist. Updates Rev. Comment. Antimicrob. Anticancer. Chemother. 2019, 42, 35–45. [Google Scholar] [CrossRef] [PubMed]
- Bao, S.; Wu, Q.; McLendon, R.E.; Hao, Y.; Shi, Q.; Hjelmeland, A.B.; Dewhirst, M.W.; Bigner, D.D.; Rich, J.N. Glioma stem cells promote radioresistance by preferential activation of the DNA damage response. Nature 2006, 444, 756–760. [Google Scholar] [CrossRef]
- Hannen, R.; Selmansberger, M.; Hauswald, M.; Pagenstecher, A.; Nist, A.; Stiewe, T.; Acker, T.; Carl, B.; Nimsky, C.; Bartsch, J.W. Comparative transcriptomic analysis of temozolomide resistant primary GBM stem-like cells and recurrent GBM identifies up-regulation of the carbonic anhydrase CA2 gene as resistance factor. Cancers 2019, 11, 921. [Google Scholar] [CrossRef] [PubMed]
- Wu, L.; Bernal Giovanna, M.; Cahill Kirk, E.; Pytel, P.; Fitzpatrick Carrie, A.; Mashek, H.; Weichselbaum Ralph, R.; Yamini, B. BCL3 expression promotes resistance to alkylating chemotherapy in gliomas. Sci. Transl. Med. 2018, 10, eaar2238. [Google Scholar] [CrossRef] [PubMed]
- Tetu, S.G.; Tanz, S.K.; Vella, N.; Burnell, J.N.; Ludwig, M. The flaveria bidentis β-carbonic anhydrase gene family encodes cytosolic and chloroplastic isoforms demonstrating distinct organ-specific expression patterns. Plant Physiol. 2007, 144, 1316–1327. [Google Scholar] [CrossRef]
- Mustaffa, N.I.; Latif, M.T.; Wurl, O. The role of extracellular carbonic anhydrase in biogeochemical cycling: Recent advances and climate change responses. Int. J. Mol. Sci. 2021, 22, 7413. [Google Scholar] [CrossRef]
- Sly, W.S.; Hu, P.Y. Human carbonic anhydrases and carbonic anhydrase deficiencies. Annu. Rev. Biochem. 1995, 64, 375–401. [Google Scholar] [CrossRef] [PubMed]
- Alterio, V.; Di Fiore, A.; D’Ambrosio, K.; Supuran, C.T.; De Simone, G. Multiple binding modes of inhibitors to carbonic anhydrases: How to design specific drugs targeting 15 different isoforms? Chem. Rev. 2012, 112, 4421–4468. [Google Scholar] [CrossRef]
- Haapasalo, J.; Nordfors, K.; Haapasalo, H.; Parkkila, S. The expression of carbonic anhydrases II, IX and XII in brain tumors. Cancers 2020, 12, 1723. [Google Scholar] [CrossRef]
- Boyd, N.H.; Walker, K.; Fried, J.S.; Hackney, J.R.; McDonald, P.C.; Benavides, G.A.; Spina, R.; Audia, A.; Scott, S.E.; Libby, C.J.; et al. Addition of carbonic anhydrase 9 inhibitor SLC-0111 to temozolomide treatment delays glioblastoma growth In Vivo. JCI Insight 2017, 2, e92928. [Google Scholar] [CrossRef]
- Said, H.M.; Hagemann, C.; Carta, F.; Katzer, A.; Polat, B.l.; Staab, A.; Scozzafava, A.; Anacker, J.; Vince, G.H.; Flentje, M.; et al. Hypoxia induced CA9 inhibitory targeting by two different sulfonamide derivatives including acetazolamide in human glioblastoma. Bioorg. Med. Chem. 2013, 21, 3949–3957. [Google Scholar] [CrossRef] [PubMed]
- Becker, H.M.; Hirnet, D.; Fecher-Trost, C.; Sültemeyer, D.; Deitmer, J.W. Transport activity of MCT1 expressed in Xenopus oocytes is increased by interaction with carbonic anhydrase. J. Biol. Chem. 2005, 280, 39882–39889. [Google Scholar] [CrossRef] [PubMed]
- de la Cruz-López, K.G.; Castro-Muñoz, L.J.; Reyes-Hernández, D.O.; García-Carrancá, A.; Manzo-Merino, J. Lactate in the regulation of tumor microenvironment and therapeutic approaches. Front. Oncol. 2019, 9, 1143. [Google Scholar] [CrossRef]
- Supuran, C.T. Therapeutic applications of the carbonic anhydrase inhibitors. Therapy 2007, 4, 355–378. [Google Scholar] [CrossRef]
- Supuran, C.T. Carbonic anhydrases: Novel therapeutic applications for inhibitors and activators. Nat. Rev. Drug Discov. 2008, 7, 168–181. [Google Scholar] [CrossRef] [PubMed]
- Singh, S.K.; Clarke, I.D.; Terasaki, M.; Bonn, V.E.; Hawkins, C.; Squire, J.; Dirks, P.B. Identification of a cancer stem cell in human brain tumors. Cancer Res. 2003, 63, 5821. [Google Scholar]
- Singh, S.K.; Hawkins, C.; Clarke, I.D.; Squire, J.A.; Bayani, J.; Hide, T.; Henkelman, R.M.; Cusimano, M.D.; Dirks, P.B. Identification of human brain tumour initiating cells. Nature 2004, 432, 396–401. [Google Scholar] [CrossRef]
- Wakimoto, H.; Kesari, S.; Farrell, C.J.; Curry, W.T.; Zaupa, C.; Aghi, M.; Kuroda, T.; Stemmer-Rachamimov, A.; Shah, K.; Liu, T.-C.; et al. Human glioblastoma–derived cancer stem cells: Establishment of invasive glioma models and treatment with oncolytic herpes simplex virus vectors. Cancer Res. 2009, 69, 3472. [Google Scholar] [CrossRef]
- Chen, J.; Li, Y.; Yu, T.-S.; McKay, R.M.; Burns, D.K.; Kernie, S.G.; Parada, L.F. A restricted cell population propagates glioblastoma growth after chemotherapy. Nature 2012, 488, 522–526. [Google Scholar] [CrossRef] [PubMed]
- Oberstadt, M.C.; Bien-Möller, S.; Weitmann, K.; Herzog, S.; Hentschel, K.; Rimmbach, C.; Vogelgesang, S.; Balz, E.; Fink, M.; Michael, H.; et al. Epigenetic modulation of the drug resistance genes MGMT, ABCB1 and ABCG2 in glioblastoma multiforme. BMC Cancer 2013, 13, 617. [Google Scholar] [CrossRef]
- Hu, Z.; Mi, Y.; Qian, H.; Guo, N.; Yan, A.; Zhang, Y.; Gao, X. A potential mechanism of temozolomide resistance in glioma–Ferroptosis. Front. Oncol. 2020, 10, 897. [Google Scholar] [CrossRef] [PubMed]
- Gong, X.; Schwartz, P.H.; Linskey, M.E.; Bota, D.A. Neural stem/progenitors and glioma stem-like cells have differential sensitivity to chemotherapy. Neurology 2011, 76, 1126. [Google Scholar] [CrossRef]
- Bleau, A.M.; Hambardzumyan, D.; Ozawa, T.; Fomchenko, E.I.; Huse, J.T.; Brennan, C.W.; Holland, E.C. PTEN/PI3K/Akt pathway regulates the side population phenotype and ABCG2 activity in glioma tumor stem-like cells. Cell Stem Cell 2009, 4, 226–235. [Google Scholar] [CrossRef] [PubMed]
- Neri, D.; Supuran, C.T. Interfering with pH regulation in tumours as a therapeutic strategy. Nat. Rev. Drug Discov. 2011, 10, 767–777. [Google Scholar] [CrossRef] [PubMed]
- Nordfors, K.; Haapasalo, J.; Korja, M.; Niemelä, A.; Laine, J.; Parkkila, A.-K.; Pastorekova, S.; Pastorek, J.; Waheed, A.; Sly, W.S.; et al. The tumour-associated carbonic anhydrases CA II, CA IX and CA XII in a group of medulloblastomas and supratentorial primitive neuroectodermal tumours: An association of CA IX with poor prognosis. BMC Cancer 2010, 10, 148. [Google Scholar] [CrossRef]
- Nortunen, M.; Huhta, H.; Helminen, O.; Parkkila, S.; Kauppila, J.H.; Karttunen, T.J.; Saarnio, J. Carbonic anhydrases II, IX, and XII in Barrett’s esophagus and adenocarcinoma. Virchows Arch. 2018, 473, 567–575. [Google Scholar] [CrossRef] [PubMed]
- Păunescu, T.G.; Jones, A.C.; Tyszkowski, R.; Brown, D. V-ATPase expression in the mouse olfactory epithelium. Am. J. Physiol.-Cell Physiol. 2008, 295, C923–C930. [Google Scholar] [CrossRef][Green Version]
- Das, A.; Banik, N.L.; Ray, S.K. Modulatory effects of acetazolamide and dexamethasone on temozolomide mediated apoptosis in human glioblastoma T98G and U87MG Cells. Cancer Investig. 2008, 26, 352–358. [Google Scholar] [CrossRef]
- Amiri, A.; Le, P.U.; Moquin, A.; Machkalyan, G.; Petrecca, K.; Gillard, J.W.; Yoganathan, N.; Maysinger, D. Inhibition of carbonic anhydrase IX in glioblastoma multiforme. Eur. J. Pharm. Biopharm. 2016, 109, 81–92. [Google Scholar] [CrossRef]
- Proescholdt, M.A.; Merrill, M.J.; Stoerr, E.-M.; Lohmeier, A.; Pohl, F.; Brawanski, A. Function of carbonic anhydrase IX in glioblastoma multiforme. Neuro-Oncology 2012, 14, 1357–1366. [Google Scholar] [CrossRef]
- Escamilla-Ramírez, A.; Castillo-Rodríguez, R.A.; Zavala-Vega, S.; Jimenez-Farfan, D.; Anaya-Rubio, I.; Briseño, E.; Palencia, G.; Guevara, P.; Cruz-Salgado, A.; Sotelo, J.; et al. Autophagy as a potential therapy for malignant glioma. Pharmaceuticals 2020, 13, 156. [Google Scholar] [CrossRef]
- Gul, H.I.; Yamali, C.; Bulbuller, M.; Kirmizibayrak, P.B.; Gul, M.; Angeli, A.; Bua, S.; Supuran, C.T. Anticancer effects of new dibenzenesulfonamides by inducing apoptosis and autophagy pathways and their carbonic anhydrase inhibitory effects on hCA I, hCA II, hCA IX, hCA XII isoenzymes. Bioorg. Chem. 2018, 78, 290–297. [Google Scholar] [CrossRef]
- Mohammadpour, R.; Safarian, S.; Ejeian, F.; Sheikholya-Lavasani, Z.; Abdolmohammadi, M.H.; Sheinabi, N. Acetazolamide triggers death inducing autophagy in T-47 D breast cancer cells. Cell Biol. Int. 2014, 38, 228–238. [Google Scholar] [CrossRef] [PubMed]
- Greig, S.L.; Deeks, E.D. Brinzolamide/Brimonidine: A review of its use in patients with open-angle glaucoma or ocular hypertension. Drugs Aging 2015, 32, 251–260. [Google Scholar] [CrossRef] [PubMed]
- Hoffmann, L.; Waclawczyk, M.S.; Tang, S.; Hanschmann, E.-M.; Gellert, M.; Rust, M.B.; Culmsee, C. Cofilin1 oxidation links oxidative distress to mitochondrial demise and neuronal cell death. Cell Death Dis. 2021, 12, 953. [Google Scholar] [CrossRef] [PubMed]


Publisher’s Note: MDPI stays neutral with regard to jurisdictional claims in published maps and institutional affiliations. |
© 2021 by the authors. Licensee MDPI, Basel, Switzerland. This article is an open access article distributed under the terms and conditions of the Creative Commons Attribution (CC BY) license (https://creativecommons.org/licenses/by/4.0/).
Share and Cite
Zhao, K.; Schäfer, A.; Zhang, Z.; Elsässer, K.; Culmsee, C.; Zhong, L.; Pagenstecher, A.; Nimsky, C.; Bartsch, J.W. Inhibition of Carbonic Anhydrase 2 Overcomes Temozolomide Resistance in Glioblastoma Cells. Int. J. Mol. Sci. 2022, 23, 157. https://doi.org/10.3390/ijms23010157
Zhao K, Schäfer A, Zhang Z, Elsässer K, Culmsee C, Zhong L, Pagenstecher A, Nimsky C, Bartsch JW. Inhibition of Carbonic Anhydrase 2 Overcomes Temozolomide Resistance in Glioblastoma Cells. International Journal of Molecular Sciences. 2022; 23(1):157. https://doi.org/10.3390/ijms23010157
Chicago/Turabian StyleZhao, Kai, Agnes Schäfer, Zhuo Zhang, Katharina Elsässer, Carsten Culmsee, Li Zhong, Axel Pagenstecher, Christopher Nimsky, and Jörg W. Bartsch. 2022. "Inhibition of Carbonic Anhydrase 2 Overcomes Temozolomide Resistance in Glioblastoma Cells" International Journal of Molecular Sciences 23, no. 1: 157. https://doi.org/10.3390/ijms23010157
APA StyleZhao, K., Schäfer, A., Zhang, Z., Elsässer, K., Culmsee, C., Zhong, L., Pagenstecher, A., Nimsky, C., & Bartsch, J. W. (2022). Inhibition of Carbonic Anhydrase 2 Overcomes Temozolomide Resistance in Glioblastoma Cells. International Journal of Molecular Sciences, 23(1), 157. https://doi.org/10.3390/ijms23010157