Abstract
Neurotrophins constitute a group of growth factor that exerts important functions in the nervous system of vertebrates. They act through two classes of transmembrane receptors: tyrosine-kinase receptors and the p75 neurotrophin receptor (p75NTR). The activation of p75NTR can favor cell survival or apoptosis depending on diverse factors. Several studies evidenced a link between p75NTR and the pathogenesis of prion diseases. In this study, we investigated the distribution of several neurotrophins and their receptors, including p75NTR, in the brain of naturally scrapie-affected sheep and experimentally infected ovinized transgenic mice and its correlation with other markers of prion disease. No evident changes in infected mice or sheep were observed regarding neurotrophins and their receptors except for the immunohistochemistry against p75NTR. Infected mice showed higher abundance of p75NTR immunostained cells than their non-infected counterparts. The astrocytic labeling correlated with other neuropathological alterations of prion disease. Confocal microscopy demonstrated the co-localization of p75NTR and the astrocytic marker GFAP, suggesting an involvement of astrocytes in p75NTR-mediated neurodegeneration. In contrast, p75NTR staining in sheep lacked astrocytic labeling. However, digital image analyses revealed increased labeling intensities in preclinical sheep compared with non-infected and terminal sheep in several brain nuclei. This suggests that this receptor is overexpressed in early stages of prion-related neurodegeneration in sheep. Our results confirm a role of p75NTR in the pathogenesis of classical ovine scrapie in both the natural host and in an experimental transgenic mouse model.
1. Introduction
Neurotrophins are a group of growth factors that exert important functions in the nervous system of vertebrates. They are synthetized and secreted by neurons and other cell types and regulate critical processes, from neuron maturation and synaptic plasticity to maintenance of the nervous tissue during adulthood [1,2]. Their activity has been linked to a number of neuropathological conditions, and changes in their expression have been observed as a response to cell and tissue damage [3,4].
Neurotrophins constitute a family of structurally and functionally related peptides that include the nerve growth factor (NGF), the brain-derived neurotrophic factor (BDNF), and the neurotrophin 3 (NT-3), among others [2]. All of them are synthesized in the form of pro-neurotrophins, which are later processed intra or extra-cellularly and converted into their mature forms [5,6].
The action of neurotrophins depends on two types of transmembrane receptors: the tyrosine-kinase receptors TrkA, TrkB, and TrkC, and the p75 neurotrophin receptor (p75NTR), that belongs to the tumor necrosis factor receptor (TNFR) superfamily [7]. While Trk receptors A, B, and C join to mature forms of NGF, BDNF, and NT-3, respectively, and trigger pro-survival signals, p75NTR respond to both pre-processed and mature forms, although it has higher affinity for pro-neurotrophins [2,6]. In both cases, this receptor activates alternative signaling pathways leading to apoptosis and cell death [1]. Interestingly, p75NTR is also able to interact with other membrane elements, including Trk receptors, in which case it increases their affinity for mature neurotrophins and contributes to pro-survival signaling [8,9], and with sortilin, which participates in the apoptosis outcome through not-yet clarified mechanisms [2,10]. For all these reasons, p75NTR is positioned at the crossroad between cell survival and death and thus has attracted interest due to its potential use as a biomarker for neurodegenerative disorders and, more importantly, as a therapeutic agent.
Prion diseases represent a new paradigm of neurodegenerative conditions. They are caused by unconventional transmissible agents called prions, consisting of a misfolded protein (pathogenic prion protein, or PrPSc) with the ability to transfer its aberrant conformation to the otherwise healthy, physiological cellular prion protein, or PrPC [11,12]. The accumulation of the pathogenic isoform in the brain triggers currently unclarified mechanisms that lead to a neurodegenerative disorder characterized by spongiosis, gliosis, and sometimes presence of amyloid deposits [13,14,15,16,17].
Prions are present in multiple species, including humans and domestic animals. Bovine spongiform encephalopathy (BSE) affects cattle and can be transmitted to humans through consumption of contaminated meat, causing the variant form of Creutzfeldt-Jakob disease (vCJD) [18]. Sheep suffer a form of prion disease called scrapie, which transmits horizontally between individuals. Prion diseases can be experimentally induced in transgenic mice expressing the cellular prion protein (PrPC) of other species, by intracerebral inoculation of brain material from infected individuals [19]. These murine models recapitulate most of the features of the natural disorder, and have been routinely used for the study of all aspects of prionopathies [20,21,22].
Studies addressing the relationship between prion pathogenesis and neurotrophins, although scarce, go in line with several pieces of evidence that link these growth factors and neurodegeneration. One example of such a study proved that PrP106-126, a synthetic peptide homologous to the fragment between amino acids 106 and 126 of human PrP, was able to induce apoptosis in an in vitro model (N2a cells) through the activation of p75NTR and the nuclear factor κB (NF-κB); this suggests a direct interaction between these molecules [23,24]. Another study, this time using an in vivo approach, found a positive correlation between the neuropathological hallmarks of prion disease (spongiosis, PrPSc accumulation and gliosis) and overexpression of p75NTR in a bovinized murine model inoculated with BSE [25]. A third work evidenced a decrease in the levels of p75NTR and other related factors in the brain of scrapie-infected hamsters, which was progressive throughout the course of the disease and correlated with PrPSc accumulation and neuronal death [26]. These works have prompted the interest on neurotrophins as molecules whose study may shed light on the pathogenesis of prion diseases and other neurodegenerative conditions.
In this study, we analyzed the distribution of three neurotrophins (NGF, BDNF, and NT-3) and four neurotrophin receptors (TrkA, TrkB, TrkC, and p75NTR) in brain samples sourced from two different models of scrapie: sheep as the natural host, and Tg338 transgenic mice, which express the ovine PrPC, as an experimental model. After a pilot study that confirmed previous observations in other experimental scenarios [25], we focused on the p75 neurotrophin receptor (p75NTR) and decided to investigate further its distribution, expression, and correlation with other markers of prion disease.
2. Results
2.1. Mapping of Neurotrophins and Neurotrophin Receptors in the Brain Reveals Different Staining Patterns
Two different scrapie models were used: sheep, as the natural host, and Tg338 mice, a transgenic line that expresses ovine PrPC and, therefore, can be experimentally infected with scrapie prions. In the pilot study, two groups of animals of each model were included: the sheep were either healthy or naturally infected with scrapie, and the mice were either inoculated with a scrapie isolate or with physiological saline.
Three neurotrophins (NGF, BDNF, and NT-3) and four neurotrophin receptors (TrkA, TrkB, TrkC, and p75NTR) were mapped in the brain of sheep and Tg338 mice. Each combination of marker and model (ovine or murine) gave a distinctive distribution pattern. However, no clear association with the disease was observed in any case, except for p75NTR in mice.
Both mouse and sheep brains showed neuronal labeling together with neuropil staining of variable intensity for NGF and BDNF (Supplementary Figure S1A–H). In neuronal bodies, immunostaining was located within the cytoplasm. Staining of other cell types or structures in the brain was not observed, suggesting that the distribution of these markers is restricted to neurons at both the pericarion and their projections through the neuropil. This labeling pattern was ubiquitous in medulla oblongata, midbrain, cortices, and hippocampus of both infected and control mice and in medulla oblongata and hippocampus of sheep.
The distributions of NGF and BDNF were similar, suggesting similar or parallel roles in the nervous tissue. No evident differences in the immunostaining of any of these markers were detected between infected and control individuals on either sheep or mice.
Similarly, NT-3 presented a low-intensity intracytoplasmic neuronal pattern in mouse brains (Supplementary Figure S1I) together with a diffuse neuropil labeling which was conspicuous in the grey matter of striatum (Supplementary Figure S1I [inset]). The neuronal staining seemed to be higher in infected mice (Supplementary Figure S1J), although differences with control mice were scarce. In sheep, intracytoplasmic neuronal labeling was granular in nature (Supplementary Figure S1K,L) and more intense than that of mice, while differences between control and infected sheep were subtle or inexistent.
With regard to neurotrophin receptors, TrkA followed a weak and inconstant intraneuronal labeling in both mice (Supplementary Figure S2A,B) and sheep (Supplementary Figure S2C,D) and was also detected at the level of neuropil.
TrkB was located at the level of neuronal membranes (perineuronal labeling) and neuronal prolongations through neuropil in control mice (Supplementary Figure S2E), while in infected mice it was less evident (Supplementary Figure S2F). In contrast, infected and control sheep manifested a mild granular intracytoplasmic staining (Supplementary Figure S2G,H). Finally, TrkC followed a neuronal intracytoplasmic staining pattern together with a conspicuous labeling of neuronal and glial branching in control mice; these branches were particularly notorious in the molecular layer of cerebellar cortex (Supplementary Figure S2I [inset]). Infected mice showed also strong labeling of Purkinje neurons in the cerebellum (Supplementary Figure S2J [inset]). In sheep, intracytoplasmic labeling was weaker and, in opposition with the situation in mice, Purkinje cells staining was only observed in control, but not in infected sheep (Supplementary Figure S2K,L [insets]).
Remarkably, p75 neurotrophin receptor manifested two distinct, clearly differentiable immunostaining patterns. As the rest of analyzed markers, the first pattern was a neuronal intracytoplasmic staining that was observed in all brain areas and in both mice (Figure 1A,B) and sheep (Figure 1E,F).
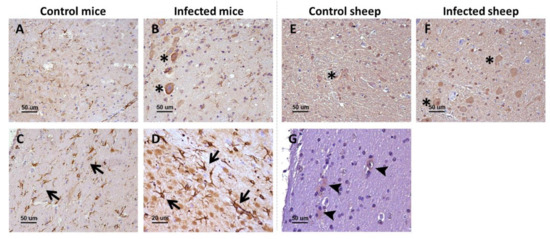
Figure 1.
p75NTR receptor in the brain of infected and control mice and sheep. In the upper row (A,B,E,F), the general patterns (neuropil staining [not marked] and neuronal intracytoplasmic staining [asterisks]) observed in the two models are displayed, while the lower row (C,D,G) shows specifically the glial staining found in mice (arrows) and sheep (arrowheads). Microphotographs taken from medulla oblongata (A,B,D,E,F), corpus callosum (C), and hippocampus (G).
The second pattern was only visualized in mice and consisted of star-shaped immunostained cells, different from neurons and likely corresponding to the glia, and whose morphology and distribution resembled those of astrocytes. This labeling was particularly conspicuous in white matter structures, including the corpus callosum (Figure 1C). In addition, these immunostained star-shaped cells were more abundant and fibrous in the brains of infected mice than in control mice (Figure 1D).
Sheep showed the neuronal intracytoplasmic labeling but not the glial labeling, not even after harsher epitope retrieval protocols were tested. However, in the white matter of sheep, some positive glial cells (probably astrocytes and oligodentrocytes) were detected (Figure 1G). No changes were observed between control and infected sheep.
2.2. Glial Immunostaining for p75NTR Is Increased in Terminally Scrapie-Infected Mice
After careful assessment of each of the neurotrophins and receptors, we decided to further analyze the distribution of p75NTR. Thus, we performed immunohistochemistry for this receptor on an ampler selection of mouse and sheep brain samples. This included three groups for each model: terminally diseased, preclinical and control, non-infected animals.
The glial labeling was more intense in terminal mice (Figure 2E,F), in comparison with control mice (Figure 2A,B). This was especially notorious in medulla oblongata, where p75NTR-positive star-shaped cells were more abundant and fibrous. This increased glial p75NTR pattern was less evident in the preclinical group (Figure 2C,D).
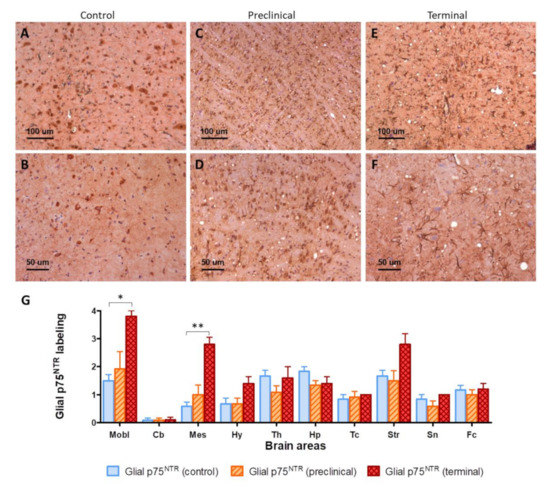
Figure 2.
(A–F) Visual comparison of p75NTR glial immunolabeling between control (A,B), preclinical (C,D), and terminal mice (E,F). Notice the presence of more abundant and fibrous p75NTR-positive glial cells (purportedly astrocytes) in infected animals, together with the presence of vacuolization (spongiform lesion) in infected but not in control mice. (G) Semi-quantification of glial p75NTR labeling in ten brain areas. Mobl: medulla oblongata, Cb: cerebellar cortex, Mes: mesencephalon, Hy: hypothalamus, Th: thalamus, Hp: hippocampus, Tc: parietal and temporal cortices at the level of thalamus, Str: striatum, Sn: septal nuclei, Fc: frontal cortex. Error bars represent SEM. Kruskal–Wallis test followed by Dunn’s post-hoc pairwise comparison, * p ≤ 0.05, ** p ≤ 0.01.
The intensity of glial p75NTR labeling was semi-quantitatively evaluated in ten areas of mouse brains. Significant differences were found between control and terminal animals in medulla oblongata (p = 0.0187) and mesencephalon (p = 0.0067). Significant variability was also found at the striatum (p = 0.0020), and although post-hoc pairwise comparison did not disclose significant differences between groups, terminal animals showed clearly increased values (Figure 2G).
2.3. Global p75NTR Immunolabeling Is Not Altered by Disease Progression in Mice
In contrast to the semi-quantitative evaluation approach, which quantified exclusively the glial pattern, the global p75NTR immunolabeling was assessed by image analysis. No significant differences were found between terminal, preclinical, and control mice in any area (Supplementary Figure S3). This suggests that, although higher numbers of p75NTR-positive glial cells are present in diseased animals, the overall levels of this receptor seem not to be affected by the disease progression. Rather, this higher abundance of alleged astrocytes is likely to reflect the presence of astrogliosis, a neuropathological feature usually found in prion disease–terminally affected individuals.
2.4. Global p75NTR Immunolabeling Is Increased in Several Brainstem Nuclei of Preclinical Scrapie Infected Sheep
In contrast with mice, p75NTR immunostaining in sheep consisted mainly of an intense intraneuronal, pancytoplasmic labeling, together with a generalized staining of neuropil. However, and in accordance with pilot experiments, sheep brain samples lacked the ramified astrocytic labeling observed in mice.
Careful visual examination identified other staining patterns in sheep brains. For instance, in hippocampus, control sheep showed intraneuronal granular deposits located in one of the poles of the pericarion (Supplementary Figure S4, panel G) and diffuse, fine punctuate staining in the neuropil, while infected sheep showed coarse granular deposits in neuropil (Supplementary Figure S4, panels H–I) together with granular accumulations widely spread in the cytoplasm of neurons. However, the observed differences were subtle, and it was not possible to quantify them for statistical purposes.
In addition, no differences in immunostaining were observed between control and infected animals in brainstem or spinal cord, in which an intense intraneuronal pancytoplasmic staining, sometimes granular, was observed (Supplementary Figure S4, panels A, B, D–F), or in white matter tracts, which showed a strong intracytoplasmic targeting of glial cells probably corresponding to oligodendrocytes (Supplementary Figure S4, panel C).
The assessment of global p75NTR staining through image analyses disclosed significant differences in several brain nuclei between infected and control sheep (Figure 3). Most of the differences consisted of higher immunostaining intensity in preclinical animals compared with control, non-infected sheep and with clinical sheep.
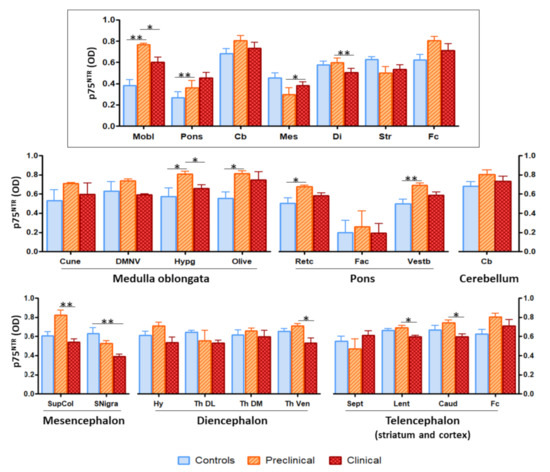
Figure 3.
Image analysis of p75NTR immunostaining in sheep brains showed significant differences between groups of animals in several brain areas and nuclei. The upper panel (framed) represents the overall staining in the different brain areas (Mobl: medulla oblongata, Pons: pons, Cb: cerebellum, Mes: mesencephalon, Di: diencephalon, Str: striatum, Fc: frontal cortex), while the lower panels (non-framed), show the staining in specific nuclei within those regions (Cune: cuneate nucleus, DMNV: dorsal motor nucleus of the vagus, Hypg: hypoglossal nucleus, Retc: reticular formation, Fac: facial nucleus, Vestb: vestibular nucleus, SupCol: superior colliculus, SNigra: substantia nigra, Hy: hypothalamus, Th DL: dorsolateral nuclei of thalamus, Th DM: dorsomedial nuclei of thalamus, Th Ven: ventral nuclei of thalamus, Sept: septal area, Lent: lenticular nucleus, Caud: caudate nucleus). The height of the bars represents the mean optical density (OD). Error bars represent SEM. Kruskal–Wallis test followed by Dunn’s post-hoc pairwise comparison, * p ≤ 0.05, ** p ≤ 0.01.
The area where the most significant differences were recorded (p = 0.0018) was medulla oblongata. Image analysis of the different nuclei included in this region revealed significant differences in hypoglossal nucleus (between control and preclinical and between preclinical and clinical, p = 0.0147) and olivary nuclei (between control and preclinical, p = 0.0221).
Significance was also found in comparisons between control and preclinical sheep in pons (p = 0.0085) and between preclinical and terminal sheep in mesencephalon (p = 0.0176) and diencephalon (p = 0.0019). Additionally, significant differences were noted between control and preclinical animals in reticular formation (p = 0.0303) and vestibular nucleus (p = 0.0103), between control and clinical animals in substantia nigra (p = 0.0046), and between preclinical and clinical animals in superior colliculus (p = 0.0053), ventral nucleus of the thalamus (p = 0.0443), lenticular nucleus (p = 0.0120), and caudate nucleus (p = 0.0530).
2.5. Similarities in the Distribution of p75NTR- and GFAP-Immunolabeled Glial Cells Suggest p75NTR Expression in Astrocytes from Mice, but not Sheep
We next wondered whether the glial staining pattern seen in mice corresponded to astrocytes. Presence of reactive astrocytes is a frequent hallmark of prion diseases at advanced stages of neurodegeneration [17].
There was an evident parallelism between the immunostaining for glial fibrillary acidic protein (GFAP), a marker of reactive astrocytes, and for p75NTR in mouse brains. Immunohistochemistry against GFAP (Figure 4C,D) revealed a distribution of astrocytes that closely resembled that of p75NTR-positive glial cells (Figure 4A,B). However, p75NTR did not only target astrocytic populations but also neurons, as evidenced by the similarity between the staining patterns of p75NTR and NeuN (neuronal nuclei, a neuron-specific marker) in certain areas such as medulla oblongata (Figure 4E,F).
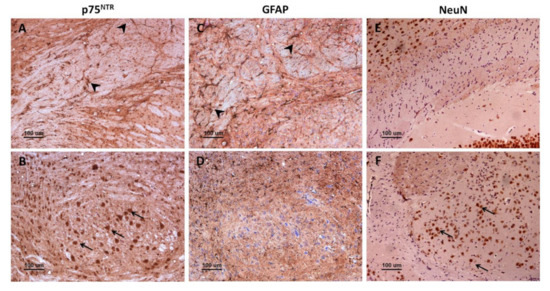
Figure 4.
Comparison between p75NTR, GFAP, and NeuN immunostaining patterns in mice. Immunohistochemistry against p75NTR (A,B), GFAP (C,D), or NeuN (E,F) in corpus callosum (A,C,E) and in medulla oblongata (B,D,F). Notice that p75NTR labels both glial cells (probably astrocytes) (A, arrowheads) and neurons (B, arrows), while GFAP targets astrocytes (C, arrowheads) but not other cell types (D). Importantly, GFAP-positive astrocytes (C, arrowheads) are more abundant than p75NTR-positive glial cells (A, arrowheads), suggesting that only a subpopulation of astrocytes express p75NTR.
Importantly, the number of astrocytes targeted for GFAP (Figure 4C) seemed to be higher than that of glial cells targeted for p75NTR (Figure 4A), suggesting that only a subpopulation of astrocytes expresses detectable levels of p75NTR in mouse brain. Similar to p75NTR-targeted glial cells, GFAP-targeted astrocytes were more abundant and hypertrophic in infected mice, especially in medulla oblongata of terminal animals.
In sheep, immunohistochemistry against GFAP disclosed GFAP-positive protoplasmic astrocytes in high numbers in the stratum lacunosum-moleculare and the polymorphic layer of the dentate gyrus (Figure 5). More fibrous astrocytes were observed in white matter tracts of the hilus. Infected sheep had an increased population of GFAP-positive astrocytes in these zones, in comparison with control sheep (Figure 5D–F).
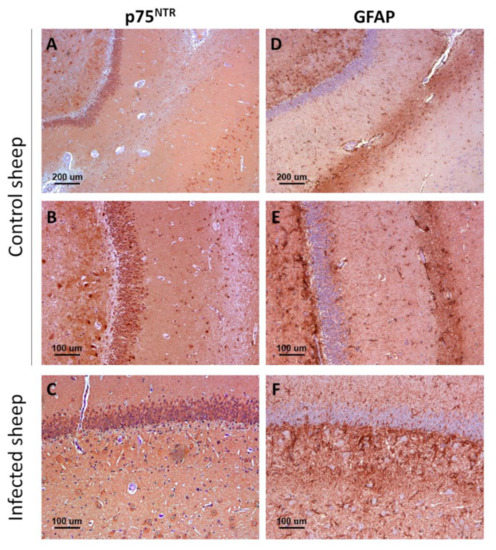
Figure 5.
Comparison between p75NTR (A–C) and GFAP immunostaining (D–F) patterns in control (A,B,D,E) and infected (C,F) sheep. Notice the higher abundance of GFAP-positive reactive astrocytes (astrogliosis) in infected mice, and the lack of correlation between p75NTR and GFAP distribution patterns, indicative of the fact that ovine astrocytes do not express significant levels of the receptor. Microphotographs taken from hippocampus.
2.6. Glial p75NTR Staining Pattern Correlates Positively with the Severity of Spongiosis, PrPSc Deposition, and Gliosis in Mice
The visual approach used to assess the relationship between p75NTR and astrocytes in mice was complemented with a semi-quantitative measurement of the severity of the gliosis in GFAP-immunolabeled sections. In addition, spongiform changes and PrPSc accumulation in the brain were evaluated on hematoxylin-eosin stained sections and with PET-blot, respectively.
Significant differences between groups were found in all areas except cerebellar cortex for spongiosis and cerebellar cortex and hippocampus for PrPSc deposits. Gliosis showed significant differences in medulla oblongata, mesencephalon, hypothalamus, striatum, and septal nuclei (Supplementary Table S1), roughly in agreement with what was observed with glial p75NTR labeling.
Correlation coefficients of these three parameters with glial p75NTR labeling were computed and significant results were found in each case (Figure 6), indicating that the accumulation of the causal agent (PrPSc) and its related neuropathological alterations (spongiosis and gliosis) are linked to the presence of p75NTR-positive glial cells. Considering all the aforementioned observations, these glial cells are probably astrocytes.
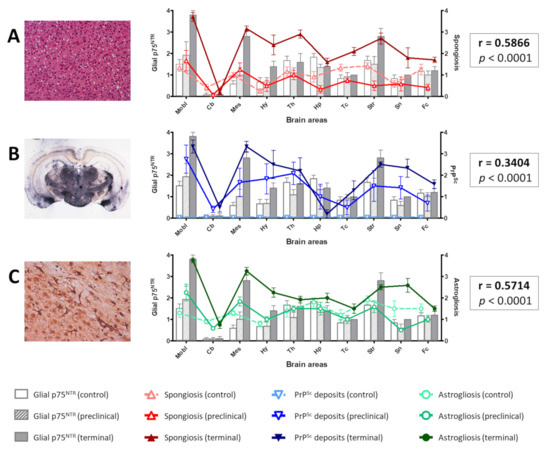
Figure 6.
Distribution of spongiform change (A), PrPSc deposits (B), and gliosis (C) in comparison with the distribution of glial p75NTR labeling in the brain of control, preclinical, and terminal mice. Notice the overlapping of the curves representing the three parameters and the bars representing glial p75NTR staining intensity. Positive Spearman’s correlation coefficients (r) were obtained in each case, which were highly significant (p < 0.0001). Mobl: medulla oblongata, Cb: cerebellar cortex, Mes: mesencephalon, Hy: hypothalamus, Th: thalamus, Hp: hippocampus, Tc: parietal and temporal cortices at the level of thalamus, Str: striatum, Sn: septal nuclei, Fc: frontal cortex. Error bars represent SEM.
2.7. Spongiosis and PrPSc Deposits Do Not Correlate with Global p75NTR Labeling in Mice or Sheep
In contrast with glial p75NTR labeling, no positive correlation was noted between global p75NTR labeling (assessed by image analysis) and spongiosis or PrPSc deposition in mice. Only a slight correlation was found between total p75NTR and gliosis, which was statistically significant (p = 0.0259). However, the low correlation coeficient (r = 0.2133) rendered this observation negligible.
On the other hand, spongiosis and PrPSc deposits assessed semi-quantitatively in sheep brains showed statistically significant variation between groups (Supplementary Table S2), but did not correlate with the global p75NTR immunostaining measured by image analysis (Supplementary Figure S5).
2.8. Confocal Microscopy Confirms the Relationship between Glial p75NTR Patterns and Astrocytes in Mice, but Not Sheep
Considering that medulla oblongata was the brain area with the most abundant p75NTR labeling and PrPSc deposits in both mice and sheep, we wondered whether there was a direct, topological relationship between these two parameters. To assess this, we used sheep brain samples and performed confocal microscopy combining the anti-PrP antibody L42 with the anti-p75NTR antibody.
Immunolabeling for p75NTR disclosed patterns that matched with those observed by immunohistochemistry in sheep, including: perineuronal labeling with neuropil staining (Figure 7A), glial labeling, probably corresponding to oligodendrocytes in the white matter (Figure 7B), and intraneuronal staining with evidence of the neurite branching (Figure 7C). In the samples targeted for p75NTR and PrP, a mild labeling of PrPSc deposits appeared in some areas, but co-localization with p75NTR, although found in some cases, was not the general rule (Figure 7D–F).
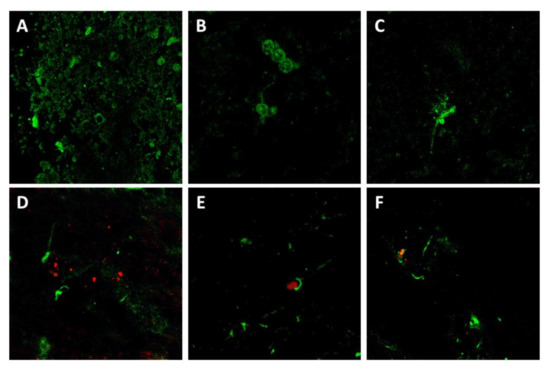
Figure 7.
Confocal microscopy for p75NTR (green) and PrP (red) in sheep brain samples. Notice that p75NTR distribution patterns agreed with those observed by IHC, including neuropil and perineuronal staining (A), glial staining (probably oligodendrocytes) (B), and neuronal intracytoplasmic staining with evidence of neuron processes (C). Co-localization of p75NTR with PrP, although observed in several cases (D–F), was not the general rule.
Given the apparent labeling of astrocytes by the anti-p75NTR antibody and its positive correlation with the distribution of the astrocyte-specific marker GFAP in mice, we aimed at further confirming the co-localization of these two markers. Therefore, we combined the anti-p75NTR and the anti-GFAP antibodies.
A very clear co-localization was observed in mouse samples (Figure 8A), which confirmed that the p75NTR-positive star-shaped cells in mouse brains were indeed astrocytes, as suggested by the observations on immunohistochemistry. In contrast, and also reinforcing previous immunohistochemical findings, no co-localization between GFAP and p75NTR was noted in sheep brain samples (Figure 8B), confirming the absence of p75NTR expression in ovine astrocytes, at least to levels detectable by either immunohistochemistry and confocal microscopy.
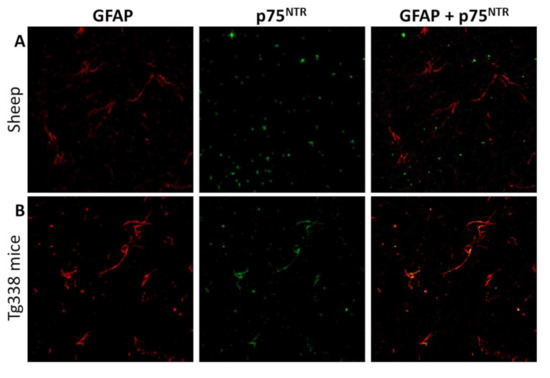
Figure 8.
Confocal microscopy for GFAP (red) and p75NTR (green) in sheep (A) and mouse (B) brain samples. Notice the lack of correlation between both markers in sheep tissues and the clear co-localization that in contrast is observed in mice, suggesting that mouse but not sheep astrocytes express detectable levels of p75NTR.
3. Discussion
Our results indicate that increased numbers of p75NTR-positive astrocytes are present in terminal stages of neurodegeneration in a murine model of scrapie. This finding correlates with other neuropathological features of prion disease, including spongiosis, PrPSc accumulation, and gliosis. In a comparison between control, preclinical, and terminal individuals, all areas with significant differences in glial p75NTR labeling showed also significant differences in these three prion disease biomarkers. These results are in agreement with previous studies that also described glial p75NTR immunostaining in a similar murine model of prion disease, as well as an increase of this labeling in infected individuals that roughly coincides with what we described [25]. These pieces of evidence point to a biologically relevant association between this receptor and prion disease pathogenesis.
Some studies have proposed an important role for p75NTR in the pathogenesis of prion diseases and other neurodegenerative disorders. Not only is this receptor able to mediate cell death after binding of its natural ligands (pre-processed and mature neurotrophins), as extensively reviewed [1], but also upon in vitro interaction with non-neurotrophic molecules, such as PrP106-126 [23,24] and APP (amyloid protein precursor) [27,28]. Such a direct link between the receptor and peptides involved in the pathogenesis of neurodegeneration prompts the suggestion that a similar mechanism be triggered in vivo by PrPSc deposits in the brain.
However, few studies address these questions using the mouse as the experimental model. Most investigations on neurotrophin actions are performed in rats [29,30,31], humans [32,33], and non-human primates [34,35].
In experimentally scrapie-infected mice, it is well known that prion-related lesions in the brain follow a topographical distribution tightly controlled by a combination of agent strain and factors intrinsic to the host. This has led to the development of strain discrimination methodologies based on the assessment of lesion profiles [36] or PrPSc accumulation patterns [37,38]. However, the mechanisms controlling or influencing this distribution are unclear. Given the role of p75NTR in triggering cell death, it is possible that differential expression of this receptor among brain areas or cell populations governs at least in part the distribution of prion-related lesions, as already proposed [25].
Our observations confirm that the glial cells targeted for p75NTR that were found increased in diseased mice were astrocytes. As exposed above, a previous work with both wild type and transgenic mice modeling prion disease found increased presence of p75NTR-positive astrocytes in terminally diseased animals [25]. Other studies, far from the field of prion diseases, described how astrocytes can both secrete several kinds of neurotrophins [39,40] and act as a target of these molecules through the expression of their receptors, including p75NTR [41,42]. Importantly, according to our results, only a subpopulation of astrocytes seems to express detectable levels of the receptor, as the number of p75NTR-positive glial cells was lower than that of GFAP-positive astrocytes.
Some physiological functions of p75NTR in astrocytic populations have been described, for instance, arresting of cell cycle and attenuation of astrocytes proliferation [43,44]. Other authors have demonstrated its involvement in pathological conditions, for example, in p75NTR-mediated astrocytosis in astrocyte-induced toxicity to motor neurons in amyotrophic lateral sclerosis (ALS) [45,46,47,48]. In addition, upregulation of the p75NTR receptor has been observed after some types of damage of nervous tissue in vivo [49]. Other glial cell types also upregulate p75NTR expression in several neuropathological conditions, including microglia and oligodendrocytes in multiple sclerosis [50], and Schwann cells and aldynoglia in peripheral nerve injury and during the regeneration process [41,42,51,52].
In general, further analyses are needed to understand the involvement of p75NTR in the neuroinflammatory response mediated by reactive astrocytes during prion disease pathogenesis. In any case, our results reinforce the crucial role of astrocytes in the neurodegeneration associated to prion diseases, in agreement with previous results [53].
On the other hand, experiments with the natural model of scrapie are also scarce given the intrinsic drawbacks of working with large animals like sheep. In our study, the natural ovine model of the disease did not show the glial p75NTR immunolabeling found in mice, which suggests the absence of p75NTR in sheep astrocytes. This is not rare, since other studies have failed in finding an association between p75NTR and astrocytes in distinct models of prion disease, such as hamsters [26].
Despite the absence of p75NTR astrocytic labeling in sheep, image analysis found an increase in the global p75NTR immunostaining in several brain areas and nuclei of preclinical sheep, in comparison with both control and clinical sheep. This observation suggests that an upregulation of this receptor occurs during initial stages of prion-related neurodegeneration.
Overexpression of p75NTR has also been found in other pathological conditions associated with cell death and neurodegeneration. For example, in Alzheimer’s disease (AD), re-expression of p75NTR was observed in human cortical neurons by immunohistochemistry [54]. The reasons for this increase are unclear. Some authors propose that the re-expression of p75NTR in brains of AD patients is mediated by the upregulation of its ligand, NGF [54], since ligand and receptor are linked by a “feed-forward” relationship [55]. However, in our pilot experiments, the levels of NGF were not noticeably increased in infected individuals. Moreover, levels of BDNF and NT-3, known to bind to p75NTR as well, were also found unaltered. A more in-depth assessment of the expression of these neurotrophic ligands should be done to accept or discard this hypothesis in our particular case.
In contrast with the preclinical group, animals in the clinical stage showed p75NTR levels similar to those of control animals. A likely explanation for this is the neuronal loss occurring at later stages of prion neurodegeneration. In agreement with this, several authors have described a similar loss of p75NTR neuronal expression in organotypic brain slice cultures from rat [56] and mouse [57] and in cultured canine dorsal root ganglia neurons [58], and attributed this observation to neuronal death.
Neurotrophins and their receptors, and particularly p75NTR, are known to play critical roles in the physiology of the nervous tissue and also to be involved in the pathogenesis of several neurodegenerative disorders, although the underpinnings of this process remain ill-defined. The results presented here aim at shedding light on this issue and provide some new insights into the particular case of prion diseases.
4. Materials and Methods
4.1. Sheep
Nine Rasa Aragonesa sheep were included in this study. All of them were homozygous for alanine at codon 136, for arginine at codon 154, and for glutamine at codon 171 (ARQ/ARQ). A single sheep from the control group bore heterozygosity leucine/phenylalanine at codon 141 (141L/F) and another sheep from the terminal group was heterozygous histidine/arginine at position 143 (143H/R). They belonged to three different groups: control, preclinical, and clinical. Clinical animals were diagnosed through assessment of clinical signs and sacrificed in the terminal stage of the disease; diagnosis was later confirmed by detection of PrPSc in their brains by immunohistochemical procedures. Preclinical animals were identified by immunohistochemical detection of PrPSc in samples of rectal mucosa-associated lymphoid tissue obtained by rectal biopsy, as previously described [59], and confirmed post-mortem. Control animals were sacrificed without clinical signs at ages similar to those of the other groups and were negative to PrPSc immunohistochemical detection. All three groups were culled at mean ages of 3 to 4 years old. After sacrifice by intravenous injection of sodium pentobarbital, complete necropsy and sampling was performed. Brains were sectioned and fixed in 10% formalin for at least 48 h before processing.
4.2. Mice
The Tg338 line used in this study carries the ovine prion protein gene (Prnp) and expresses ovine PrPC (VRQ) under the control of the ovine Prnp promoter at levels 8-fold that of sheep brain [60]. A total of 18 animals were included in the study. Six were inoculated with physiological saline (control group) and 12 with a second passage scrapie isolate (i.e., a pool of brain homogenates from Tg338 mice inoculated with a natural case of scrapie). Inoculation was performed by the intracerebral route using a precision syringe and under general anesthesia; after inoculation, they were provided adequate analgesia. Mice were caged together and monitored three times per week. From the scrapie-inoculated mice, 6 (the terminal group) were sacrificed at the end stage of disease with 264 ± 11 dpi (mean ± SEM), and the other 6 (the preclinical group) were culled before the onset of clinical signs at 126 ± 4 dpi. The control group was culled at 420 ± 5 dpi without signs. Sacrifice was done by cervical dislocation under heavy anesthesia. After sacrifice, brains were harvested and fixed in 10% formalin for at least 48 h.
4.3. Ethics
All experimental procedures in this study were approved by the Ethics Committee for Animal Testing of the University of Zaragoza (permit numbers PI02/08 and PI19/14, approved on 07/04/2014 and 01/02/2018 respectively) and performed in strict accordance with the recommendations for the care and use of experimental animals and in agreement with national law (RD 1201/05).
4.4. Tissue Processing
Mouse brains were trimmed in four sections for the assessment of prion lesions, as previously described (Fraser and Dickinson, 1968), while sheep samples were processed following an adapted protocol. Tissues were then embedded in paraffin wax and mounted in appropriate cassettes. Four micrometer-thick sections were obtained using a microtome and recovered on slides or nitrocellulose membranes for subsequent analysis.
4.5. Immunohistochemistry
Dewaxing and rehydration of the sections was achieved by sequential immersion in graded alcohols. For neurotrophins immunohistochemistry, a heat-induced antigen retrieval step was included by incubating the samples in citrate buffer at 96 ºC for 20 min, while for GFAP, this step was skipped. Endogenous peroxidase activity was blocked using a commercial blocking solution (Dako Agilent, Santa Clara, CA, USA), followed by overnight incubation with primary antibodies raised against NGF (rabbit monoclonal antibody, Sigma-Aldrich, Darmstadt, Germany), BDNF (rabbit monoclonal antibody, Abcam, Cambridge, UK), NT-3 (rabbit polyclonal antibody, Abcam, Cambridge, UK), TrkA (rabbit monoclonal antibody, Abcam, Cambridge, UK), TrkB (rabbit polyclonal antibody, Abcam, Cambridge, UK), TrkC (rabbit polyclonal antibody, Abcam, Cambridge, UK), and p75NTR (rabbit polyclonal antibody, Abcam, Cambridge, UK), or by one-hour incubation with a rabbit polyclonal anti-GFAP antibody (Dako Agilent, Santa Clara, CA, USA). The EnVision+ System (Agilent Dako, Santa Clara, CA, USA) was used as the secondary antibody in all cases, followed by development with the DAB+ System (Agilent Dako, Santa Clara, CA, USA). Counterstaining of the samples was performed with hematoxylin.
4.6. Hematoxylin-Eosin (H&E) Staining
Dewaxing and rehydration of preparations by sequential immersion in xylene and graded alcohols was followed by incubation in a hematoxylin solution. After rinsing with tap water, preparations were incubated in acid alcohol (1% acetic acid in a 70% ethanol solution) and then counterstained with an eosin solution. Finally, preparations were dehydrated and mounted prior to visualization under light microscope.
4.7. Paraffin-Embedded Tissue Blot
Mouse brain samples were subjected to PET-blot as described elsewhere [61]. Briefly, 4-µm paraffin-embedded brain sections were collected onto a nitrocellulose membrane and dried at 37 °C for 24 h. Membranes were then subjected to dewaxing and rehydration and incubated for 2 h in a solution of proteinase K (250 µg/mL) (Invitrogen, Carlsbad, CA, USA) at 56 °C to completely digest PrPC. Denaturation of the remaining PrPres was achieved by incubating the membranes in a solution of guanidine thiocyanate 3M. After blocking the membrane with 0.2% BSA to avoid cross-reactivity, detection was carried out through sequential incubation with the monoclonal anti-PrP antibody Sha31 (1:8000) (SPI-Bio, Sherbrooke, Canada) and a secondary alkaline phosphatase (AP)-conjugated antibody (Agilent Dako, Santa Clara, CA, USA), followed by development with NBT/BCIP (Thermo Scientific, Waltham, MA, USA). Membranes were then washed and dried for 24 h at room temperature.
4.8. Semi-Quantitative Assessments
Spongiosis and PrPSc deposition were evaluated in H&E-stained and PET-blotted or immunostained brain sections from both mice and sheep. Glial p75NTR and GFAP immunostaining were also measured in mouse brains. A semi-quantitative standardized methodology was used by attributing scores from 0 (total absence) to 4 (abundant presence) to each parameter in pre-determined brain areas. The average score for each area was computed as the arithmetic mean of the scores in each experimental group (control, preclinical, and terminal).
4.9. Image Analysis
Microphotographs of sheep and mouse brain areas and nuclei were taken using an Axioskop 40 microscope and an Axiocam MRc5 camera (Zeiss, Oberkochen, Germany) and the software AxioVision40 v4.6.3.0 (Zeiss, Oberkochen, Germany). Image analyses were performed as previously described [62]. At least three microphotographs of each area or nuclei were taken. The software ImageJ was used for image analysis. Briefly, microphotographs were subjected to color deconvolution using the algorithm for DAB-stained samples. The mean gray value of the processed images was measured and these values were employed to calculate the optical density (OD) of the pictures applying the formula OD = log (max intensity/mean intensity), where max intensity = 255 for 8-bit images. The average optical density for each area or nucleus was computed as the arithmetic mean of measured optical density values.
4.10. Statistics
Graphical representations and statistical analyses of data were done using the software GraphPad Prism 5. In all cases, Shapiro–Wilk and Kolmogórov–Smirnov tests were applied prior to further analyses, in order to assess the normality of the data, which led to the selection of non-parametric tests. The Kruskal–Wallis test was used to search for differences among control, preclinical, and clinical mice and sheep groups, and was followed by pairwise comparisons using Dunn’s post-hoc test. Finally, correlations between total p75NTR immunolabeling, glial p75NTR immunolabeling, spongiosis, PrPSc deposition, and astrogliosis were studied using Spearman’s correlation coefficients.
4.11. Confocal Microscopy
Dewaxing, rehydration, and heat-induced antigen retrieval were performed as for immunohistochemistry. To avoid background signal caused by paraffin green autofluorescence, sections were immerged in a solution of Sudan Black B (SBB) for 10 min and protected from light, followed by rinsing with 70% ethanol. Endogenous enzymatic activity was blocked with 10% fetal bovine serum for 60 min, and then, samples were incubated with a mixture of two primary antibodies raised in distinct species (rabbit polyclonal anti-p75NTR antibody (Abcam, Cambridge, UK) and either mouse monoclonal anti-GFAP antibody (Dako Agilent, Santa Clara, CA, USA) or monoclonal mouse anti-PrP antibody L42 (SPI-Bio, Sherbrooke, Canada)), at 4 °C overnight. Next, two fluorophore-conjugated secondary antibodies, emitting at different wavelengths (Alexa Fluor 488 and Alexa Fluor Plus 594, Thermo Scientific, Waltham, MA, USA) were employed to visualize the attachment of each of the primary antibodies. Slides were examined using a LSM 510 equipment (Zeiss, Oberkochen, Germany).
Supplementary Materials
Supplementary materials can be found at https://www.mdpi.com/1422-0067/22/5/2714/s1. Figure S1: Neurotrophins in the brain of infected and control mice and sheep; Figure S2: Neurotrophin receptors in the brain of infected and control mice and sheep; Figure S3: Image analysis of global p75NTR immunostaining in mice brains; Figure S4: Immunohistochemistry for p75NTR in brain of a healthy control sheep and a naturally scrapie-infected sheep at terminal stage; Figure S5: Distribution of spongiform change and PrPSc deposits in comparison with the distribution of global p75NTR labeling in the brain of control, preclinical and terminal sheep; Figure S6: Comparison of a p75NTR-immunolabelled slide versus a immunohistochemistry performed skipping incubation with the primary antibody, demonstrating the absence of background signal; Table S1: Statistical comparison between terminal, preclinical and control mice for the semi-quantitative parameters evaluated (glial p75NTR labeling, spongiosis, PrPSc deposits and gliosis); Table S2: Statistical comparison between terminal, preclinical and control sheep for the semi-quantitative parameters evaluated (spongiosis and PrPSc deposits and gliosis).
Author Contributions
Conceptualization, T.B., E.V., M.P. and R.B.; methodology, T.B., E.V., I.M.-B., M.P., R.B.; validation, T.B.; formal analysis, T.B.; investigation, T.B., E.V., M.B., A.O., M.M.; resources, E.V., M.P. and R.B.; data curation, T.B.; writing—original draft preparation, T.B.; writing—review and editing, T.B., E.V., A.O., M.B., R.B.; visualization, T.B.; supervision, R.B. and J.J.B.; project administration, E.M. and R.B.; funding acquisition, E.M. and R.B. All authors have read and agreed to the published version of the manuscript.
Funding
This research was funded by “Ministerio de Economía y Competitividad” (Spanish Government), grant number AGL2015-65560-R, by “Ministerio de Educación, Cultura y Deporte” (Spanish Government), grant number FPU14/04348, and by the Spain-France-Andorra Cooperation Program (POCTEFA), co-funded by the European Regional Development Fund (ERDF) (EFA 148/16 REDPRION).
Institutional Review Board Statement
Ethical review and approval were waived for this study, due to procedures involving animals. All procedures involving animals adhered to the guidelines included in the Spanish law “Real Decreto 1201/2005 de 10 de Octubre” on protection of animals used for experimentation and other scientific purposes, which is based on the European Directive86/609/EEC on Laboratory Animal Protection. The project was approved by the Ethical Committee on Animal Welfare (permit numbers PI02/08 and PI19/14 approved on 07/04/2014 and 01/02/2018 respectively) and performed under their supervision.
Informed Consent Statement
Not applicable.
Data Availability Statement
The data presented in this study are available within the article text, figures and supplementary materials.
Acknowledgments
We thank Olivier Andréoletti (UMR INRAE ENVT 1225- IHAP) and Vincent Béringue (UMR Virologie Immunologie Moléculaires (VIM-UR892), INRAE, Université Paris-Saclay) for kindly providing the Tg338 mice used for these experiments.
Conflicts of Interest
The authors declare no conflict of interest.
Abbreviations
| PrPC | Cellular prion protein |
| PrPSc | Pathogenic prion protein |
| PrPres | Proteinase K-resistant core of PrPSc |
| NGF | Neuronal growth factor |
| BDNF | Brain-derived neurotrophic factor |
| NT-3 | Neutrophin 3 |
| Trk | Tropomyosin-receptor kinase |
| p75NTR | p75 neurotrophin receptor |
| GFAP | Glial fibrillary acidic protein |
| NeuN | Neuronal nuclei |
References
- Bibel, M.; Barde, Y.A. Neurotrophins: Key regulators of cell fate and cell shape in the vertebrate nervous system. Genes Dev. 2000, 14, 2919–2937. [Google Scholar] [CrossRef]
- Meeker, R.B.; Williams, K.S. The p75 neurotrophin receptor: At the crossroad of neural repair and death. Neural Regen. Res. 2015, 10, 721–725. [Google Scholar] [CrossRef] [PubMed]
- Dawbarn, D.; Allen, S.J. Neurotrophins and neurodegeneration. Neuropathol. Appl. Neurobiol. 2003, 29, 211–230. [Google Scholar] [CrossRef]
- Shu, Y.-H.; Lu, X.-M.; Wei, J.-X.; Xiao, L.; Wang, Y.-T. Update on the role of p75NTR in neurological disorders: A novel therapeutic target. Biomed. Pharmacother. 2015, 76, 17–23. [Google Scholar] [CrossRef]
- Lu, B.; Pang, P.T.; Woo, N.H. The yin and yang of neurotrophin action. Nat. Rev. Neurosci. 2005, 6, 603–614. [Google Scholar] [CrossRef]
- Teng, K.K.; Felice, S.; Kim, T.; Hempstead, B.L. Understanding proneurotrophin actions: Recent advances and challenges. Dev. Neurobiol. 2010, 70, 350–359. [Google Scholar] [CrossRef]
- Segal, R.A. Selectivity Inneurotrophinsignaling: Theme and Variations. Annu. Rev. Neurosci. 2003, 26, 299–330. [Google Scholar] [CrossRef]
- Bibel, M.; Hoppe, E.; Barde, Y. Biochemical and functional interactions between the neurotrophin receptors trk and p75NTR. EMBO J. 1999, 18, 616–622. [Google Scholar] [CrossRef]
- Hempstead, B.L.; Martin-Zanca, D.; Kaplan, D.R.; Parada, L.F.; Chao, M.V. High-affinity NGF binding requires coexpression of the trk proto-oncogene and the low-affinity NGF receptor. Nat. Cell Biol. 1991, 350, 678–683. [Google Scholar] [CrossRef] [PubMed]
- Nykjaer, A.; Willnow, T.E. Sortilin: A receptor to regulate neuronal viability and function. Trends Neurosci. 2012, 35, 261–270. [Google Scholar] [CrossRef] [PubMed]
- Prusiner, S.B. Novel proteinaceous infectious particles cause scrapie. Science 1982, 216, 136–144. [Google Scholar] [CrossRef]
- Prusiner, S.B. Molecular biology of prion diseases. Science 1991, 252, 1515–1522. [Google Scholar] [CrossRef] [PubMed]
- Wood, J.L.N.; McGill, I.S.; Done, S.H.; Bradley, R. Neuropathology of scrapie: A study of the distribution patterns of brain lesions in 222 cases of natural scrapie in sheep, 1982–1991. Vet. Rec. 1997, 140, 167–174. [Google Scholar] [CrossRef] [PubMed]
- Ligios, C.; Jeffrey, M.; Ryder, S.; Bellworthy, S.; Simmons, M. Distinction of scrapie phenotypes in sheep by lesion profiling. J. Comp. Pathol. 2002, 127, 45–57. [Google Scholar] [CrossRef] [PubMed]
- Lazarini, F.; Boussin, F.; Deslys, J.; Tardy, M.; Dormont, D. Astrocyte gene expression in experimental mouse scrapie. J. Comp. Pathol. 1994, 111, 87–98. [Google Scholar] [CrossRef]
- Rezaie, P.; Lantos, P.L. Microglia and the pathogenesis of spongiform encephalopathies. Brain Res. Brain Res. Rev. 2001, 35, 55–72. [Google Scholar] [CrossRef]
- Budka, H.; Aguzzi, A.; Brown, P.; Brucher, J.-M.; Bugiani, O.; Gullotta, F.; Haltia, M.; Hauw, J.-J.; Ironside, J.W.; Jellinger, K.; et al. Neuropathological Diagnostic Criteria for Creutzfeldt-Jakob Disease (CJD) and Other Human Spongiform Encephalopathies (Prion Diseases). Brain Pathol. 1995, 5, 459–466. [Google Scholar] [CrossRef]
- Hill, A.F.; Desbruslais, M.; Joiner, S.; Sidle, K.C.L.; Gowland, I.; Collinge, J.; Doey, L.J.; Lantos, P. The same prion strain causes vCJD and BSE. Nat. Cell Biol. 1997, 389, 448–450. [Google Scholar] [CrossRef] [PubMed]
- Groschup, M.H.; Buschmann, A. Rodent models for prion diseases. Vet. Res. 2008, 39, 13. [Google Scholar] [CrossRef] [PubMed]
- Bruce, M.E.; Boyle, A.; Cousens, S.; McConnell, I.; Foster, J.; Goldmann, W.; Fraser, H. Strain characterization of natural sheep scrapie and comparison with BSE. J. Gen. Virol. 2002, 83, 695–704. [Google Scholar] [CrossRef]
- Bencsik, A.; Philippe, S.; Debeer, S.; Crozet, C.; Calavas, D.; Baron, T. Scrapie strain transmission studies in ovine PrP transgenic mice reveal dissimilar susceptibility. Histochem. Cell Biol. 2007, 127, 531–539. [Google Scholar] [CrossRef]
- Thackray, A.M.; Hopkins, L.; Lockey, R.; Spiropoulos, J.; Bujdoso, R. Emergence of multiple prion strains from single isolates of ovine scrapie. J. Gen. Virol. 2011, 92, 1482–1491. [Google Scholar] [CrossRef] [PubMed]
- Della-Bianca, V.; Rossi, F.; Armato, U.; Dal-Pra, I.; Costantini, C.; Perini, G.; Politi, V.; Della Valle, G. Neurotrophin p75 Receptor Is Involved in Neuronal Damage by Prion Peptide-(106–126). J. Biol. Chem. 2001, 276, 38929–38933. [Google Scholar] [CrossRef] [PubMed]
- Bai, Y.; Li, Q.; Yang, J.; Zhou, X.; Yin, X.; Zhao, D. p75NTR activation of NF-κB is involved in PrP106-126-induced apoptosis in mouse neuroblastoma cells. Neurosci. Res. 2008, 62, 9–14. [Google Scholar] [CrossRef]
- Marco-Salazar, P.; Márquez, M.; Fondevila, D.; Rabanal, R.M.; Torres, J.M.; Pumarola, M.; Vidal, E. Mapping of Neurotrophins and their Receptors in the Adult Mouse Brain and their Role in the Pathogenesis of a Transgenic Murine Model of Bovine Spongiform Encephalopathy. J. Comp. Pathol. 2014, 150, 449–462. [Google Scholar] [CrossRef]
- Wang, T.-T.; Tian, C.; Sun, J.; Wang, H.; Zhang, B.-Y.; Chen, C.; Wang, J.; Xiao, K.; Chen, L.-N.; Lv, Y.; et al. Down-regulation of brain-derived neurotrophic factor and its signaling components in the brain tissues of scrapie experimental animals. Int. J. Biochem. Cell Biol. 2016, 79, 318–326. [Google Scholar] [CrossRef] [PubMed]
- Yaar, M.; Zhai, S.; Pilch, P.F.; Doyle, S.M.; Eisenhauer, P.B.; Fine, R.E.; Gilchrest, B.A. Binding of beta-amyloid to the p75 neurotrophin receptor induces apoptosis. A possible mechanism for Alzheimer’s disease. J. Clin. Investig. 1997, 100, 2333–2340. [Google Scholar] [CrossRef] [PubMed]
- Perini, G.; Della-Bianca, V.; Politi, V.; Della Valle, G.; Dal-Pra, I.; Rossi, F.; Armato, U. Role of p75 Neurotrophin Receptor in the Neurotoxicity by β-amyloid Peptides and Synergistic Effect of Inflammatory Cytokines. J. Exp. Med. 2002, 195, 907–918. [Google Scholar] [CrossRef] [PubMed]
- Zhou, X.-F.; Rush, R.A. Localization of neurotrophin-3-like immunoreactivity in the rat central nervous system. Brain Res. 1994, 643, 162–172. [Google Scholar] [CrossRef]
- Yan, Q.; Rosenfeld, R.; Matheson, C.; Hawkins, N.; Lopez, O.; Bennett, L.; Welcher, A. Expression of brain-derived neurotrophic factor protein in the adult rat central nervous system. Neuroscience 1997, 78, 431–448. [Google Scholar] [CrossRef]
- Friedman, W.J.; Black, I.B.; Kaplan, D.R. Distribution of the neurotrophins brain-derived neurotrophic factor, neurotrophin-3, and neurotrophin-4/5 in the postnatal rat brain: An immunocytochemical study. Neuroscience 1998, 84, 101–114. [Google Scholar] [CrossRef]
- Connor, B.; Dragunow, M. The role of neuronal growth factors in neurodegenerative disorders of the human brain. Brain Res. Rev. 1998, 27, 1–39. [Google Scholar] [CrossRef]
- Tang, S.; Machaalani, R.; Waters, K.A. Immunolocalization of pro- and mature-brain derived neurotrophic factor (BDNF) and receptor TrkB in the human brainstem and hippocampus. Brain Res. 2010, 1354, 1–14. [Google Scholar] [CrossRef]
- Mufson, E.J.; Conner, J.M.; Varon, S.; Kordower, J.H. Nerve growth factor-like immunoreactive profiles in the primate basal forebrain and hippocampal formation. J. Comp. Neurol. 1994, 341, 507–519. [Google Scholar] [CrossRef]
- Zhang, H.-T.; Li, L.-Y.; Zou, X.-L.; Song, X.-B.; Hu, Y.-L.; Feng, Z.-T.; Wang, T.T.-H. Immunohistochemical Distribution of NGF, BDNF, NT-3, and NT-4 in Adult Rhesus Monkey Brains. J. Histochem. Cytochem. 2006, 55, 1–19. [Google Scholar] [CrossRef] [PubMed]
- Fraser, H.; Dickinson, A. The sequential development of the brain lesions of scrapie in three strains of mice. J. Comp. Pathol. 1968, 78, 301–311. [Google Scholar] [CrossRef]
- González, L.; Martin, S.; Begara-McGorum, I.; Hunter, N.; Houston, F.; Simmons, M.; Jeffrey, M. Effects of Agent Strain and Host Genotype on PrP Accumulation in the Brain of Sheep Naturally and Experimentally Affected with Scrapie. J. Comp. Pathol. 2002, 126, 17–29. [Google Scholar] [CrossRef] [PubMed]
- Thackray, A.M.; Hopkins, L.; Spiropoulos, J.; Bujdoso, R. Molecular and Transmission Characteristics of Primary-Passaged Ovine Scrapie Isolates in Conventional and Ovine PrP Transgenic Mice. J. Virol. 2008, 82, 11197–11207. [Google Scholar] [CrossRef]
- Furukawa, S.; Furukawa, Y.; Satoyoshi, E.; Hayashi, K. Synthesis and secretion of nerve growth factor by mouse astroglial cells in culture. Biochem. Biophys. Res. Commun. 1986, 136, 57–63. [Google Scholar] [CrossRef]
- Domeniconi, M.; Hempstead, B.L.; Chao, M.V. Pro-NGF secreted by astrocytes promotes motor neuron cell death. Mol. Cell. Neurosci. 2007, 34, 271–279. [Google Scholar] [CrossRef] [PubMed]
- Cragnolini, A.B.; Friedman, W.J. The function of p75NTR in glia. Trends Neurosci. 2008, 31, 99–104. [Google Scholar] [CrossRef] [PubMed]
- Becker, K.; Cana, A.; Baumgärtner, W.; Spitzbarth, I. p75 Neurotrophin Receptor: A Double-Edged Sword in Pathology and Regeneration of the Central Nervous System. Vet. Pathol. 2018, 55, 786–801. [Google Scholar] [CrossRef]
- Cragnolini, A.B.; Huang, Y.; Gokina, P.; Friedman, W.J. Nerve growth factor attenuates proliferation of astrocytes via the p75 neurotrophin receptor. Glia 2009, 57, 1386–1392. [Google Scholar] [CrossRef]
- Cragnolini, A.B.; Volosin, M.; Huang, Y.; Friedman, W.J. Nerve growth factor induces cell cycle arrest of astrocytes. Dev. Neurobiol. 2012, 72, 766–776. [Google Scholar] [CrossRef]
- Küst, B.M.; Brouwer, N.; Mantingh, I.J.; Boddeke, H.W.G.M.; Copray, J.C.V.M. Reduced p75NTR expression delays disease onset only in female mice of a transgenic model of familial amyotrophic lateral sclerosis. Amyotroph. Lateral Scler. 2003, 4, 100–105. [Google Scholar] [CrossRef]
- Pehar, M.; Cassina, P.; Vargas, M.R.; Castellanos, R.; Viera, L.; Beckman, J.S.; Estévez, A.G.; Barbeito, L. Astrocytic production of nerve growth factor in motor neuron apoptosis: Implications for amyotrophic lateral sclerosis. J. Neurochem. 2004, 89, 464–473. [Google Scholar] [CrossRef]
- Shepheard, S.R.; Chataway, T.; Schultz, D.W.; Rush, R.A.; Rogers, M.-L. The Extracellular Domain of Neurotrophin Receptor p75 as a Candidate Biomarker for Amyotrophic Lateral Sclerosis. PLoS ONE 2014, 9, e87398. [Google Scholar] [CrossRef]
- Smith, K.S.; Rush, R.A.; Rogers, M.-L. Characterization and changes in neurotrophin receptor p75-expressing motor neurons in SOD1G93AG1H mice. J. Comp. Neurol. 2015, 523, 1664–1682. [Google Scholar] [CrossRef] [PubMed]
- Oderfeld-Nowak, B.; Orzyłowska-Sliwińska, O.; Sołtys, Z.; Zaremba, M.; Januszewski, S.; Janeczko, K.; Mossakowski, M. Concomitant up-regulation of astroglial high and low affinity nerve growth factor receptors in the CA1 hippocampal area following global transient cerebral ischemia in rat. Neuroscience 2003, 120, 31–40. [Google Scholar] [CrossRef]
- Dowling, P.; Ming, X.; Raval, S.; Husar, W.; Casaccia-Bonnefil, P.; Chao, M.; Cook, S.; Blumberg, B. Up-regulated p75NTR neurotrophin receptor on glial cells in MS plaques. Neurology 1999, 53, 1676. [Google Scholar] [CrossRef]
- Taniuchi, M.; Clark, H.B.; Johnson, E.M. Induction of nerve growth factor receptor in Schwann cells after axotomy. Proc. Natl. Acad. Sci. USA 1986, 83, 4094–4098. [Google Scholar] [CrossRef]
- You, S.; Petrov, T.; Chung, P.H.; Gordon, T. The expression of the low affinity nerve growth factor receptor in long-term denervated Schwann cells. Glia 1997, 20, 87–100. [Google Scholar] [CrossRef]
- Otero, A.; Betancor, M.; Eraña, H.; Borges, N.F.; Lucas, J.; Badiola, J.; Castilla, J.; Bolea, R. Prion-Associated Neurodegeneration Causes Both Endoplasmic Reticulum Stress and Proteasome Impairment in a Murine Model of Spontaneous Disease. Int. J. Mol. Sci. 2021, 22, 465. [Google Scholar] [CrossRef] [PubMed]
- Mufson, E.J.; Kordower, J.H. Cortical neurons express nerve growth factor receptors in advanced age and Alzheimer disease. Proc. Natl. Acad. Sci. USA 1992, 89, 569–573. [Google Scholar] [CrossRef]
- Hefti, F.; Hartikka, J.; Knusel, B. Function of neurotrophic factors in the adult and aging brain and their possible use in the treatment of neurodegenerative diseases. Neurobiol. Aging 1989, 10, 515–533. [Google Scholar] [CrossRef]
- Weis, C.; Marksteiner, J.; Humpel, C. Nerve growth factor and glial cell line-derived neurotrophic factor restore the cholinergic neuronal phenotype in organotypic brain slices of the basal nucleus of Meynert. Neuroscience 2001, 102, 129–138. [Google Scholar] [CrossRef]
- Spitzbarth, I.; Cana, A.; Hahn, K.; Hansmann, F.; Baumgartner, W. Associated occurrence of p75 neurotrophin receptor expressing aldynoglia and microglia/macrophages in long term organotypic murine brain slice cultures. Brain Res. 2015, 1595, 29–42. [Google Scholar] [CrossRef]
- Gerhauser, I.; Hahn, K.; Baumgärtner, W.; Wewetzer, K. Culturing adult canine sensory neurons to optimise neural repair. Vet. Rec. 2012, 170, 102. [Google Scholar] [CrossRef]
- Monleón, E.; Garza, M.C.; Sarasa, R.; Álvarez-Rodríguez, J.; Bolea, R.; Monzón, M.; Vargas, M.A.; Badiola, J.J.; Acín, C. An assessment of the efficiency of PrPsc detection in rectal mucosa and third-eyelid biopsies from animals infected with scrapie. Vet. Microbiol. 2011, 147, 237–243. [Google Scholar] [CrossRef] [PubMed]
- Vilotte, J.-L.; Soulier, S.; Essalmani, R.; Stinnakre, M.-G.; Vaiman, D.; Lepourry, L.; Da Silva, J.C.; Besnard, N.; Dawson, M.; Buschmann, A.; et al. Markedly Increased Susceptibility to Natural Sheep Scrapie of Transgenic Mice Expressing Ovine PrP. J. Virol. 2001, 75, 5977–5984. [Google Scholar] [CrossRef] [PubMed]
- Schulz-Schaeffer, W.J.; Tschoke, S.; Kranefuss, N.; Drose, W.; Hause-Reitner, D.; Giese, A.; Groschup, M.H.; Kretzschmar, H.A. The paraffin-embedded tissue blot detects PrP(Sc) early in the incubation time in prion diseases. Am. J. Pathol. 2000, 156, 51–56. [Google Scholar] [CrossRef]
- Mustafa, H.N.; El Awdan, S.A.; Hegazy, G.A.; Jaleel, G.A.A. Prophylactic role of coenzyme Q10 and Cynara scolymus L on doxorubicin-induced toxicity in rats: Biochemical and immunohistochemical study. Indian J. Pharmacol. 2015, 47, 649–656. [Google Scholar] [CrossRef] [PubMed]
Publisher’s Note: MDPI stays neutral with regard to jurisdictional claims in published maps and institutional affiliations. |
© 2021 by the authors. Licensee MDPI, Basel, Switzerland. This article is an open access article distributed under the terms and conditions of the Creative Commons Attribution (CC BY) license (http://creativecommons.org/licenses/by/4.0/).