
Spectroscopic Signature of Red Blood Cells in a D-Galactose-Induced Accelerated Aging Model

 , , , ,
  , and
, and 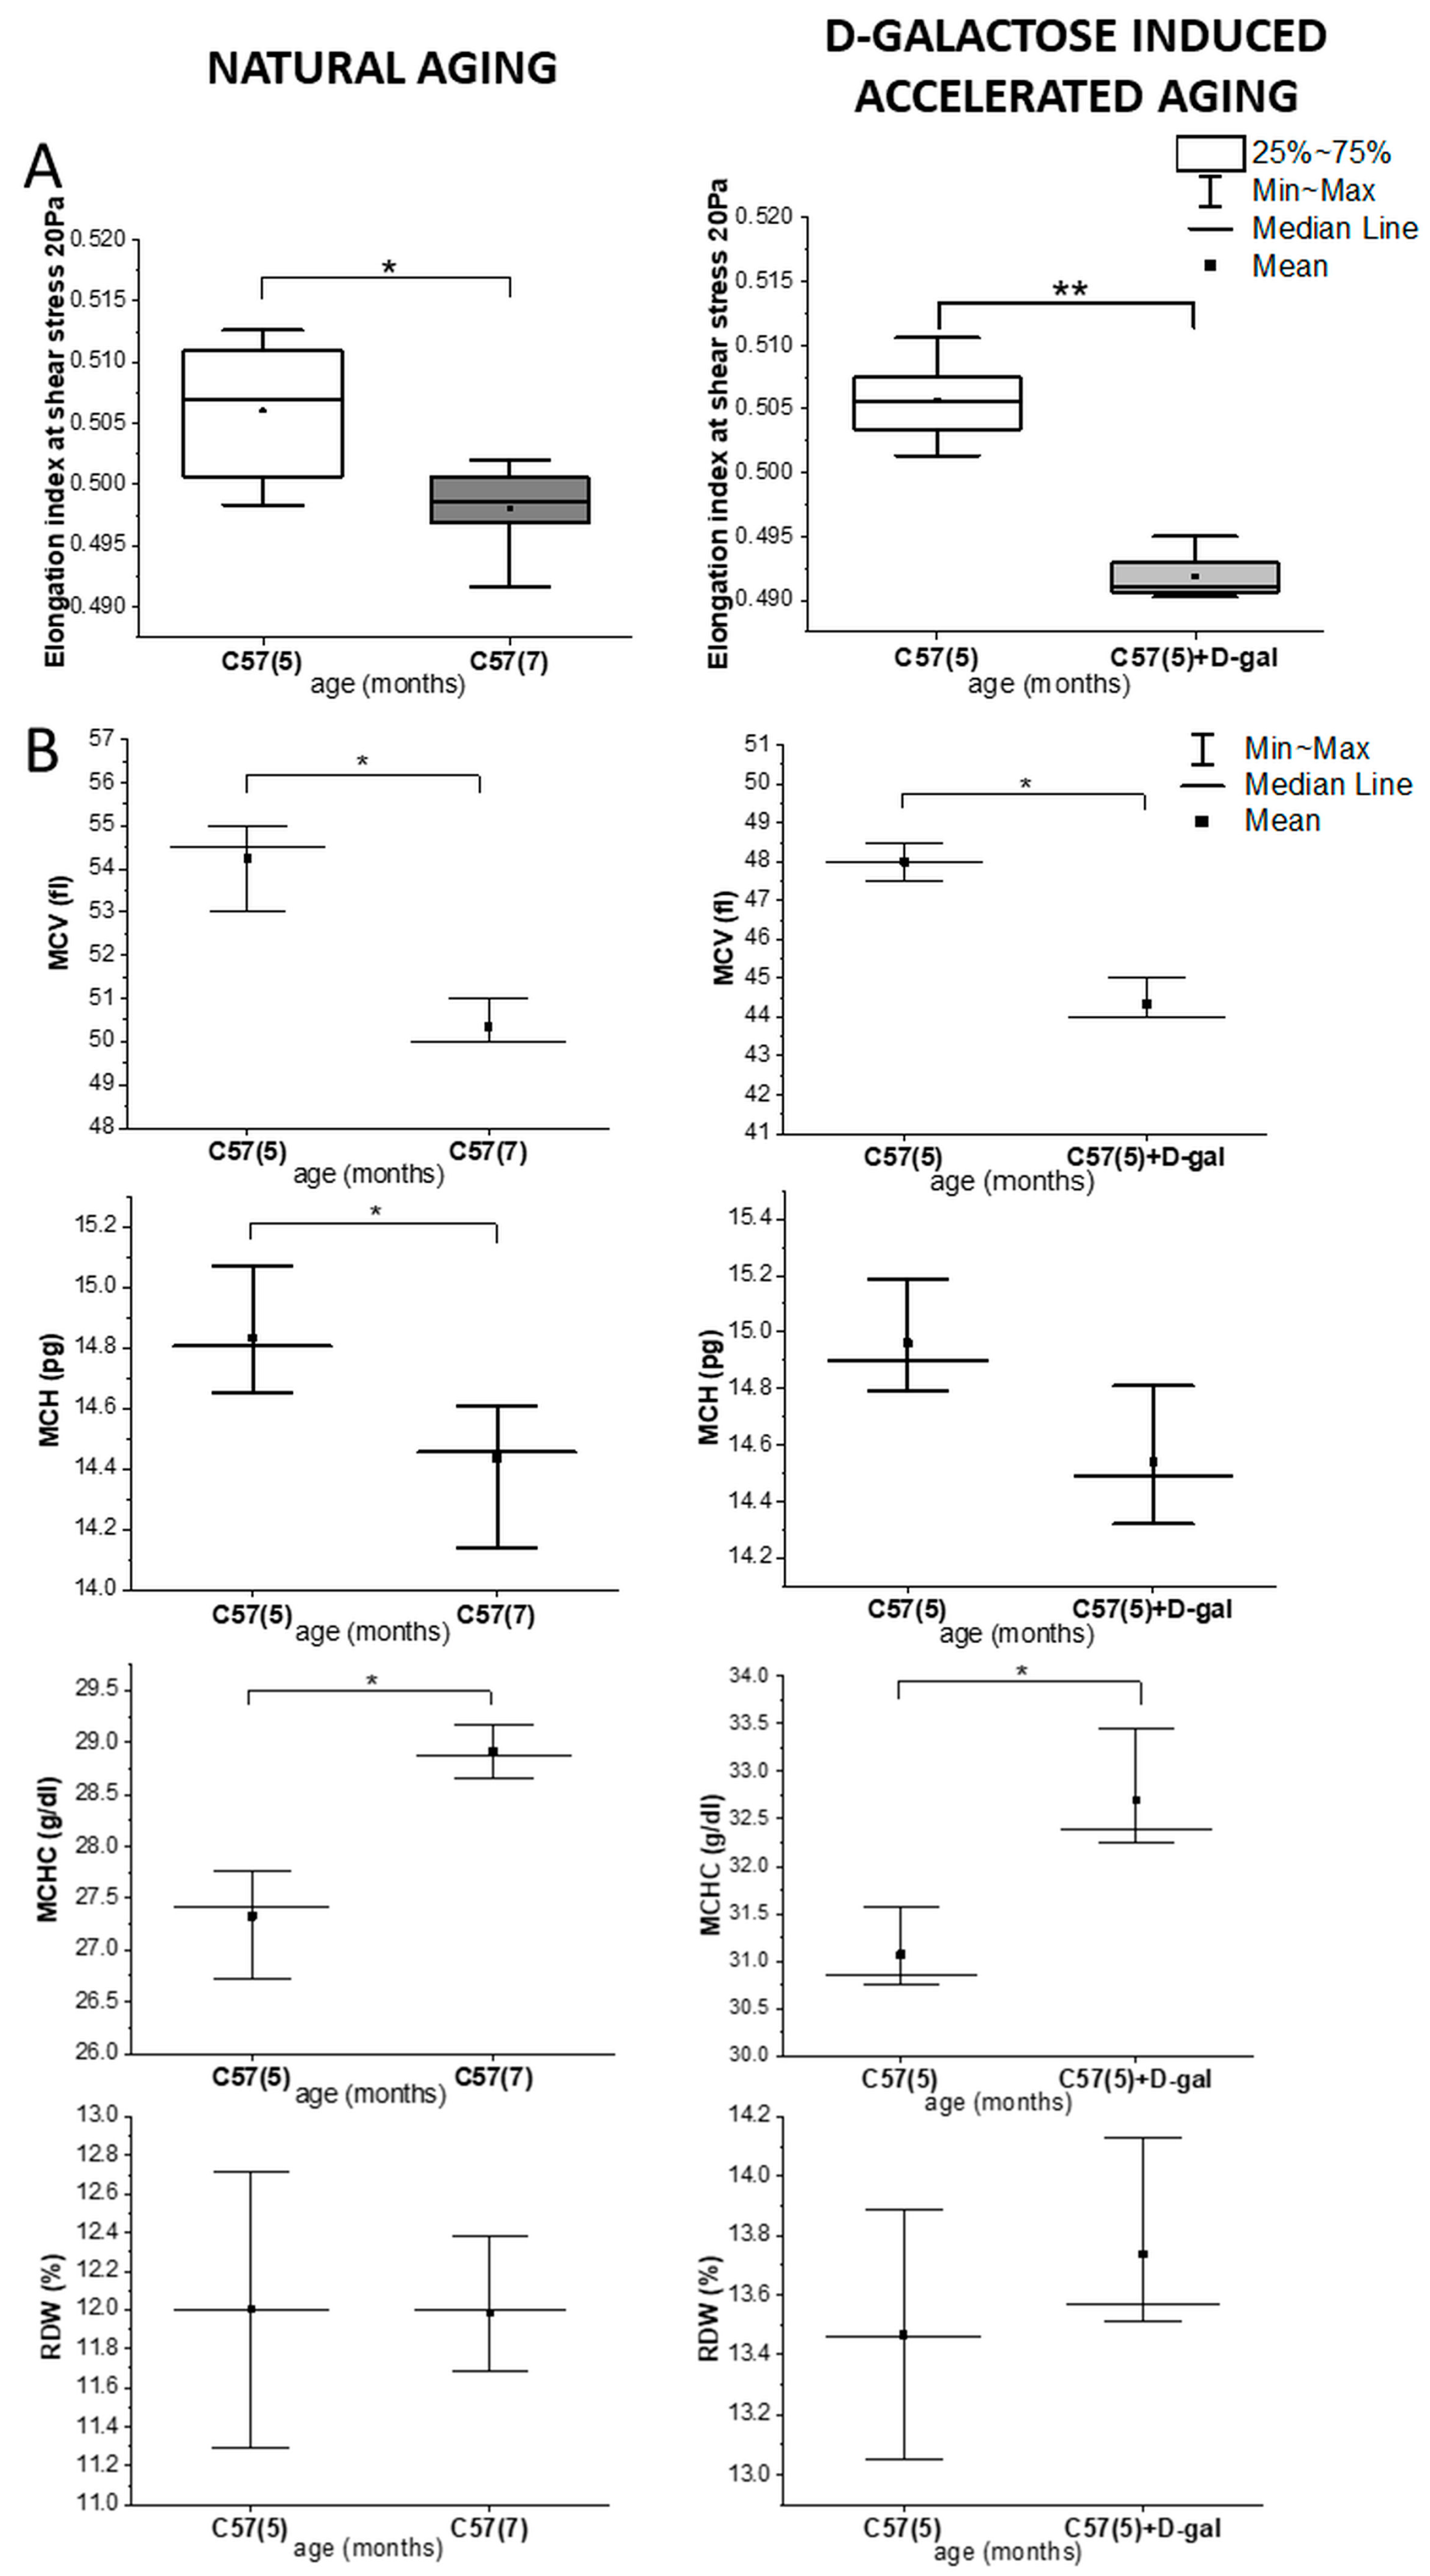
Abstract
1. Introduction
2. Results
2.1. Rheological and Morphological RBC Analysis
2.2. Biochemical Blood Plasma Analysis
2.3. Spectroscopic Analysis of the RBC Membranes
2.4. Spectroscopic Analysis of Intact RBCs—Insight into Cytosol Alteration
3. Discussion
4. Materials and Methods
4.1. Animal Models and Blood Collection
4.2. RBCs Isolation and Membrane Separation
4.3. Rheological, Morphological, and Biochemical Analysis
4.4. Fourier Transform Infrared Spectroscopy–Attenuated Total Reflectance (FTIR–ATR) Measurements with Data Processing
4.5. Raman Spectroscopy (RS) Measurements with Data Processing
5. Conclusions
Supplementary Materials
Author Contributions
Funding
Institutional Review Board Statement
Data Availability Statement
Conflicts of Interest
References
- Finkel, T.; Holbrook, N.J. Oxidants, oxidative stress and the biology of ageing. Nature 2000, 408, 239–247. [Google Scholar] [CrossRef] [PubMed]
- Flores, M.; Leonart, M.; Nascimento, A. Oxidative process in erythrocytes of individuals with hemoglobin S. Hematology 2008, 13, 187–192. [Google Scholar]
- Dybas, J.; Bulat, K.; Blat, A.; Mohaissen, T.; Wajda, A.; Mardyla, M.; Kaczmarska, M.; Franczyk-Zarow, M.; Malek, K.; Chlopicki, S.; et al. Age-related and atherosclerosis-related erythropathy in ApoE/LDLR-/- mice. Biochim. Biophys. Acta Mol. Basis Dis. 2020, 165972. [Google Scholar] [CrossRef] [PubMed]
- Smith, J.E. Erythrocyte Membrane: Structure, Function, and Pathophysiology. Vet. Pathol. 1987, 24, 471–476. [Google Scholar] [CrossRef] [PubMed]
- Cooper, R.A.; Arner, E.C.; Wiley, J.S.; Shattil, S.J. Modification of red cell membrane structure by cholesterol-rich lipid dispersions. A model for the primary spur cell defect. J. Clin. Invest. 1975, 55, 115–126. [Google Scholar] [CrossRef] [PubMed]
- Chien, S. Red Cell Deformability and its Relevance to Blood Flow. Annu. Rev. Physiol. 1987, 49, 177–192. [Google Scholar] [CrossRef] [PubMed]
- Turrini, F.; Giribaldi, G.; Carta, F.; Mannu, F.; Arese, P. Mechanisms of band 3 oxidation and clustering in the phagocytosis of Plasmodium falciparum-infected erythrocytes. Redox Rep. 2003, 8, 300–303. [Google Scholar] [CrossRef]
- Wu, F.; Satchwell, T.J.; Toye, A.M. Anion exchanger 1 in red blood cells and kidney: Band 3’s in a podThis paper is one of a selection of papers published in a Special Issue entitled CSBMCB 53rd Annual Meeting—Membrane Proteins in Health and Disease, and has undergone the Journal’s usual. Biochem. Cell Biol. 2011, 89, 106–114. [Google Scholar] [CrossRef]
- Szczesny-Malysiak, E.; Dybas, J.; Blat, A.; Bulat, K.; Kus, K.; Kaczmarska, M.; Wajda, A.; Malek, K.; Chlopicki, S.; Marzec, K.M. Irreversible alterations in the hemoglobin structure affect oxygen binding in human packed red blood cells. Biochim. Biophys. Acta Mol. Cell Res. 2020, 1867, 118803. [Google Scholar] [CrossRef]
- Buttari, B.; Profumo, E.; Riganò, R. Crosstalk between red blood cells and the immune system and its impact on atherosclerosis. Biomed Res. Int. 2015, 2015, 616834. [Google Scholar] [CrossRef]
- Pompeo, G.; Girasole, M.; Cricenti, A.; Boumis, G.; Bellelli, A.; Amiconi, S. Erythrocyte death in vitro induced by starvation in the absence of Ca2+. Biochim. Biophys. Acta Biomembr. 2010, 1798, 1047–1055. [Google Scholar] [CrossRef]
- Willekens, F.L.; Were, J.M.; Groenen-Döpp, Y.A.; Roerdinkholder-Stoelwinder, B.; de Pauw, B.; Bosman, G.J. Erythrocyte vesiculation: A self-protective mechanism? Br. J. Haematol. 2008, 141, 549–556. [Google Scholar] [CrossRef]
- Harrison, D.; Griendling, K.; Landmesser, U.; Hornig, B.; Drexler, H. Role of oxidative stress in atherosclerosis. Am. J. Cardiol. 2003, 91, 7A–11A. [Google Scholar] [CrossRef]
- Ajmani, R.S.; Metter, E.J.; Jaykumar, R.; Ingram, D.K.; Spangler, E.L.; Abugo, O.O.; Rifkind, J.M. Hemodynamic changes during aging associated with cerebral blood flow and impaired cognitive function. Neurobiol. Aging 2000, 21, 257–269. [Google Scholar] [CrossRef]
- Cebe, T.; Atukeren, P.; Yanar, K.; Kuruç, A.I.; Ozan, T.; Kunbaz, A.; Sitar, M.E.; Mirmaroufizibandeh, R.; Aydın, S.; Çakatay, U. Oxidation scrutiny in persuaded aging and chronological aging at systemic redox homeostasis level. Exp. Gerontol. 2014, 57, 132–140. [Google Scholar] [CrossRef] [PubMed]
- Yanar, K.; Aydın, S.; Çakatay, U.; Mengi, M.; Buyukpınarbaşılı, N.; Atukeren, P.; Sitar, M.E.; Sönmez, A.; Uslu, E. Protein and DNA Oxidation in Different Anatomic Regions of Rat Brain in a Mimetic Ageing Model. Basic Clin. Pharmacol. Toxicol. 2011, 109, 423–433. [Google Scholar] [CrossRef]
- Ullah, F.; Ali, T.; Ullah, N.; Kim, M.O. Caffeine prevents d-galactose-induced cognitive deficits, oxidative stress, neuroinflammation and neurodegeneration in the adult rat brain. Neurochem. Int. 2015, 90, 114–124. [Google Scholar] [CrossRef] [PubMed]
- Morava, E. Galactose supplementation in phosphoglucomutase-1 deficiency; review and outlook for a novel treatable CDG. Mol. Genet. Metab. 2014, 112, 275–279. [Google Scholar] [CrossRef] [PubMed]
- Wu, D.-M.; Lu, J.; Zheng, Y.-L.; Zhou, Z.; Shan, Q.; Ma, D.-F. Purple sweet potato color repairs d-galactose-induced spatial learning and memory impairment by regulating the expression of synaptic proteins. Neurobiol. Learn. Mem. 2008, 90, 19–27. [Google Scholar] [CrossRef]
- Ho, S.C.; Liu, J.H.; Wu, R.Y. Establishment of the mimetic aging effect in mice caused by D-galactose. Biogerontology 2003, 4, 15–18. [Google Scholar] [CrossRef] [PubMed]
- Shang, Y.; Gong, M.; Zhou, X.; Li, S.; Wang, B. Improving effects of SSF on memory deficits and pathological changes of neural and immunological systems in senescent mice. Acta Pharmacol. Sin. 2002, 22, 1078–1083. [Google Scholar]
- Sun, Y.; Wang, D.-J.; Zhu, J.; Zhang, H.-Q. Effects of cistanche desertica polysacchrides on the constitution of protein and anti-oxidative capacity of lune in aging mice. Chin. Pharmacol. Bull. 2001, 17, 101–103. [Google Scholar]
- Xu, X. Effects of puerarin on fatty superoxide in aged mice induced by D-galactose. Zhongguo Zhong Yao Za Zhi 2003, 28, 66–69. [Google Scholar] [PubMed]
- Shen, Y.-X.; Xu, S.-Y.; Wei, W.; Sun, X.-X.; Yang, J.; Liu, L.-H.; Dong, C. Melatonin reduces memory changes and neural oxidative damage in mice treated with D-galactose. J. Pineal Res. 2002, 32, 173–178. [Google Scholar] [CrossRef] [PubMed]
- Song, X.; Bao, M.; Li, D.; Li, Y.M. Advanced glycation in d-galactose induced mouse aging model. Mech. Ageing Dev. 1999, 108, 239–251. [Google Scholar] [CrossRef]
- Cui, X.; Wang, L.; Zuo, P.; Han, Z.; Fang, Z.; Li, W.; Liu, J. D-Galactose-caused life shortening in Drosophila melanogaster and Musca domestica is associated with oxidative stress. Biogerontology 2004, 5, 317–325. [Google Scholar] [CrossRef]
- Bo-Htay, C.; Palee, S.; Apaijai, N.; Chattipakorn, S.C.; Chattipakorn, N. Effects of d-galactose-induced ageing on the heart and its potential interventions. J. Cell. Mol. Med. 2018, 22, 1392–1410. [Google Scholar] [CrossRef]
- Wenbin, L.; Fen, W.; Ming, F.; Jingli, Z.; Binglie, Z.; Xingchen, M.; Weiping, Y.; Wen, W. Mimetic brain aging effect induced by D-galactose in mice. Chin. J. Pharmacol. Toxicol. 1995, 9, 93–95. [Google Scholar]
- Cuervo, A.; Cuervo, A.M. Autophagy: In sickness and in health. Trends Cell Biol. 2004, 14, 70–77. [Google Scholar] [CrossRef]
- Terman, A.; Gustafsson, B.; Brunk, U.T. Autophagy, organelles and ageing. J. Pathol. 2007, 211, 134–143. [Google Scholar] [CrossRef]
- Cui, X.; Zuo, P.; Zhang, Q.; Li, X.; Hu, Y.; Long, J.; Packer, L.; Liu, J. Chronic systemic D-galactose exposure induces memory loss, neurodegeneration, and oxidative damage in mice: Protective effects of R-α-lipoic acid. J. Neurosci. Res. 2006, 84, 647–654. [Google Scholar] [CrossRef]
- Ding-Dong, L.; Yu-Kun, C.; Mao-Zhi, G.; Richardson, A.; Tak Cheung, H. The age-related decline in interleukin-3 expression in mice. Life Sci. 1988, 43, 1215–1222. [Google Scholar] [CrossRef]
- Cai, N.-S.; Li, D.-D.; Cheung, H.T.; Richardson, A. The expression of granulocyte/macrophage colony-stimulating factor in activated mouse lymphocytes declines with age. Cell. Immunol. 1990, 130, 311–319. [Google Scholar] [CrossRef]
- Miller, R.A. The aging immune system: Primer and prospectus. Science 1996, 273, 70–74. [Google Scholar] [CrossRef] [PubMed]
- Gao, J.; Yu, Z.; Jing, S.; Jiang, W.; Liu, C.; Yu, C.; Sun, J.; Wang, C.; Chen, J.; Li, H. Protective effect of Anwulignan against D-galactose-induced hepatic injury through activating p38 MAPK-Nrf2-HO-1 pathway in mice. Clin. Interv. Aging 2018, 13, 1859–1869. [Google Scholar] [CrossRef] [PubMed]
- Vlassara, H.; Bucala, R.; Striker, L. Pathogenic effects of advanced glycosylation: Biochemical, biologic, and clinical implications for diabetes and aging. Lab. Invest. 1994, 70, 138–151. [Google Scholar] [PubMed]
- Vlassara, H.; Striker, L.J.; Teichberg, S.; Fuh, H.; Li, Y.M.; Steffes, M. Advanced glycation end products induce glomerular sclerosis and albuminuria in normal rats. Proc. Natl. Acad. Sci. USA 1994, 91, 11704–11708. [Google Scholar] [CrossRef] [PubMed]
- Li, Y.M.; Dickson, D.; Vlassara, H. Enhanced binding of advanced glycation endproducts (age) by apo e4 isotype linkt mechanisms of plaque deposition in Alzheimer’s disease. Neurosci. Lett. 1996, 10, A677. [Google Scholar]
- Haider, S. A high dose of short term exogenous d-galactose administration in young male rats produces symptoms simulating the natural aging process. Life Sci. 2015, 124, 110–119. [Google Scholar] [CrossRef]
- Patel, K.V.; Mohanty, J.G.; Kanapuru, B.; Hesdorffer, C.; Ershler, W.B.; Rifkind, J.M. Association of the red cell distribution width with red blood cell deformability. Adv. Exp. Med. Biol. 2013, 765, 211–216. [Google Scholar]
- Russell, E.S.; Neufeld, E.F.; Higgins, C.T. Comparison of Normal Blood Picture of Young Adults from 18 Inbred Strains of Mice. Proc. Soc. Exp. Biol. Med. 1951, 78, 761–766. [Google Scholar] [CrossRef] [PubMed]
- Wirth-Dzieciolowska, E.; Karaszewska, J.; Kazimiera, P.; Smolińska, M.; Gajewska, M. Selected peripheral blood cell parameters in twelve inbred strains of laboratory mice. Anim. Sci. Pap. Rep. 2009, 27, 69–77. [Google Scholar]
- Ewing, K.L.; Tauber, O.E. Hematological Changes in Aging Male C57BL/6 Jax Mice1. J. Gerontol. 1964, 19, 165–167. [Google Scholar] [CrossRef] [PubMed]
- Blat, A.; Dybas, J.; Kaczmarska, M.; Chrabaszcz, K.; Bulat, K.; Kostogrys, R.B.; Cernescu, A.; Malek, K.; Marzec, K.M. An Analysis of Isolated and Intact RBC Membranes—A Comparison of a Semiquantitative Approach by Means of FTIR, Nano-FTIR, and Raman Spectroscopies. Anal. Chem. 2019, 91, 9867–9874. [Google Scholar] [CrossRef] [PubMed]
- Blat, A.; Wiercigroch, E.; Smeda, M.; Wislocka, A.; Chlopicki, S.; Malek, K. Fourier transform infrared spectroscopic signature of blood plasma in the progression of breast cancer with simultaneous metastasis to lungs. J. Biophotonics 2019, 12, 1–11. [Google Scholar] [CrossRef]
- Staniszewska-Slezak, E.; Fedorowicz, A.; Kramkowski, K.; Leszczynska, A.; Chlopicki, S.; Baranska, M.; Malek, K. Plasma biomarkers of pulmonary hypertension identified by Fourier transform infrared spectroscopy and principal component analysis. Analyst 2015, 140, 2273–2279. [Google Scholar] [CrossRef] [PubMed]
- PWrobel, T.; Mateuszuk, L.; Chlopicki, S.; Malek, K.; Baranska, M. Imaging of lipids in atherosclerotic lesion in aorta from ApoE/LDLR−/− mice by FT-IR spectroscopy and Hierarchical Cluster Analysis. Analyst 2011, 136, 5247. [Google Scholar] [CrossRef] [PubMed]
- Schultz, Z.D. Raman Spectroscopic Imaging of Cholesterol and Docosahexaenoic Acid Distribution in the Retinal Rod Outer Segment. Aust. J. Chem. 2011, 64, 611–616. [Google Scholar] [CrossRef]
- Marzec, K.M.; Dybas, J.; Chlopicki, S.; Baranska, M. Resonance Raman in Vitro Detection and Differentiation of the Nitrite-Induced Hemoglobin Adducts in Functional Human Red Blood Cells. J. Phys. Chem. B 2016, 120, 12249–12260. [Google Scholar] [CrossRef]
- Catan, A.; Turpin, C.; Diotel, N.; Patche, J.; Guerin-Dubourg, A.; Debussche, X.; Bourdon, E.; Ah-You, N.; Le Moullec, N.; Besnard, M.; et al. Aging and glycation promote erythrocyte phagocytosis by human endothelial cells: Potential impact in atherothrombosis under diabetic conditions. Atherosclerosis 2019, 291, 87–98. [Google Scholar] [CrossRef]
- Iannuzzi, C.; Irace, G.; Sirangelo, I. Differential effects of glycation on protein aggregation and amyloid formation. Front. Mol. Biosci. 2014, 1, 1–8. [Google Scholar] [CrossRef]
- Gkogkolou, P.; Böhm, M. Advanced glycation end products: Key players in skin aging? Dermatoendocrinology 2012, 4, 259–270. [Google Scholar] [CrossRef]
- Petibois, C.; Déléris, G. Evidence that erythrocytes are highly susceptible to exercise oxidative stress: FT-IR spectrometric studies at the molecular level. Cell Biol. Int. 2005, 29, 709–716. [Google Scholar] [CrossRef]
- Bhagavan, N.V.; Ha, C.-E. Chapter 14—Carbohydrate Metabolism II: Gluconeogenesis, Glycogen Synthesis and Breakdown, and Alternative Pathways. In Essentials of Medical Biochemistry, 2nd ed.; Bhagavan, N.V., Ha, C.-E., Eds.; Academic Press: Cambridge, MA, USA, 2015; Volume 14, pp. 205–225. [Google Scholar] [CrossRef]
- Holden, H.M.; Rayment, I.; Thoden, J.B. Structure and Function of Enzymes of the Leloir Pathway for Galactose Metabolism*. J. Biol. Chem. 2003, 278, 43885–43888. [Google Scholar] [CrossRef]
- Golberg, L.; Holzel, A.; Komrower, G.M.; Schwarz, V. A clinical and biochemical study of galactosaemia; a possible explanation of the nature of the biochemical lesion. Arch. Dis. Child. 1956, 31, 254–264. [Google Scholar] [PubMed]
- Umbayev, B.; Askarova, S.; Almabayeva, A.; Saliev, T.; Masoud, A.-R.; Bulanin, D. Galactose-Induced Skin Aging: The Role of Oxidative Stress. Oxid. Med. Cell. Longev. 2020, 2020, 7145656. [Google Scholar] [CrossRef] [PubMed]
- Kogut, M.D.; Roe, T.F.; Ng, W.; Nonnel, G.N. Fructose-induced Hyperuricemia: Observations in Normal Children and in Patients with Hereditary Fructose Intolerance and Galactosemia. Pediatric Res. 1975, 9(10), 774–778. [Google Scholar] [CrossRef]
- Levin, B.; Oberholzer, V.G.; Snodgrass, G.J.; Stimmler, L.; Wilmers, M.J. Fructosaemia: An inborn error of fructose metabolism. Arch. Dis. Child. 1963, 38, 220–230. [Google Scholar] [CrossRef] [PubMed]
- Schwarz, V.; Golberg, L.; Komrower, G.M.; Holzel, A. Some disturbances of erythrocyte metabolism in galactosaemia. Biochem. J. 1956, 62, 34–40. [Google Scholar] [CrossRef] [PubMed]
- Machado, C.; De-Souza, E.A.; De-Queiroz, A.L.F.; Pimentel, F.S.; Silva, G.F.; Gomes, F.M.; Montero-Lomelí, M.; Masuda, C.A. The galactose-induced decrease in phosphate levels leads to toxicity in yeast models of galactosemia. Biochim. Biophys. Acta Mol. Basis Dis. 2017, 1863, 1403–1409. [Google Scholar] [CrossRef]
- OriginPro, Version2021, Software for Data Presentation; OriginLab Corporation: Northampton, MA, USA, 2021.
- OPUS software, Version 7.2.139.1294, Software for Spectroscopic Analysis; Bruker Optics: Alpharetta, GA, USA, 2007.
- WITec Project Plus software, Version 2.10, Software for Raman spectroscopi analysis; Witec GmbH: Ulm, Germany, 2014.


Publisher’s Note: MDPI stays neutral with regard to jurisdictional claims in published maps and institutional affiliations. |
© 2021 by the authors. Licensee MDPI, Basel, Switzerland. This article is an open access article distributed under the terms and conditions of the Creative Commons Attribution (CC BY) license (http://creativecommons.org/licenses/by/4.0/).
Share and Cite
Blat, A.; Stepanenko, T.; Bulat, K.; Wajda, A.; Dybas, J.; Mohaissen, T.; Alcicek, F.C.; Szczesny-Malysiak, E.; Malek, K.; Fedorowicz, A.; et al. Spectroscopic Signature of Red Blood Cells in a D-Galactose-Induced Accelerated Aging Model. Int. J. Mol. Sci. 2021, 22, 2660. https://doi.org/10.3390/ijms22052660
Blat A, Stepanenko T, Bulat K, Wajda A, Dybas J, Mohaissen T, Alcicek FC, Szczesny-Malysiak E, Malek K, Fedorowicz A, et al. Spectroscopic Signature of Red Blood Cells in a D-Galactose-Induced Accelerated Aging Model. International Journal of Molecular Sciences. 2021; 22(5):2660. https://doi.org/10.3390/ijms22052660
Chicago/Turabian StyleBlat, Aneta, Tetiana Stepanenko, Katarzyna Bulat, Aleksandra Wajda, Jakub Dybas, Tasnim Mohaissen, Fatih Celal Alcicek, Ewa Szczesny-Malysiak, Kamilla Malek, Andrzej Fedorowicz, and et al. 2021. "Spectroscopic Signature of Red Blood Cells in a D-Galactose-Induced Accelerated Aging Model" International Journal of Molecular Sciences 22, no. 5: 2660. https://doi.org/10.3390/ijms22052660
APA StyleBlat, A., Stepanenko, T., Bulat, K., Wajda, A., Dybas, J., Mohaissen, T., Alcicek, F. C., Szczesny-Malysiak, E., Malek, K., Fedorowicz, A., & Marzec, K. M. (2021). Spectroscopic Signature of Red Blood Cells in a D-Galactose-Induced Accelerated Aging Model. International Journal of Molecular Sciences, 22(5), 2660. https://doi.org/10.3390/ijms22052660