
A Simple Method for In-Depth Proteome Analysis of Mammalian Cell Culture Conditioned Media Containing Fetal Bovine Serum

 , , and
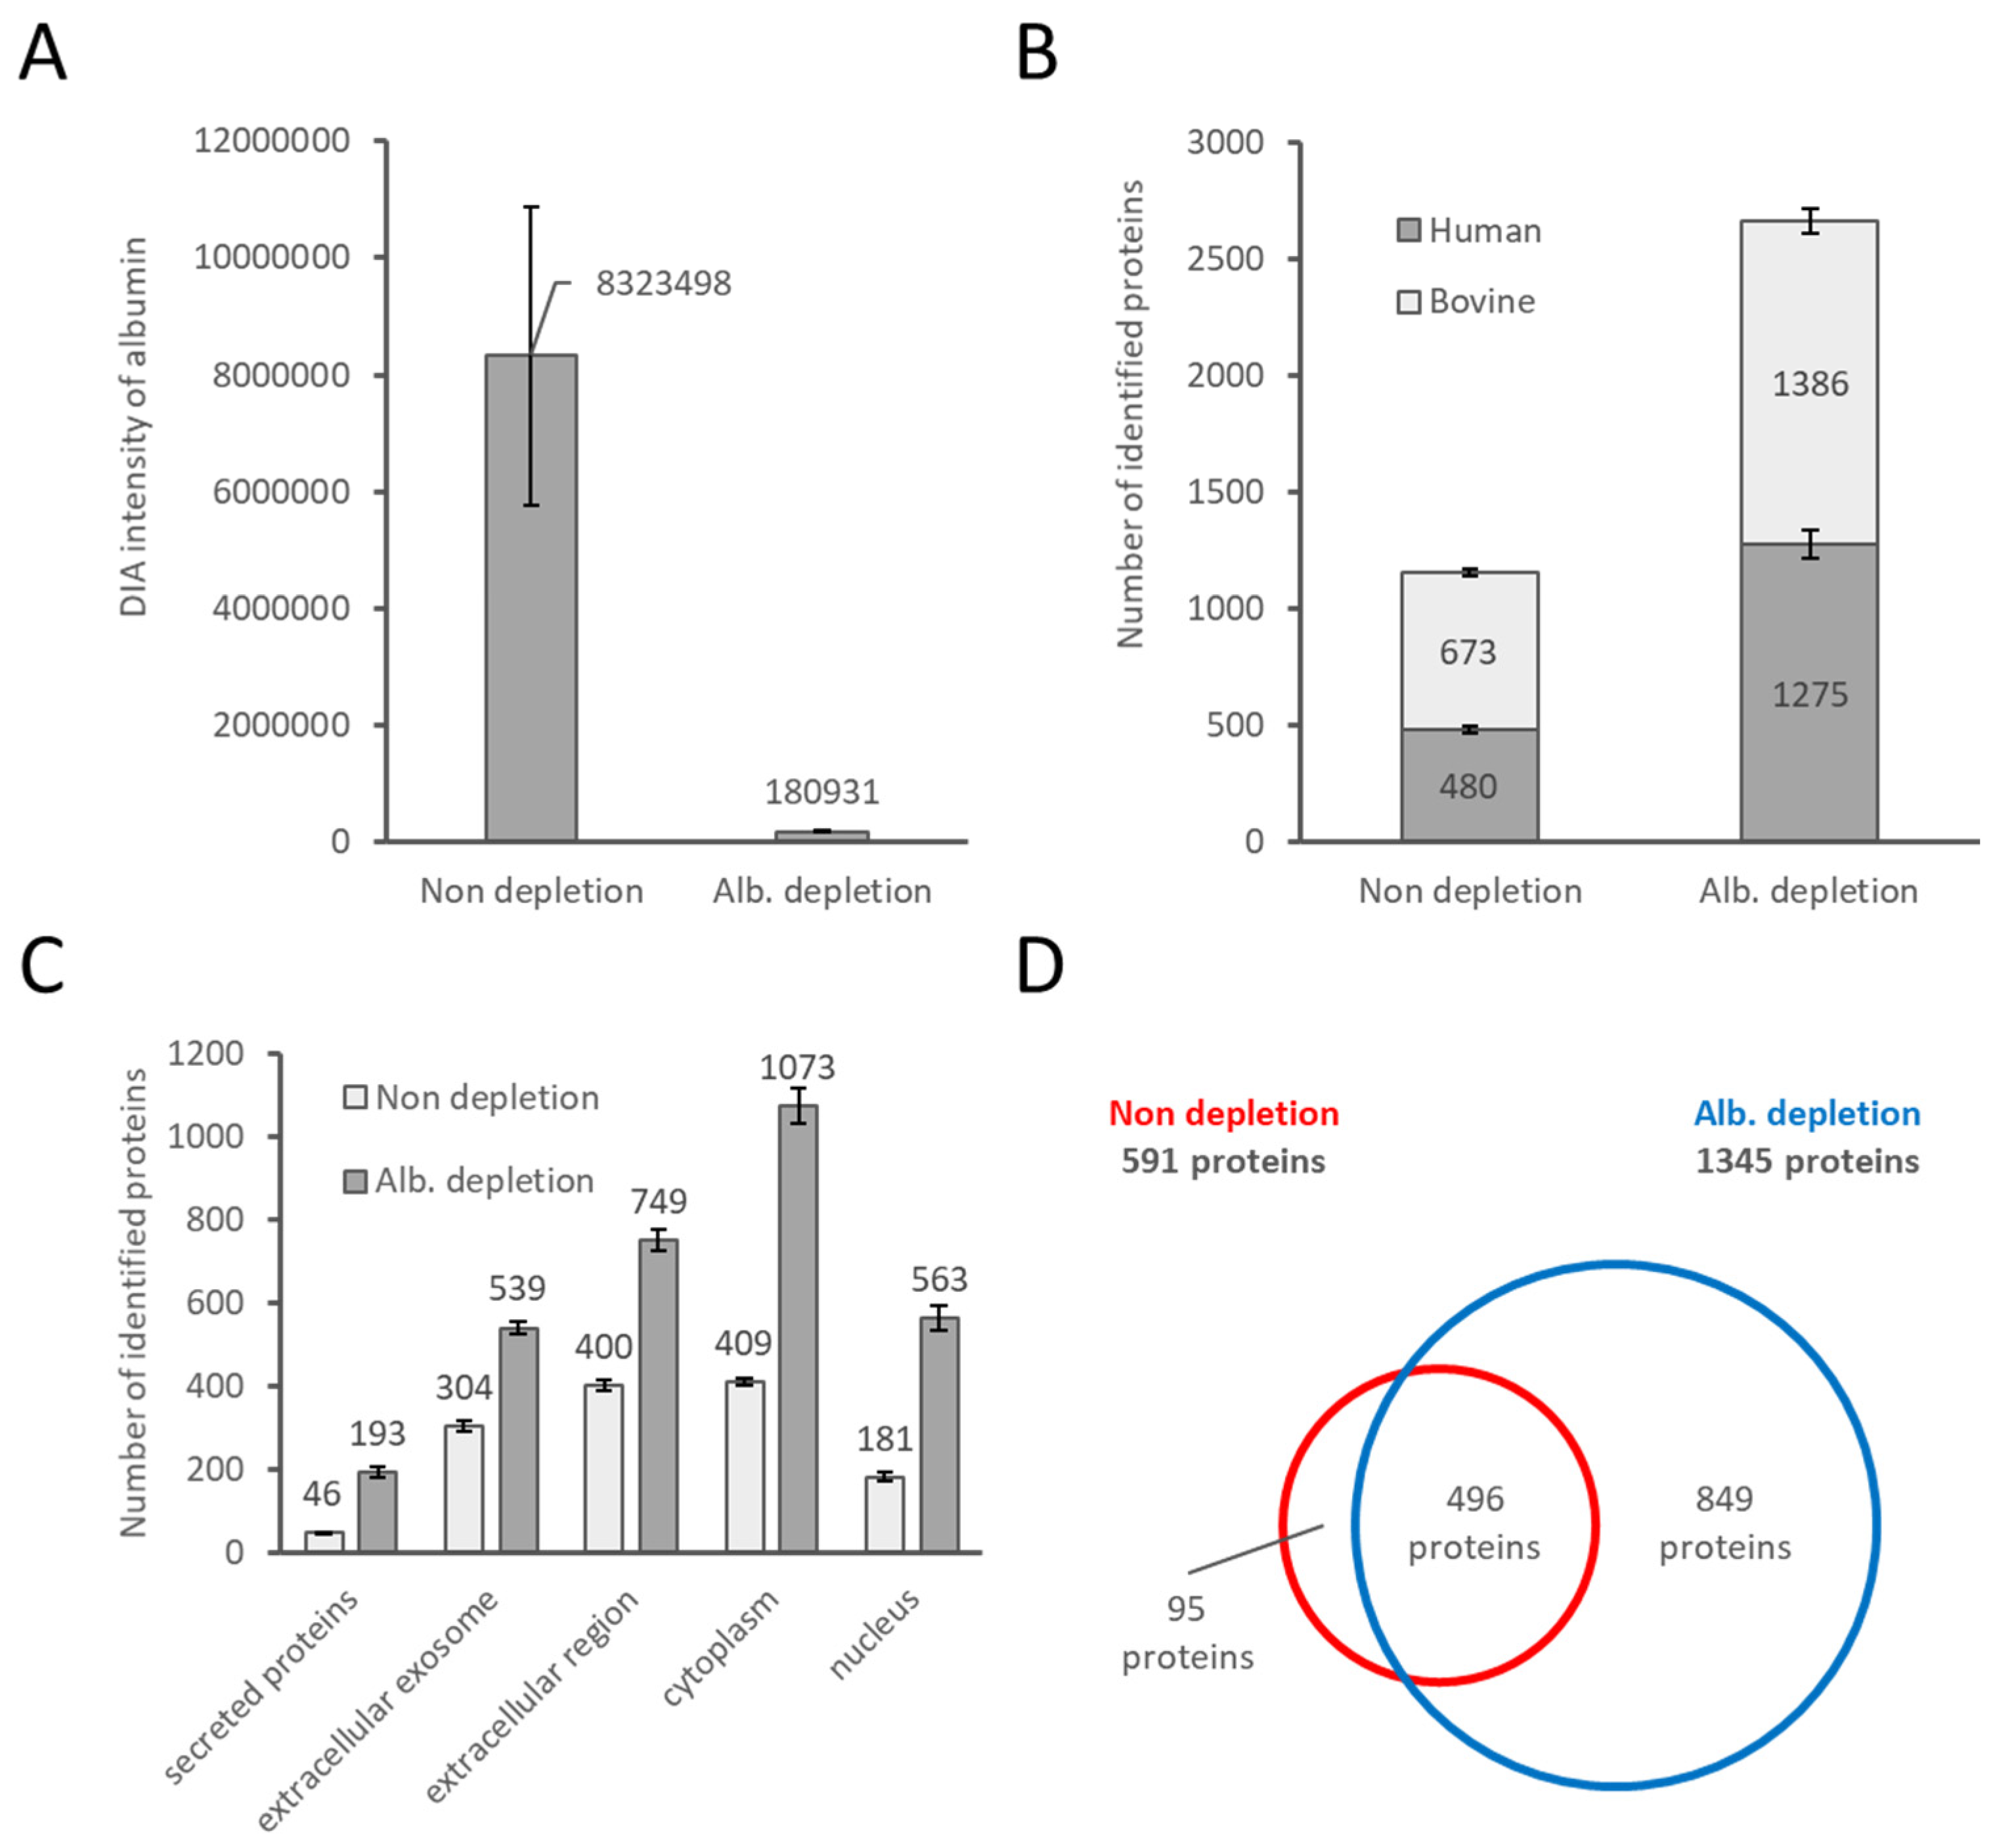
Abstract
1. Introduction
2. Results and Discussion
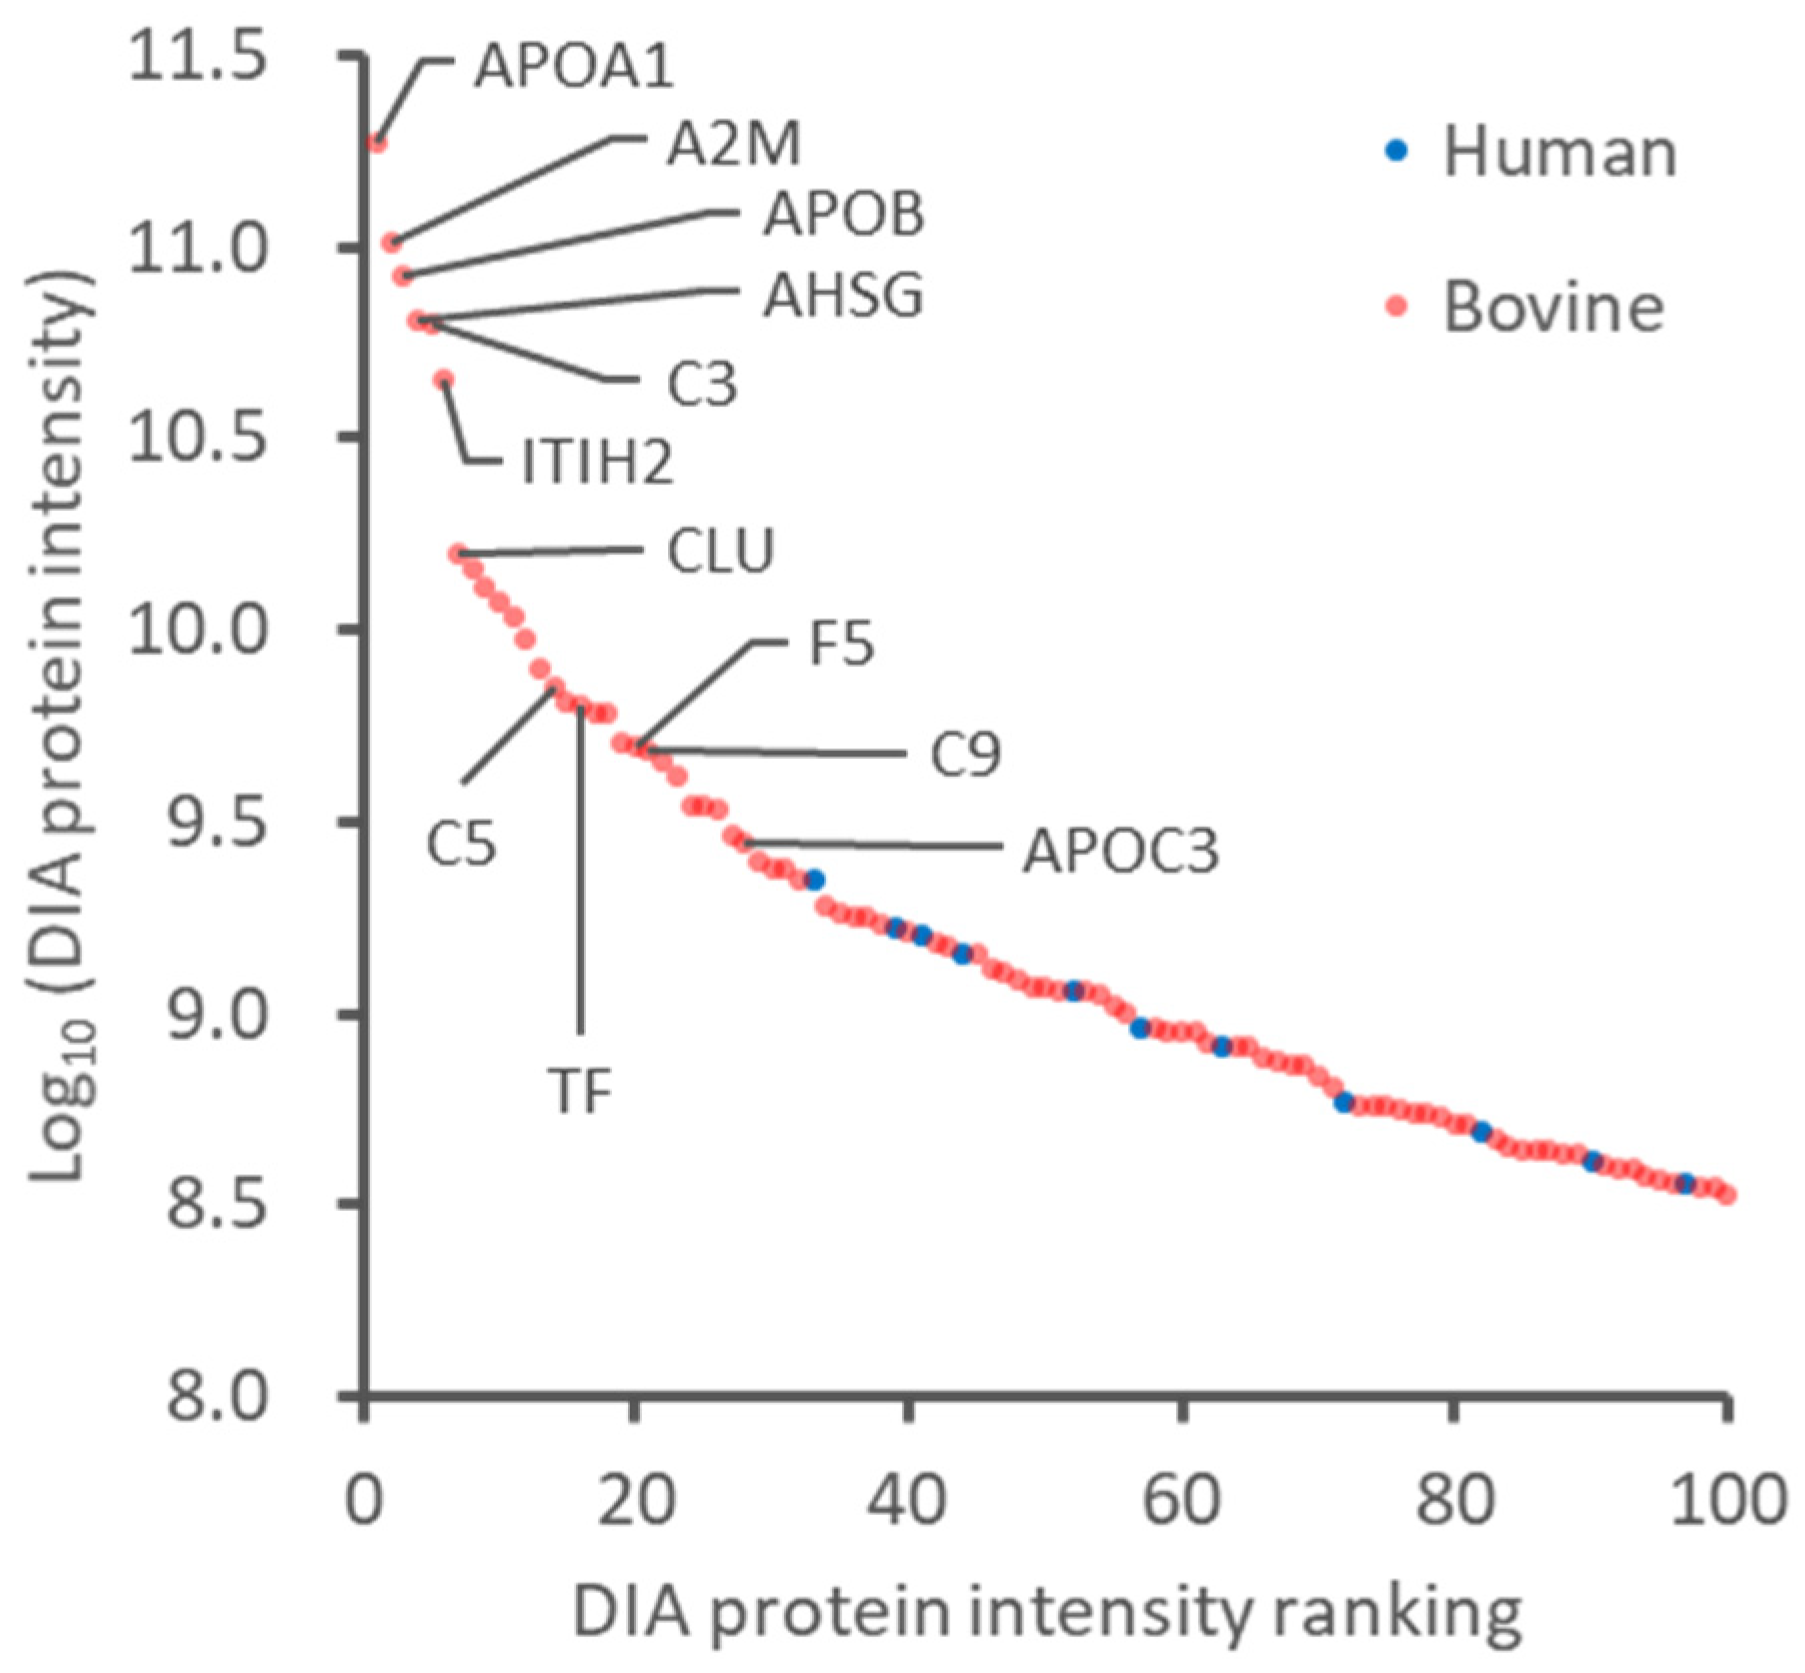
2.1. Evaluation of FBS-Derived Albumin Depletion for Proteome Analysis
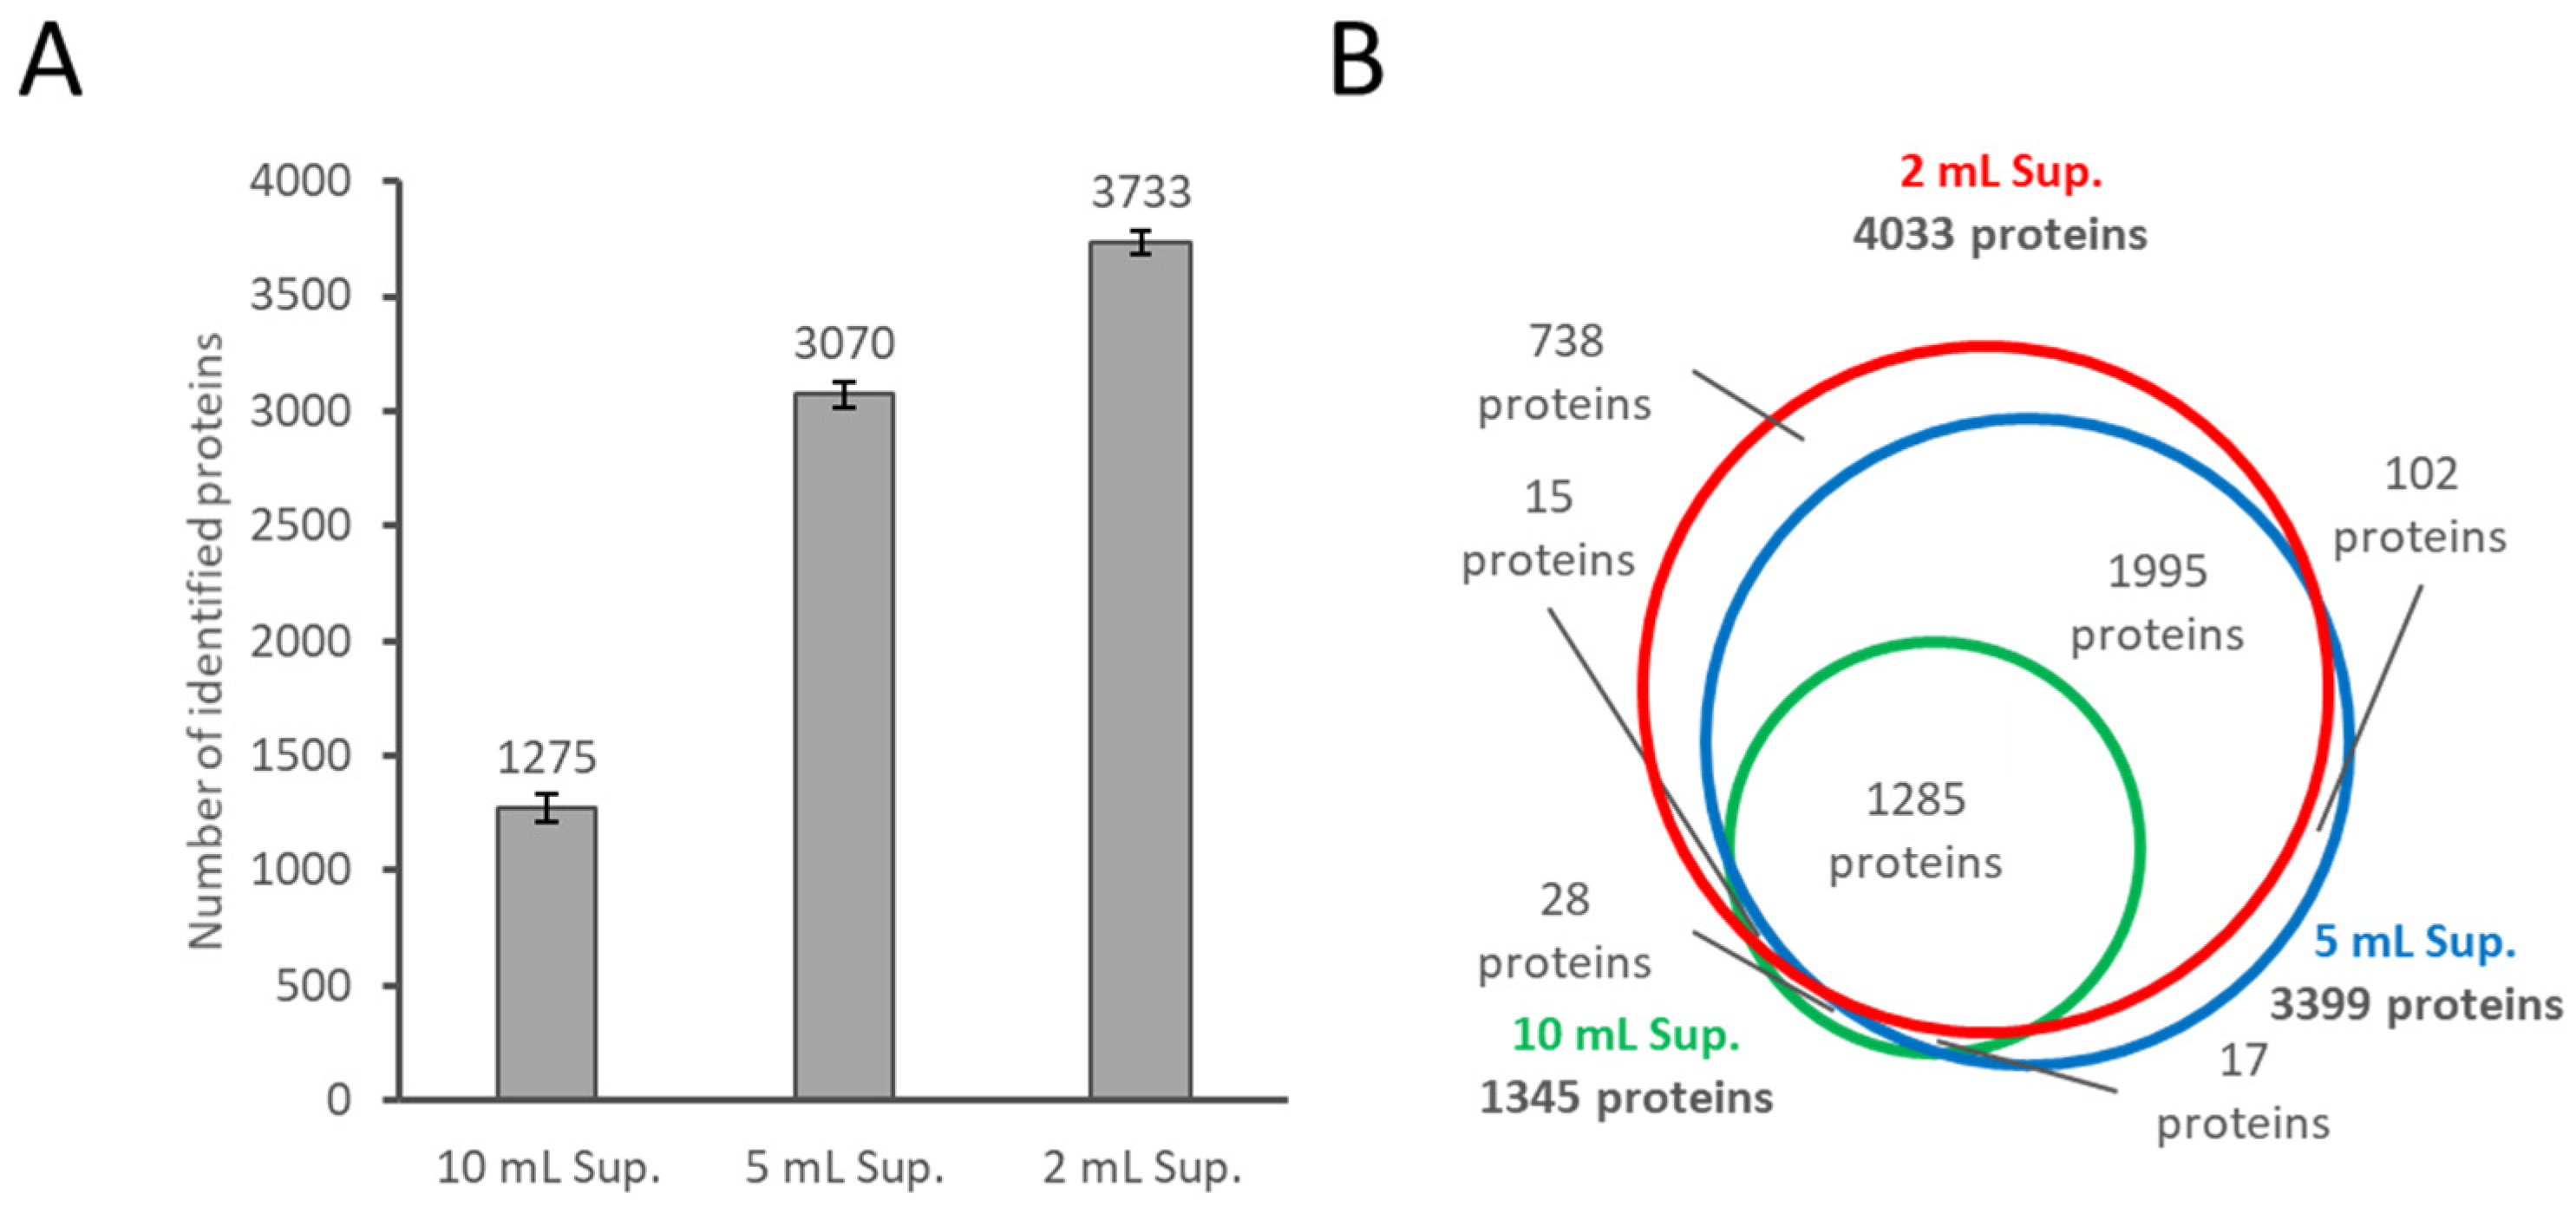
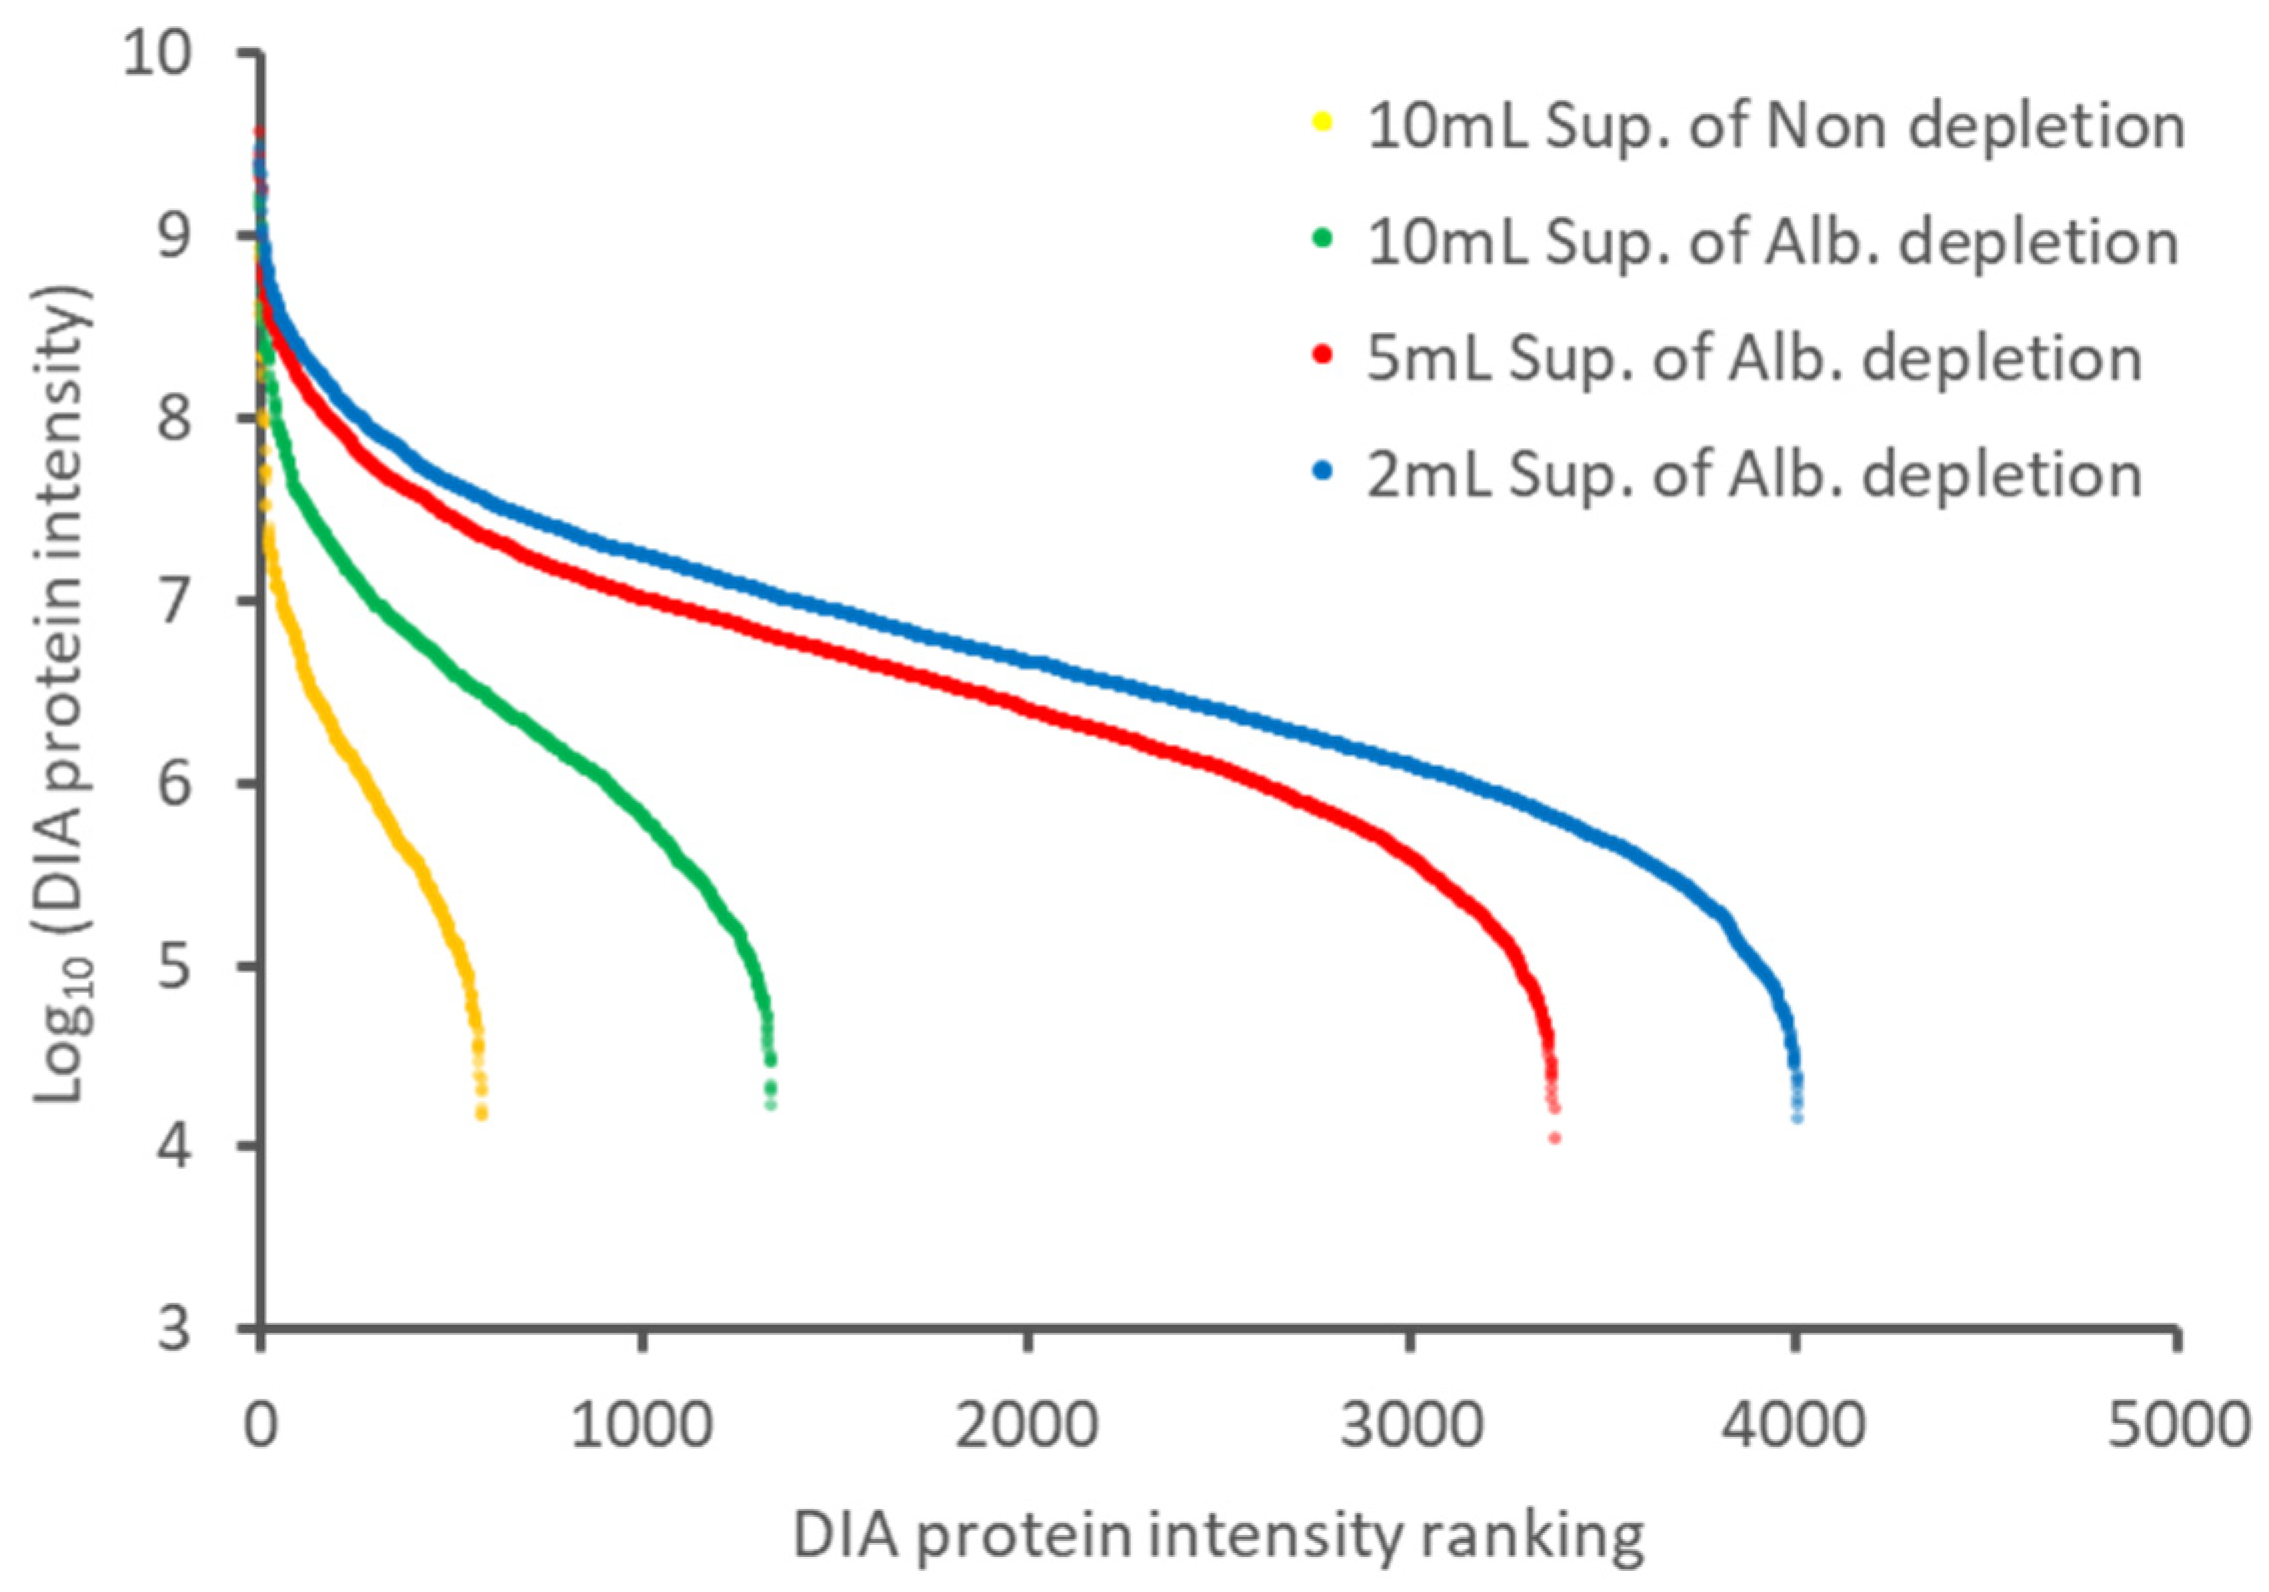
2.2. Further Depth Enhancement of Proteome Analysis by Changing the Volume of the Culture Media
2.3. Reproducibility and Demonstration of the Potency of the Proteome Analysis, Including Albumin Depletion under Cell Culture Conditions with a Small Culture Media
3. Materials and Methods
3.1. Cell Culture and Preparation of Conditioned Medium
3.2. Preparation of Cell Culture Supernatants
3.3. Protein Digestion
3.4. DIA-MS-Based Proteome Analysis
3.5. Data Analysis
4. Conclusions
Supplementary Materials
Author Contributions
Funding
Institutional Review Board Statement
Informed Consent Statement
Data Availability Statement
Conflicts of Interest
Abbreviations
| LC-MS/MS | liquid chromatography–tandem mass spectrometry |
| FBS | fetal bovine serum |
| DIA | data-independent acquisition mode |
| GO | gene ontology |
| CV | coefficient of variation |
| TNF | tumor necrosis factor |
| MEM | minimum essential media |
| FITC | fluorescein isothiocyanate |
| PBS | phosphate buffered saline |
| PI | propidium iodide |
| Tris | tris (hydroxymethyl) aminomethane |
| HCl | hydrochloric acid |
| SDS | sodium dodecyl sulfate |
| DW | distilled water |
| EtOH | ethanol |
| ACN | acetonitrile |
| TFA | trifluoroacetic acid |
References
- Eichelbaum, K.; Winter, M.; Berriel Diaz, M.; Herzig, S.; Krijgsveld, J. Selective enrichment of newly synthesized proteins for quantitative secretome analysis. Nat. Biotechnol. 2012, 30, 984–990. [Google Scholar] [CrossRef] [PubMed]
- Clabaut, A.; Grare, C.; Leger, T.; Hardouin, P.; Broux, O. Variations of secretome profiles according to conditioned medium preparation: The example of human mesenchymal stem cell-derived adipocytes. Electrophoresis 2015, 36, 2587–2593. [Google Scholar] [CrossRef] [PubMed]
- Skalnikova, H.; Motlik, J.; Gadher, S.J.; Kovarova, H. Mapping of the secretome of primary isolates of mammalian cells, stem cells and derived cell lines. Proteomics 2011, 11, 691–708. [Google Scholar] [CrossRef] [PubMed]
- Shimmura, S.; Miyashita, H.; Higa, K.; Yoshida, S.; Shimazaki, J.; Tsubota, K. Proteomic analysis of soluble factors secreted by limbal fibroblasts. Mol. Vis. 2006, 12, 478–484. [Google Scholar] [PubMed]
- Lobb, R.J.; Becker, M.; Wen, S.W.; Wong, C.S.; Wiegmans, A.P.; Leimgruber, A.; Moller, A. Optimized exosome isolation protocol for cell culture supernatant and human plasma. J. Extracell. Vesicles 2015, 4, 27031. [Google Scholar] [CrossRef] [PubMed]
- Weng, Y.; Sui, Z.; Shan, Y.; Jiang, H.; Zhou, Y.; Zhu, X.; Liang, Z.; Zhang, L.; Zhang, Y. In-Depth Proteomic Quantification of Cell Secretome in Serum-Containing Conditioned Medium. Anal. Chem. 2016, 88, 4971–4978. [Google Scholar] [CrossRef]
- Liu, P.; Weng, Y.; Sui, Z.; Wu, Y.; Meng, X.; Wu, M.; Jin, H.; Tan, X.; Zhang, L.; Zhang, Y. Quantitative secretomic analysis of pancreatic cancer cells in serum-containing conditioned medium. Sci. Rep. 2016, 6, 37606. [Google Scholar] [CrossRef] [PubMed]
- Molouki, A.; Hsu, Y.T.; Jahanshiri, F.; Abdullah, S.; Rosli, R.; Yusoff, K. The matrix (M) protein of Newcastle disease virus binds to human bax through its BH3 domain. Virol. J. 2011, 8, 385. [Google Scholar] [CrossRef] [PubMed]
- Prasedya, E.S.; Martyasari, N.W.R.; Hamdin, C.D.; Miyake, M.; Kobayashi, D.; Widyastuti, S.; Hazama, A.; Sunarpi, H. Effectiveness of Methanol Solvent Extraction for Red Macroalgae Acanthophora spicifera Antitumoric Activity. Pharmacogn. J. 2019, 11, 450–454. [Google Scholar] [CrossRef]
- Ben-Neriah, Y.; Karin, M. Inflammation meets cancer, with NF-kappaB as the matchmaker. Nat. Immunol. 2011, 12, 715–723. [Google Scholar] [CrossRef] [PubMed]
- Liu, T.; Zhang, L.; Joo, D.; Sun, S.C. NF-kappaB signaling in inflammation. Signal. Transduct. Target. Ther. 2017, 2. [Google Scholar] [CrossRef]
- Karin, M.; Greten, F.R. NF-kappaB: Linking inflammation and immunity to cancer development and progression. Nat. Rev. Immunol. 2005, 5, 749–759. [Google Scholar] [CrossRef] [PubMed]
- Sielaff, M.; Kuharev, J.; Bohn, T.; Hahlbrock, J.; Bopp, T.; Tenzer, S.; Distler, U. Evaluation of FASP, SP3, and iST Protocols for Proteomic Sample Preparation in the Low Microgram Range. J. Proteome Res. 2017, 16, 4060–4072. [Google Scholar] [CrossRef] [PubMed]
- Kawashima, Y.; Watanabe, E.; Umeyama, T.; Nakajima, D.; Hattori, M.; Honda, K.; Ohara, O. Optimization of Data-Independent Acquisition Mass Spectrometry for Deep and Highly Sensitive Proteomic Analysis. Int. J. Mol. Sci. 2019, 20, 5932. [Google Scholar] [CrossRef] [PubMed]
- Amodei, D.; Egertson, J.; MacLean, B.X.; Johnson, R.; Merrihew, G.E.; Keller, A.; Marsh, D.; Vitek, O.; Mallick, P.; MacCoss, M.J. Improving Precursor Selectivity in Data-Independent Acquisition Using Overlapping Windows. J. Am. Soc. Mass Spectrom. 2019, 30, 669–684. [Google Scholar] [CrossRef] [PubMed]
- Gessulat, S.; Schmidt, T.; Zolg, D.P.; Samaras, P.; Schnatbaum, K.; Zerweck, J.; Knaute, T.; Rechenberger, J.; Delanghe, B.; Huhmer, A.; et al. Prosit: Proteome-wide prediction of peptide tandem mass spectra by deep learning. Nat. Methods 2019, 16, 509–518. [Google Scholar] [CrossRef] [PubMed]
- Searle, B.C.; Swearingen, K.E.; Barnes, C.A.; Schmidt, T.; Gessulat, S.; Kuster, B.; Wilhelm, M. Generating high quality libraries for DIA MS with empirically corrected peptide predictions. Nat. Commun. 2020, 11, 1548. [Google Scholar] [CrossRef] [PubMed]
- Searle, B.C.; Pino, L.K.; Egertson, J.D.; Ting, Y.S.; Lawrence, R.T.; MacLean, B.X.; Villen, J.; MacCoss, M.J. Chromatogram libraries improve peptide detection and quantification by data independent acquisition mass spectrometry. Nat. Commun. 2018, 9, 5128. [Google Scholar] [CrossRef] [PubMed]
- Okuda, S.; Watanabe, Y.; Moriya, Y.; Kawano, S.; Yamamoto, T.; Matsumoto, M.; Takami, T.; Kobayashi, D.; Araki, N.; Yoshizawa, A.C.; et al. jPOSTrepo: An international standard data repository for proteomes. Nucleic Acids Res. 2017, 45, D1107–D1111. [Google Scholar] [CrossRef] [PubMed]


Publisher’s Note: MDPI stays neutral with regard to jurisdictional claims in published maps and institutional affiliations. |
© 2021 by the authors. Licensee MDPI, Basel, Switzerland. This article is an open access article distributed under the terms and conditions of the Creative Commons Attribution (CC BY) license (http://creativecommons.org/licenses/by/4.0/).
Share and Cite
Nakamura, R.; Nakajima, D.; Sato, H.; Endo, Y.; Ohara, O.; Kawashima, Y. A Simple Method for In-Depth Proteome Analysis of Mammalian Cell Culture Conditioned Media Containing Fetal Bovine Serum. Int. J. Mol. Sci. 2021, 22, 2565. https://doi.org/10.3390/ijms22052565
Nakamura R, Nakajima D, Sato H, Endo Y, Ohara O, Kawashima Y. A Simple Method for In-Depth Proteome Analysis of Mammalian Cell Culture Conditioned Media Containing Fetal Bovine Serum. International Journal of Molecular Sciences. 2021; 22(5):2565. https://doi.org/10.3390/ijms22052565
Chicago/Turabian StyleNakamura, Ren, Daisuke Nakajima, Hironori Sato, Yusuke Endo, Osamu Ohara, and Yusuke Kawashima. 2021. "A Simple Method for In-Depth Proteome Analysis of Mammalian Cell Culture Conditioned Media Containing Fetal Bovine Serum" International Journal of Molecular Sciences 22, no. 5: 2565. https://doi.org/10.3390/ijms22052565
APA StyleNakamura, R., Nakajima, D., Sato, H., Endo, Y., Ohara, O., & Kawashima, Y. (2021). A Simple Method for In-Depth Proteome Analysis of Mammalian Cell Culture Conditioned Media Containing Fetal Bovine Serum. International Journal of Molecular Sciences, 22(5), 2565. https://doi.org/10.3390/ijms22052565