Article

Epigallocatechin-3-gallate Can Prevent Type 2 Human Papillomavirus E7 from Suppressing Interferon-Stimulated Genes

1
Program of Immunology & Microbiology, Department of Biomedicine & Health Sciences, Graduate School, The Catholic University of Korea, 222, Banpo-daero, Seocho-gu, Seoul 06591, Korea
2
Department of Dermatology, Seoul St. Mary’s Hospital, College of Medicine, The Catholic University of Korea, 222, Banpo-daero, Seocho-gu, Seoul 06591, Korea
3
Department of Biological Science and Biotechnology, College of Life Science and Nano Technology, Hannam University, 1646, Yuseong-daero, Yuseong-gu, Daejeon 34054, Korea
*
Author to whom correspondence should be addressed.
Int. J. Mol. Sci. 2021, 22(5), 2418; https://doi.org/10.3390/ijms22052418
Submission received: 12 January 2021 / Revised: 24 February 2021 / Accepted: 24 February 2021 / Published: 28 February 2021
(This article belongs to the Section Molecular Microbiology)

Abstract

:
Human papillomavirus (HPV) in high-risk groups is known to suppress the type I interferon (IFN) signaling pathway leading to the transcription of interferon-stimulated genes (ISGs), which have many antiviral functions. However, the effects of HPV on the action of various ISGs in low-risk groups are not fully understood. We aimed to investigate whether antiviral ISGs are expressed in transfected keratinocytes with type 2 HPV (HPV-2) E7. The mRNA and protein expressions of ISGs and type I IFN signaling pathway components were evaluated by quantitative real-time polymerase chain reaction, western blot, immunofluorescence, and/or immunohistochemistry. Compared with normal skin, mRNA expression of all ISGs in HPV-2 positive cutaneous warts was significantly decreased (p < 0.05). In comparison with empty vector transfection, E7 transfection significantly down-regulated the mRNA and protein expressions of ISGs and type I IFN signaling pathway components, which were significantly up-regulated by E7 siRNA transfection (p < 0.05). Interestingly, epigallocatechin-3-gallate (EGCG) pretreatment up-regulated the mRNA and protein expressions of ISGs and type I IFN signaling pathway components, which were significantly down-regulated by E7 transfection (p < 0.05). Our results demonstrate that EGCG is a potential candidate for cutaneous wart prevention.

1. Introduction

Human papillomaviruses (HPV) are small, non-enveloped, double-stranded DNA viruses that infect cutaneous and mucosal epithelial tissues [1,2]. When infected with HPV, the innate host immunity becomes the first line of defense [3]. Following viral entry, HPV is recognized by pattern recognition receptors (PRRs) such as toll-like receptors (TLRs). The recognition of HPV infection by PRRs leads to the activation of a cascade of downstream signaling pathways [4]. However, HPV can evade immune surveillance to establish persistent infections. The evasion strategies of HPV are modulation of cytokine and chemokine expression, alteration of antigen presentation, and down-regulation of the interferon (IFN) pathway and adhesion molecules [5].
IFNs are components of the innate immune system that protect against viral infection through antiviral, anti-proliferative, and immune-stimulatory mechanisms [6]. IFNs act through their cell surface receptors to engage the Janus kinase (JAK)-signal transducer and activator of transcription (STAT) pathway [7]. Type I IFN signaling induces the transcription of interferon-stimulated genes (ISGs), whose protein products inhibit virus life cycles [8]. In the absence of detectable IFNs, constitutive ISG which is known to be critical for cellular susceptibility to viral infection is expressed. Constitutive ISG expression is mediated by the unphosphorylated-interferon stimulated gene factor-3 (U-ISGF-3) complex, which is formed by interferon regulatory factor (IRF)-9 and unphosphorylated STAT-1 and STAT-2 [9]. The U-ISGF-3 complex persists and is responsible for expression of a signature set of ISGs, many of them known antiviral proteins [10]. For example, interferon-stimulated gene 15 (ISG15) is one of the most highly induced ISGs, and modulates numerous cellular activities. Mx proteins are also highly induced by type I IFNs, and only human myxovirus-resistant protein A (MxA) has been shown to have antiviral activity. 2′-5′-oligoadenylate synthetase (OAS) proteins polymerizes ATP to 2′-5′-linked oligomers of adenylate, which activate Ribonuclease L to degrade viral RNA [11]. IFN response could be related to the regression of HPV infection, whereas HPV proteins interfere with the induction of the type I IFN signaling pathway. Microarray analyses have demonstrated that high-risk HPV proteins suppress the expression of a broad set of ISGs including MxA, OAS, and STAT-1 [12]. HPV-18 E6 has been reported to inhibit the JAK-STAT pathway by directly interacting with TYK2 [13]. HPV-16 E7 has also been shown to bind IRF-9 blocking the ISGF-3 complex translocation to the nucleus and ISGs expression [14]. Similarly, type 2 HPV (HPV-2) E7 has been reported to attenuate the expression of viperin (virus inhibitory protein, endoplasmic reticulum-associated, interferon-inducible) [15]. However, the effect of HPV-2 E7 on antiviral ISGs is not yet clear.
Green tea contains various polyphenolic compounds known as catechins [16]. Epigallocatechin-3-gallate (EGCG) is one of the major components of these catechins, and has various bioactivities, including anti-oxidant, anti-viral, anti-proliferative, and immunomodulatory functions [17]. EGCG is currently being actively studied for its antiviral effect on diverse families of viruses such as HPV [18], human immunodeficiency virus (HIV) [19], and hepatitis C virus (HCV) [20] and for the prevention of carcinogenesis in various organs [21].
In this study, we investigated whether HPV-2 E7 can inhibit ISGs expression by down-regulating the type I IFN signaling pathway. Furthermore, we examined the effect of EGCG on ISGs expression.

2. Results

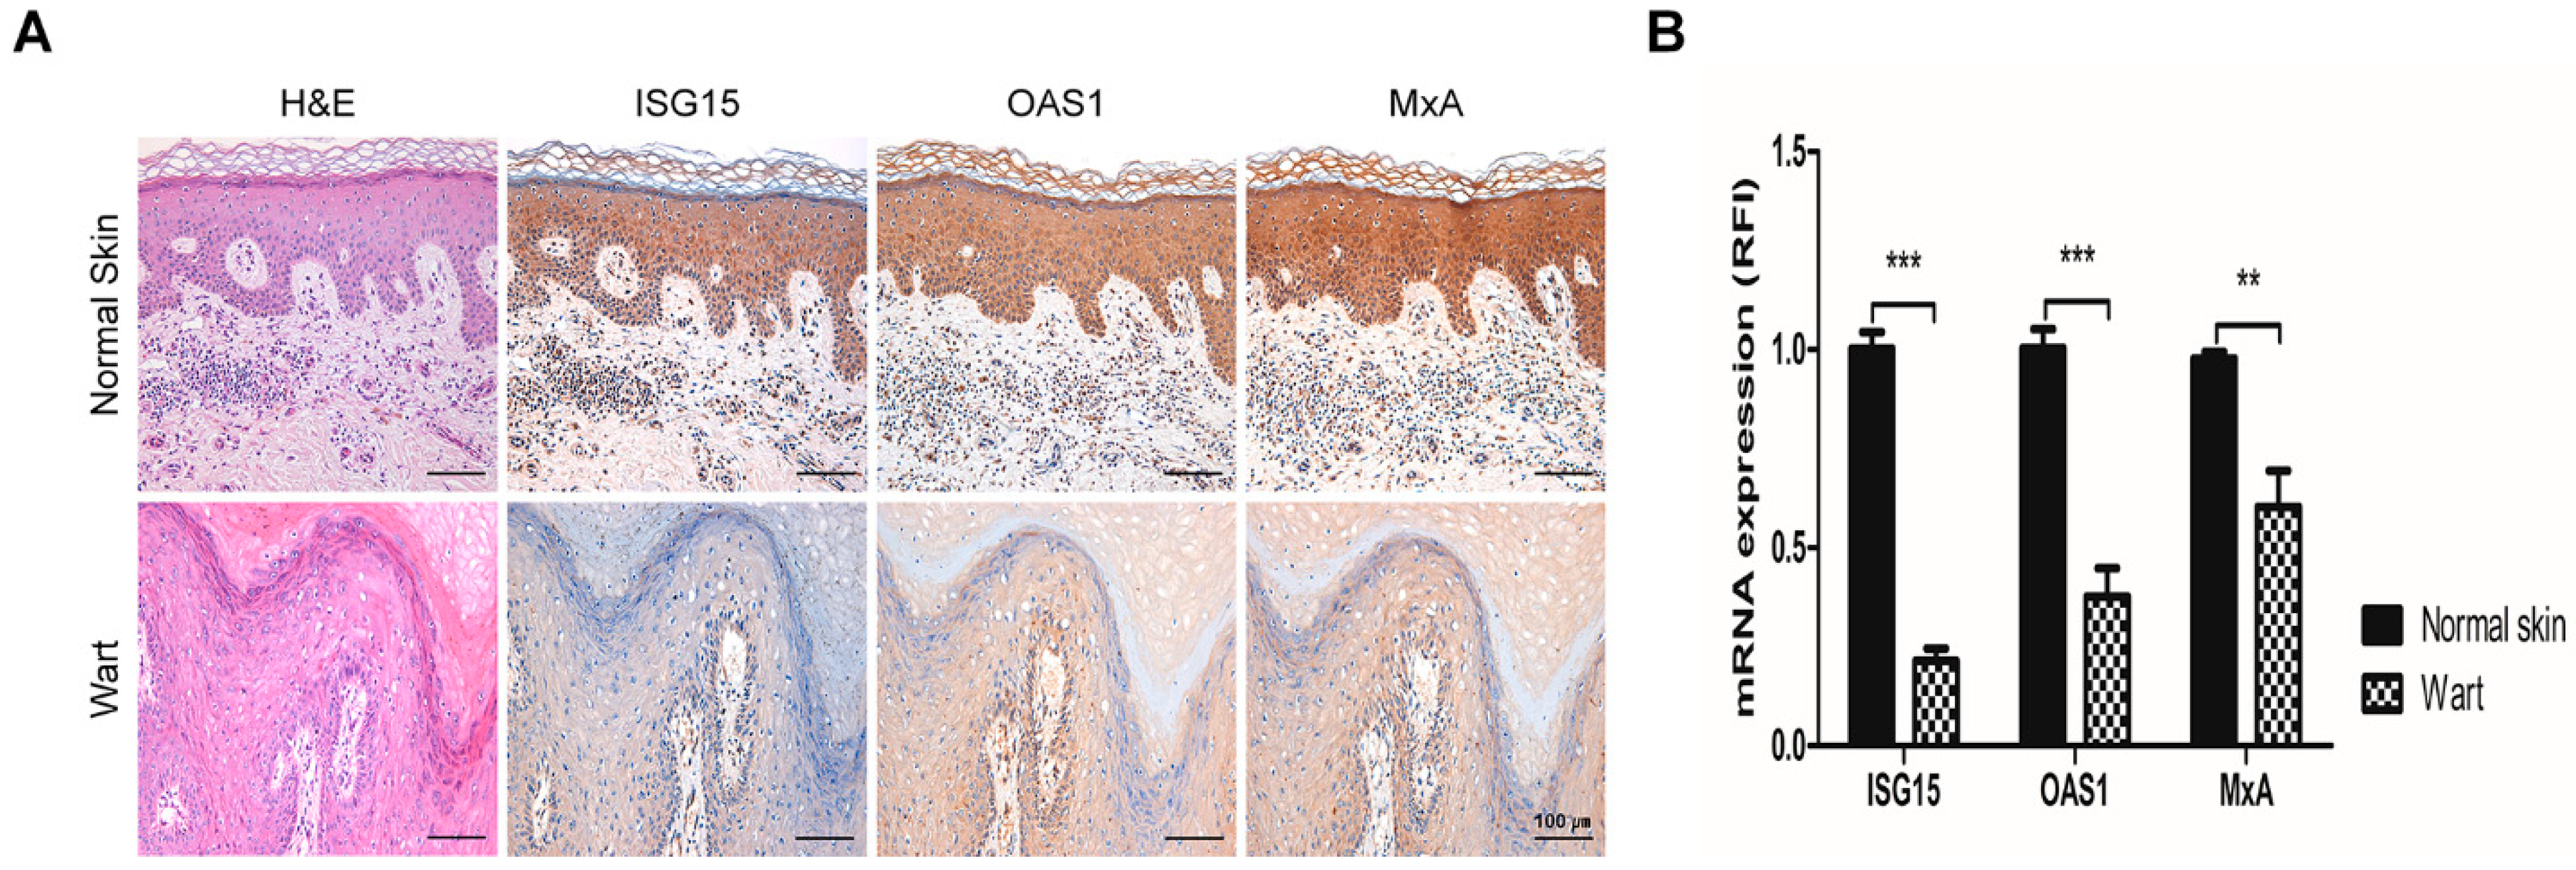
2.1. The Expression of Interferon-Stimulated Genes Declined in HPV-2 Wart Samples

We aimed to determine the ISGs expression levels in human tissues via immunohistochemistry and RT-qPCR. Immunohistochemistry results showed that the protein expressions of ISG15, OAS1, and MxA in the epidermis of HPV-2 positive warts were weaker than those of normal skin (Figure 1A). Likewise, the mRNA expressions of ISG15, OAS1, and MxA in wart samples were significantly decreased compared to normal skin (p < 0.01) (Figure 1B).

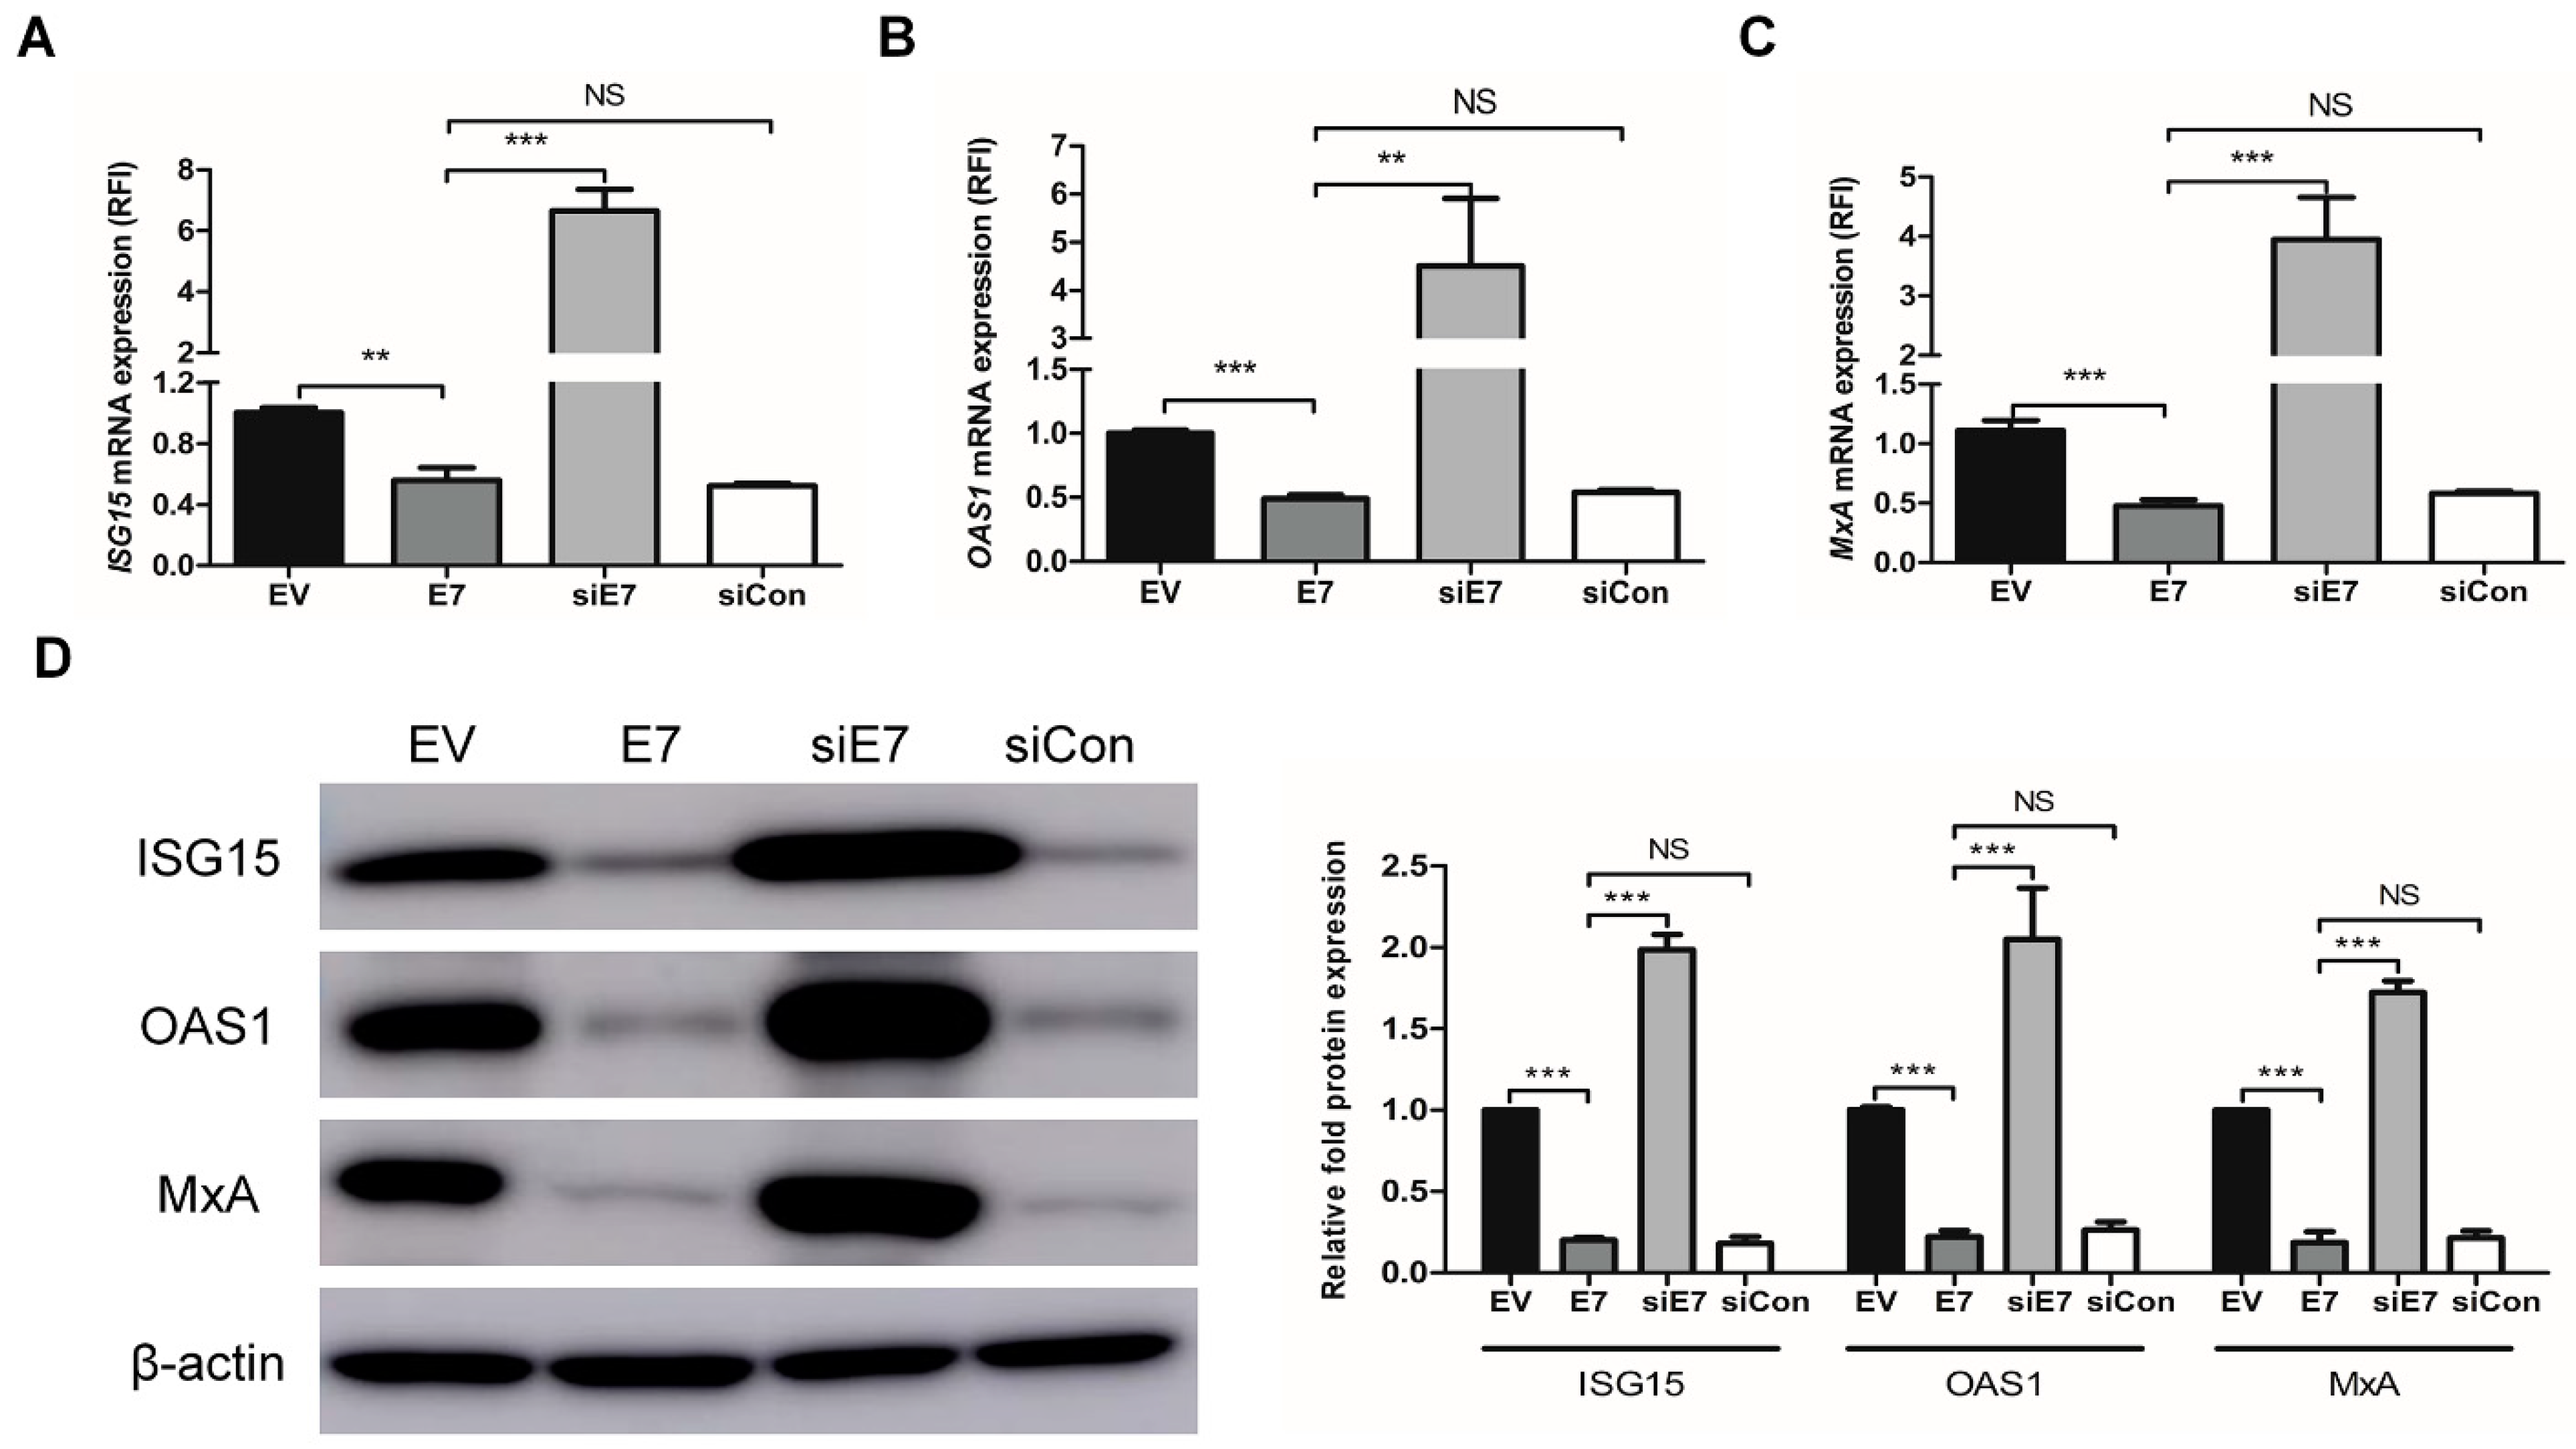
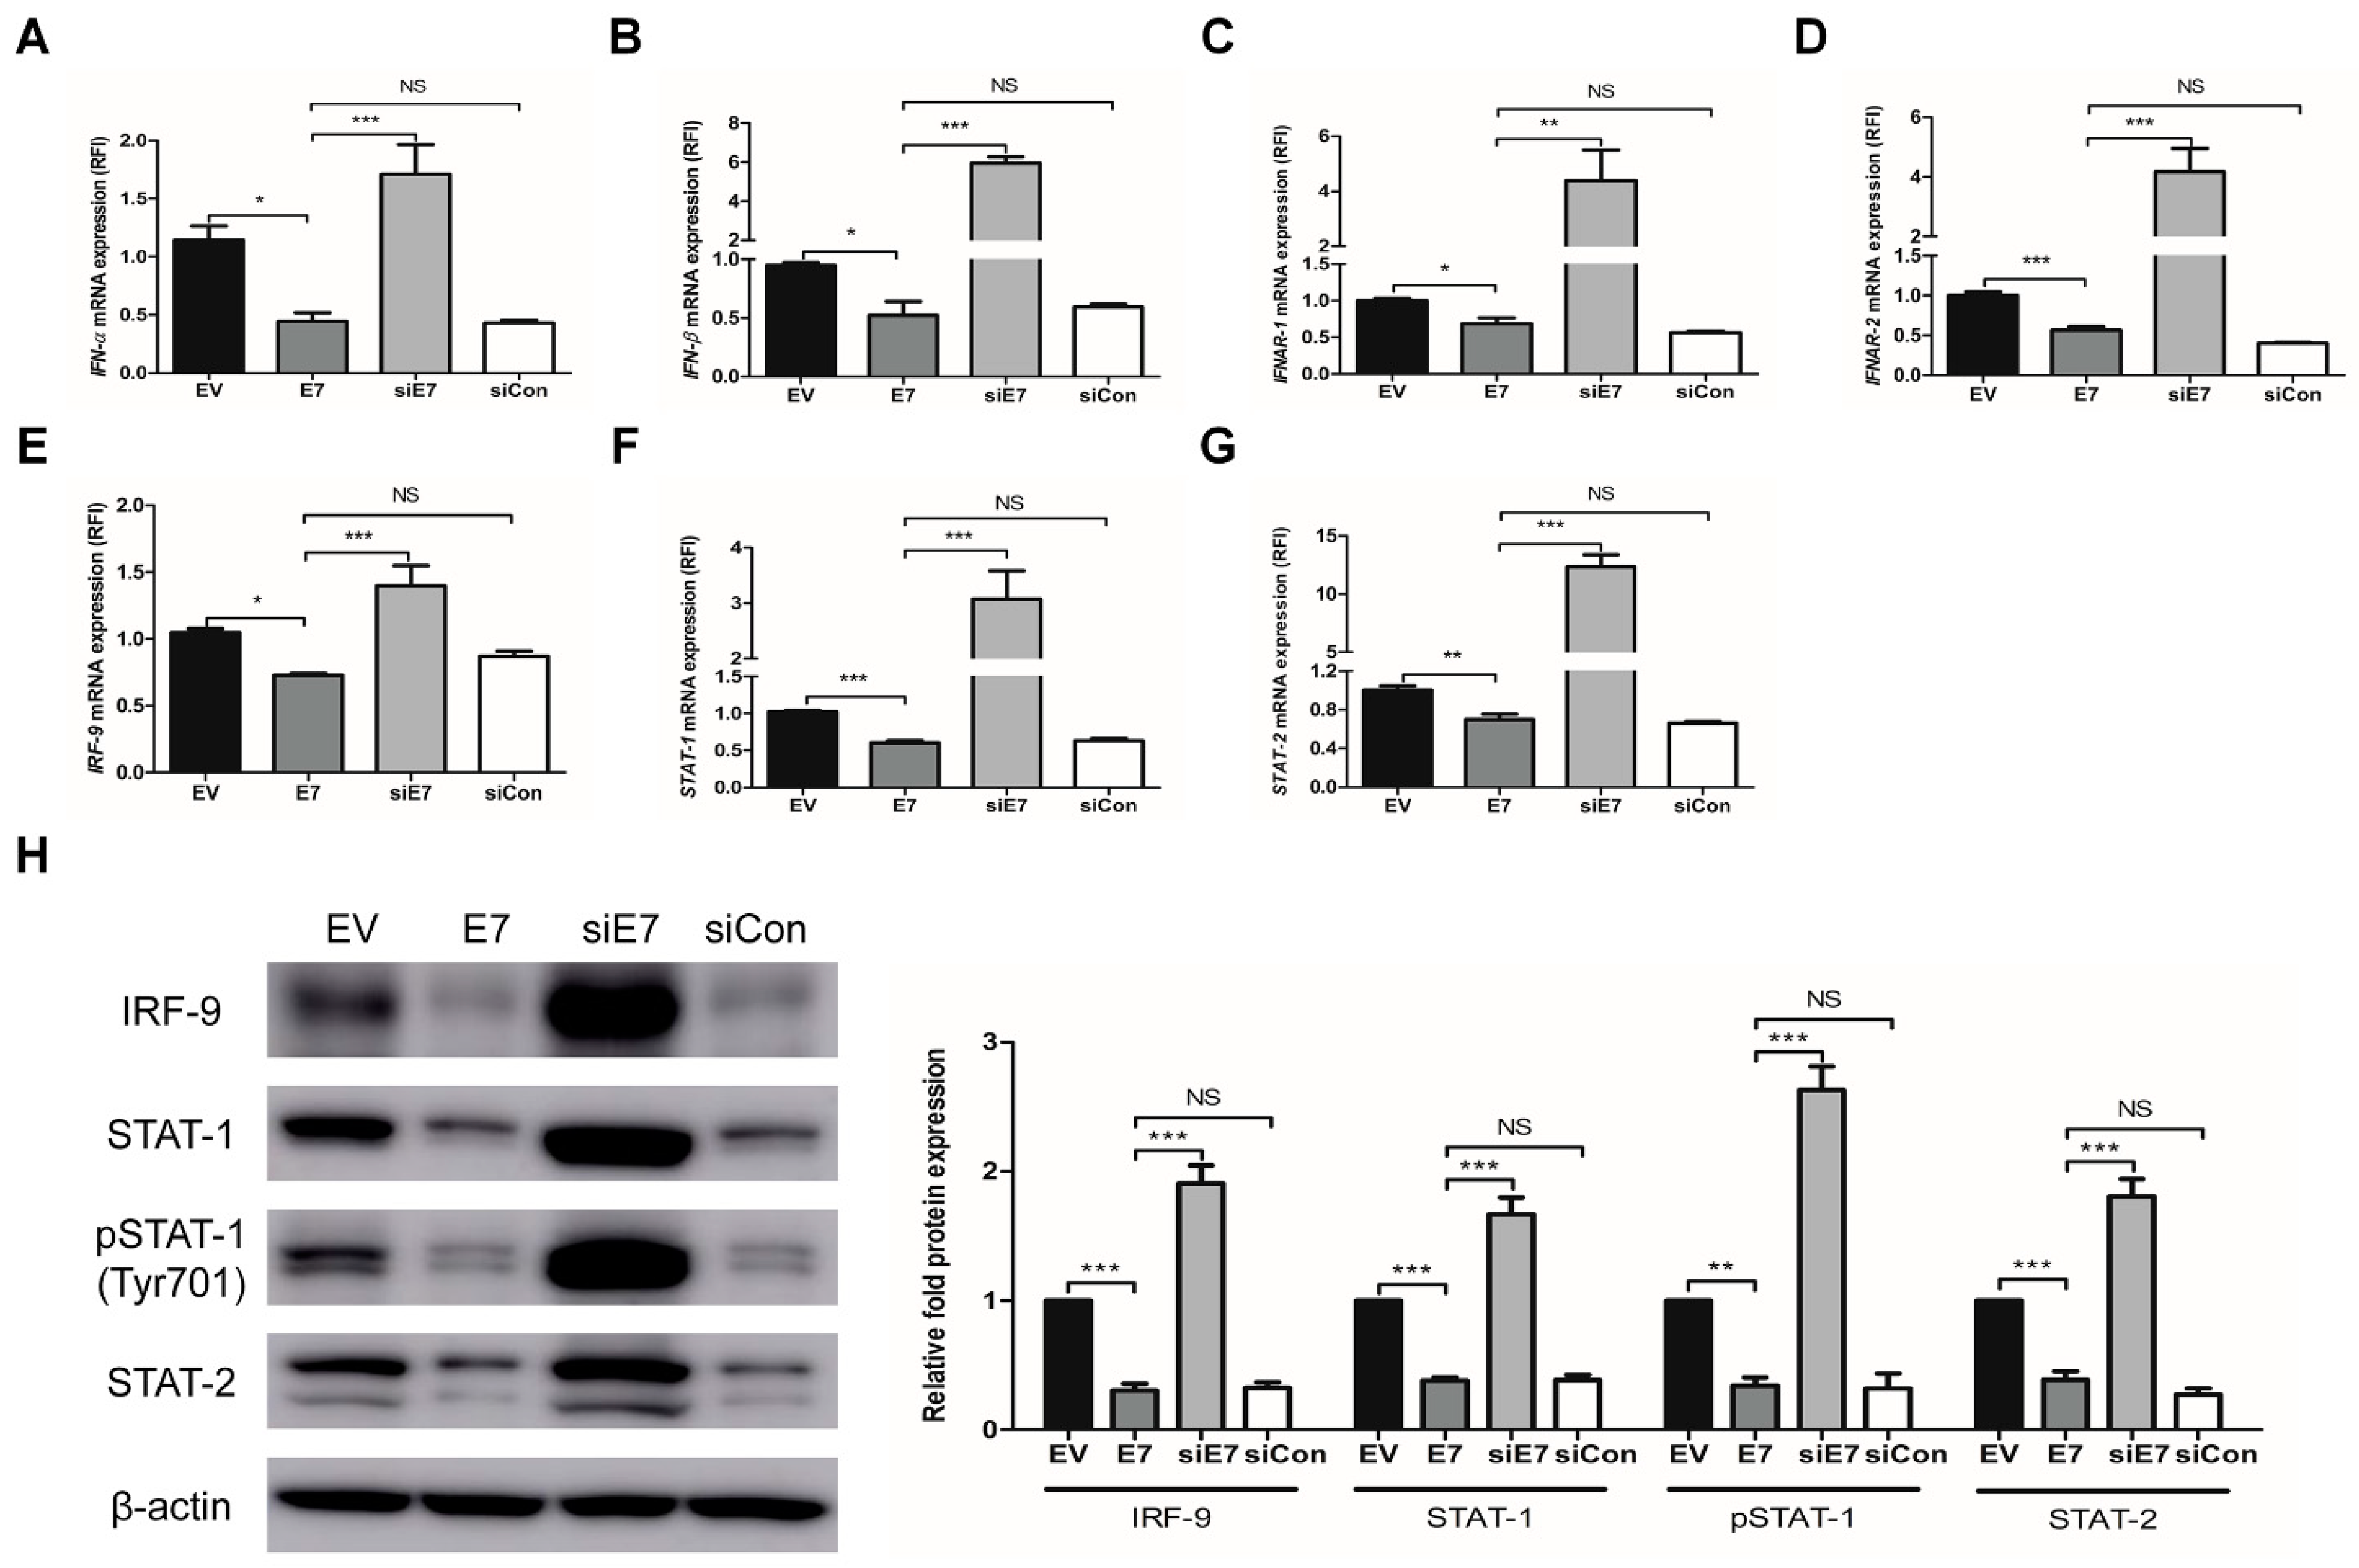
2.2. HPV-2 E7 Suppressed the Expression Of Interferon-Stimulated Genes by Down-Regulating the Type I Interferon Signaling pathway

Next, we examined the effects of HPV-2 E7 transfection on the expression of ISGs through the type I IFN signaling pathway using HaCaT cells. To further study the functional specificity of E7 on the expression of ISGs, HaCaT cells were transfected with HPV-2 E7, E7 specific siRNA (siE7), or negative control siRNA (siCon). E7 transfection significantly down-regulated the mRNA and protein expressions of ISGs (including ISG15, OAS1, and MxA), which were significantly up-regulated by E7 siRNA transfection (p < 0.01) (Figure 2). Likewise, E7 transfection significantly down-regulated not only the mRNA expression of type I IFN signaling pathway components including IFN-α, and their receptors (IFNAR-1, 2), IRF-9, STAT-1 and STAT-2, but also the protein expression of the U-ISGF-3 components (including IRF-9, STAT-1, STAT-2, and tyrosine phosphorylated STAT-1), which were significantly up-regulated by E7 siRNA transfection (p < 0.05) (Figure 3). Our results demonstrate that HPV-2 E7 can suppress the expression of ISGs by the down-regulation of the type I IFN signaling pathway.

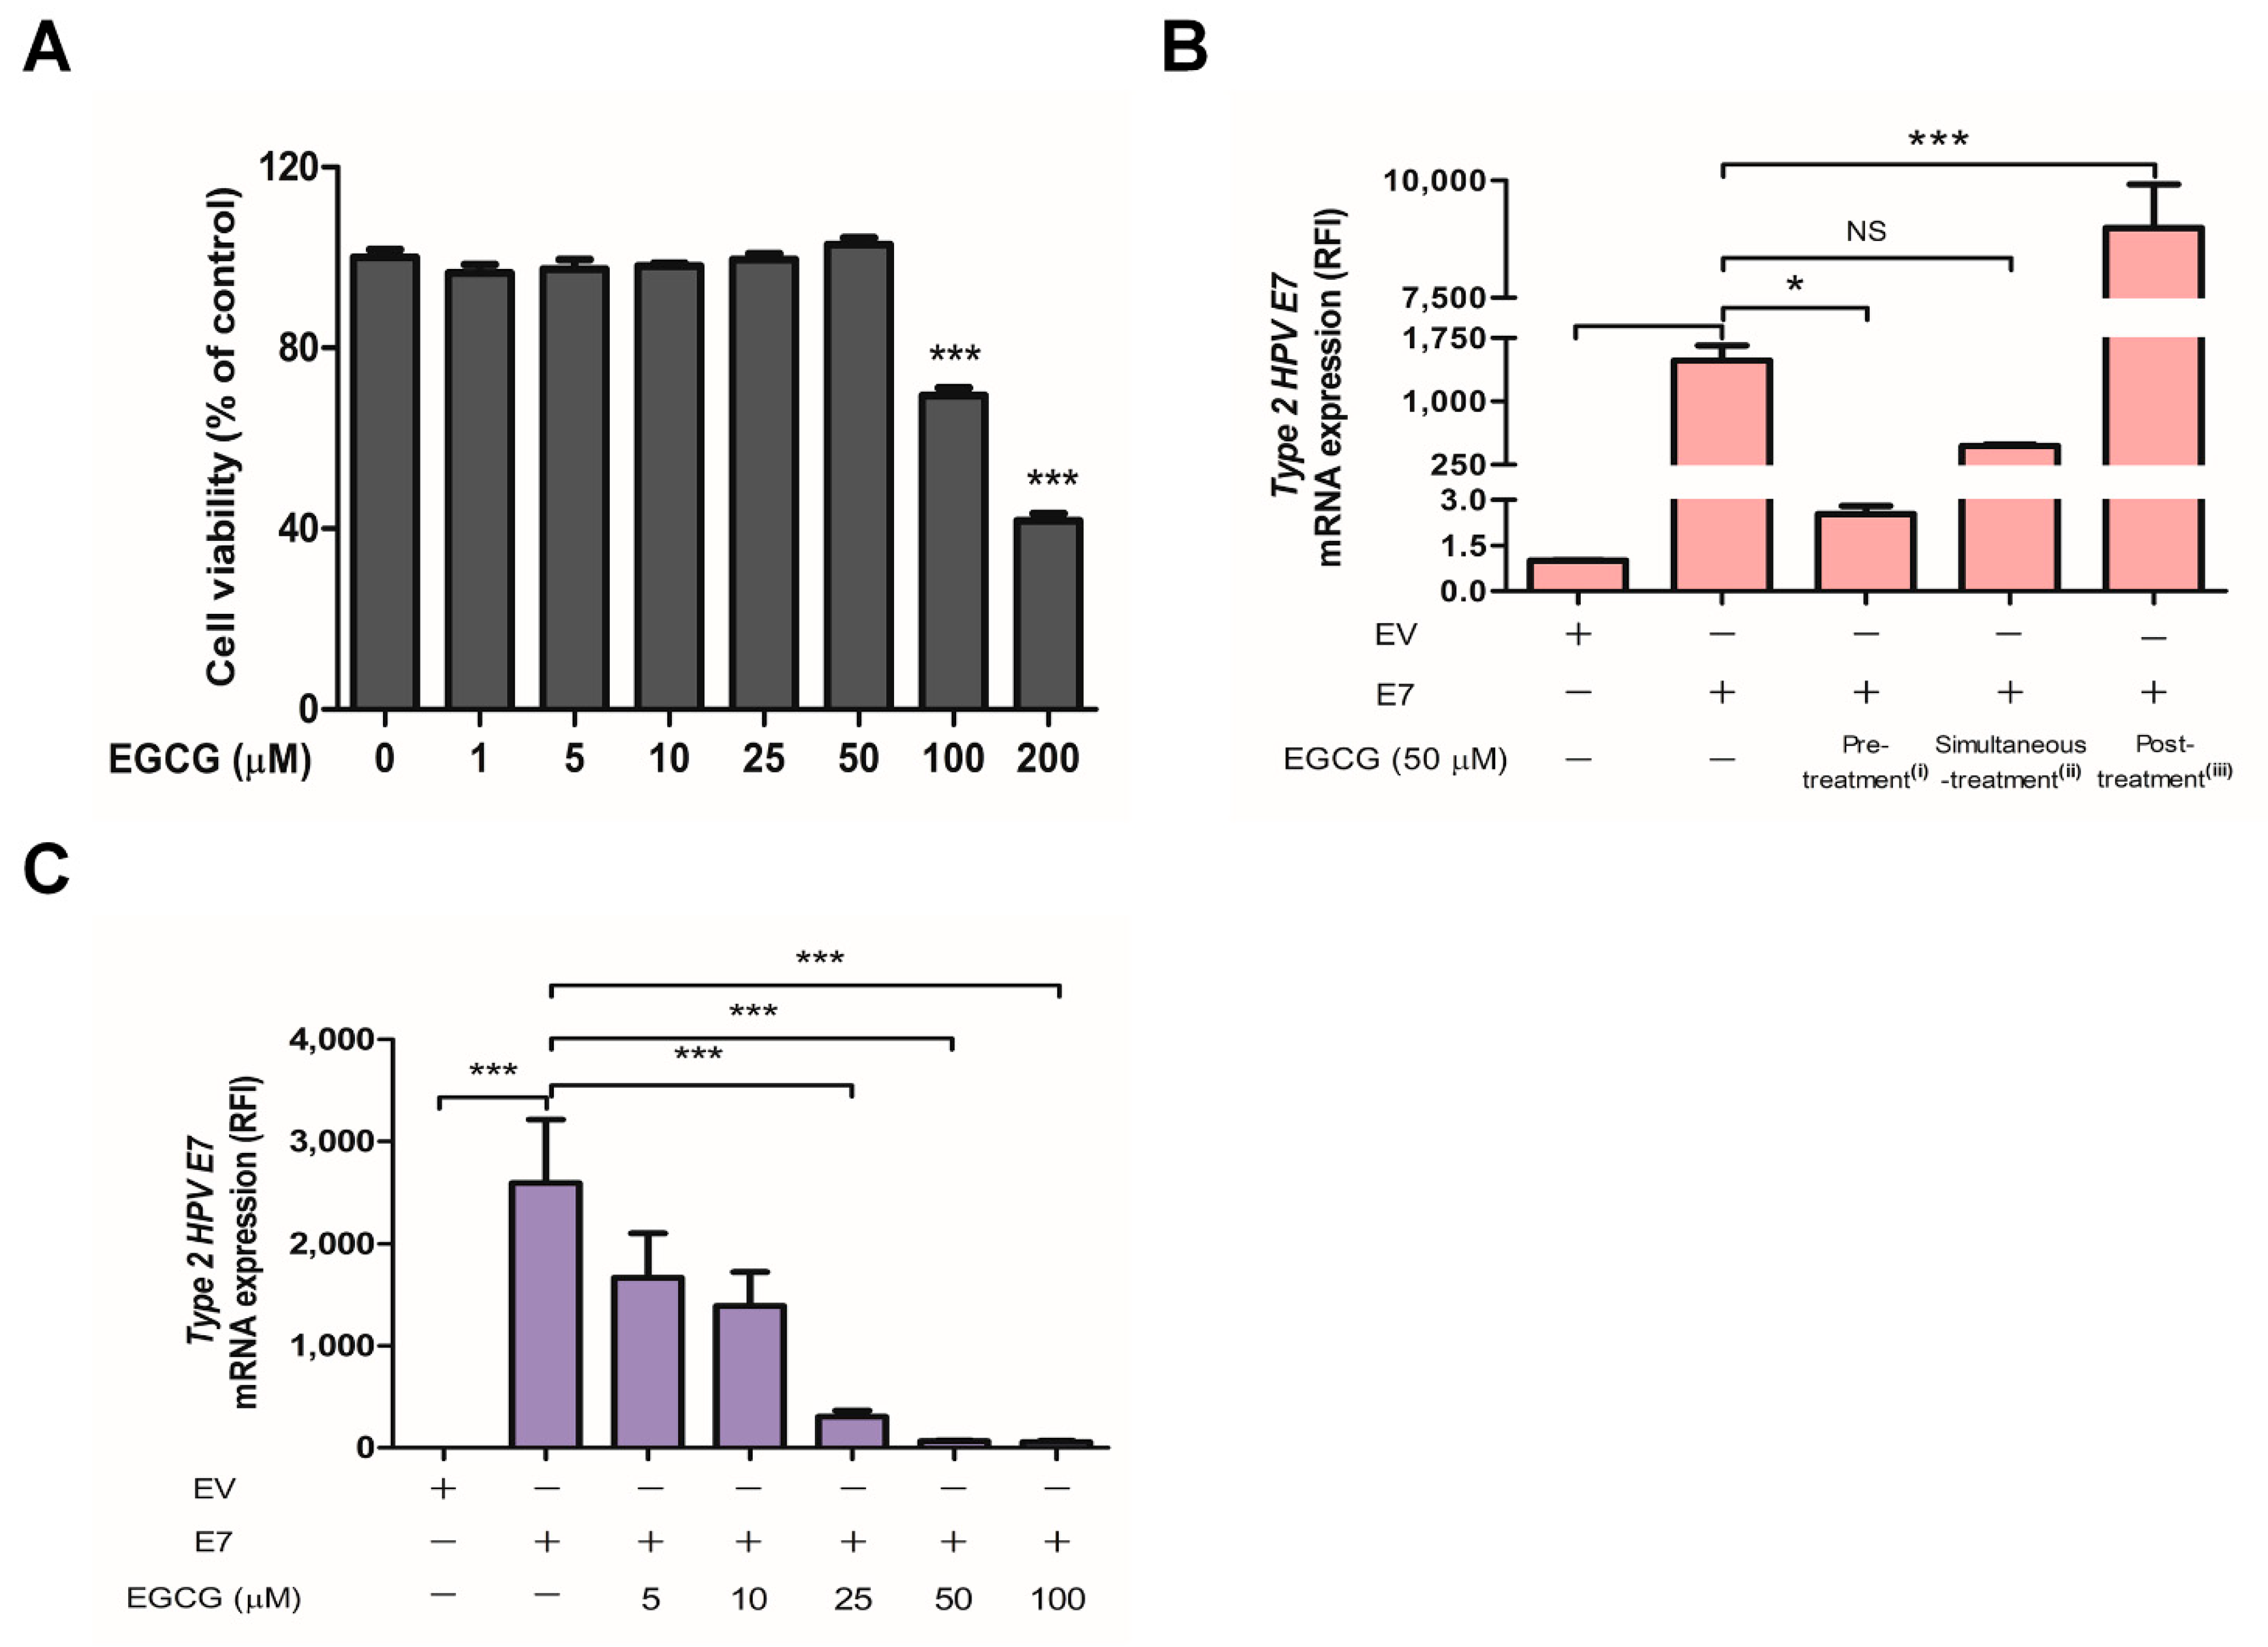
2.3. EGCG Pretreatment Inhibited HPV-2 E7 Transfection

Before testing potential antiviral effects of epigallocatechin-3-gallate (EGCG) on HPV-2 E7 transfection, we performed MTT assay to measure its toxicity for HaCaT cells at concentrations of 0–200 μM for 24 h. As shown in Figure 4A, cell toxicity of EGCG was seen at 100 and 200 μM, but not at 50 μM. To determine whether the optimal time of EGCG treatment to inhibit HPV-2 E7 transfection, 50 μM EGCG was added before, during, and after transfection, respectively. The pretreatment with EGCG was significantly decreased the E7 mRNA expression (p < 0.05), whereas addition of EGCG during or after E7 transfection did not (Figure 4B). To further evaluate the effect of EGCG pre-treatment on E7 transfection, we transfected with β-galactosidase reporter vector in cells treated with or without 50 μM EGCG. β-galactosidase reporter vector was used to monitor the transfection efficiency [22]. β-galactosidase activity was decreased by 63.5% in the EGCG-pretreated cells, but not in the untreated cells (Figure S1). These results supported that EGCG pretreatment block the E7 expression by suppressing E7 transfection efficiency. Additionally, EGCG pretreatment resulted in a dose-dependent decrease in the expression levels of HPV-2 E7 mRNA (Figure 4C).

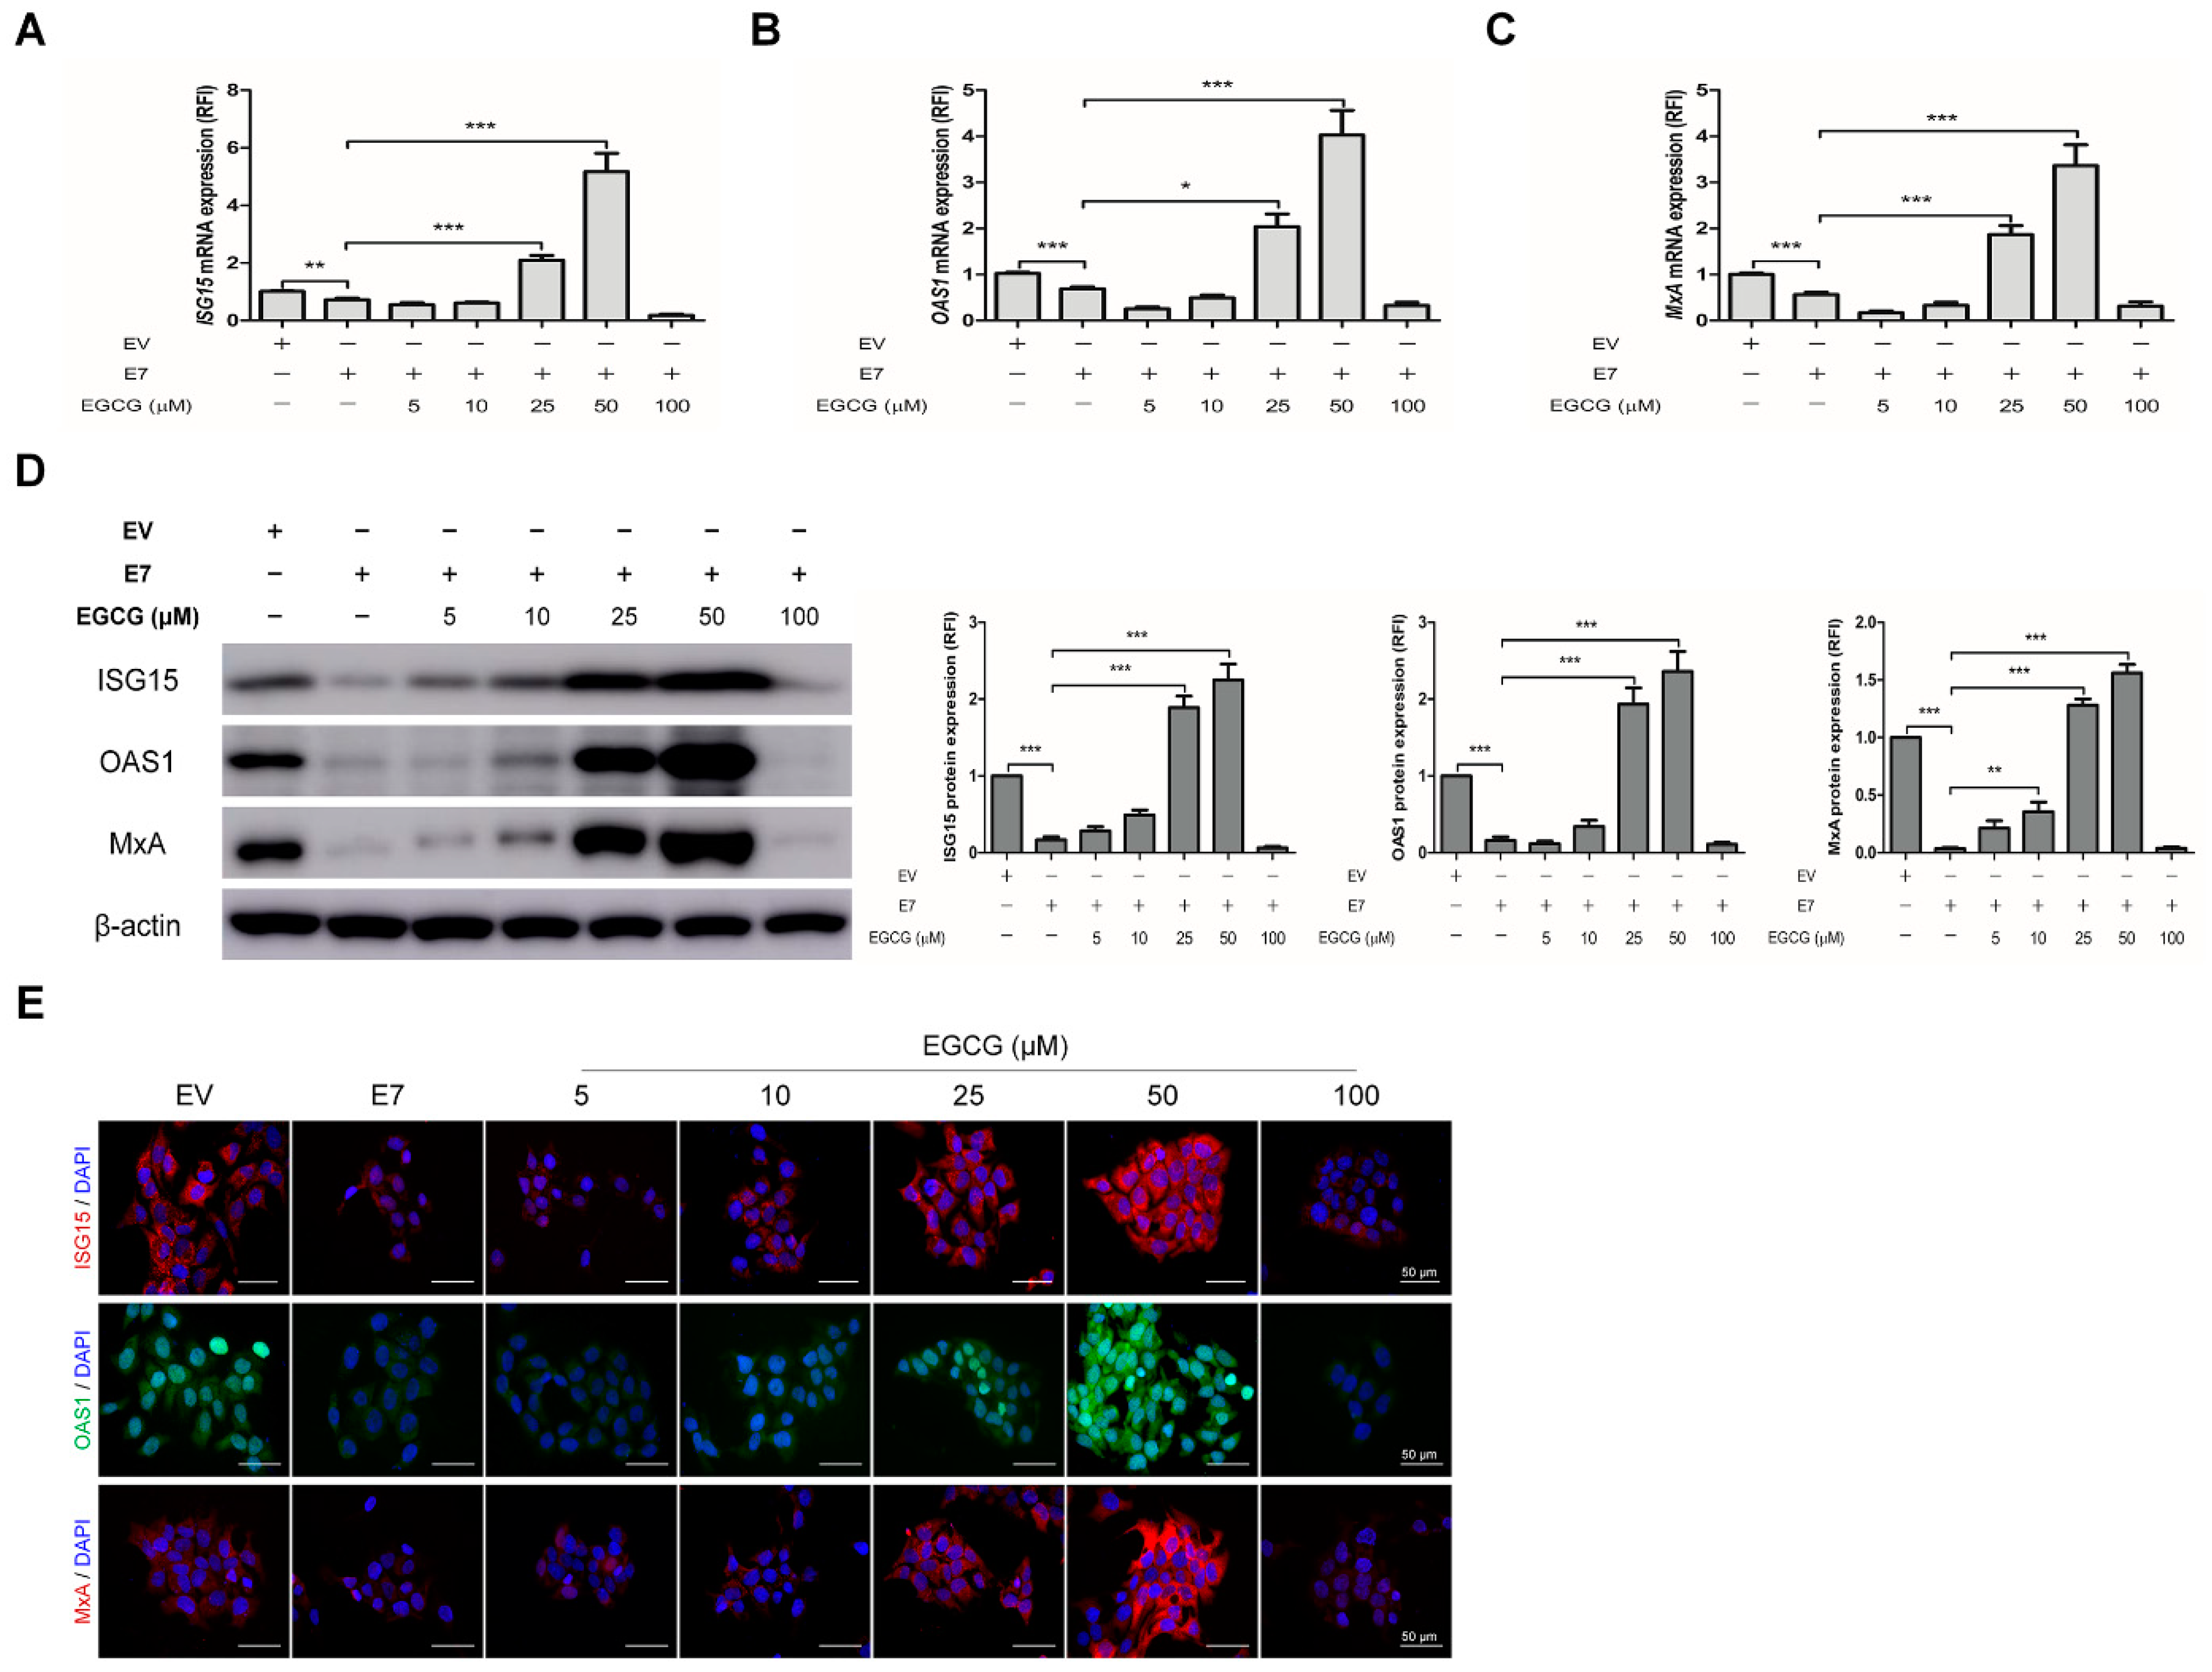
2.4. EGCG Pretreatment Sustained the Expression of Interferon-Stimulated Genes by Blocking HPV-2 E7 Expression

Finally, we examined the effects of EGCG pretreatment on the expression of ISGs in E7 transfected cells. EGCG pretreatment significantly up-regulated the mRNA expression of ISGs, which were down-regulated by E7 transfection, at the concentration of 25 and 50 μM (p < 0.05), but not at 5, 10 and 100 μM (Figure 5A–C). A dose-dependent increase in ISGs protein expressions was also seen (Figure 5D). An immunofluorescence study showed that ISGs protein levels were increased in E7 transfected cells pretreated with EGCG comparing with untreated E7 transfected cells (Figure 5E). Unexpectedly, 100 μM of EGCG pretreatment had a decreasing tendency of the mRNA and protein expression of ISGs. Thus, we performed TUNEL (terminal deoxynucleotidyl transferase dUTP nick end labeling) assay to determine whether the effect of 100 μM of EGCG pretreatment was due to cell apoptosis. The proportion of TUNEL-positive cells was around 10% in EGCG-untreated cells and 50 μM EGCG-pretreated cells, which was increased to about 30% in 100 μM EGCG-pretreated cells (Figure S2). These results supported cell apoptosis by 100 μM of EGCG pretreatment. Likewise, EGCG pretreatment significantly up-regulated not only the mRNA expressions of type I IFN signaling pathway components including IFN-α, and their receptors (IFNAR-1, 2), IRF-9, STAT-1 and STAT-2, but also the protein expression U-ISGF-3 components (including IRF-9, STAT-1, STAT-2, and tyrosine phosphorylated STAT-1), which were significantly down-regulated by E7 transfection (p < 0.05) (Figure 6). Our results demonstrate that pretreatment with EGCG can prevent HPV-2 E7 transfection, which can sustain the expression of ISGs and type I IFN signaling pathway components by blocking E7 expression.

3. Discussion

In immunohistochemical staining, the expressions of ISGs such as ISG15, OAS1, and MxA commonly declined in HPV-2 wart samples. We also performed immunohistochemistry using cutaneous wart samples with different HPV types including type 1, type 1 and 27, and type 16. The expression of ISGs was also reduced in other types of wart samples as in HPV-2 (Figure S3). Likewise, Saadeh et al. showed that MxA expression decreased in uninflamed wart samples, in which host immune surveillance does not operate [23]. Based on these results, we suggest that the inhibition of ISGs expression allows HPV to maintain viral infection in human keratinocytes.
HPV has several mechanisms that evade the immune responses of host cells to sustain the infection, one of which interrupts the type I IFN signaling pathway. Among high-risk HPV proteins, E6 and E7 proteins can interfere with the expressions of type I IFNs in host cells [24], and can directly target components of the IFN pathway in order to inhibit their action, which leads to attenuation of ISGs [25]. Quite a few previous studies demonstrated that HPV-16 and -18 (high risk) E6 and E7 proteins can block transcriptional activity of the IRF family by binding to IRF-1, IRF-3, and/or IRF-9 [14,26,27]. In a previous report, we also found that HPV-2 E7 inhibited the expressions of IRF-1 and IRF-9 [15]. From complicated interactions not yet characterized, IRFs are deregulated by HPV proteins to diminish expression of IFN-α [12], IFN-β [26,27], and IFN-κ [28]. In addition to the E6 and E7 proteins, other HPV proteins can also interfere with the type I IFN signaling pathway. For example, the E1 proteins of HPV-11, 16, and 18 suppress up-regulation of IFN-β1, IFN-λ1 and ISG [29]. HPV-16 E2 decreases stimulator of interferon genes (STING) and IFN-κ expression, and HPV-18 E2 TAD-induced IFN-κ reduction leads to the down-modulation of the ISGs, such as interferon-induced protein with tetratricopeptide repeats (IFIT)1, IFIT3, Mx1, Mx2, OAS1, OAS2, and OAS3 [30]. HPV-16 E5 proteins suppress of IFN-κ transcription and IFN-κ-driven ISG expression and maintain the complete HPV-16 genome in keratinocytes [31].
In that previous study, we demonstrated that HPV-2 E7 attenuates the expression of viperin, one of the ISGs, but that E6 has little effect. Furthermore, in our preliminary study, normal human epidermal keratinocytes (NHEK) were transfected with either E6 or E7 to determine which is mainly involved in the suppression of ISGs expression. Compared to cells transfected with empty vector, the expression of ISGs in E7 transfected cells decreased, but not in E6 transfected cells. Accordingly, in this study we focused on whether HPV-2 E7 can affect the expression of ISGs to evade antiviral immune responses, and we observed decreased ISGs expression even in HPV-2 E7 transfected HaCaT cells. Our results demonstrate that HPV-2 E7 directly targets the U-ISGF-3 complex resulting in the down-regulation of ISGs. Taken together, it is likely that the down-regulation of ISGs is important for the establishment and persistence of HPV-2 E7 transfection.
EGCG, a catechin that has preventive and/or therapeutic effects in various diseases, exhibits broad and distinguished antiviral activity [32]. With regard to antiviral activities, EGCG usually targets the early stages of infection, such as attachment, entry, and membrane fusion [33]. In the present study, we found that pretreatment with EGCG inhibited HPV-2 E7 transfection, but that posttreatment with EGCG did not. These contrasting results can be explained by differences in virus characteristics as well as EGCG treatment time.
In line with our findings, some studies have shown the effects of pretreatment with EGCG before viral infection on many viral species. Nance et al. reported that pre-incubation of EGCG for 24 h inhibits HIV-1 infectivity by preventing the attachment of HIV-1 glycoprotein 120 to the CD4 molecule [19]. Pretreatment with EGCG for 1 h prior to HCV stimulation significantly increased HCV induced IFN-λ 1, TLR3, retinoic acid-inducible gene (RIG)-I, and antiviral ISGs expression in both JFH-1-infected and -uninfected Huh7 cells [20]. When West Nile virus (WNV) was pretreated with EGCG for 1 h prior to infecting cell monolayers, EGCG significantly reduced virus yield and accumulation of intracellular viral RNA [34]. Pretreatment with EGCG for 3 h was also shown to increase antiviral mediators in the absence of influenza viral infection and also abrogate viral entry [35]. EGCG can inhibit the infectivity of a diverse group of enveloped and non-enveloped viruses by interrupting viral attachment to cell membrane receptors. The experiment was carried out by pretreating RNA or DNA virions with EGCG for 10 min or 1 h, and then infecting them into cell monolayers for 1 h [36]. In contrast, other studies have focused on the effects of posttreatment with EGCG after viral infection. In hepatitis B virus (HBV), EGCG treatment for 6 h after viral infection can inhibit the expression of HBV antigen and the synthesis of extracellular HBV DNA [37]. In HCV, EGCG treatment during inoculation inhibited HCV entry into hepatoma cell lines and primary human hepatocytes, by interrupting viral attachment to host cells [38]. Moreover, HIV also revealed that posttreatment with EGCG inhibits reverse transcriptase [39]. Based on our results, we suggest that pretreatment with EGCG is effective for preventing HPV infection, since EGCG should prevent the early stages of viral infection for immune escape.
In addition, we hypothesized that pretreatment with EGCG can sustain the expression of ISGs and type I IFN signaling pathway components because it blocks expression of HPV-2 E7 by inhibiting E7 transfection. Although from our results only, we have not been able to elucidate the exact mechanism for transcriptional inhibition of HPV E7 by EGCG, we have found several possibilities from other experimental studies. First, Berger et al. reported that EGCG inhibits the activity of topoisomerase I, which plays crucial roles in DNA replication and transcription [40]. Second, Ahn et al. reported that EGCG downregulates RNA polymerase Ⅱ, which transcribes DNA as a precursor to mRNA in CaSki cells, human cervical cancer cell line [41]. Finally, Jacob et al. reported that EGCG treatment inhibits transcription of RNA polymerase Ⅲ, which transcribes many small structural RNA molecules involved in RNA processing and translation from both gene internal (tRNA) and external (U6 snRNA) promoters [42]. Based on those reports, it might be assumed that in our study EGCG inhibited the activity of several factors that play a crucial role in the HPV E7 transcriptional mechanism.
In conclusion, our findings indicate that EGCG has the ability to bolster innate antiviral immunity against HPV-2, suggesting the potential application of EGCG as a preventive agent for cutaneous warts.

4. Materials and Methods

4.1. Tissue Samples

Cutaneous wart samples were taken from patients who had been pathologically diagnosed with common wart. We used six samples identified as HPV type 2 (HPV-2) through genotyping (Figure S4) performed by multiplex PCR [43]. As a control, normal skin samples were obtained from patients who underwent surgery in Department of Dermatology of Seoul St. Mary’s Hospital, the Catholic University of Korea. The protocol was approved by the Institutional Review Board of The Catholic University of Korea (MC20SASE0112) and performed according to the Helsinki Declaration.

4.2. Immunohistochemistry

Immunohistochemistry was performed on 5 mm thick sections obtained from 4% paraformaldehyde-fixed, paraffin wax-embedded tissue. Following dewaxing and rehydration steps, antigen retrieval was performed using citrate buffer. Sections were blocked with peroxidase blocking solution (Dako, Santa Clara, CA, USA) for 15 min. The sections were incubated with ISG15 (sc-166755, dilution of 1:100; Santa Cruz Biotechnology Inc., Dallas, TX, USA), OAS1 (ab82666, dilution of 1:100; Abcam, Cambridge, UK), and MxA (GTX110256, dilution of 1:500; GeneTex Inc. Irvine, CA, USA) overnight at 4 °C. After rinsing with phosphate-buffered saline (PBS), the sections were incubated with Dako REAL™ EnVision/HRP (Dako) at room temperature for 2 h, and were visualized with substrate-chromogen solution followed by counterstaining with Mayer’s hematoxylin (Dako). Stained tissue samples were observed using a Leica light microscope DMI 5000B (Leica, Wetzlar, Germany).

4.3. Cell Culture and Reagents

HaCaT cells, a naturally immortalized keratinocyte cell line derived from primary human epithelium, were obtained from the American Type Culture Collection (Manassas, VA, USA) and cultured in Dulbecco’s modified Eagle’s medium/high glucose (Gibco, Carlsbad, CA, USA) containing 1% penicillin/streptomycin (Gibco) and 10% fetal bovine serum (Gibco) in a humidified atmosphere containing 5% CO2 at 37 °C. Normal human epidermal keratinocytes (NHEK) from neonatal foreskin (Promocell, Heidelberg, Germany) were cultured in keratinocyte growth medium 2 with a supplement pack (Promocell) and 1% penicillin/streptomycin (Gibco). Epigallocatechin-3-gallate (EGCG) was purchased from Sigma-Aldrich (St. Louis, MO, USA). EGCG stock solution was prepared in sterile distilled water at 10 and 20 mM.

4.4. Cell Transfection

HaCaT cells were seeded (5 × 10⁴ cells/well) into six well plates and incubated overnight at 37 °C in 5% CO2. The cells were transfected with 2 μg of each DNA construct (pCMV::Δ and pCMV::2E7) and 50 nM HPV-2 E7 specific siRNA (Invitrogen, Carlsbad, CA, USA) or negative control siRNA (Invitrogen) using TransIT-X2® transfectant (Mirus, Madison, WI, USA) for 24 h according to the manufacturer’s instructions. DNA vectors were obtained from professor Soon Yong Choi (Hannam University, Daejeon, Korea).

4.5. Cell Viability Assay

HaCaT cells were seeded at a density of 1 × 10⁴ cells/well in 24 well plate. After 24 h, the medium was replaced with serum-free medium, then were treated with EGCG (1–200 μM) for 24 h, when cell viability was examined using MTT [3-(4,5-dimethylthiazol-2-yl)-2,5-diphenyl tetrazolium bromide (Sigma-Aldrich). MTT solution (100 µL, 5 mg/mL) was added to each well and incubated for 2 h at 37 °C. Then, the supernatant was aspirated, the MTT-formazan crystals by metabolically viable cells were dissolved in 400 µL of isopropanol (Merk Millipore, Burlington, MA, USA). The absorbance was measured at a wavelength of 540 nm using VersaMax microplate reader (Molecular Devices, San Jose, CA, USA).

4.6. EGCG Treatment

HaCaT cells were seeded at a density of 5 × 10⁴ per well in six well plates. After being cultured for 24 h, the medium was replaced with serum-free medium. After starvation, the cells were pre-treated with EGCG (5–100 μM) for 2 h prior to transfection. For the EGCG treatment optimal time experiment, the cells were treated with 50 μM EGCG (i) for 2 h before transfection, (ii) for 24 h after transfection, or (iii) for 24 h during transfection. The negative control cells were incubated with sterile distilled water used as EGCG solvent for equal to EGCG treatment time.

4.7. β-Galactosidase Assay

NHEK cells were seeded (1 × 10⁵ cells/well) into 6 well plates and were pretreated with 50 μM of EGCG for 2 h prior to transfection. Untreated cells were incubated with the same amount of sterile distilled water used as EGCG solvent for the same treatment time. Subsequently, the cells were co-transfected with empty vector or E7 with pCMV-βgal-R1 vector using TransIT-X2® transfectant (Mirus) for 24 h according to the manufacturer’s instructions. After transfection, cells were lysed with 5X reporter lysis buffer (Promega, Madison, WI, USA) and then used for assays. β-galactosidase assay was used to β-galactosidase enzyme assay system with reporter lysis buffer (E2000; Promega) according to the manufacturer’s instructions. The absorbance was measured at a wavelength of 420 nm using VersaMax microplate reader (Molecular Devices).

4.8. Quantitative Real-Time Polymerase Chain Reaction (RT-qPCR)

Total RNAs were isolated using Trizol® reagent (Invitrogen) according to the manufacturer’s protocol. Equal amounts of RNA (1 μg) were reverse transcribed into cDNA using ReverTra Ace® qPCR RT Master Mix with gDNA Remover (ToYoBo, Osaka, Japan) according to the manufacturer’s instructions. RT-qPCR was performed using a CFX96™ Real-Time PCR Detection System® (Bio-Rad, Hercules, CA, USA) with MG 2X qPCR MasterMix Ⅱ (SYBR Green) (MGmed, Seoul, Korea) and specific primers. Conditions of the RT-qPCR reaction consisted of an initialization step for 10 s at 95 °C followed by two-step PCR for 45 cycles of 95 °C for 5 s (denaturation) and 58–60 °C for 30 s (annealing/extension). Results were normalized to the level of glyceraldehyde 3-phosphate dehydrogenase (GAPDH) gene expression. The analysis of relative gene expression data was conducted using the 2−ΔΔCT method [44]. The primer sequences are listed in Table 1.

4.9. Western Blot

Cells were lysed in RIPA Lysis and Extraction Buffer (Thermo Scientific, Rockford, IL, USA) containing protease and phosphatase inhibitor cocktail (Thermo Scientific). Equal amounts (20 μg) of extracted protein were separated by 10–15% SDS-PAGE gel and transferred to polyvinylidene fluoride membranes (Merk Millipore). The membranes were blocked with 5% Bovine serum albumin (BSA)/Tris buffered saline with 0.1% of Tween 20 (TBS-T) for 1 h at room temperature and then incubated with indicated primary antibodies in 5% BSA/TBS-T overnight at 4 °C. The following primary antibodies were used in the procedures: mouse monoclonal anti-ISG15 (1:200, sc-166755), IRF-9 (1:100, sc-365893), and β-actin (1:2500, sc-47778; Santa Cruz Biotechnology), rabbit polyclonal anti-OAS1 (1:500, ab82666) and rabbit monoclonal anti-MxA (1:1000, ab207414; Abcam), rabbit monoclonal anti-STAT-1 (1:1000, #14994), Phospho-STAT1 (Tyr701) (1:1000, #9167), and STAT-2 (1:1000, #72604; Cell Signaling Technology, Danvers, MA, USA). The blot membranes were washed out in TBS-T four times and were incubated with horseradish peroxidase-conjugated Goat anti-Mouse or Rabbit IgG secondary antibodies (GTX213111-01 or GTX213110-01, GeneTex) for 2 h at room temperature. After four times washes with TBS-T, bands were visualized by ECL substrate (Thermo Scientific) with Amersham™ Imager 600 (GE Healthcare, Chicago, IL, USA). All observed band intensity was quantified using Image J software (NIH, Bethesda, MD, USA).

4.10. Immunofluorescence

For immunofluorescence analyses, HaCaT cells were seeded on eight well chamber slides at 2 × 10³ cells/well. After transfection, cells were fixed with 4% paraformaldehyde for 15 min, followed by PBS washes. Cells were then permeabilized at −20 °C for 10 min using ice-cold methanol and then blocked with 1% BSA in 1X PBS for 1 h. After blocking, cells were incubated with ISG15 (sc-166755, dilution of 1:50; Santa Cruz Biotechnology), OAS1 (ab82666, dilution of 1:100; Abcam), and MxA (ab207414, dilution of 1:250; Abcam) overnight at 4 °C. Following washes with PBS, cells were incubated with Alexa Fluor® 594 Goat Anti-Mouse IgG (A-11005, Invitrogen), Alexa Fluor® 488 Goat Anti-Rabbit IgG (A-11008, Invitrogen), and Alexa Fluor® 594 Goat Anti-Rabbit IgG (A-11037, Invitrogen) secondary antibodies (each at a 1:400 dilution) for 2 h at room temperature in the dark. After four times washes with PBS, cover slips were mounted with Vectashield Antifade Mounting Medium (Vector Laboratories, Burlingame, CA, USA) containing 4′,6-diamidino-2-phenylindole (DAPI), to counterstain cellular nuclei. Images were obtained by a fluorescence microscope (Axiovert 200, Zeiss, Oberkochen, Germany).

4.11. TUNEL Assay

HaCaT cells were seeded in four well chamber slides at 1.5 × 10⁴ cells/well. After being cultured for 24 h, the medium was replaced with serum-free medium. After starvation, the cells were pretreated with EGCG at 50 and 100 μM or sterile distilled water as a control for 2 h before transfection. The pretreated cells were transfected with empty vector or HPV-2 E7. Cell apoptosis was examined with the In Situ Cell Death Detection Kit, Fluorescein (Roche, Mannheim, Germany) according to the manufacturer’s instructions. The cells were fixed, washed with PBS, and permeabilized with 0.1% Triton X-100 solution in 0.1% sodium citrate. After further washing in PBS, the cells were labelled for DNA breaks with terminal deoxynucleotidyl transferase (TdT) dUTP fluorescein nick end labeling (TUNEL, green fluorescence) reaction mixture. After three washes with PBS, cover slips were mounted with Vectashield Antifade Mounting Medium (Vector Laboratories) containing DAPI, to counterstain cellular nuclei. The apoptotic cells were observed under Axiovert 200 (Zeiss) and counted at magnification ×400. The proportion of apoptotic cells was calculated by counting the TUNEL-positive cells and by dividing this number by the total number of cells and then multiplying by 100%, in a minimum of five microscopic fields.

4.12. Statistical Analysis

All data were representative data from at least three independent experiments. Statistical analysis was performed via one-way analysis of variance (ANOVA) followed by Tukey’s multiple comparison test. Unpaired t-tests were used for comparisons of the two groups. All data are expressed as the mean ± standard error of the mean (SEM). All graphs were generated using GraphPad Prism 5 (La Jolla, CA, USA). Statistical significance was considered when p value was less than 0.05 (*, p < 0.05; **, p < 0.01; and ***, p < 0.001).

Supplementary Materials

The following are available online at https://www.mdpi.com/1422-0067/22/5/2418/s1, Figure S1: Assessment of transfection efficiency upon EGCG pre-treatment. Figure S2: Measurement of TUNEL positive cells upon EGCG pre-treatment. Figure S3: Expression of interferon-stimulated genes in cutaneous warts with different HPV types. Figure S4: Result of multiplex PCR with cutaneous wart samples.

Author Contributions

Conceptualization, J.Y.S., J.H.L. and Y.M.P.; formal analysis, J.Y.S., J.H.H., Y.S. and S.Y.C.; investigation, J.Y.S.; resources, J.H.H., Y.S. and S.Y.C.; data curation, J.Y.S. and Y.M.P.; writing—original draft preparation, J.Y.S. and Y.M.P.; writing—review and editing, Y.M.P.; supervision, S.Y.C. and J.H.L.; project administration, Y.M.P. All authors have read and agreed to the published version of the manuscript.

Funding

This research received no external funding.

Institutional Review Board Statement

The study was conducted according to the guidelines of the Declaration of Helsinki, and approved by the Institutional Review Board of The Catholic University of Korea (protocol code: MC20SASE0112. Date of approval: 8 October 2020).

Informed Consent Statement

In accordance with Article 2 of the Supplementary Regulations of the Bioethics and Safety Act, which has been in force since February 2013 in Republic of Korea, the patient consent was waived because human materials used in this study were already collected prior to the enforcement of the law.

Data Availability Statement

The data presented in this study are available in the article.

Conflicts of Interest

The authors declare no conflict of interest.

Abbreviations

EGCGEpigallocatechin-3-gallate
EVEmpty vector
HPVHuman Papillomavirus
IFNInterferon
IRF-9Interferon regulatory factors-9
ISGInterferon-stimulated gene
ISGF-3Interferon-stimulated gene factor-3
ISG15Interferon-stimulated gene 15
MxAMyxovirus-resistance protein A
OAS12’-5’-oligoadenylate synthetase 1
STATSignal Transducer and Activator of Transcription

References

  1. Woodby, B.; Scott, M.; Bodily, J. Chapter Five—The Interaction Between Human Papillomaviruses and the Stromal Microenvironment. In Progress in Molecular Biology and Translational Science; Pruitt, K., Ed.; Academic Press: Cambridge, MA, USA, 2016; Volume 144, pp. 169–238. [Google Scholar] [CrossRef] [Green Version]
  2. Hausen, H.Z. Papillomaviruses and cancer: From basic studies to clinical application. Nat. Rev. Cancer 2002, 2, 342–350. [Google Scholar] [CrossRef] [PubMed]
  3. Amador-Molina, A.; Hernández-Valencia, J.F.; Lamoyi, E.; Contreras-Paredes, A.; Lizano, M. Role of Innate Immunity against Human Papillomavirus (HPV) Infections and Effect of Adjuvants in Promoting Specific Immune Response. Viruses 2013, 5, 2624–2642. [Google Scholar] [CrossRef] [Green Version]
  4. Hong, S.; Laimins, L.A. Manipulation of the innate immune response by human papillomaviruses. Virus Res. 2017, 231, 34–40. [Google Scholar] [CrossRef] [PubMed] [Green Version]
  5. Kanodia, L.M.F.A.W.M.K.S.; Fahey, L.M.; Kast, W.M. Mechanisms Used by Human Papillomaviruses to Escape the Host Immune Response. Curr. Cancer Drug Targets 2007, 7, 79–89. [Google Scholar] [CrossRef]
  6. Le Bon, A.; Tough, D.F. Links between innate and adaptive immunity via type I interferon. Curr. Opin. Immunol. 2002, 14, 432–436. [Google Scholar] [CrossRef]
  7. Fensterl, V.; Chattopadhyay, S.; Sen, G.C. No Love Lost Between Viruses and Interferons. Annu. Rev. Virol. 2015, 2, 549–572. [Google Scholar] [CrossRef] [PubMed]
  8. Schneider, W.M.; Chevillotte, M.D.; Rice, C.M. Interferon-Stimulated Genes: A Complex Web of Host Defenses. Annu. Rev. Immunol. 2014, 32, 513–545. [Google Scholar] [CrossRef] [Green Version]
  9. Randall, R.E.; Goodbourn, S. Interferons and viruses: An interplay between induction, signalling, antiviral responses and virus countermeasures. J. Gen. Virol. 2008, 89, 1–47. [Google Scholar] [CrossRef]
  10. Evans, M.R.; James, C.D.; Bristol, M.L.; Nulton, T.J.; Wang, X.; Kaur, N.; White, E.A.; Windle, B.; Morgan, I.M. Human Papillomavirus 16 E2 Regulates Keratinocyte Gene Expression Relevant to Cancer and the Viral Life Cycle. J. Virol. 2018, 93. [Google Scholar] [CrossRef] [Green Version]
  11. Sadler, A.J.; Williams, B.R.G. Interferon-inducible antiviral effectors. Nat. Rev. Immunol. 2008, 8, 559–568. [Google Scholar] [CrossRef]
  12. Chang, Y.E.; Laimins, L.A. Microarray Analysis Identifies Interferon-Inducible Genes and Stat-1 as Major Transcriptional Targets of Human Papillomavirus Type 31. J. Virol. 2000, 74, 4174–4182. [Google Scholar] [CrossRef] [PubMed] [Green Version]
  13. Li, S.; Labrecque, S.; Gauzzi, M.C.; Cuddihy, A.R.; Wong, A.H.; Pellegrini, S.; Matlashewski, G.J.; Koromilas, A.E. The human papilloma virus (HPV)-18 E6 oncoprotein physically associates with Tyk2 and impairs Jak-STAT activation by interferon-α. Oncogene 1999, 18, 5727–5737. [Google Scholar] [CrossRef] [PubMed] [Green Version]
  14. Barnard, P.; McMillan, N.A. The Human Papillomavirus E7 Oncoprotein Abrogates Signaling Mediated by Interferon-α. Virology 1999, 259, 305–313. [Google Scholar] [CrossRef] [PubMed] [Green Version]
  15. Lee, H.S.; Lee, J.H.; Park, Y.M. E7 protein of cutaneous human papillomavirus attenuates viperin expression in human keratinocytes. J. Dermatol. Sci. 2017, 87, 91–94. [Google Scholar] [CrossRef] [Green Version]
  16. Lambert, J.D.; Yang, C.S. Mechanisms of Cancer Prevention by Tea Constituents. J. Nutr. 2003, 133, 3262S–3267S. [Google Scholar] [CrossRef]
  17. Cabrera, C.; Artacho, R.; Giménez, R. Beneficial Effects of Green Tea—A Review. J. Am. Coll. Nutr. 2006, 25, 79–99. [Google Scholar] [CrossRef]
  18. Sun, Y.; Li, X.; Song, S.; Wang, Y.; Gu, H. Integrity of a HPV11 infection cell model and identification of (-)-Epigallocatechin-3-gallate as a potential HPV11 inhibitor. Oncotarget 2016, 7, 37092–37102. [Google Scholar] [CrossRef] [Green Version]
  19. Nance, C.L.; Siwak, E.B.; Shearer, W.T. Preclinical development of the green tea catechin, epigallocatechin gallate, as an HIV-1 therapy. J. Allergy Clin. Immunol. 2009, 123, 459–465. [Google Scholar] [CrossRef] [Green Version]
  20. Wang, Y.; Li, J.; Wang, X.; Peña, J.C.; Li, K.; Zhang, T.; Ho, W. (−)-Epigallocatechin-3-Gallate Enhances Hepatitis C Virus Double-Stranded RNA Intermediates-Triggered Innate Immune Responses in Hepatocytes. Sci. Rep. 2016, 6, 21595. [Google Scholar] [CrossRef] [Green Version]
  21. Fujiki, H.; Watanabe, T.; Sueoka, E.; Rawangkan, A.; Suganuma, M. Cancer Prevention with Green Tea and Its Principal Constituent, EGCG: From Early Investigations to Current Focus on Human Cancer Stem Cells. Mol. Cells 2018, 41, 73–82. [Google Scholar]
  22. Howcroft, T.; Kirshner, S.L.; Singer, D.S. Measure of Transient Transfection Efficiency Using β-Galactosidase Protein. Anal. Biochem. 1997, 244, 22–27. [Google Scholar] [CrossRef] [PubMed]
  23. Saadeh, D.; Kurban, M.; Abbas, O. Plasmacytoid dendritic cells and type I interferon in the immunological response against warts. Clin. Exp. Dermatol. 2017, 42, 857–862. [Google Scholar] [CrossRef] [PubMed]
  24. Yang, X.; Cheng, Y.; Li, C. The role of TLRs in cervical cancer with HPV infection: A review. Signal Transduct. Target. Ther. 2017, 2, 17055. [Google Scholar] [CrossRef] [Green Version]
  25. Beglin, M.; Melar-New, M.; Laimins, L. Human Papillomaviruses and the Interferon Response. J. Interf. Cytokine Res. 2009, 29, 629–635. [Google Scholar] [CrossRef] [PubMed]
  26. Ronco, L.V.; Karpova, A.Y.; Vidal, M.; Howley, P.M. Human papillomavirus 16 E6 oncoprotein binds to interferon regulatory factor-3 and inhibits its transcriptional activity. Genes Dev. 1998, 12, 2061–2072. [Google Scholar] [CrossRef] [PubMed] [Green Version]
  27. Park, J.-S.; Kim, E.-J.; Kwon, H.-J.; Hwang, E.-S.; Namkoong, S.-E.; Um, S.-J. Inactivation of Interferon Regulatory Factor-1 Tumor Suppressor Protein by HPV E7 Oncoprotein. J. Biol. Chem. 2000, 275, 6764–6769. [Google Scholar] [CrossRef] [PubMed] [Green Version]
  28. Rincon-Orozco, B.; Halec, G.; Rosenberger, S.; Muschik, D.; Nindl, I.; Bachmann, A.; Ritter, T.M.; Dondog, B.; Ly, R.; Bosch, F.X.; et al. Epigenetic Silencing of Interferon- in Human Papillomavirus Type 16-Positive Cells. Cancer Res. 2009, 69, 8718–8725. [Google Scholar] [CrossRef] [Green Version]
  29. Castro-Muñoz, L.J.; Manzo-Merino, J.; Muñoz-Bello, J.O.; Olmedo-Nieva, L.; Cedro-Tanda, A.; Alfaro-Ruiz, L.A.; Hidalgo-Miranda, A.; Madrid-Marina, V.; Lizano, M. The Human Papillomavirus (HPV) E1 protein regulates the expression of cellular genes involved in immune response. Sci. Rep. 2019, 9, 1–13. [Google Scholar] [CrossRef]
  30. Sunthamala, N.; Thierry, F.; Teissier, S.; Pientong, C.; Kongyingyoes, B.; Tangsiriwatthana, T.; Sangkomkamhang, U.; Ekalaksananan, T. E2 Proteins of High Risk Human Papillomaviruses Down-Modulate STING and IFN-κ Transcription in Keratinocytes. PLoS ONE 2014, 9, e91473. [Google Scholar] [CrossRef]
  31. Scott, M.L.; Woodby, B.L.; Ulicny, J.; Raikhy, G.; Orr, A.W.; Songock, W.K.; Bodily, J.M. Human Papillomavirus 16 E5 Inhibits Interferon Signaling and Supports Episomal Viral Maintenance. J. Virol. 2020, 94, e01582-19. [Google Scholar] [CrossRef]
  32. Xu, J.; Xu, Z.; Zheng, W. A Review of the Antiviral Role of Green Tea Catechins. Molecules 2017, 22, 1337. [Google Scholar] [CrossRef] [Green Version]
  33. Kaihatsu, K.; Yamabe, M.; Ebara, Y. Antiviral Mechanism of Action of Epigallocatechin-3-O-gallate and Its Fatty Acid Esters. Molecules 2018, 23, 2475. [Google Scholar] [CrossRef] [Green Version]
  34. Vázquez-Calvo, Á.; De Oya, N.J.; Martín-Acebes, M.A.; Garcia-Moruno, E.; Saiz, J.-C. Antiviral Properties of the Natural Polyphenols Delphinidin and Epigallocatechin Gallate against the Flaviviruses West Nile Virus, Zika Virus, and Dengue Virus. Front. Microbiol. 2017, 8, 1314. [Google Scholar] [CrossRef]
  35. Kesic, M.J.; Simmons, S.O.; Bauer, R.; Jaspers, I. Nrf2 expression modifies influenza A entry and replication in nasal epithelial cells. Free. Radic. Biol. Med. 2011, 51, 444–453. [Google Scholar] [CrossRef] [PubMed]
  36. Colpitts, C.C.; Schang, L.M. A Small Molecule Inhibits Virion Attachment to Heparan Sulfate- or Sialic Acid-Containing Glycans. J. Virol. 2014, 88, 7806–7817. [Google Scholar] [CrossRef] [PubMed] [Green Version]
  37. Xu, J.; Gu, W.; Li, C.; Li, X.; Xing, G.; Li, Y.; Song, Y.; Zheng, W. Epigallocatechin gallate inhibits hepatitis B virus via farnesoid X receptor alpha. J. Nat. Med. 2016, 70, 584–591. [Google Scholar] [CrossRef] [PubMed]
  38. Ciesek, S.; Von Hahn, T.; Colpitts, C.C.; Schang, L.M.; Friesland, M.; Steinmann, J.; Manns, M.P.; Ott, M.; Wedemeyer, H.; Meuleman, P.; et al. The green tea polyphenol, epigallocatechin-3-gallate, inhibits hepatitis C virus entry. Hepatology 2011, 54, 1947–1955. [Google Scholar] [CrossRef] [PubMed]
  39. Li, S.; Hattori, T.; Kodama, E.N. Epigallocatechin Gallate Inhibits the HIV Reverse Transcription Step. Antivir. Chem. Chemother. 2011, 21, 239–243. [Google Scholar] [CrossRef] [Green Version]
  40. Berger, S.J.; Guptab, S.; Belfi, C.A.; Gosky, D.M.; Mukhtarb, H. Green Tea Constituent (−)-Epigallocatechin-3-gallate Inhibits Topoisomerase I Activity in Human Colon Carcinoma Cells. Biochem. Biophys. Res. Commun. 2001, 288, 101–105. [Google Scholar] [CrossRef]
  41. Ahn, W.S.; Huh, S.W.; Bae, S.-M.; Lee, I.P.; Lee, J.M.; Namkoong, S.E.; Kim, C.K.; Sin, J.-I. A Major Constituent of Green Tea, EGCG, Inhibits the Growth of a Human Cervical Cancer Cell Line, CaSki Cells, through Apoptosis, G1 Arrest, and Regulation of Gene Expression. DNA Cell Biol. 2003, 22, 217–224. [Google Scholar] [CrossRef]
  42. Jacob, J.; Cabarcas, S.; Veras, I.; Zaveri, N.; Schramm, L. The green tea component EGCG inhibits RNA polymerase III transcription. Biochem. Biophys. Res. Commun. 2007, 360, 778–783. [Google Scholar] [CrossRef] [PubMed] [Green Version]
  43. Choi, S.-Y.; Lim, J.-H.; Kim, E.-J.; Kim, H.-S.; Kim, B.-J.; Kang, H.; Park, Y.-M. Detection and Typing of Human Papillomavirus in Cutaneous Common Warts by Multiplex Polymerase Chain Reaction. J. Life Sci. 2011, 21, 947–952. [Google Scholar] [CrossRef] [Green Version]
  44. Livak, K.J.; Schmittgen, T.D. Analysis of relative gene expression data using real-time quantitative PCR and the 2−ΔΔCT Method. Methods 2001, 25, 402–408. [Google Scholar] [CrossRef] [PubMed]
Figure 1. Expressions of interferon-stimulated genes in cutaneous wart samples. (A) Representatively image of hematoxylin and eosin staining (H&E) and immunohistochemical staining for interferon-stimulated gene 15 (ISG15), 2′-5′-oligoadenylate synthetase 1 (OAS1), and myxovirus-resistant protein A (MxA) in wart and normal skin samples. Original magnification = 200×, scale bar = 100 μm. (B) RT-qPCR analysis of interferon-stimulated genes in wart and normal skin samples. Number of wart samples = 6, number of normal skin samples = 5. The relative mRNA levels were normalized to that of GAPDH. The results are expressed as means ± SEM of three independent experiments. ** p < 0.01, *** p < 0.001 compared with normal skin.
Ijms 22 02418 g001
Figure 2. Effect of HPV-2 E7 transfection on the expressions of interferon-stimulated genes. HaCaT cells were transfected with empty vector, E7, E7 specific siRNA, and negative control siRNA (siCon). After transfection, mRNA expression levels of ISG15 (A), OAS1 (B), and MxA (C) were analyzed by RT-qPCR. The relative mRNA levels were normalized against levels of GAPDH. (D) Protein expression levels of ISG15, OAS1, and MxA were evaluated by western blot. The histogram shows quantitative representation of the protein levels of ISG15, OAS1, and MxA obtained from a densitometric analysis. β-actin served as a loading control for protein normalization. The data are shown as the means ± SEM of at least three independent experiments. ** p < 0.01, *** p < 0.001 compared with empty vector or E7. NS, non-significant.
Ijms 22 02418 g002
Figure 3. Effect of HPV-2 E7 transfection on the expressions of type I interferon signaling pathway components. HaCaT cells were transfected with empty vector, E7, E7 specific siRNA, and negative control siRNA. (AG) The mRNA expression levels of type I interferon (IFN) signaling pathway components, including IFN-α, and their receptors (IFNAR-1, 2), interferon regulatory factor-9 (IRF-9), signal transducer and activator of transcription (STAT)-1, and STAT-2 were measured by RT-qPCR. The relative mRNA levels were normalized against levels of GAPDH. (H) The protein levels of IRF-9, STAT-1, STAT-2, and tyrosine phosphorylation STAT-1 were measured using western blot analysis. The histogram shows quantitative representation of the protein levels of unphosphorylated-ISGF-3 components obtained from a densitometric analysis. β-actin served as a loading control for protein normalization. The results are expressed as the mean ± SEM of three independent experiments. * p < 0.05, ** p < 0.01, *** p < 0.001 compared with empty vector or E7. NS, non-significant.
Ijms 22 02418 g003
Figure 4. Effect of EGCG treatment against HPV-2 E7 transfection. (A) EGCG toxicity in HaCaT cells. Cells were cultured in serum-free DMEM for 24 h, and then treated with EGCG at the indicated concentrations for 24 h. Cell viability was measured using MTT assay and expressed as a percentage of the value for untreated cells. The results are the mean ± SEM for three independent experiments. *** p < 0.001 compared with untreated cells. (B) HaCaT cells were incubated (i) with 50 μM EGCG for 2 h before HPV-2 E7 transfection, then removed and performed transfection (Pre-treatment), (ii) with 50 μM EGCG for 24 h during transfection, then the EGCG and HPV-2 E7 were removed (Simultaneous-treatment), or (iii) with 50 μM EGCG for 24 h after HPV-2 E7 transfection and removal, then the EGCG was removed (Post-treatment). RNA was extracted from cells of the three groups and HPV-2 E7 mRNA levels measured and expressed as a relative fold increase on the EGCG untreated controls. (C) HaCaT cells were treated with the indicated concentrations of EGCG for 2 h prior to E7 transfection. After transfection, total RNA extracted from cells was subjected to RT-qPCR for mRNA levels of HPV-2 E7. The relative mRNA levels were normalized against levels of GAPDH. The results are the mean ± SEM for three independent experiments. * p < 0.05, *** p < 0.001 compared with empty vector or E7. NS, non-significant.
Ijms 22 02418 g004
Figure 5. Effect of EGCG pretreatment on the expressions of interferon-stimulated genes in HPV-2 E7 transfected cells. HaCaT cells were pretreated with EGCG at the indicated concentrations for 2 h before transfection, then the pretreated cells were transfected with empty vector or HPV-2 E7. (AC) Total RNA extracted from cells after 24 h transfection was subjected to the RT-qPCR for the mRNA levels of ISG15 (A), OAS1 (B), and MxA (C). The data are expressed target mRNA levels relative fold to the empty vector. The relative mRNA levels were normalized against levels of GAPDH. (D) Cell lysates were collected for western blot to measure the ISG15, OAS1, and MxA expressions in cells pretreated with EGCG. The graph indicates quantitative representation of the protein levels of ISG15, OAS1, and MxA obtained from a densitometric analysis. β-actin served as a loading control for protein normalization. The results are expressed as the mean ± SEM of three independent experiments. * p < 0.05, ** p < 0.01, *** p < 0.001 compared with empty vector or E7. (E) Representatively image of immunofluorescent staining of ISG15 and MxA (red), OAS1 (green) in pretreated cell with EGCG. DAPI (blue) was used to counterstain nuclei. Images by fluorescent microscope with 400× magnification, scale bars = 50 μm.
Ijms 22 02418 g005
Figure 6. Effect of EGCG pretreatment on the expressions of type I interferon signaling pathway components in HPV-2 E7 transfected cells. HaCaT cells were treated with EGCG at the indicated concentrations for 2 h prior to E7 transfection. Following pretreatment with EGCG, the cells were transfected with empty vector or HPV-2 E7. (AG) Total RNA extracted from cells after 24 h transfection was subjected to the RT-qPCR for the mRNA levels of IFN-α (A), IFN-β (B), IFNAR-1 (C), IFNAR-2 (D), IRF-9 (E), STAT-1 (F), and STAT-2 (G). The relative mRNA levels were normalized against levels of GAPDH. (H) The protein levels of IRF-9, STAT-1, STAT-2, and tyrosine phosphorylation STAT-1 were measured using western blot analysis. The graph indicates quantitative representation of the protein levels of U-ISGF-3 components obtained from a densitometric analysis. β-actin served as a loading control for protein normalization. The results are expressed as the mean ± SEM of three independent experiments. * p < 0.05, ** p < 0.01, *** p < 0.001 compared with empty vector or E7.
Ijms 22 02418 g006
Table 1. Primers sequences for RT-qPCR amplifications.
Target Sequence (5′ – 3′)
HPV-2 E7ForwardGACCTACATTGCGACGAGCA
ReverseGGACGGTTCTGCCACACTTA
IFNAR-1ForwardTTGTGTGAAAGCCAGAGCAC
ReverseTCAAGAAGACTTTCGCAGCA
IFNAR-2ForwardCACCAGAGTTTGAGATTGTTGG
ReverseGCTTGCTCATCACTGTGCTC
IFN-αForwardCTGAATGACTTGGAAGCCTG
ReverseATTTCTGCTCTGACAACCTC
IFN-βForwardGCAGCAGTTCCAGAAGGAG
ReverseGCCAGGAGGTTCTCAACAAT
IRF-9ForwardGTCCTGGGATGATACAGCTAAG
ReverseCAGGCGAGTCTTCCAGACAG
STAT-1ForwardAGGAAAAGCAAGCGTAATCTTCA
ReverseTATTCCCCGACTGAGCCTGAT
STAT-2ForwardGAGGAGAAGCAATGGGTCTTAG
ReverseGGTCCACAACCAACGAATAGA
ISG15ForwardACTCATCTTTGCCAGTACAGGAG
ReverseCAGCATCTTCACCGTCAGGTC
OAS1ForwardCGGACCCTACAGGAAACTTG
ReverseTGATACCTCCTGGGATCGTC
MxAForwardATCGGAATCTTGACGAAGCC
ReverseCCCTTCTTCAGGTGGAACAC
GAPDHForwardGAAGGTGAAGGTCGGAGTCAA
ReverseGCTCCTGGAAGATGGTGATG
Publisher’s Note: MDPI stays neutral with regard to jurisdictional claims in published maps and institutional affiliations.

