
Establishment of Novel Protein Interaction Assays between Sin3 and REST Using Surface Plasmon Resonance and Time-Resolved Fluorescence Energy Transfer

 , and
, and 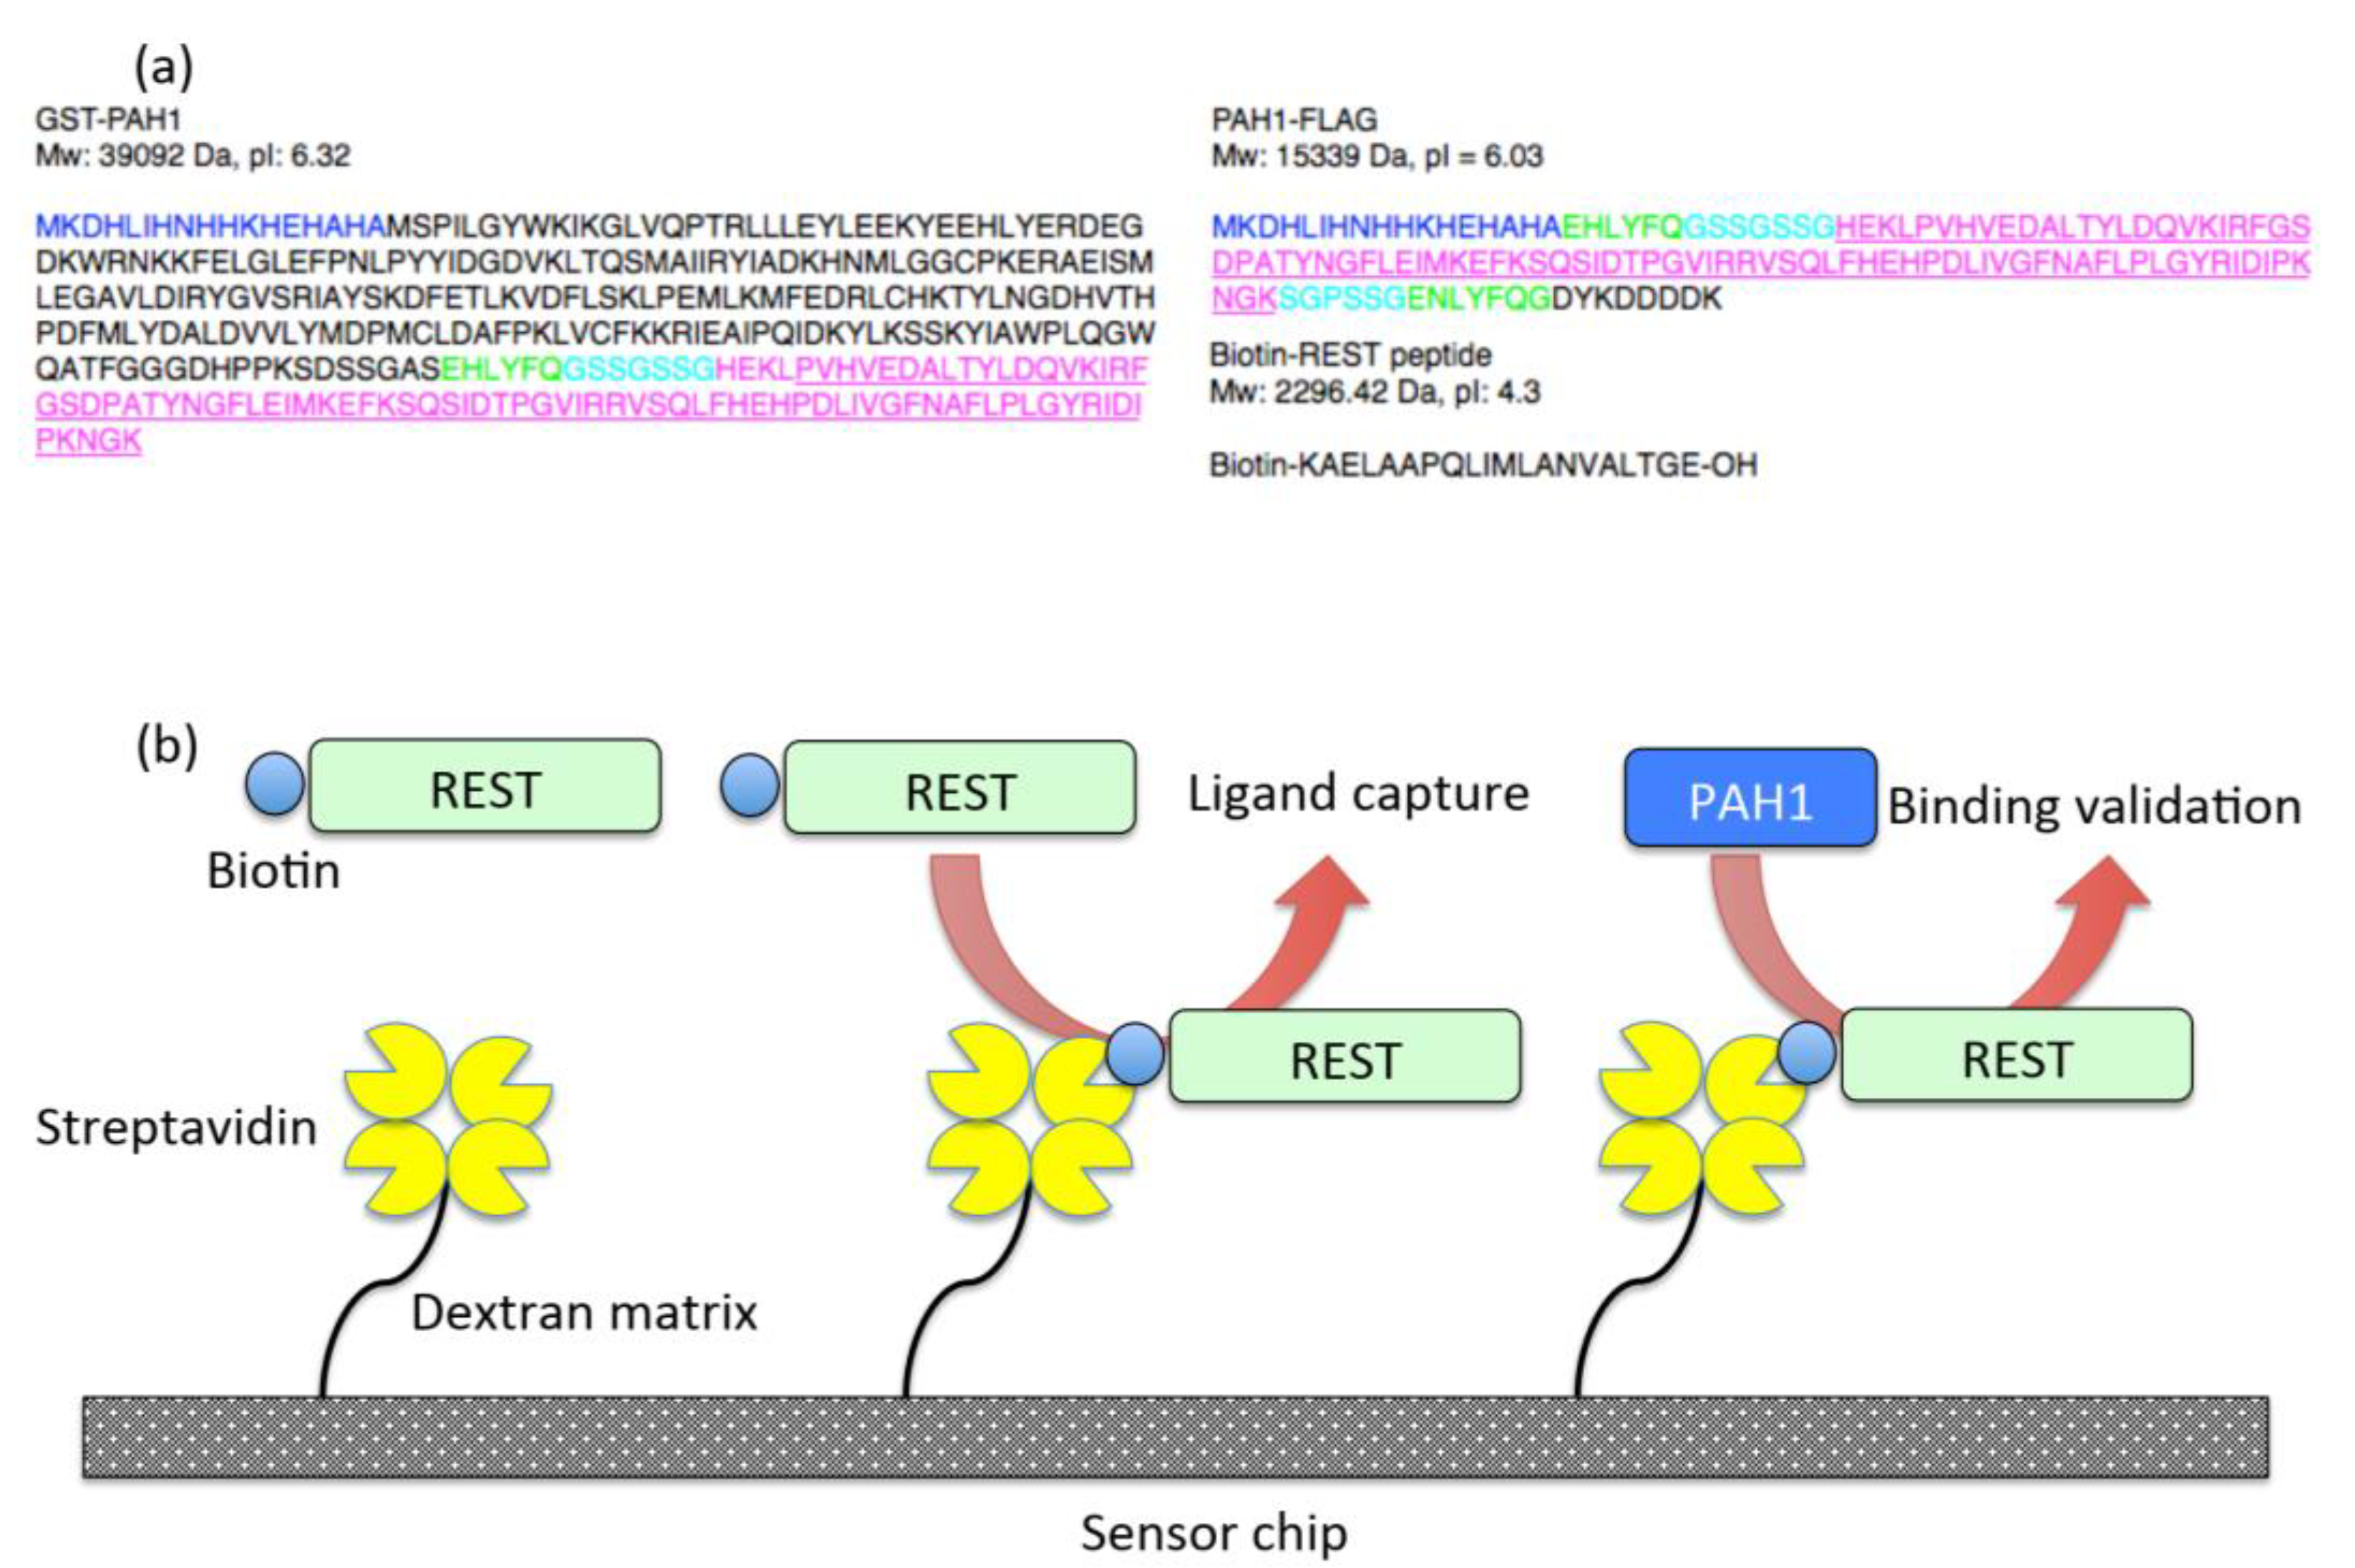
Abstract
1. Introduction
2. Results
2.1. Binding Surface of Sin3B and REST, and Design of Interaction Assay
2.2. Protein–Protein Interaction between REST and PAH1 Peptides
2.3. Establishment of Time-Resolved Fluorescence Energy Transfer Assay Mimicking Protein–Protein Interaction between PAH1 and REST
3. Discussion
4. Materials and Methods
4.1. Materials
4.2. Selection and Generation of PAH1 and REST Peptides
4.3. Surface Plasmon Resonance
4.4. TR-FRET
4.5. Statistics
Supplementary Materials
Author Contributions
Funding
Data Availability Statement
Acknowledgments
Conflicts of Interest
References
- Kraner, S.D.; Chong, J.A.; Tsay, H.J.; Mandel, G. Silencing the type II sodium channel gene: A model for neural-specific gene regulation. Neuron 1992, 9, 37–44. [Google Scholar] [CrossRef]
- Mori, N.; Schoenherr, C.J.; Vandenbergh, D.J.; Anderson, D.J. A common silencer element in the SCG10 and type II Na+ channel genes binds a factor present in nonneuronal cells but not in neuronal cells. Neuron 1992, 9, 45–54. [Google Scholar] [CrossRef]
- Schoenherr, C.J.; Anderson, D.J. The neuron-restrictive silencer factor (NRSF): A coordinate repressor of multiple neuron-specific genes. Science 1995, 267, 1360–1363. [Google Scholar] [CrossRef]
- Chong, J.A.; Tapia-Ramirez, J.; Kim, S.; Toledo-Aral, J.J.; Zheng, Y.; Boutros, M.C.; Altshuller, Y.M.; Frohman, M.A.; Kraner, S.D.; Mandel, G. REST: A mammalian silencer protein that restricts sodium channel gene expression to neurons. Cell 1995, 80, 949–957. [Google Scholar] [CrossRef]
- Bruce, A.W.; Donaldson, I.J.; Wood, I.C.; Yerbury, S.A.; Sadowski, M.I.; Chapman, M.; Göttgens, B.; Buckley, N.J. Genome-wide Analysis of Repressor Element 1 Silencing Transcription Factor/Neuron-Restrictive Silencing Factor (REST/NRSF) Target Genes. Proc. Natl. Acad. Sci. USA 2004, 101, 10458–10463. [Google Scholar] [CrossRef] [PubMed]
- Schoch, S.; Cibelli, G.; Thiel, G. Neuron-specific Gene Expression of Synapsin I. J. Biol. Chem. 1996, 271, 3317–3323. [Google Scholar] [CrossRef]
- Wood, I.C.; Roopra, A.; Buckley, N.J. Neural specific expression of the m4 muscarinic acetylcholine receptor gene is mediated by a RE1/NRSE-type silencing element. J. Biol. Chem. 1996, 271, 14221–14225. [Google Scholar] [CrossRef] [PubMed]
- Bessis, A.; Champtiaux, N.; Chatelin, L.; Changeux, J.-P. The neuron-restrictive silencer element: A dual enhancer/silencer crucial for patterned expression of a nicotinic receptor gene in the brain. Proc. Natl. Acad. Sci. USA 1997, 94, 5906–5911. [Google Scholar] [CrossRef] [PubMed]
- Bai, G.; Norton, D.D.; Prenger, M.S.; Kusiak, J.W. Single-stranded DNA-binding Proteins and Neuron-restrictive Silencer Factor Participate in Cell-specific Transcriptional Control of the NMDAR1 Gene. J. Biol. Chem. 1998, 273, 1086–1091. [Google Scholar] [CrossRef] [PubMed]
- Yeo, M.; Berglund, K.; Augustine, G.; Liedtke, W. Novel repression of Kcc2 transcription by REST-RE-1 controls developmental switch in neuronal chloride. J. Neurosci. 2009, 29, 14652–14662. [Google Scholar] [CrossRef] [PubMed]
- Lawinger, P.; Venugopal, R.; Guo, Z.-S.; Immaneni, A.; Sengupta, D.; Lu, W.; Rastelli, L.; Carneiro, A.M.D.; Levin, V.; Fuller, G.N.; et al. The neuronal repressor REST/NRSF is an essential regulator in medulloblastoma cells. Nat. Med. 2000, 6, 826–831. [Google Scholar] [CrossRef]
- Kamal, M.M.; Sathyan, P.; Singh, S.K.; Zinn, P.O.; Marisetty, A.L.; Liang, S.; Gumin, J.; El-Mesallamy, H.O.; Suki, D.; Colman, H.; et al. REST Regulates Oncogenic Properties of Glioblastoma Stem Cells. Stem Cells 2012, 30, 405–414. [Google Scholar] [CrossRef]
- Zuccato, C.; Tartari, M.; Crotti, A.; Goffredo, D.; Valenza, M.; Conti, L.; Cataudella, T.; Leavitt, B.R.; Hayden, M.R.; Timmusk, T.; et al. Huntingtin interacts with REST/NRSF to modulate the transcription of NRSE-controlled neuronal genes. Nat. Genet. 2003, 35, 76–83. [Google Scholar] [CrossRef] [PubMed]
- Willis, D.E.; Wang, M.; Brown, E.; Fones, L.; Cave, J.W. Selective repression of gene expression in neuropathic pain by the neuron-restrictive silencing factor/repressor element-1 silencing transcription (NRSF/REST). Neurosci. Lett. 2016, 625, 20–25. [Google Scholar] [CrossRef]
- Suo, H.; Wang, P.; Tong, J.; Cai, L.; Liu, J.; Huang, D.; Huang, L.; Wang, Z.; Huang, Y.; Xu, J.; et al. NRSF Is an Essential Mediator for the Neuroprotection of Trichostatin A in the MPTP Mouse Model of Park-inson’s Disease. Neuropharmacology 2015, 99, 67–78. [Google Scholar] [CrossRef]
- Katayama, Y.; Nishiyama, M.; Shoji, H.; Ohkawa, Y.; Kawamura, A.; Sato, T.; Suyama, M.; Takumi, T.; Miyakawa, T.; Nakayama, K.I. CHD8 haploinsufficiency results in autistic-like phenotypes in mice. Nat. Cell Biol. 2016, 537, 675–679. [Google Scholar] [CrossRef] [PubMed]
- Huang, Y.; Myers, S.J.; Dingledine, R. Transcriptional repression by REST: Recruitment of Sin3A and histone deacetylase to neuronal genes. Nat. Neurosci. 1999, 2, 867–872. [Google Scholar] [CrossRef] [PubMed]
- Andrés, M.E.; Burger, C.; Peral-Rubio, M.J.; Battaglioli, E.; Anderson, M.E.; Grimes, J.; Dallman, J.; Ballas, N.; Mandel, G. CoREST: A functional corepressor required for regulation of neural-specific gene expression. Proc. Natl. Acad. Sci. USA 1999, 96, 9873–9878. [Google Scholar] [CrossRef] [PubMed]
- Nomura, M.; Uda-Tochio, H.; Murai, K.; Mori, N.; Nishimura, Y. The Neural Repressor NRSF/REST Binds the PAH1 Domain of the Sin3 Corepressor by Using its Distinct Short Hydrophobic Helix. J. Mol. Biol. 2005, 354, 903–915. [Google Scholar] [CrossRef] [PubMed]
- Roopra, A.; Qazi, R.; Schoenike, B.; Daley, T.J.; Morrison, J.F. Localized Domains of G9a-Mediated Histone Methylation are Required for Silencing of Neuronal Genes. Mol. Cell 2004, 14, 727–738. [Google Scholar] [CrossRef]
- Shi, Y.; Lan, F.; Matson, C.; Mulligan, P.; Whetstine, J.R.; Cole, P.A.; Casero, R.A.; Shi, Y. Histone Demethylation Mediated by the Nuclear Amine Oxidase Homolog LSD1. Cell 2004, 119, 941–953. [Google Scholar] [CrossRef] [PubMed]
- Mathis, G. Bioassays: Luminescent Materials in Encyclopedia of Materials: Science and Technology, 2nd ed.; Buschow, J.K.H., Cahn, R.W., Flemings, M.C., Ilschner, B., Kramer, E.J., Mahajan, S., Veyssiere, P., Eds.; Elsevier: Oxford, UK, 2001; pp. 538–542. [Google Scholar]
- Xie, T.; He, Y.; Korkeamaki, H.; Zhang, Y.; Imhoff, R.; Lohi, O.; Radhakrishnan, I. Structure of the 30-kDa Sin3-associated Protein (SAP30) in Complex with the Mammalian Sin3A Corepressor and Its Role in Nucleic Acid Binding. J. Biol. Chem. 2011, 286, 27814–27824. [Google Scholar] [CrossRef] [PubMed]
- Halder, D.; Lee, C.-H.; Hyun, J.Y.; Chang, G.-E.; Cheong, E.; Shin, I. Suppression of Sin3A Activity Promotes Differentiation of Pluripotent Cells Into Functional Neurons. Sci. Rep. 2017, 7, 44818. [Google Scholar] [CrossRef]
- Lewis, M.J.; Liu, J.; Libby, E.F.; Lee, M.; Crawford, N.P.; Hurst, D.R. SIN3A and SIN3B differentially regulate breast cancer metastasis. Oncotarget 2016, 7, 78713–78725. [Google Scholar] [CrossRef] [PubMed]
- Kurata, R.; Kumagai, A.; Cui, X.; Harada, M.; Nagai, J.; Yoshida, Y.; Ozaki, K.-I.; Tanaka, Y.; Yonezawa, T. Establishment of Novel Reporter Cells Stably Maintaining Transcription Factor-driven Human Secreted Alkaline Phosphatase Expression. Curr. Pharm. Biotechnol. 2018, 19, 224–231. [Google Scholar] [CrossRef]
- Zhang, J.-H.; Chung, T.D.Y.; Oldenburg, K.R. A Simple Statistical Parameter for Use in Evaluation and Validation of High Throughput Screening Assays. J. Biomol. Screen. 1999, 4, 67–73. [Google Scholar] [CrossRef]
- Kurata, R.; Shimizu, K.; Cui, X.; Harada, M.; Isagawa, T.; Semba, H.; Ishihara, J.; Yamada, K.; Nagai, J.; Yoshida, Y.; et al. Novel Reporter System Monitoring IL-18 Specific Signaling Can Be Applied to High-Throughput Screening. Mar. Drugs 2020, 18, 60. [Google Scholar] [CrossRef]
- Harada, M.; Nagai, J.; Kurata, R.; Shimizu, K.; Cui, X.; Isagawa, T.; Semba, H.; Ishihara, J.; Yoshida, Y.; Takeda, N.; et al. Establishment of Novel High-Standard Chemiluminescent Assay for NTPase in Two Protozoans and Its High-Throughput Screening. Mar. Drugs 2020, 18, 161. [Google Scholar] [CrossRef] [PubMed]


Publisher’s Note: MDPI stays neutral with regard to jurisdictional claims in published maps and institutional affiliations. |
© 2021 by the authors. Licensee MDPI, Basel, Switzerland. This article is an open access article distributed under the terms and conditions of the Creative Commons Attribution (CC BY) license (http://creativecommons.org/licenses/by/4.0/).
Share and Cite
Harada, M.; Nagai, J.; Kurata, R.; Cui, X.; Isagawa, T.; Semba, H.; Yoshida, Y.; Takeda, N.; Maemura, K.; Yonezawa, T. Establishment of Novel Protein Interaction Assays between Sin3 and REST Using Surface Plasmon Resonance and Time-Resolved Fluorescence Energy Transfer. Int. J. Mol. Sci. 2021, 22, 2323. https://doi.org/10.3390/ijms22052323
Harada M, Nagai J, Kurata R, Cui X, Isagawa T, Semba H, Yoshida Y, Takeda N, Maemura K, Yonezawa T. Establishment of Novel Protein Interaction Assays between Sin3 and REST Using Surface Plasmon Resonance and Time-Resolved Fluorescence Energy Transfer. International Journal of Molecular Sciences. 2021; 22(5):2323. https://doi.org/10.3390/ijms22052323
Chicago/Turabian StyleHarada, Masamitsu, Jun Nagai, Riho Kurata, Xiaofeng Cui, Takayuki Isagawa, Hiroaki Semba, Yasuhiro Yoshida, Norihiko Takeda, Koji Maemura, and Tomo Yonezawa. 2021. "Establishment of Novel Protein Interaction Assays between Sin3 and REST Using Surface Plasmon Resonance and Time-Resolved Fluorescence Energy Transfer" International Journal of Molecular Sciences 22, no. 5: 2323. https://doi.org/10.3390/ijms22052323
APA StyleHarada, M., Nagai, J., Kurata, R., Cui, X., Isagawa, T., Semba, H., Yoshida, Y., Takeda, N., Maemura, K., & Yonezawa, T. (2021). Establishment of Novel Protein Interaction Assays between Sin3 and REST Using Surface Plasmon Resonance and Time-Resolved Fluorescence Energy Transfer. International Journal of Molecular Sciences, 22(5), 2323. https://doi.org/10.3390/ijms22052323