
In Silico Inference of Synthetic Cytotoxic Interactions from Paclitaxel Responses


Abstract
1. Introduction
2. Results
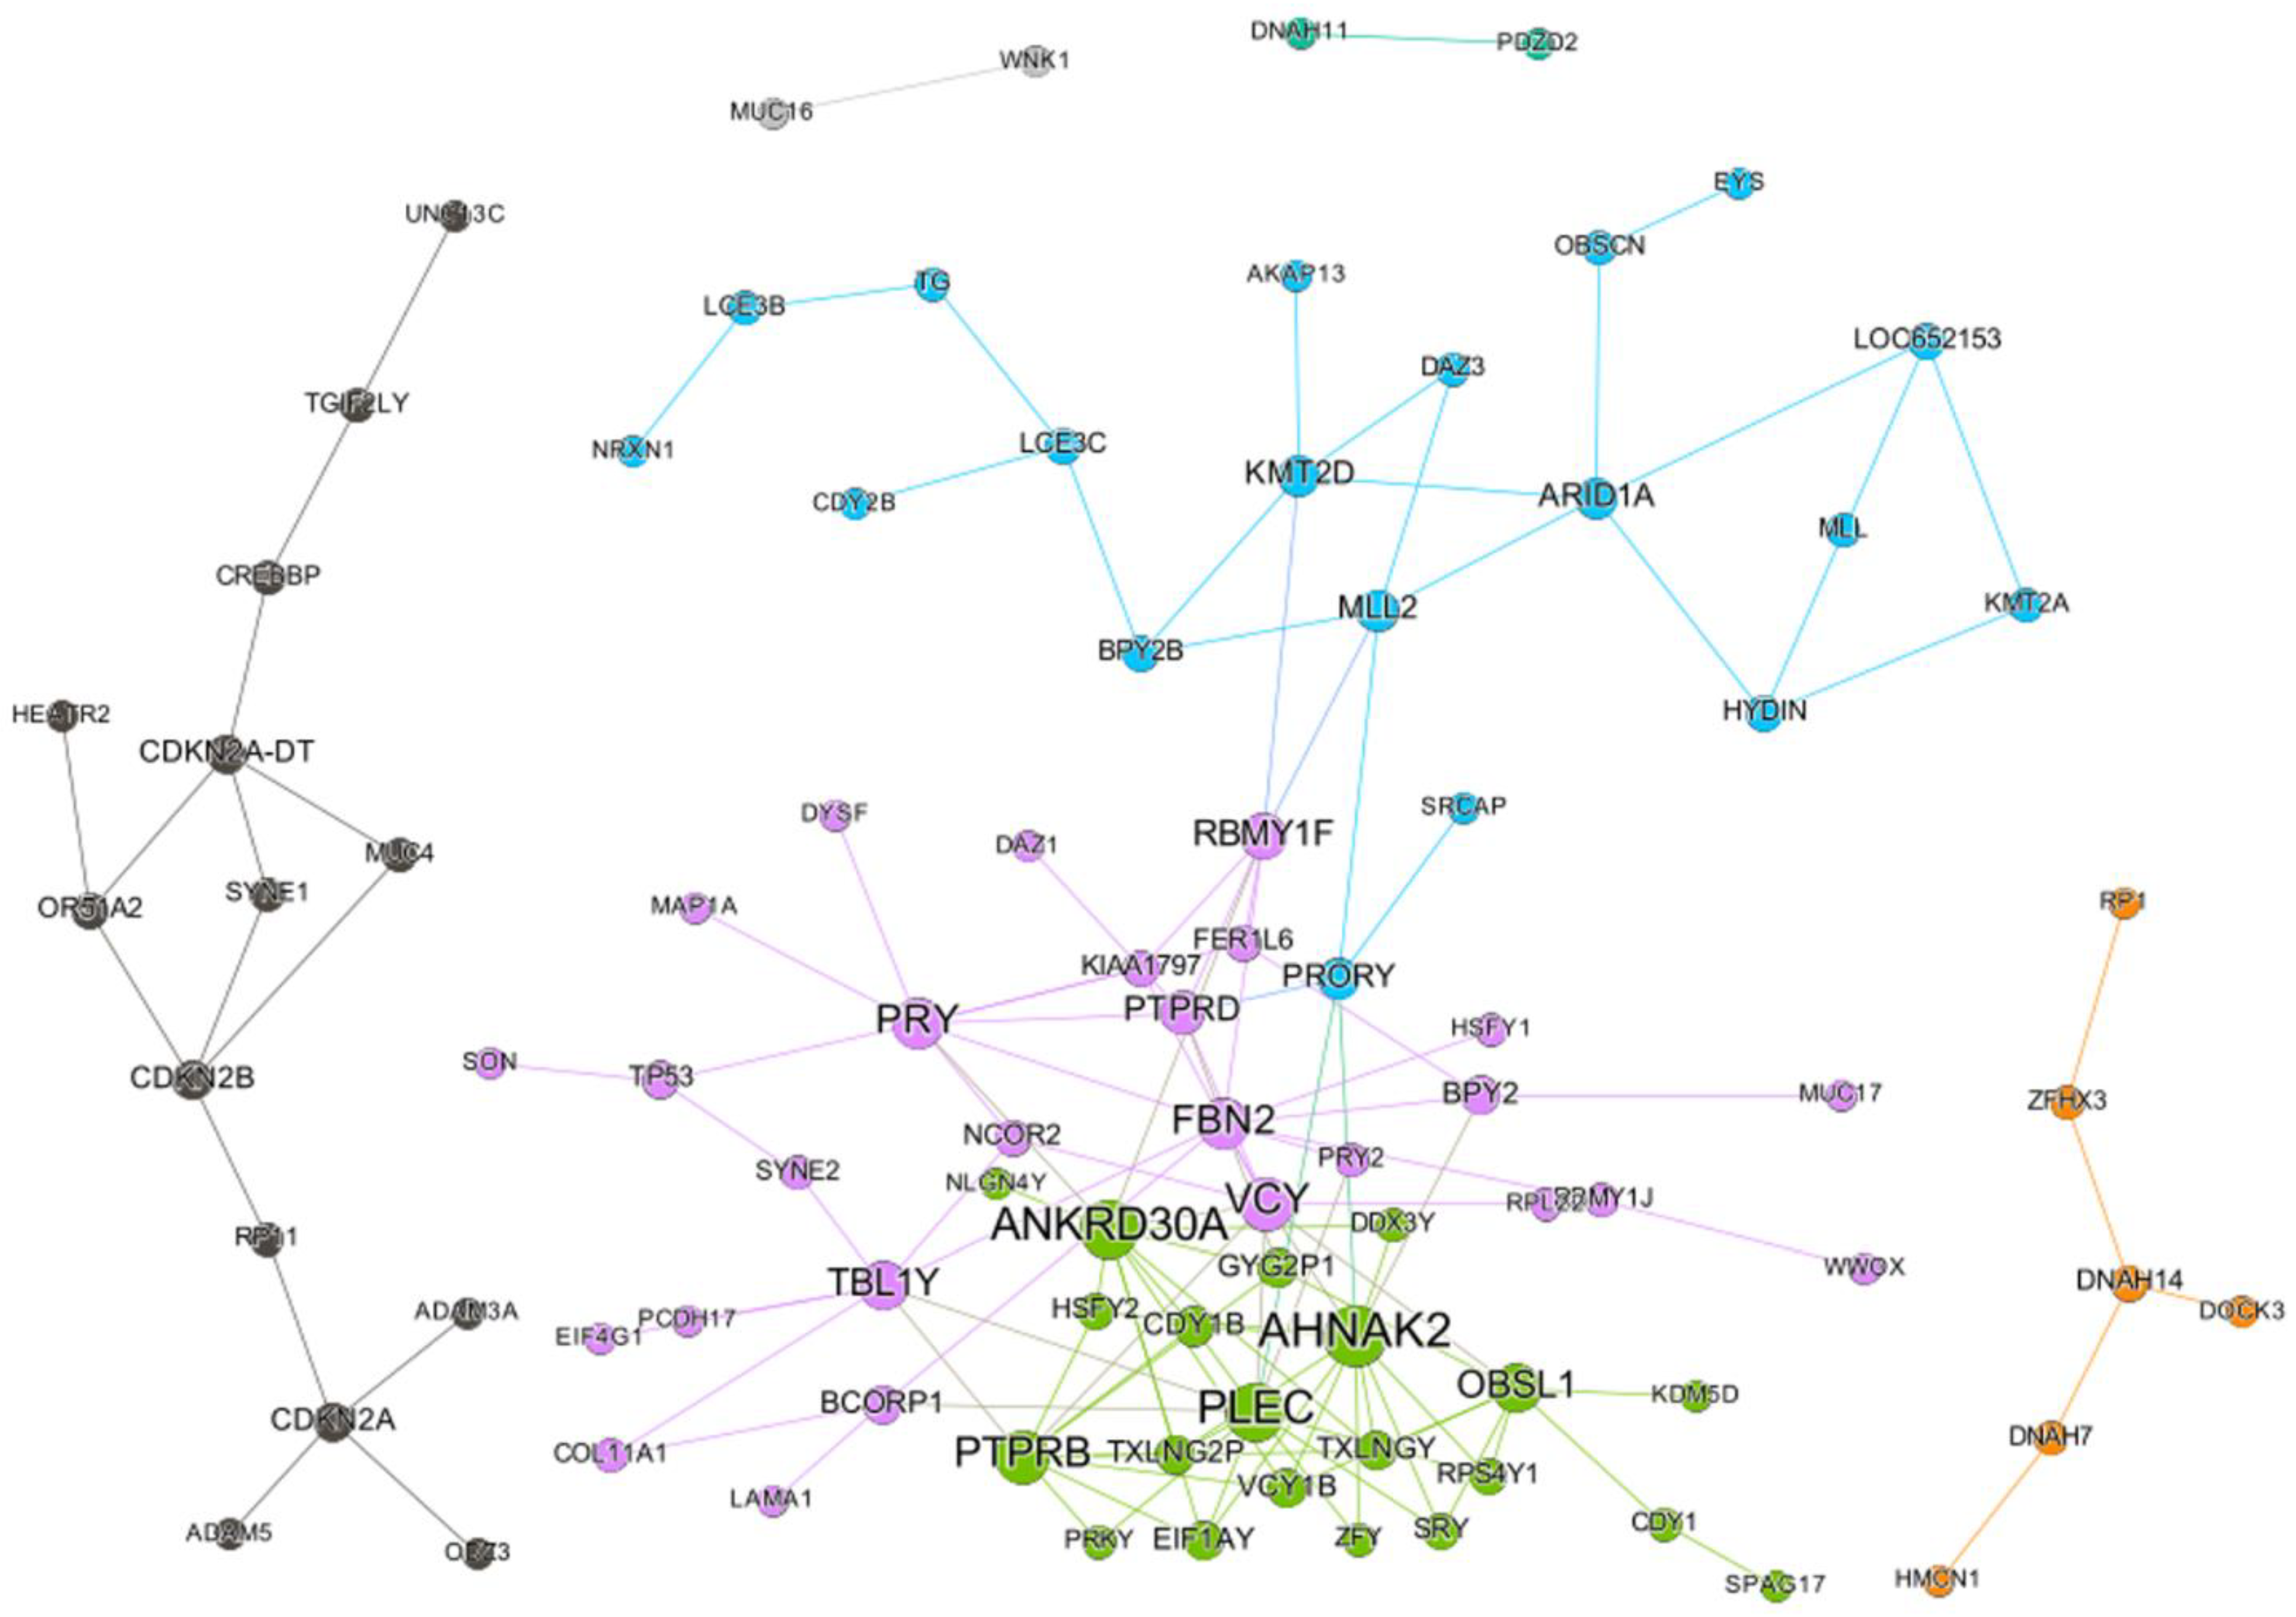
2.1. SC Network of Paclitaxel
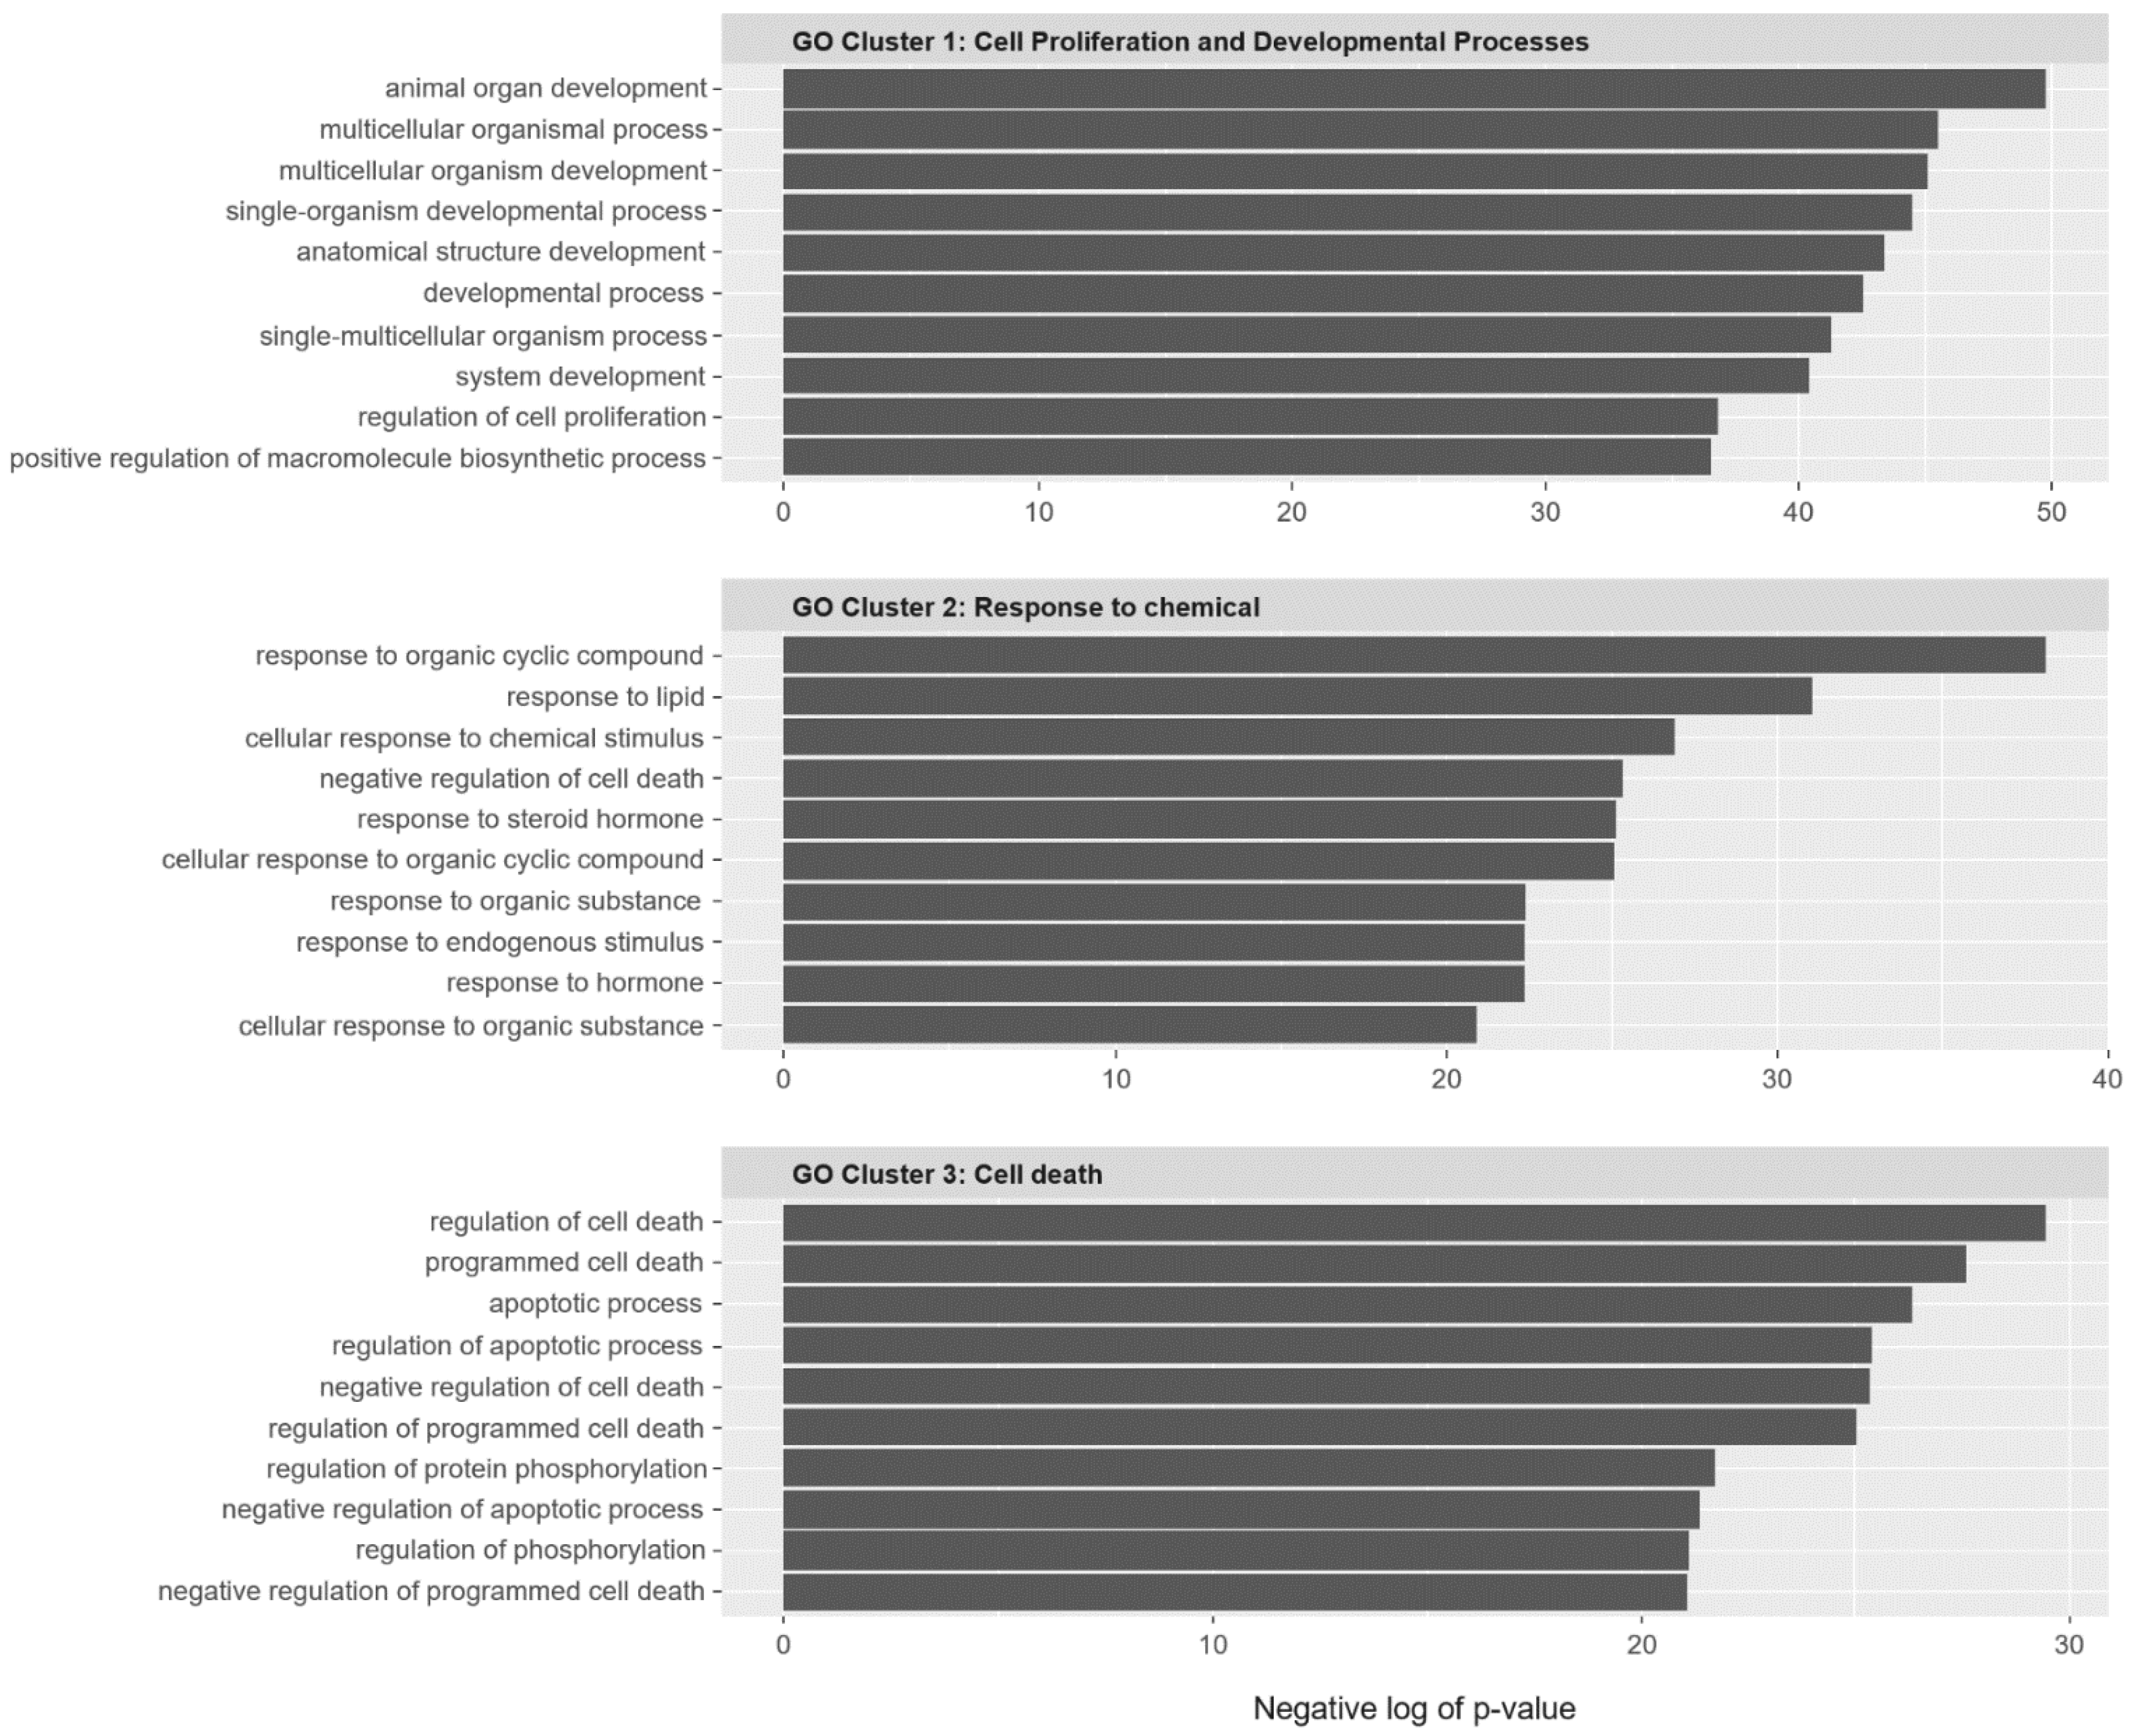
2.2. SC Gene Pairs Were Enriched for Cell Death and Chemical Responses
2.3. SC Burden
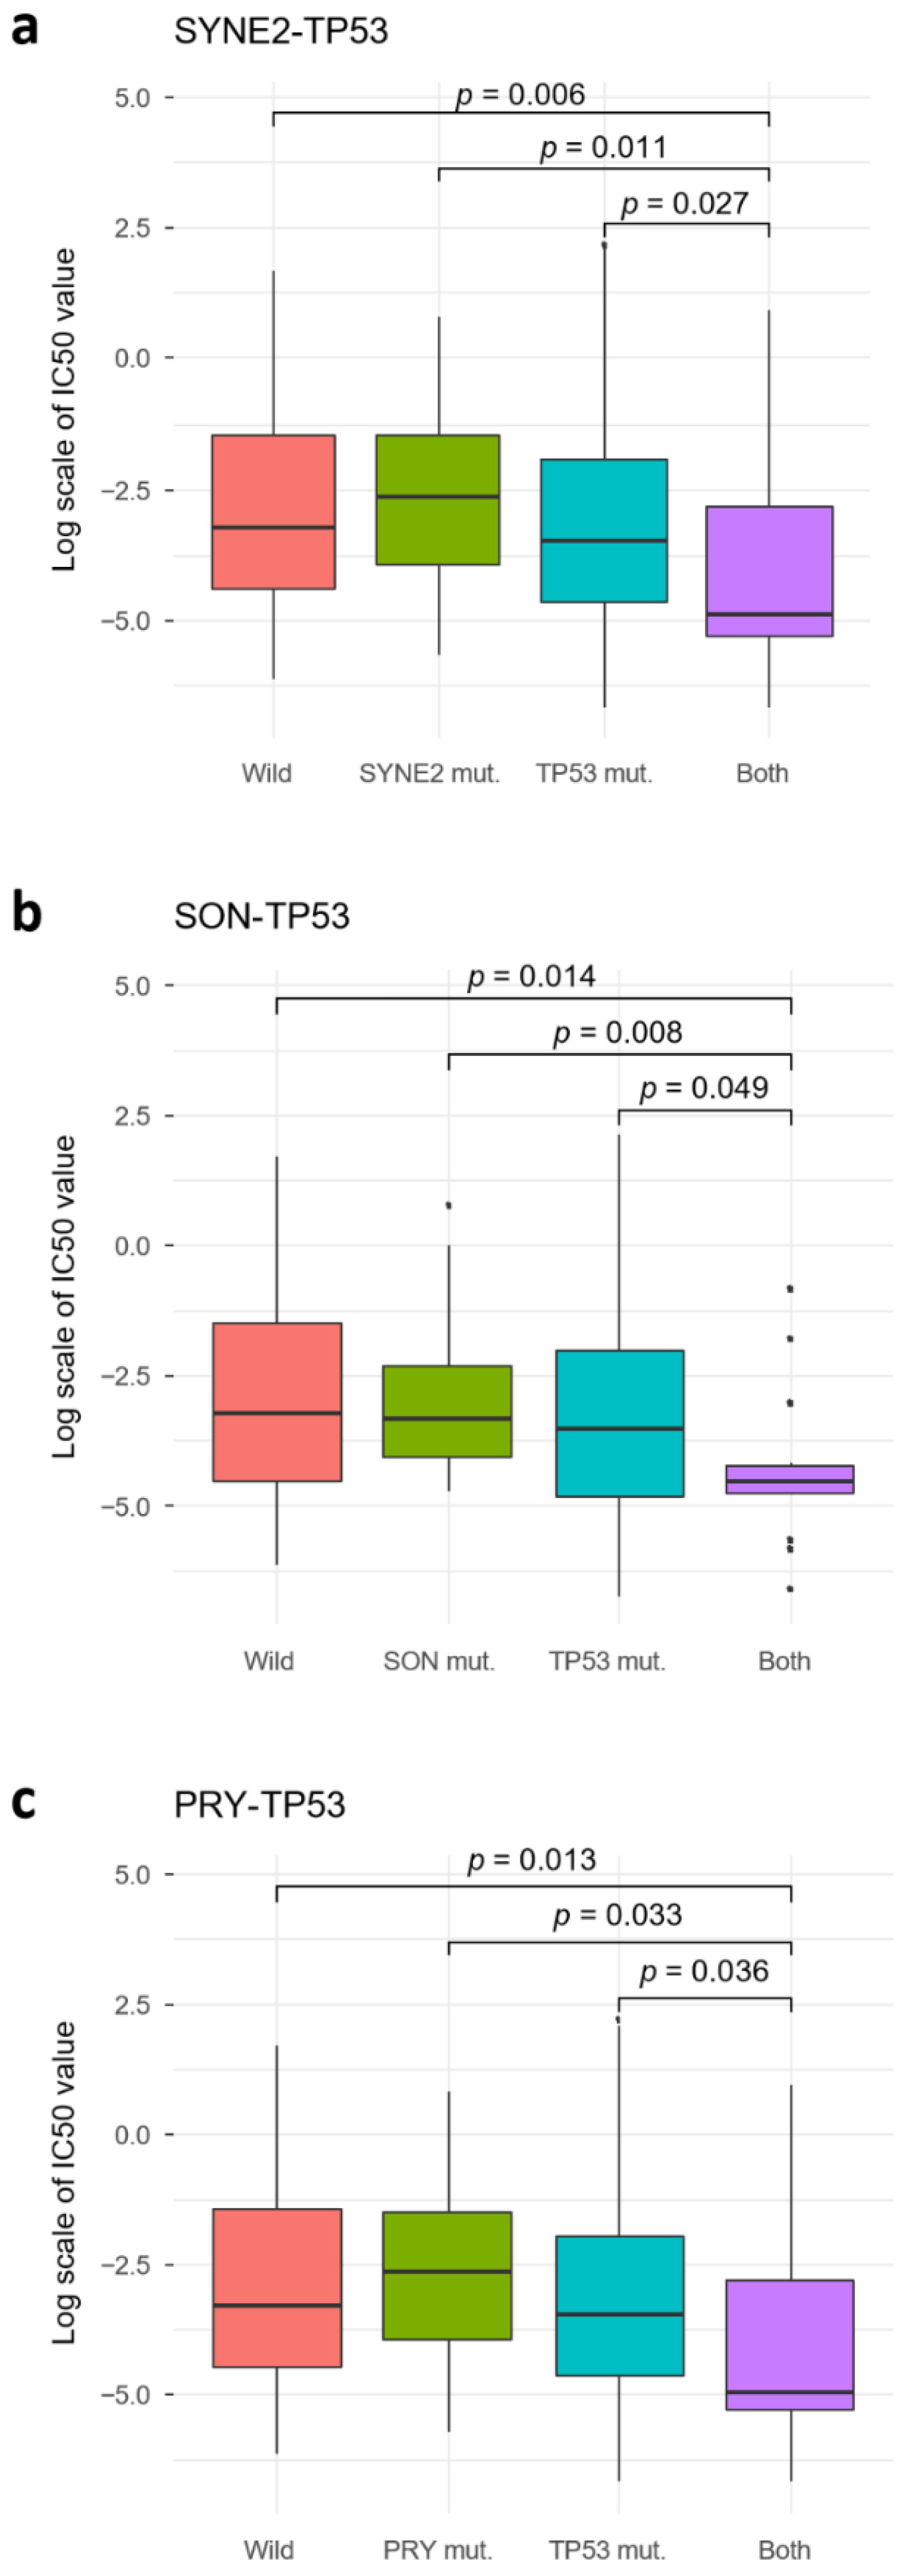
2.4. TP53 SC Pairs
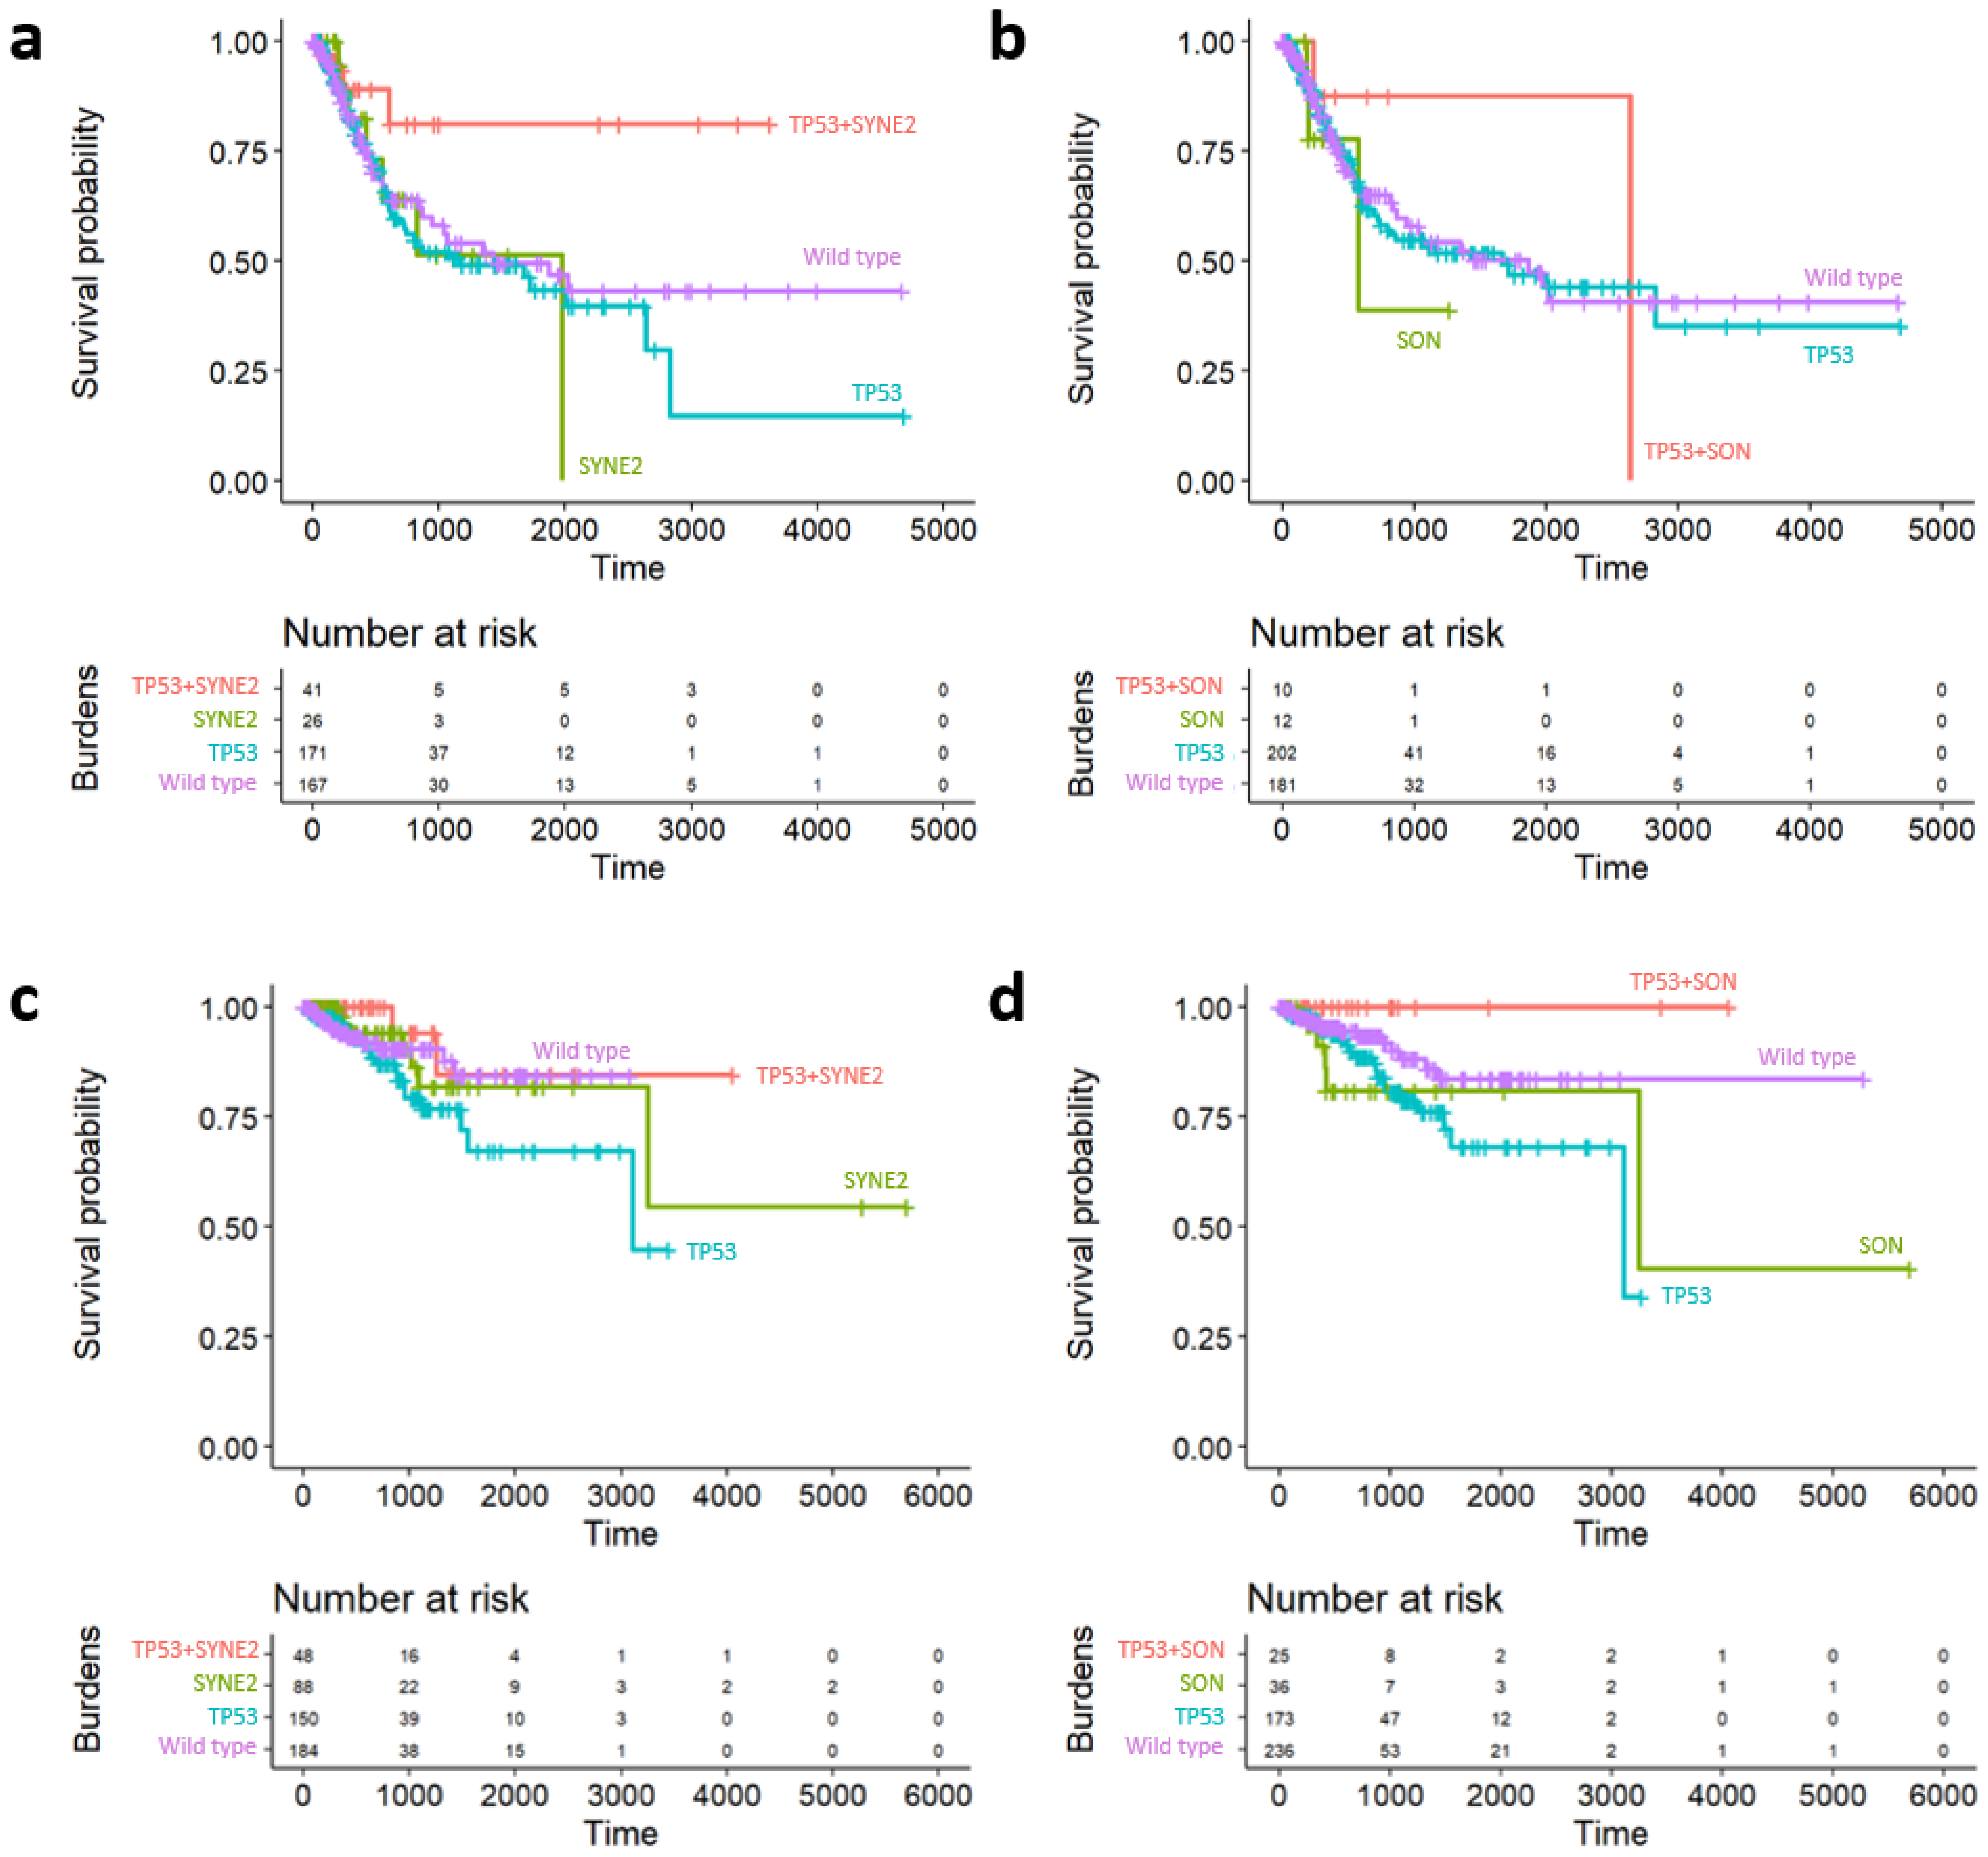
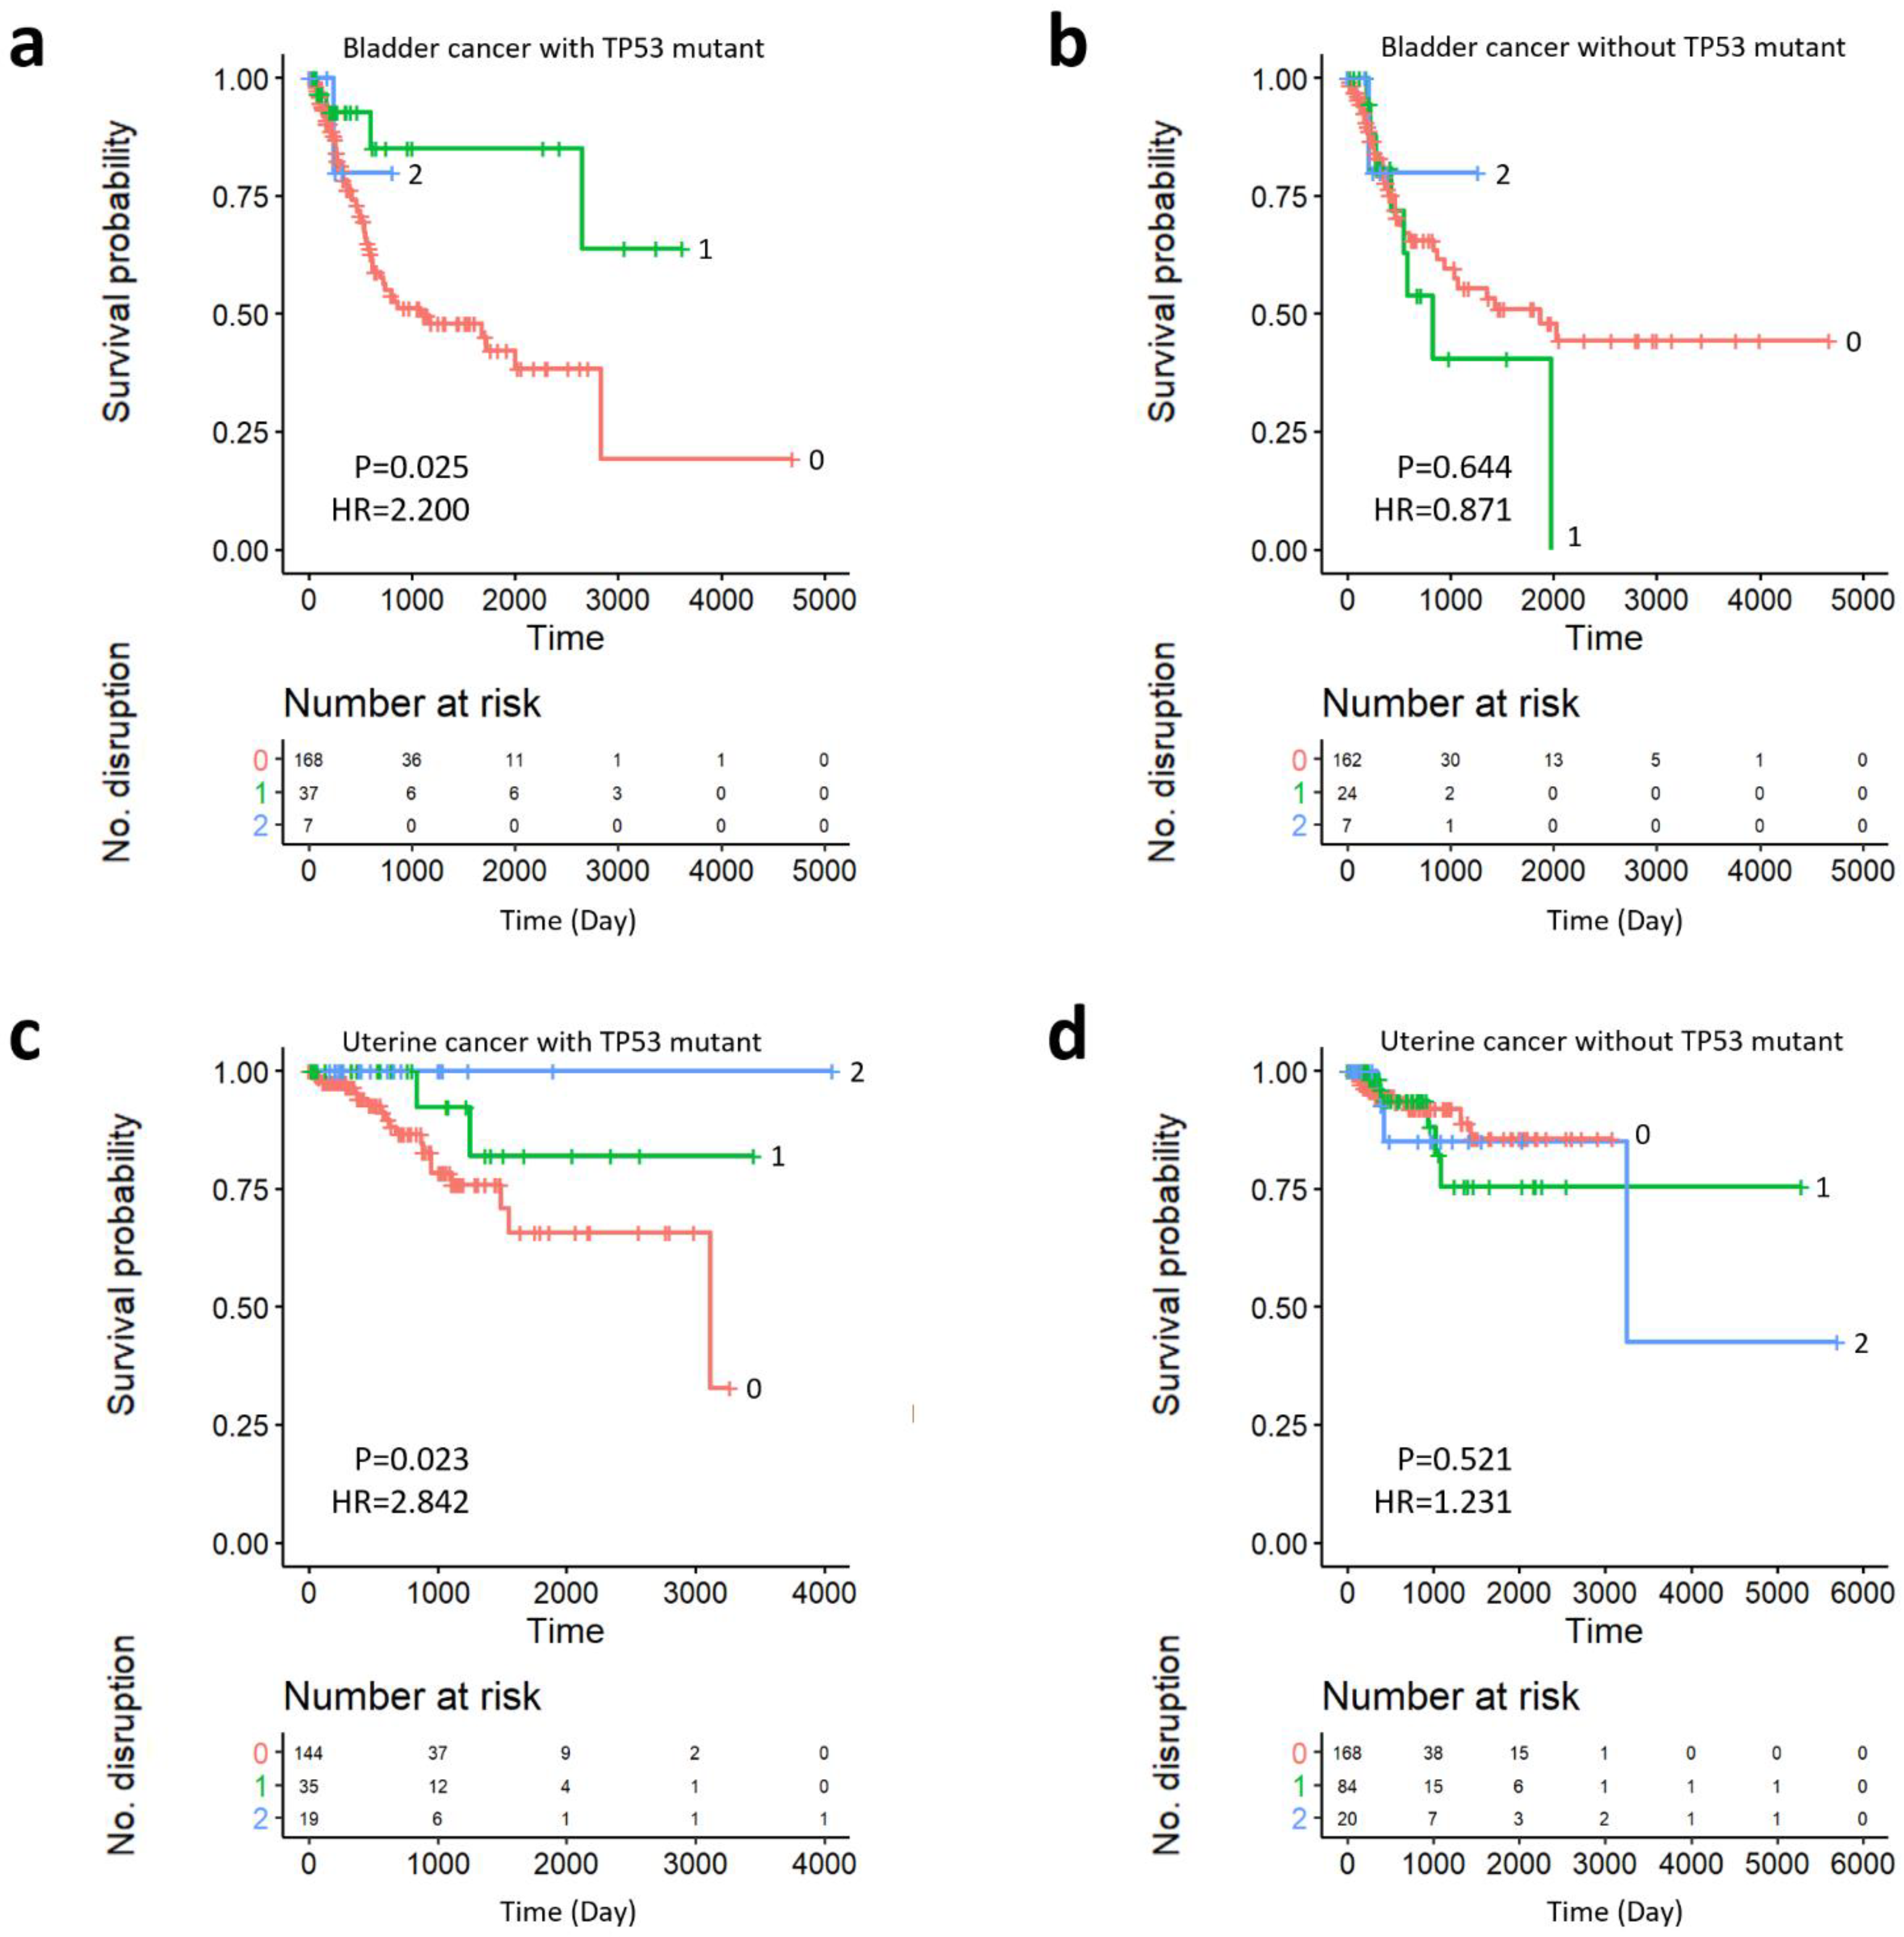
2.5. Survival Analysis of Prognostic Subgroups of TP53 SC Network
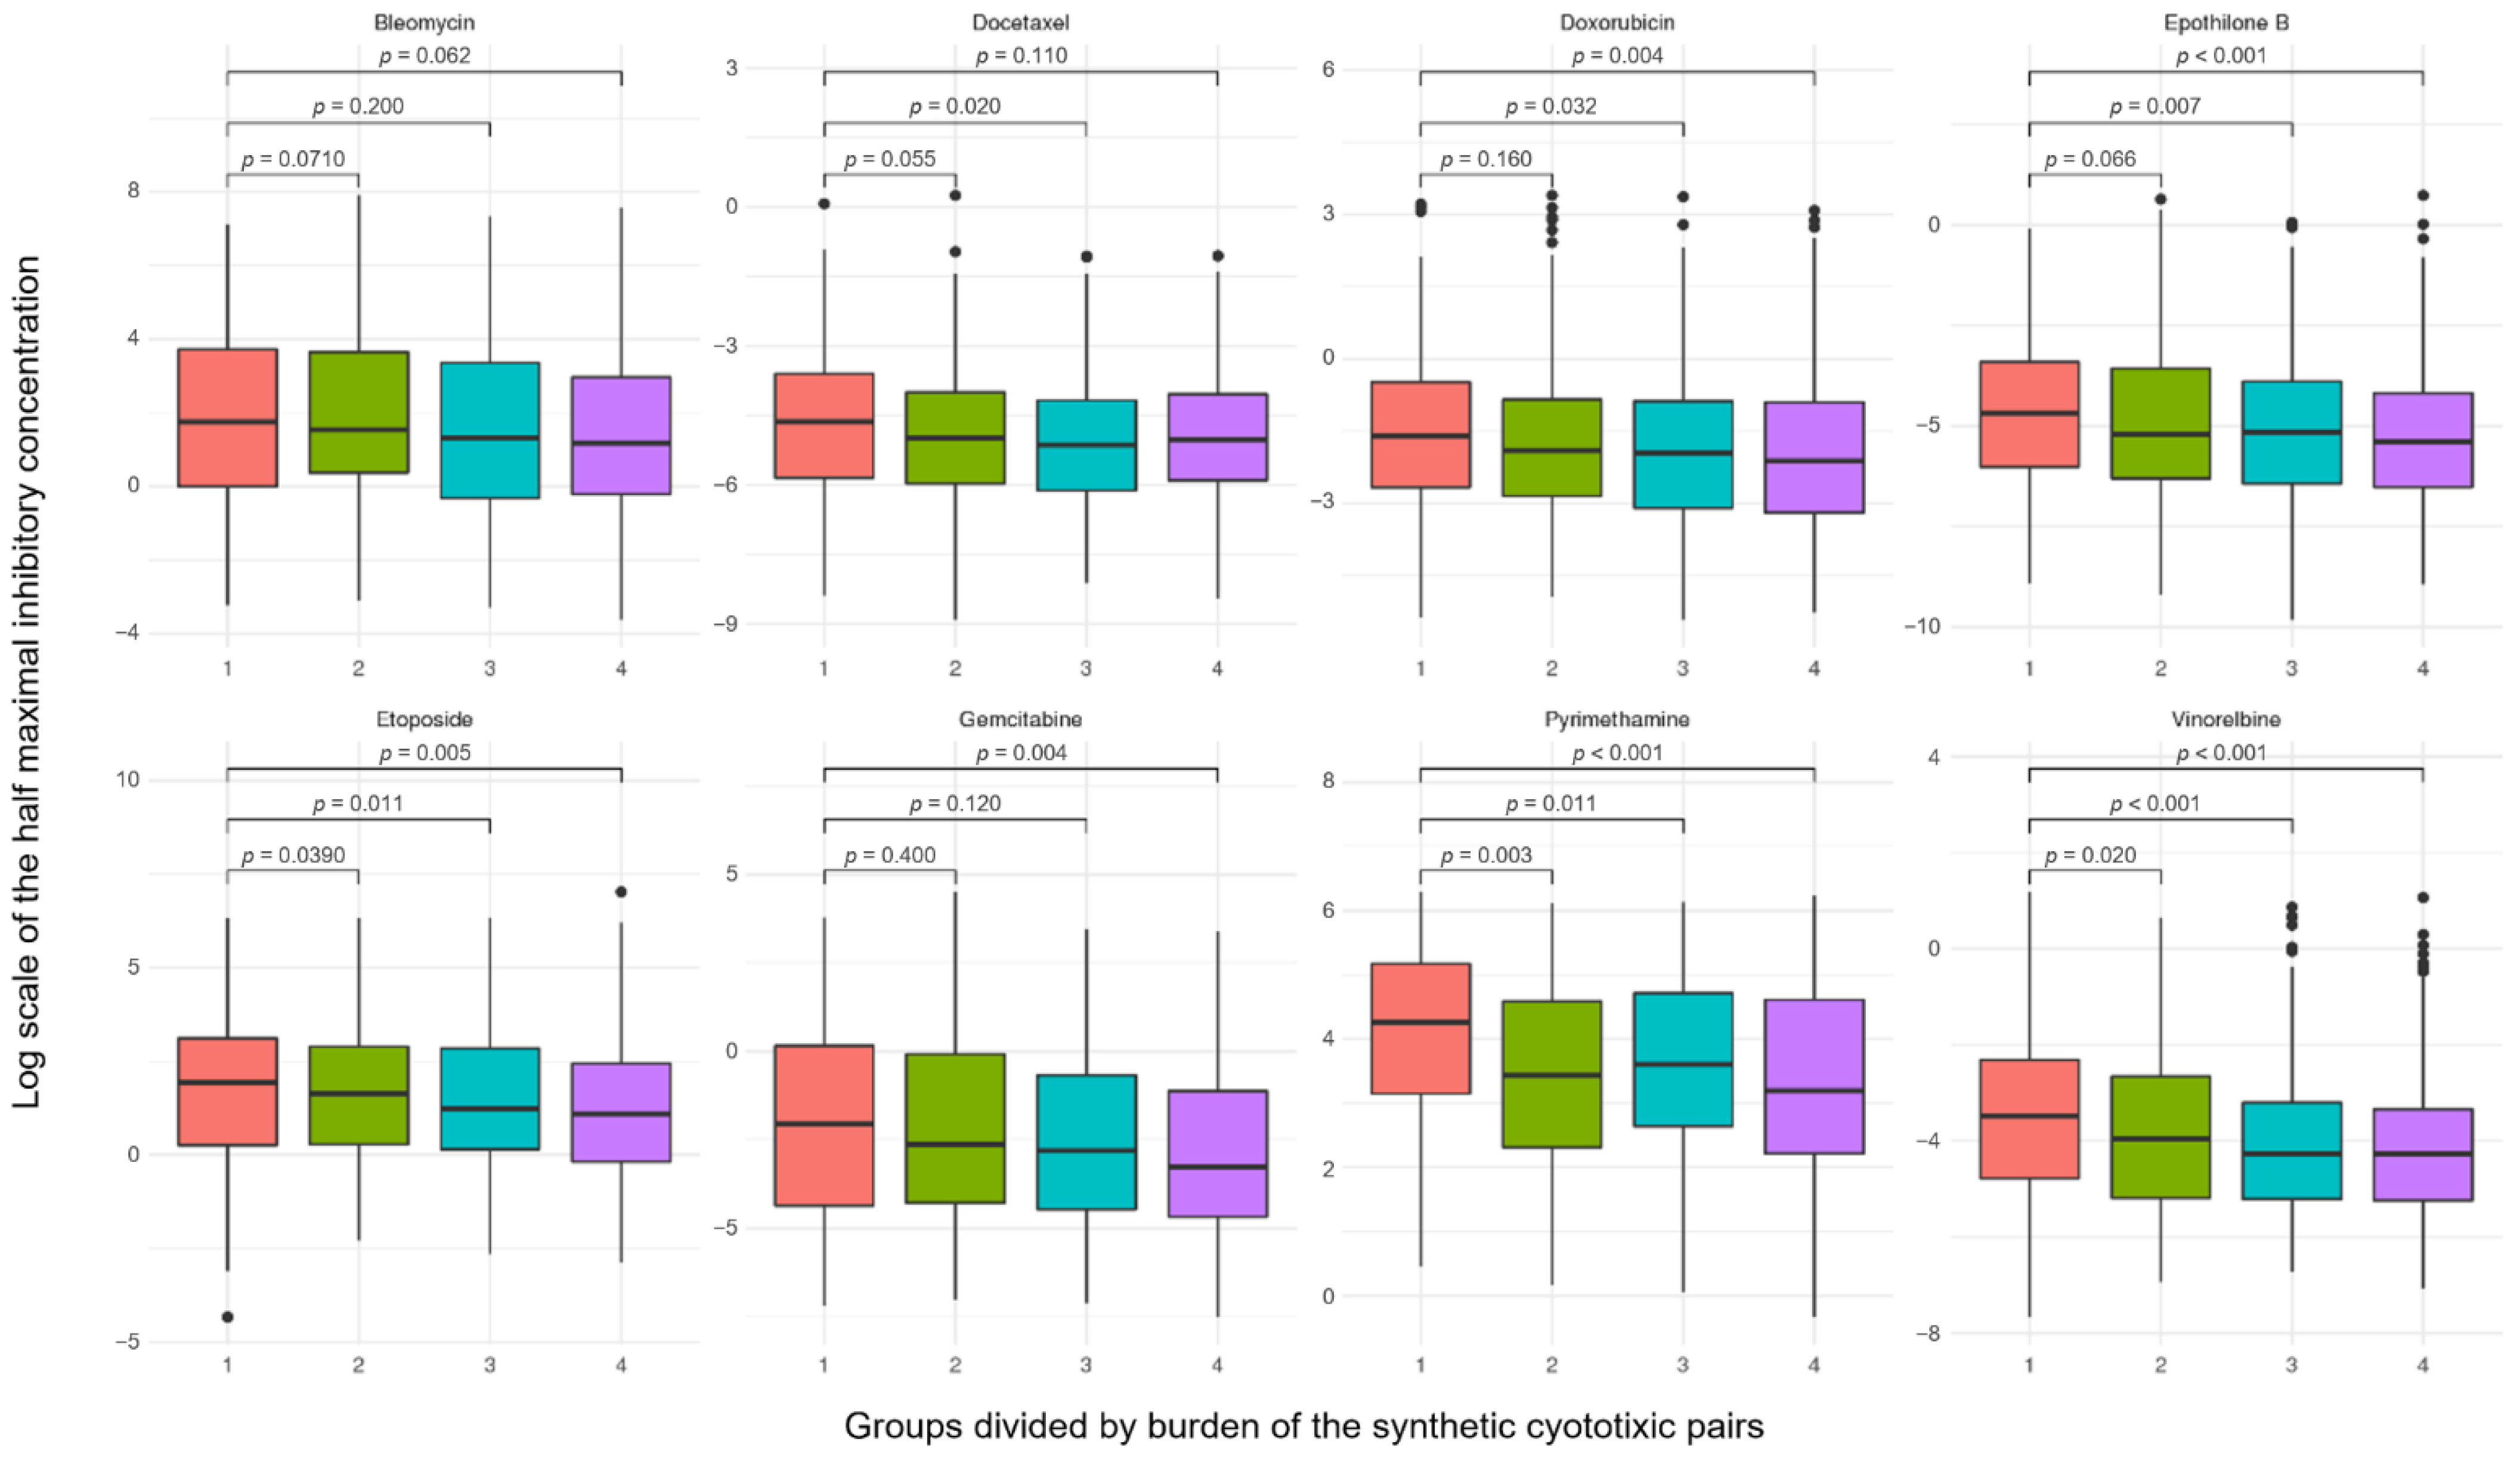
2.6. Robustness of Synthetic Cytotoxic Pairs in Chemotherapy Agents
3. Discussion
4. Materials and Methods
4.1. Cancer Cell Line Data
4.2. Gene Disruption in Cancer Cell Line Project
4.3. Somatic Mutation Profiles in Primary Tumors
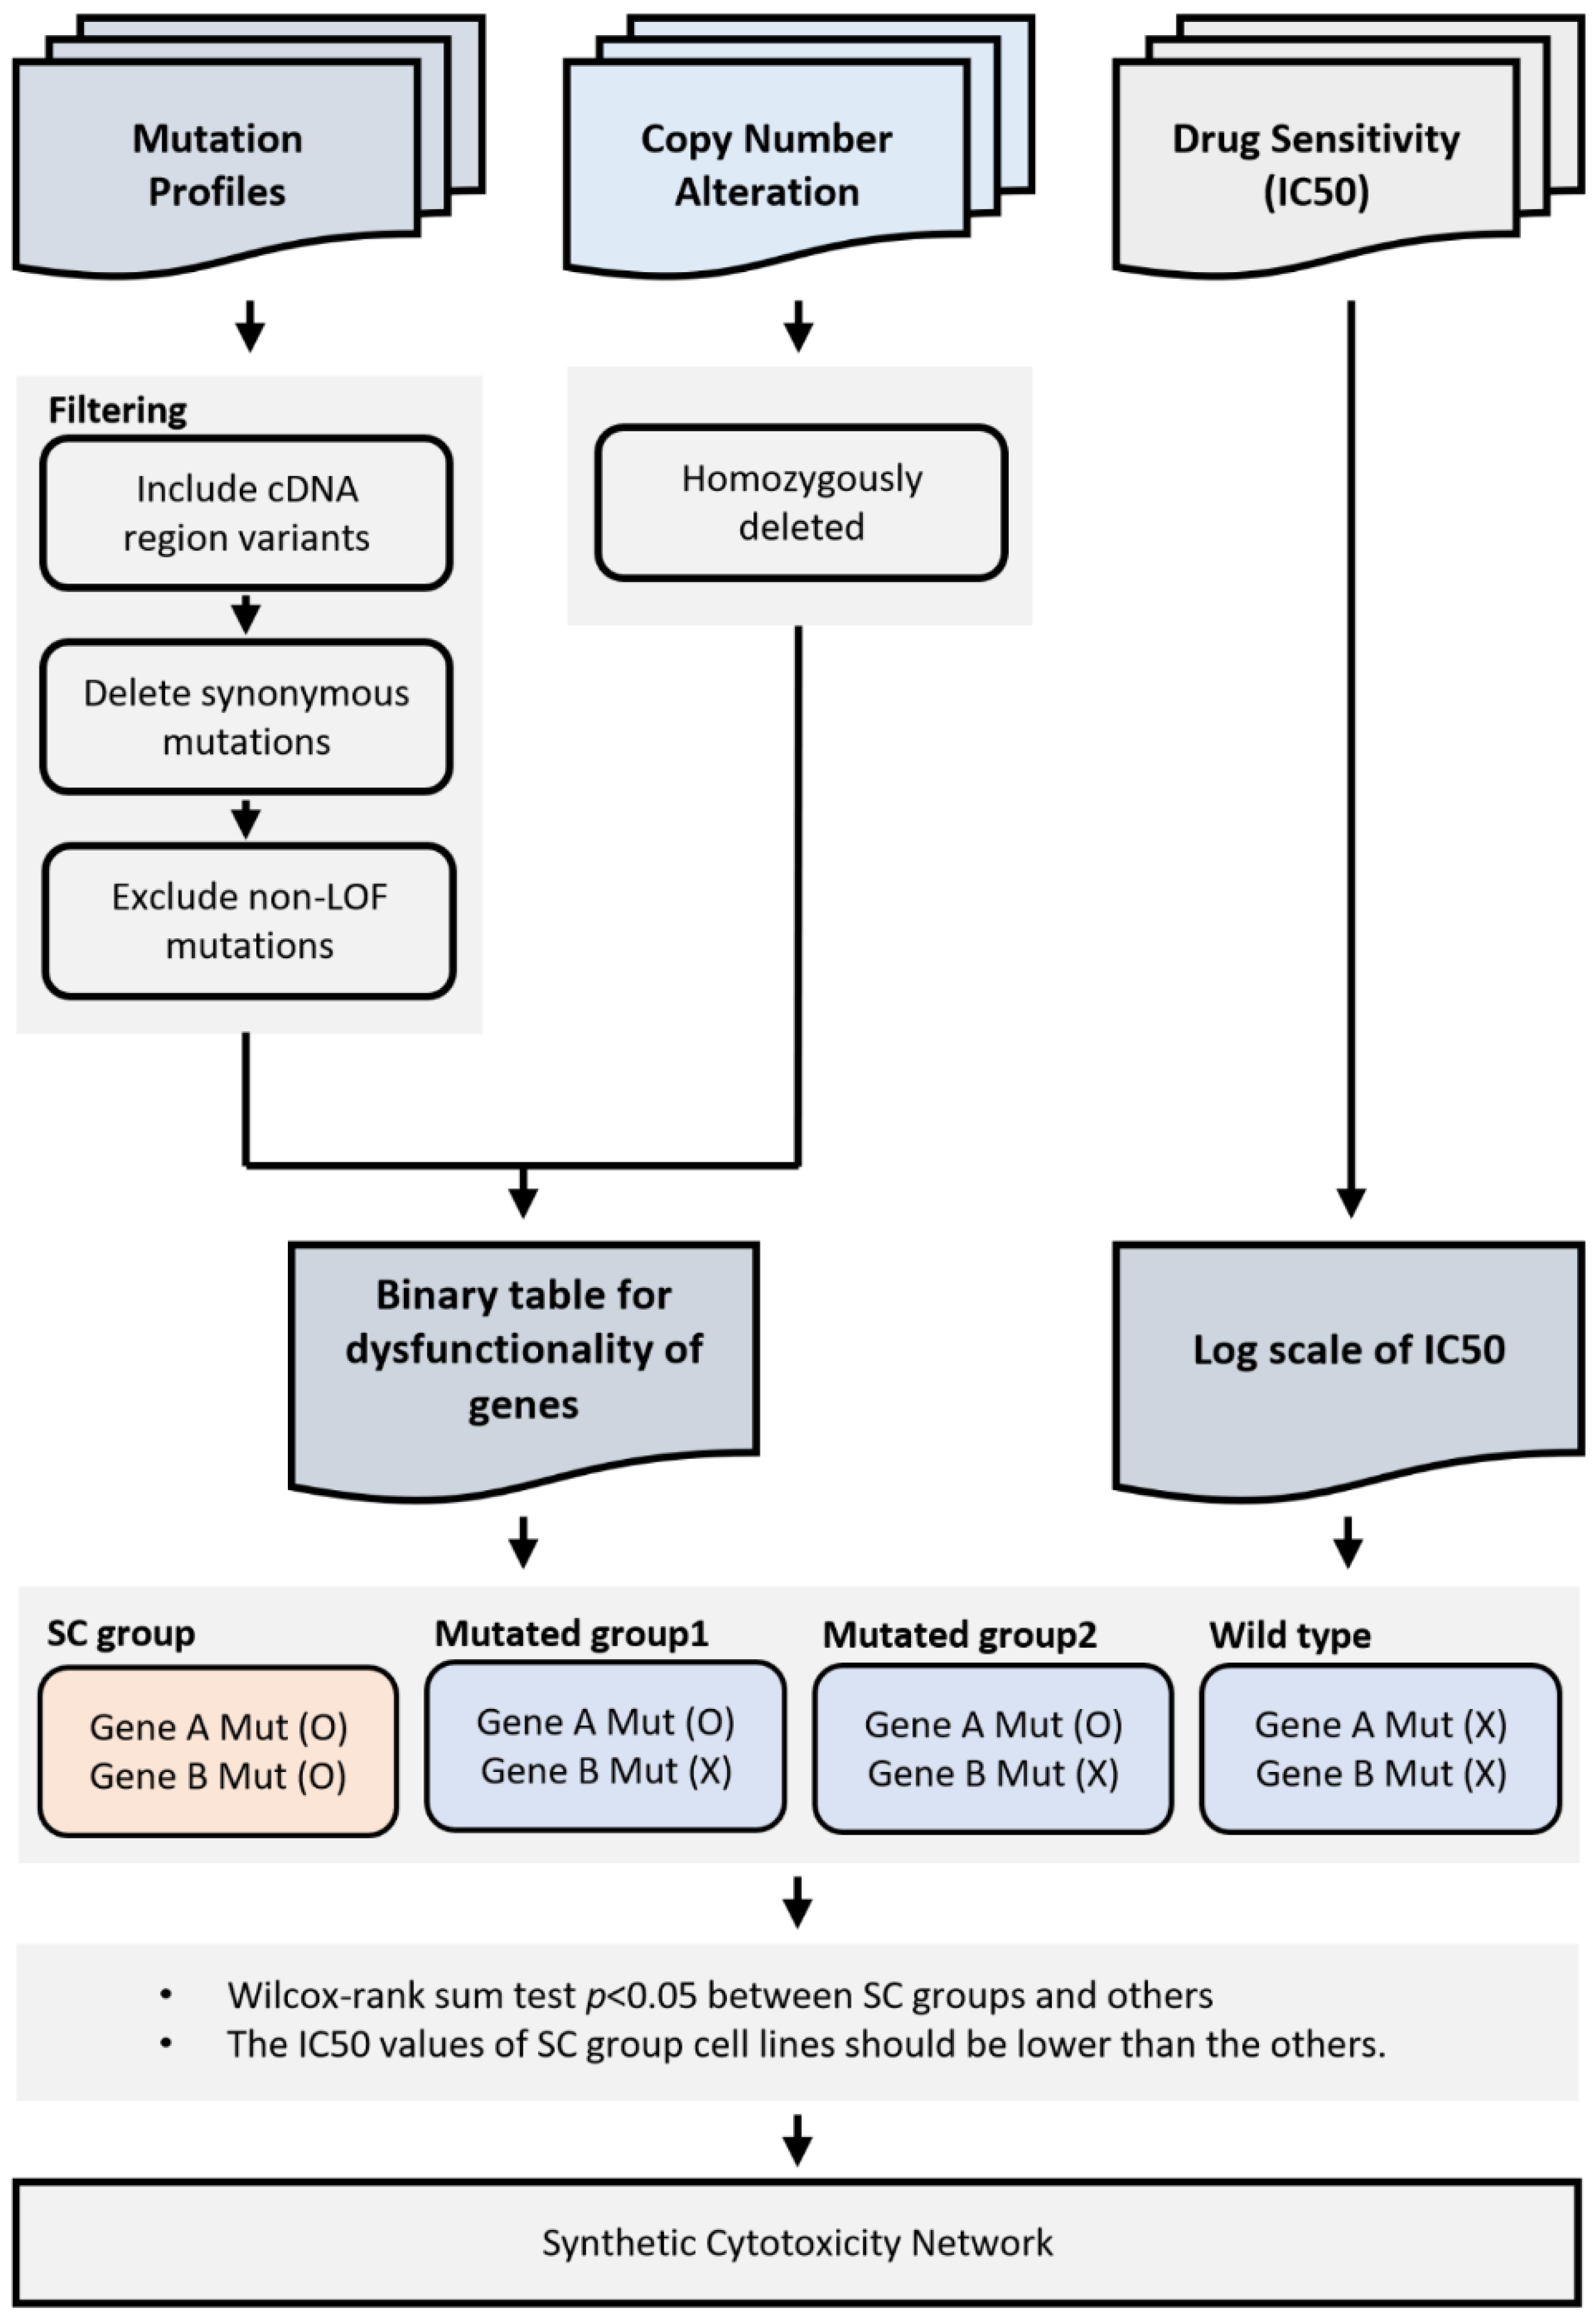
4.4. Building Binary Disruption Gene Matrix
4.5. Identification of Synthetic Cytotoxic Interactions
4.6. Synthetic Cytotoxic Network for Paclitaxel
4.7. Functional Enrichment Test
4.8. Prognostic Effect of SC in TCGA Datasets
Supplementary Materials
Author Contributions
Funding
Institutional Review Board Statement
Informed Consent Statement
Data Availability Statement
Acknowledgments
Conflicts of Interest
Abbreviations
| EC50 | Half-maximal effective concentration |
| FDR | False discovery rate |
| GATHER | Gene annotation tool to help explain relationships |
| GDSC | Genomics of drug sensitivity in cancer |
| GO | Gene ontology |
| IC50 | Half-maximal inhibitory concentration |
| SC | Synthetic cytotoxicity |
| SNP | Single nucleotide polymorphism |
| TCGA | The cancer genome atlas |
| VEP | Variant effect predictor |
References
- Twelves, C.; Jove, M.; Gombos, A.; Awada, A. Cytotoxic chemotherapy: Still the mainstay of clinical practice for all subtypes metastatic breast cancer. Crit. Rev. Oncol. Hematol. 2016, 100, 74–87. [Google Scholar] [CrossRef]
- Ribeiro, J.T.; Macedo, L.T.; Curigliano, G.; Fumagalli, L.; Locatelli, M.; Dalton, M.; Quintela, A.; Carvalheira, J.B.C.; Manunta, S.; Mazzarella, L.; et al. Cytotoxic drugs for patients with breast cancer in the era of targeted treatment: Back to the future? Ann. Oncol. 2012, 23, 547–555. [Google Scholar] [CrossRef]
- Dembic, Z. Antitumor Drugs and Their Targets. Molecules 2020, 25, 5776. [Google Scholar] [CrossRef]
- Falzone, L.; Salomone, S.; Libra, M. Evolution of cancer pharmacological treatments at the turn of the third millennium. Front. Pharmacol. 2018, 9, 1300. [Google Scholar] [CrossRef] [PubMed]
- Ma, P.; Mumper, R.J. Paclitaxel nano-delivery systems: A comprehensive review. J. Nanomed. Nanotechnol. 2013, 4, 1000164. [Google Scholar] [CrossRef] [PubMed]
- Xu, C.-Z.; Shi, R.-J.; Chen, D.; Sun, Y.-Y.; Wu, Q.-W.; Wang, T.; Wang, P.-H. Potential biomarkers for paclitaxel sensitivity in hypopharynx cancer cell. Int. J. Clin. Exp. Pathol. 2013, 6, 2745. [Google Scholar] [PubMed]
- Perez-Ortiz, A.C.; Villarreal-Garza, C.; Villa-Romero, A.; Lopez, J.C.C.; Ramirez-Sanchez, I.; Luna-Angulo, A.; Guerrero-Solorzano, J.C.; Matus, J.A.; Diaz-Chavez, J.; Garcia-Alvarez, B.A.; et al. Pharmacogenetic biomarkers associated with paclitaxel response in Mexican women with locally advanced breast cancer. 2017. [Google Scholar] [CrossRef]
- Paradiso, A.; Mangia, A.; Chiriatti, A.; Tommasi, S.; Zito, A.; Latorre, A.; Schittulli, F.; Lorusso, V. Biomarkers predictive for clinical efficacy of taxol-based chemotherapy in advanced breast cancer. Ann. Oncol. 2005, 16, iv14–iv19. [Google Scholar] [CrossRef] [PubMed]
- Chang, Y.; Park, H.; Yang, H.-J.; Lee, S.; Lee, K.-Y.; Kim, T.S.; Jung, J.; Shin, J.-M. Cancer drug response profile scan (CDRscan): A deep learning model that predicts drug effectiveness from cancer genomic signature. Sci. Rep. 2018, 8, 8857. [Google Scholar] [CrossRef]
- O’Neil, N.J.; Bailey, M.L.; Hieter, P. Synthetic lethality and cancer. Nat. Rev. Genet. 2017, 18, 613–623. [Google Scholar] [CrossRef]
- Kaelin, W.G. The concept of synthetic lethality in the context of anticancer therapy. Nat. Rev. Cancer 2005, 5, 689–698. [Google Scholar] [CrossRef] [PubMed]
- Lee, J.S.; Das, A.; Jerby-Arnon, L.; Arafeh, R.; Auslander, N.; Davidson, M.; McGarry, L.; James, D.; Amzallag, A.; Park, S.G.; et al. Harnessing synthetic lethality to predict the response to cancer treatment. Nat. Commun. 2018, 9, 2546. [Google Scholar] [CrossRef] [PubMed]
- Apaolaza, I.; San José-Eneriz, E.; Tobalina, L.; Miranda, E.; Garate, L.; Agirre, X.; Prósper, F.; Planes, F.J. An in-silico approach to predict and exploit synthetic lethality in cancer metabolism. Nat. Commun. 2017, 8, 459. [Google Scholar] [CrossRef] [PubMed]
- Li, X.; O’Neil, N.J.; Moshgabadi, N.; Hieter, P. Synthetic cytotoxicity: Digenic interactions with TEL1/ATM mutations reveal sensitivity to low doses of camptothecin. Genetics 2014, 197, 611–623. [Google Scholar] [CrossRef] [PubMed][Green Version]
- Jerby-Arnon, L.; Pfetzer, N.; Waldman, Y.Y.; McGarry, L.; James, D.; Shanks, E.; Seashore-Ludlow, B.; Weinstock, A.; Geiger, T.; Clemons, P.A.; et al. Predicting cancer-specific vulnerability via data-driven detection of synthetic lethality. Cell 2014, 158, 1199–1209. [Google Scholar] [CrossRef] [PubMed]
- Liu, L.; Chen, X.; Hu, C.; Zhang, D.; Shao, Z.; Jin, Q.; Yang, J.; Xie, H.; Liu, B.; Hu, M.; et al. Synthetic lethality-based identification of targets for anticancer drugs in the human signaling network. Sci. Rep. 2018, 8, 8440. [Google Scholar] [CrossRef]
- Jang, K.; Park, M.J.; Park, J.S.; Hwangbo, H.; Sung, M.K.; Kim, S.; Jung, J.; Lee, J.W.; Ahn, S.-H.; Chang, S.; et al. Computational inference of cancer-specific vulnerabilities in clinical samples. Genome Biol. 2020, 21, 155. [Google Scholar] [CrossRef] [PubMed]
- Guo, J.; Liu, H.; Zheng, J. SynLethDB: Synthetic lethality database toward discovery of selective and sensitive anticancer drug targets. Nucl. Acids Res. 2016, 44, D1011–D1017. [Google Scholar] [CrossRef]
- Yang, W.; Soares, J.; Greninger, P.; Edelman, E.J.; Lightfoot, H.; Forbes, S.; Bindal, N.; Beare, D.; Smith, J.A.; Thompson, I.R.; et al. Genomics of drug sensitivity in cancer (GDSC): A resource for therapeutic biomarker discovery in cancer cells. Nucl. Acids Res. 2012, 41, D955–D961. [Google Scholar] [CrossRef]
- Zhang, X.; Xu, R.; Zhu, B.; Yang, X.; Ding, X.; Duan, S.; Xu, T.; Zhuang, Y.; Han, M. Syne-1 and Syne-2 play crucial roles in myonuclear anchorage and motor neuron innervation. Development 2007, 134, 901–908. [Google Scholar] [CrossRef]
- Ahn, E.-Y.; DeKelver, R.C.; Lo, M.-C.; Nguyen, T.A.; Matsuura, S.; Boyapati, A.; Pandit, S.; Fu, X.-D.; Zhang, D.-E. SON controls cell-cycle progression by coordinated regulation of RNA splicing. Mol. Cell 2011, 42, 185–198. [Google Scholar] [CrossRef] [PubMed]
- Weinstein, J.N.; Collisson, E.A.; Mills, G.B.; Shaw, K.R.M.; Ozenberger, B.A.; Ellrott, K.; Shmulevich, I.; Sander, C.; Stuart, J.M.; Network, C.G.A.R.; et al. The cancer genome atlas pan-cancer analysis project. Nat. Genet. 2013, 45, 1113. [Google Scholar] [CrossRef] [PubMed]
- Akbari, B.; Farajnia, S.; Ahdi Khosroshahi, S.; Safari, F.; Yousefi, M.; Dariushnejad, H.; Rahbarnia, L. Immunotoxins in cancer therapy: Review and update. Int. Rev. Immunol. 2017, 36, 207–219. [Google Scholar] [CrossRef] [PubMed]
- Cibulskis, K.; Lawrence, M.S.; Carter, S.L.; Sivachenko, A.; Jaffe, D.; Sougnez, C.; Gabriel, S.; Meyerson, M.; Lander, E.S.; Getz, G. Sensitive detection of somatic point mutations in impure and heterogeneous cancer samples. Nat. Biotechnol. 2013, 31, 213–219. [Google Scholar] [CrossRef] [PubMed]
- Lu, Z.; Yeh, T.-K.; Tsai, M.; Au, J.L.-S.; Wientjes, M.G. Paclitaxel-loaded gelatin nanoparticles for intravesical bladder cancer therapy. Clin. Cancer Res. 2004, 10, 7677–7684. [Google Scholar] [CrossRef]
- Park, D.C.; Kim, J.H.; Lew, Y.O.; Kim, D.H.; Namkoong, S.E. Phase II trial of neoadjuvant paclitaxel and cisplatin in uterine cervical cancer. Gynecol. Oncol. 2004, 92, 59–63. [Google Scholar] [CrossRef]
- Iorio, F.; Knijnenburg, T.A.; Vis, D.J.; Bignell, G.R.; Menden, M.P.; Schubert, M.; Aben, N.; Gonçalves, E.; Barthorpe, S.; Lightfoot, H.; et al. A landscape of pharmacogenomic interactions in cancer. Cell 2016, 166, 740–754. [Google Scholar] [CrossRef]
- Al-Lazikani, B.; Banerji, U.; Workman, P. Combinatorial drug therapy for cancer in the post-genomic era. Nat. Biotechnol. 2012, 30, 679–692. [Google Scholar] [CrossRef]
- Lee, J.H.; Park, Y.R.; Jung, M.; Lim, S.G. Gene regulatory network analysis with drug sensitivity reveals synergistic effects of combinatory chemotherapy in gastric cancer. Sci. Rep. 2020, 10, 3932. [Google Scholar] [CrossRef]
- Manica, M.; Oskooei, A.; Born, J.; Subramanian, V.; Sáez-Rodriguez, J.; Rodríguez Martínez, M. Toward explainable anticancer compound sensitivity prediction via multimodal attention-based convolutional encoders. Mol. Pharm. 2019, 16, 4797–4806. [Google Scholar] [CrossRef]
- Ali, M.; Aittokallio, T. Machine learning and feature selection for drug response prediction in precision oncology applications. Biophys. Rev. 2019, 11, 31–39. [Google Scholar] [CrossRef] [PubMed]
- Turki, T.; Wei, Z. A link prediction approach to cancer drug sensitivity prediction. BMC Syst. Biol. 2017, 11, 94. [Google Scholar] [CrossRef] [PubMed]
- Oskooei, A.; Manica, M.; Mathis, R.; Martinez, M.R. Network-based biased tree ensembles (NetBiTE) for drug sensitivity prediction and drug sensitivity biomarker identification in cancer. Sci. Rep. 2019, 9, 15918. [Google Scholar] [CrossRef] [PubMed]
- Mansilla, S.; Bataller, M.; Portugal, J. Mitotic catastrophe as a consequence of chemotherapy. Anti-Cancer Agents Med. Chem. 2006, 6, 589–602. [Google Scholar] [CrossRef][Green Version]
- Page, R.; Takimoto, C. Principles of chemotherapy. In Cancer Management: A Multidisciplinary Approach Medical, Surgical Radiation Oncology; Pazdur, R., Coia, L.R., Hoskins, W.J., Wagman, L.D., Eds.; PRR: New York, NY, USA, 2004; pp. 21–38. [Google Scholar]
- Nikanjam, M.; Riviere, P.; Goodman, A.; Barkauskas, D.A.; Frampton, G.; Kurzrock, R. Tumor mutational burden is not predictive of cytotoxic chemotherapy response. Oncoimmunology 2020, 9, 1781997. [Google Scholar] [CrossRef]
- Mei, P.; Freitag, C.E.; Wei, L.; Zhang, Y.; Parwani, A.V.; Li, Z. High tumor mutation burden is associated with DNA damage repair gene mutation in breast carcinomas. Diagn Pathol. 2020, 15, 1–7. [Google Scholar] [CrossRef]
- Burrell, R.A.; Swanton, C. Tumour heterogeneity and the evolution of polyclonal drug resistance. Mol. Oncol. 2014, 8, 1095–1111. [Google Scholar] [CrossRef]
- Wang, R.; Han, Y.; Zhao, Z.; Yang, F.; Chen, T.; Zhou, W.; Wang, X.; Qi, L.; Zhao, W.; Guo, Z.; et al. Link synthetic lethality to drug sensitivity of cancer cells. Brief. Bioinform. 2019, 20, 1295–1307. [Google Scholar] [CrossRef]
- Sachs, M.D.; Lenk, S.V. TP53 gene mutations as an independent marker for urinary bladder cancer progression. Int. J. Mol. Med. 2008, 21, 655–661. [Google Scholar]
- Pennington, K.P.; Walsh, T.; Lee, M.; Pennil, C.; Novetsky, A.P.; Agnew, K.J.; Thornton, A.; Garcia, R.; Mutch, D.; King, M.-C.; et al. BRCA1, TP53, and CHEK2 germline mutations in uterine serous carcinoma. Cancer 2013, 119, 332–338. [Google Scholar] [CrossRef]
- Forbes, S.A.; Beare, D.; Boutselakis, H.; Bamford, S.; Bindal, N.; Tate, J.; Cole, C.G.; Ward, S.; Dawson, E.; Ponting, L.; et al. COSMIC: Somatic cancer genetics at high-resolution. Nucleic Acids Res. 2017, 45, D777–D783. [Google Scholar] [CrossRef] [PubMed]
- Jones, D.; Raine, K.M.; Davies, H.; Tarpey, P.S.; Butler, A.P.; Teague, J.W.; Nik-Zainal, S.; Campbell, P.J. cgpCaVEManWrapper: Simple execution of CaVEMan in order to detect somatic single nucleotide variants in NGS data. Curr. Protoc. Bioinform. 2016, 56, 10–15. [Google Scholar] [CrossRef] [PubMed]
- Ye, K.; Schulz, M.H.; Long, Q.; Apweiler, R.; Ning, Z. Pindel: A pattern growth approach to detect break points of large deletions and medium sized insertions from paired-end short reads. Bioinformatics 2009, 25, 2865–2871. [Google Scholar] [CrossRef] [PubMed]
- Greenman, C.D.; Bignell, G.; Butler, A.; Edkins, S.; Hinton, J.; Beare, D.; Swamy, S.; Santarius, T.; Chen, L.; Widaa, S.; et al. PICNIC: An algorithm to predict absolute allelic copy number variation with microarray cancer data. Biostatistics 2010, 11, 164–175. [Google Scholar] [CrossRef] [PubMed]
- Siva, N. 1000 Genomes project. Nat. Biotechnol. 2008, 26, 256. [Google Scholar] [CrossRef] [PubMed]
- McLaren, W.; Gil, L.; Hunt, S.E.; Riat, H.S.; Ritchie, G.R.S.; Thormann, A.; Flicek, P.; Cunningham, F. The ensembl variant effect predictor. Genome Biol. 2016, 17, 122. [Google Scholar] [CrossRef]
- Vaser, R.; Adusumalli, S.; Leng, S.N.; Sikic, M.; Ng, P.C. SIFT missense predictions for genomes. Nat. Protoc. 2016, 11, 1. [Google Scholar] [CrossRef]
- Csardi, G.; Nepusz, T. The igraph software package for complex network research. Int. J. Complex. Syst. 2006, 1695, 1–9. [Google Scholar]
- Bastian, M.; Heymann, S.; Jacomy, M. Gephi: An open source software for exploring and manipulating networks. In Proceedings of the Third International AAAI Conference on Weblogs and Social Media, California, CA, USA, 17–20 May 2009. [Google Scholar]
- Blondel, V.D.; Guillaume, J.-L.; Lambiotte, R.; Lefebvre, E. Fast unfolding of communities in large networks. J. Stat. Mech. Theory Exp. 2008, 2008, P10008. [Google Scholar] [CrossRef]
- Ashburner, M.; Ball, C.A.; Blake, J.A.; Botstein, D.; Butler, H.; Cherry, J.M.; Davis, A.P.; Dolinski, K.; Dwight, S.S.; Eppig, J.T.; et al. Gene ontology: Tool for the unification of biology. Nat. Genet. 2000, 25, 25–29. [Google Scholar] [CrossRef]
- Kanehisa, M.; Goto, S. KEGG: Kyoto encyclopedia of genes and genomes. Nucleic Acids Res. 2000, 28, 27–30. [Google Scholar] [CrossRef] [PubMed]
- Chang, J.T.; Nevins, J.R. GATHER: A systems approach to interpreting genomic signatures. Bioinformatics 2006, 22, 2926–2933. [Google Scholar] [CrossRef] [PubMed]
- Fresno, C.; Fernández, E.A. RDAVIDWebService: A versatile R interface to DAVID. Bioinformatics 2013, 29, 2810–2811. [Google Scholar] [CrossRef] [PubMed]
- Ploner, M.; Heinze, G. coxphf: Cox regression with Firth’s penalized likelihood. R Found. Stat. Comput. 2015. Available online: https://CRAN.R-project.org/package=coxphf (accessed on 22 January 2021).


| Clinical Variables | Bladder Cancer | Uterine Cancer | ||
|---|---|---|---|---|
| TP53 (+) | TP53 (−) | TP53 (+) | TP53 (−) | |
| N | 212 | 194 | 199 | 272 |
| Age | 63.73 (9.87) | 63.01 (11.87) | 61.98 (9.88) | 58.31 (11.24) |
| Survival | ||||
| Alive | 151 | 145 | 178 | 252 |
| Dead | 61 | 49 | 21 | 45 |
| Gender | ||||
| Male | 153 | 149 | 0 | 0 |
| Female | 59 | 47 | 199 | 272 |
| Stage | ||||
| I | 0 | 2 | 98 | 189 |
| II | 63 | 67 | 20 | 25 |
| III | 74 | 64 | 63 | 50 |
| IV | 75 | 59 | 18 | 8 |
Publisher’s Note: MDPI stays neutral with regard to jurisdictional claims in published maps and institutional affiliations. |
© 2021 by the authors. Licensee MDPI, Basel, Switzerland. This article is an open access article distributed under the terms and conditions of the Creative Commons Attribution (CC BY) license (http://creativecommons.org/licenses/by/4.0/).
Share and Cite
Lee, J.H.; Lee, K.H.; Kim, J.H. In Silico Inference of Synthetic Cytotoxic Interactions from Paclitaxel Responses. Int. J. Mol. Sci. 2021, 22, 1097. https://doi.org/10.3390/ijms22031097
Lee JH, Lee KH, Kim JH. In Silico Inference of Synthetic Cytotoxic Interactions from Paclitaxel Responses. International Journal of Molecular Sciences. 2021; 22(3):1097. https://doi.org/10.3390/ijms22031097
Chicago/Turabian StyleLee, Jeong Hoon, Kye Hwa Lee, and Ju Han Kim. 2021. "In Silico Inference of Synthetic Cytotoxic Interactions from Paclitaxel Responses" International Journal of Molecular Sciences 22, no. 3: 1097. https://doi.org/10.3390/ijms22031097
APA StyleLee, J. H., Lee, K. H., & Kim, J. H. (2021). In Silico Inference of Synthetic Cytotoxic Interactions from Paclitaxel Responses. International Journal of Molecular Sciences, 22(3), 1097. https://doi.org/10.3390/ijms22031097