Article

The Carbohydrate Metabolism of Lactiplantibacillus plantarum

1
Department of Food Nutrition and Health, School of Medicine and Health, Harbin Institute of Technology, Harbin 150001, China
2
Institute of Microbiology, Heilongjiang Academy of Sciences, Harbin 150010, China
*
Author to whom correspondence should be addressed.
Int. J. Mol. Sci. 2021, 22(24), 13452; https://doi.org/10.3390/ijms222413452
Submission received: 4 November 2021 / Revised: 9 December 2021 / Accepted: 10 December 2021 / Published: 15 December 2021
(This article belongs to the Section Molecular Endocrinology and Metabolism)

Abstract

:
Lactiplantibacillus plantarum has a strong carbohydrate utilization ability. This characteristic plays an important role in its gastrointestinal tract colonization and probiotic effects. L. plantarum LP-F1 presents a high carbohydrate utilization capacity. The genome analysis of 165 L. plantarum strains indicated the species has a plenty of carbohydrate metabolism genes, presenting a strain specificity. Furthermore, two-component systems (TCSs) analysis revealed that the species has more TCSs than other lactic acid bacteria, and the distribution of TCS also shows the strain specificity. In order to clarify the sugar metabolism mechanism under different carbohydrate fermentation conditions, the expressions of 27 carbohydrate metabolism genes, catabolite control protein A (CcpA) gene ccpA, and TCSs genes were analyzed by quantitative real-time PCR technology. The correlation analysis between the expressions of regulatory genes and sugar metabolism genes showed that some regulatory genes were correlated with most of the sugar metabolism genes, suggesting that some TCSs might be involved in the regulation of sugar metabolism.

1. Introduction

Lactiplantibacillus plantarum is a highly versatile and flexible species that distributes in a wide variety of habitats such as vegetables, dairy product, meat, as well as grass silage [1,2,3]. Furthermore, it can also be found in the human body as a natural inhabitant, for example in the saliva [4] and gastrointestinal tract of humans [5]. Some studies have demonstrated that L. plantarum possesses some beneficial functions for host, such as maintaining the balance of gastrointestinal flora, improving self-immunity of host, promoting effective absorption of nutrients, reducing cholesterol content, and alleviating lactose intolerance [6].
L. plantarum has been widely used in the production of various fermented foods as a starter culture, giving to the flavor, texture, and organoleptic properties of products. It could produce some bioactive substances such as exopolysaccharides, γ-aminobutyric acid, folic acid, and riboflavin, which offer functional properties of the fermented foods with the species [7,8,9]. Furthermore, it can be used as a food preservative in food processing and preservation via the production of bacteriocin and organic acid [6].
Sugars are important energy and structural substances in bacteria. Compared with most lactic acid bacteria (LAB), L. plantarum presents a stronger carbohydrate utilization capability, which contributes to a broad adaptability in various environments with different carbohydrates [10,11,12,13]. The species could not only use cellobiose, mannose, D-ribose, and L-fucose, but also ferment prebiotics fructooligosaccharides (FOS) and galactooligosaccharide (GOS) [13,14]. The organism contains a comprehensive carbohydrate utilization system composed of a plenty of sugar uptake and metabolism related genes, which endow its strong carbohydrate utilization ability [4]. The number of these sugar metabolism related genes is far more than those found in other lactic acid bacterial genomes [4]. Different L. plantarum strains show various carbohydrate utilization profiles [10,12,13].
Researchers pay attention to the unique characteristics and strong adaptive ability of L. plantarum. Up to July 2021, 612 L. plantarum strains have been sequenced at the genome level. Among these strains, the complete genome sequences of 149 strains have been finished, and 11, 254, and 198 strains are under chromosome, contig, and scaffold stages, respectively. Compared with other LAB species genomes, L. plantarum genomes have larger sizes, ranging from 2.91 to 3.70 Mb. The large size of genome might have a close relationship with the ability of this bacterium to inhabit diverse environmental niches [15]. Furthermore, extensive post-genomic analyses have been performed on L. plantarum species in recent years [12,16,17,18].
Two-component systems (TCSs) are important signal transduction systems in most Gram-positive and Gram-negative bacteria, regulating diverse physiological processes and metabolisms, such as bacteriocin biosynthesis, proteolytic ability, acid tolerance ability, antibiotic resistance, and virulence factor production [19,20,21,22]. TCS is composed of a sensor histidine protein kinase (HPK) and a response regulatory protein (RR) [21]. HPK is responsible for receiving the environmental signals, and RR is involved in the regulation of the target genes [21].
Compared with other LAB species, more TCSs are found in the L. plantarum genome. Generally, L. plantarum strains contain 13–14 TCSs, while Lactobacillus delbrueckii subsp. bulgaricus strains have 5–7 TCSs, S. thermophilus strains possess 6–8 TCSs [4,23,24]. It is speculated that a large number of TCSs facilitate and improve the survival ability and adaptability of the species in various environments. It is worth noting that five TCSs in L. plantarum are belong to components of quorum sensing systems by in silico analysis [25].
A TCS consisting of an HPK PlnB and two RRs PlnC and PlnD has been identified to be responsible for the plantaricin biosynthesis in L. plantarum [26]. Furthermore, an agr-like TCS LamCA has been demonstrated to be involved in the regulation of bacterial adherence via a cyclic peptide as a signal in L. plantarum WCFS1 [27]. In addition, the LamK (HPK10) and LamR (RR10) are highly homologous to the LamC and LamA, respectively, and their amino acid sequences identities are 55% and 70% [28]. The cooperative effect of LamA and LamR has been revealed by means of a series of experiments, including transcription analysis of the lamKR operon and the lamBDCA operon, liquid chromatography-mass spectrometry analysis of production of the LamD558 autoinducing peptide, and mutant analysis. The ΔlamA and ΔlamAΔlamR mutants (the lamA and lamR double-knockout mutant) reduced adherence to glass surfaces, the latter with more significant reduced adherence ability to glass surfaces than the former [28]. The LamA and LamR regulated the expressions of cell wall polysaccharide synthesis genes, stress response-related genes, and cell wall protein-encoding genes. Although the sequences of some TCSs in the L. plantarum show similarity with those of known function TCSs in other species, the functions of these TCSs are not clear in the species.
In our previous study, L. plantarum LP-F1 was isolated from fermented milk, presenting an outstanding fermentation ability and bioactive substance biosynthesis capability [29]. In the present study, the genome of L. plantarum LP-F1 has been sequenced. The carbohydrate metabolism related genes of 165 L. plantarum strains containing LP-F1 strain have been analyzed in order to reveal the differences of different strains of same species in the carbohydrate metabolism at molecular levels. Furthermore, the expressions of key sugar metabolism genes of LP-F1 strain under the conditions with prebiotics FOS and inulin were determined for clarifying the relationship of different sugar metabolism pathways. As important signal transduction and regulation systems, the expressions of catabolite control protein A (CcpA) and TCS genes were analyzed during the carbohydrate metabolism in order to reveal their roles in bacterial carbohydrate utilization. Moreover, correlation analysis between the expressions of regulated genes and different sugar metabolism related genes was performed in order to establish their relationships and guild a basement for the regulation in sugar metabolism in application in the future.

2. Results

2.1. The Sugar Fermentation Capacity of L. plantarum Strains

The sugar fermentation capacities of L. plantarum strains LP-F1, LP-E1, LP-A4, LP-I5, LP-1, and LP-4 isolated from fermented milk samples were evaluated (Supplementary Table S1). All tested strains could utilize D-glucose, D-galactose, D-fructose, D-lactose, D-sucrose, D-maltose, D-mannose, D-salicin, D-xylose, D-ribose, D-mannitol, and D-sorbitol, while they could not ferment galactitol, L-fucose, L-rhamnose, and D-melibiose. In addition, these strains present different abilities to ferment D-mannitol, D-sorbitol, L-arabinose, L-sorbose, and D-melezitose. It is worth noting that these strains could metabolize FOS and inulin. These strains present different sugar fermentation capacities. The results are consistent with the previous studies [10,12,13]. It is found that L. plantarum strains LP-F1 presented a strong sugar fermentation ability among these tested strains, especially in the FOS and inulin metabolism. The capability to utilize carbohydrates depends on the presence of a functional transport system and intracellular metabolic pathways. The genome of LP-F1 was sequenced in order to reveal its carbohydrate metabolism related genes.

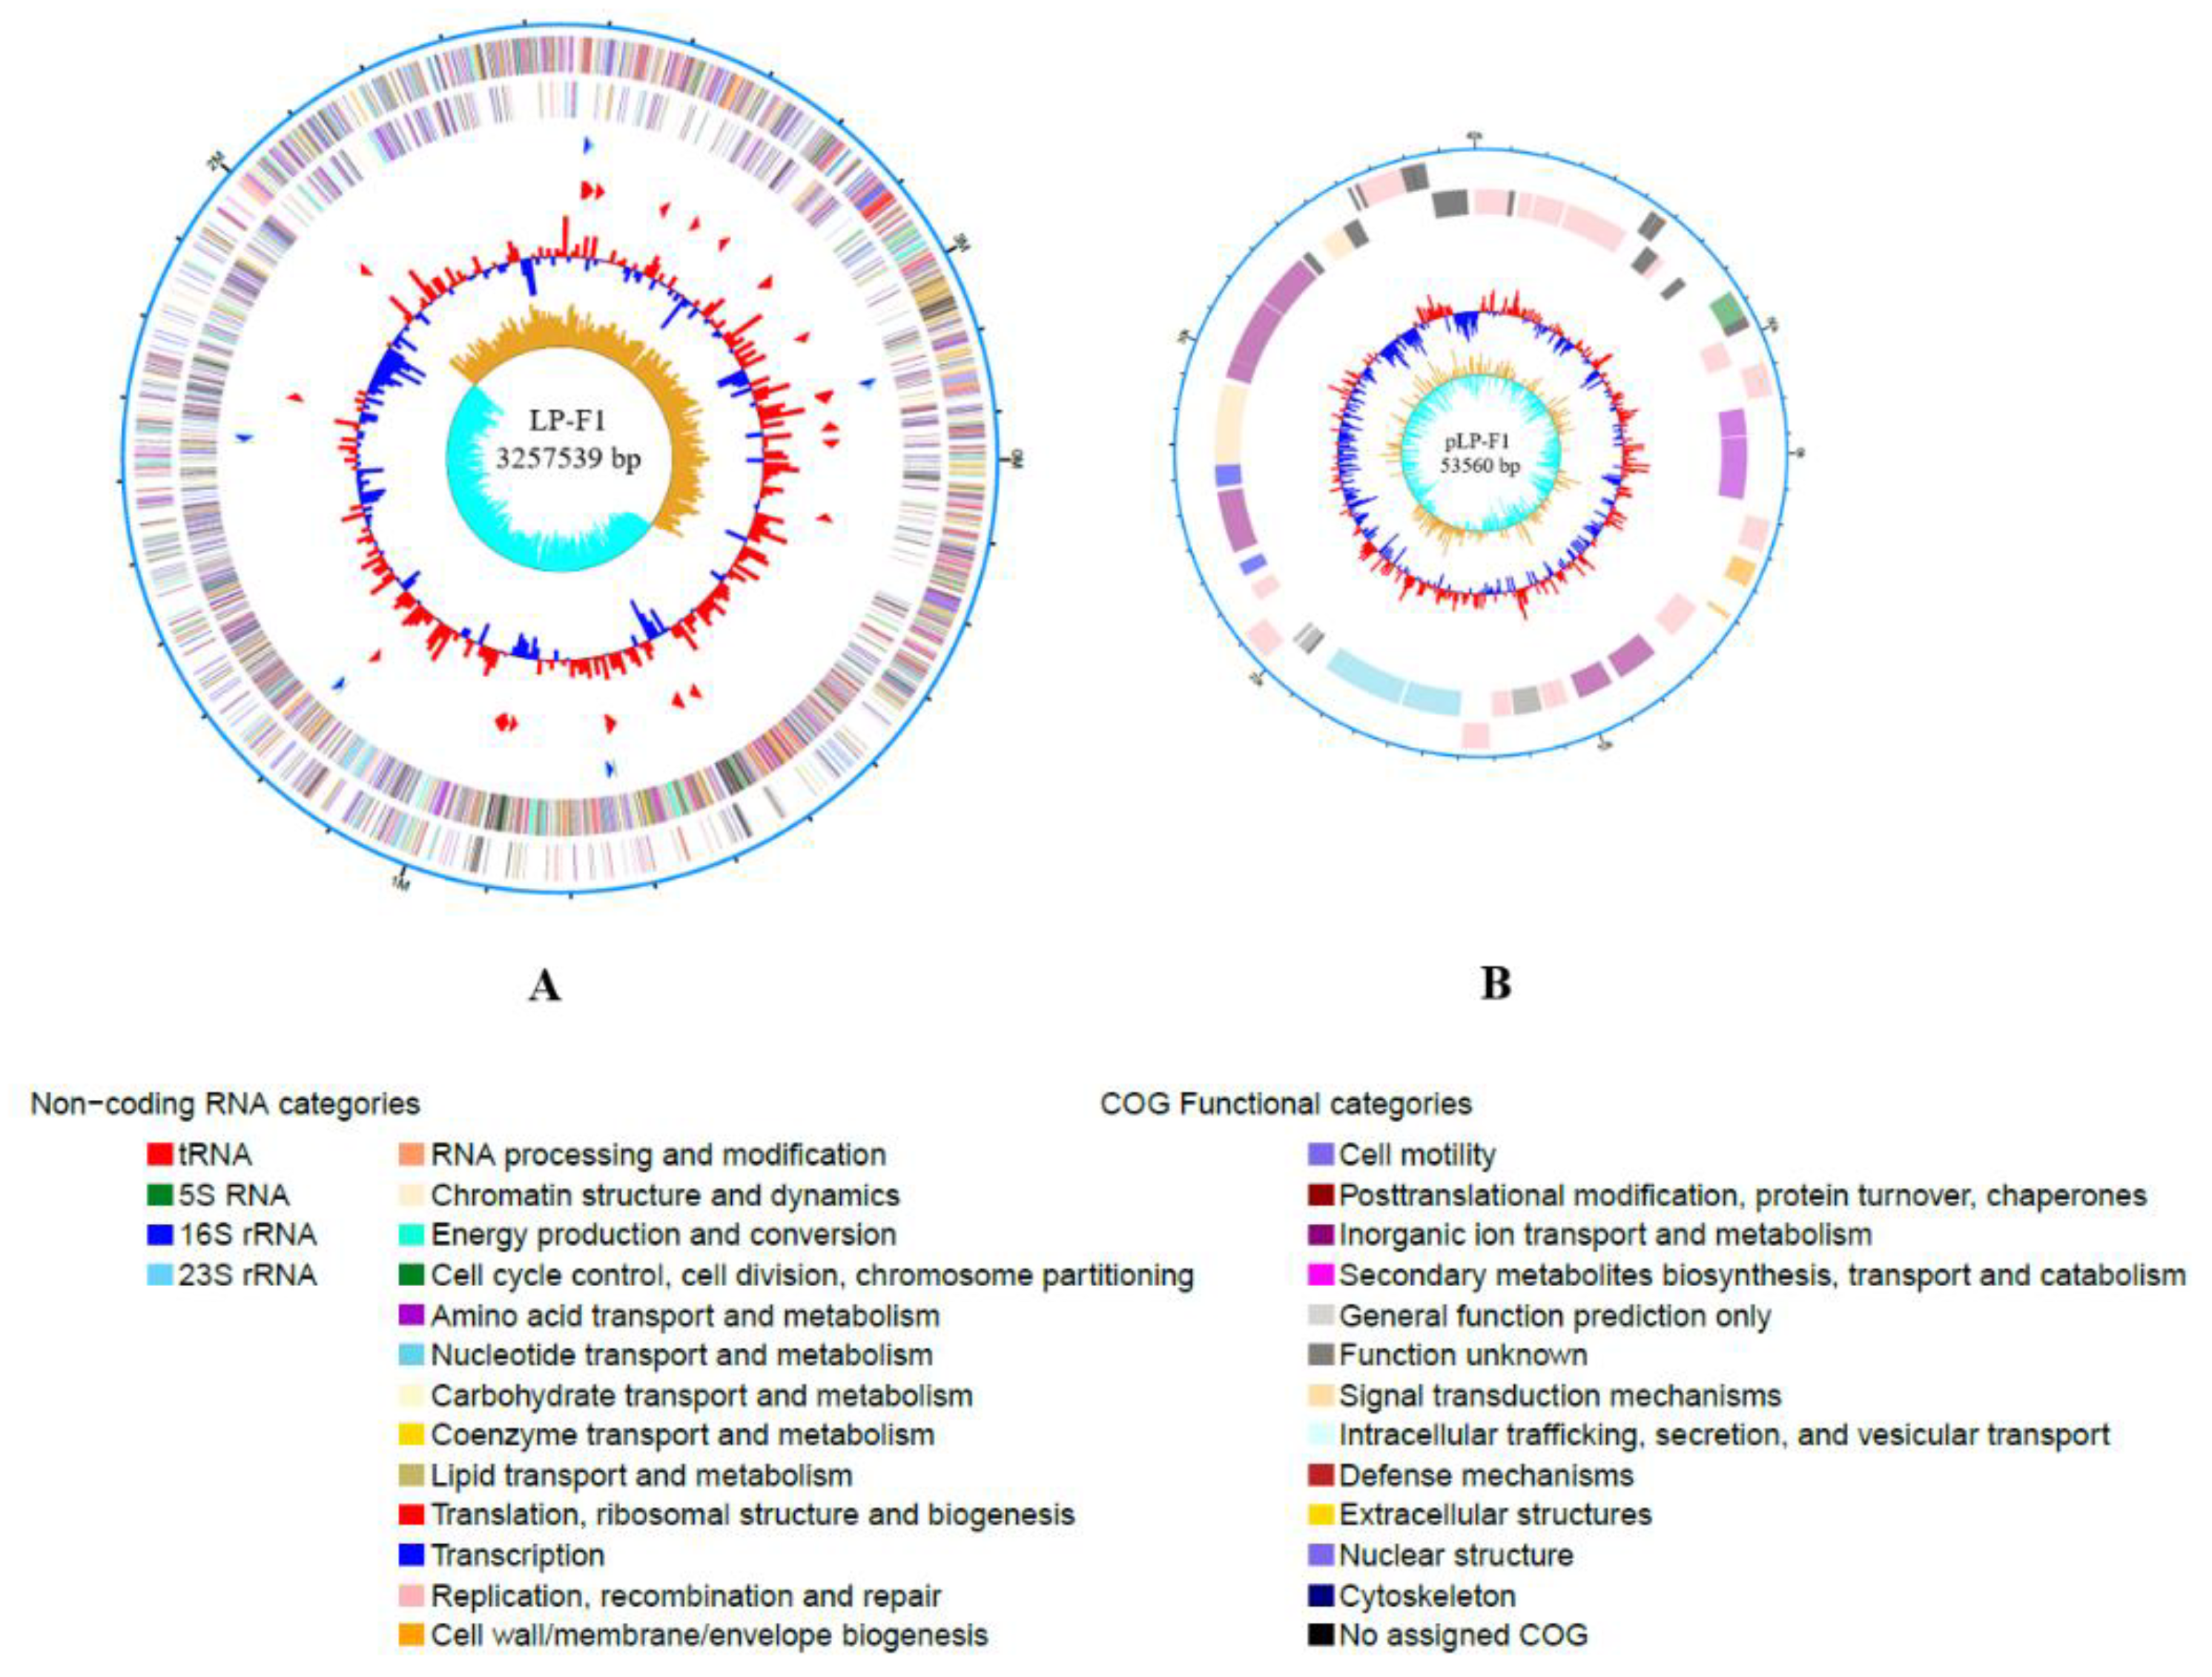
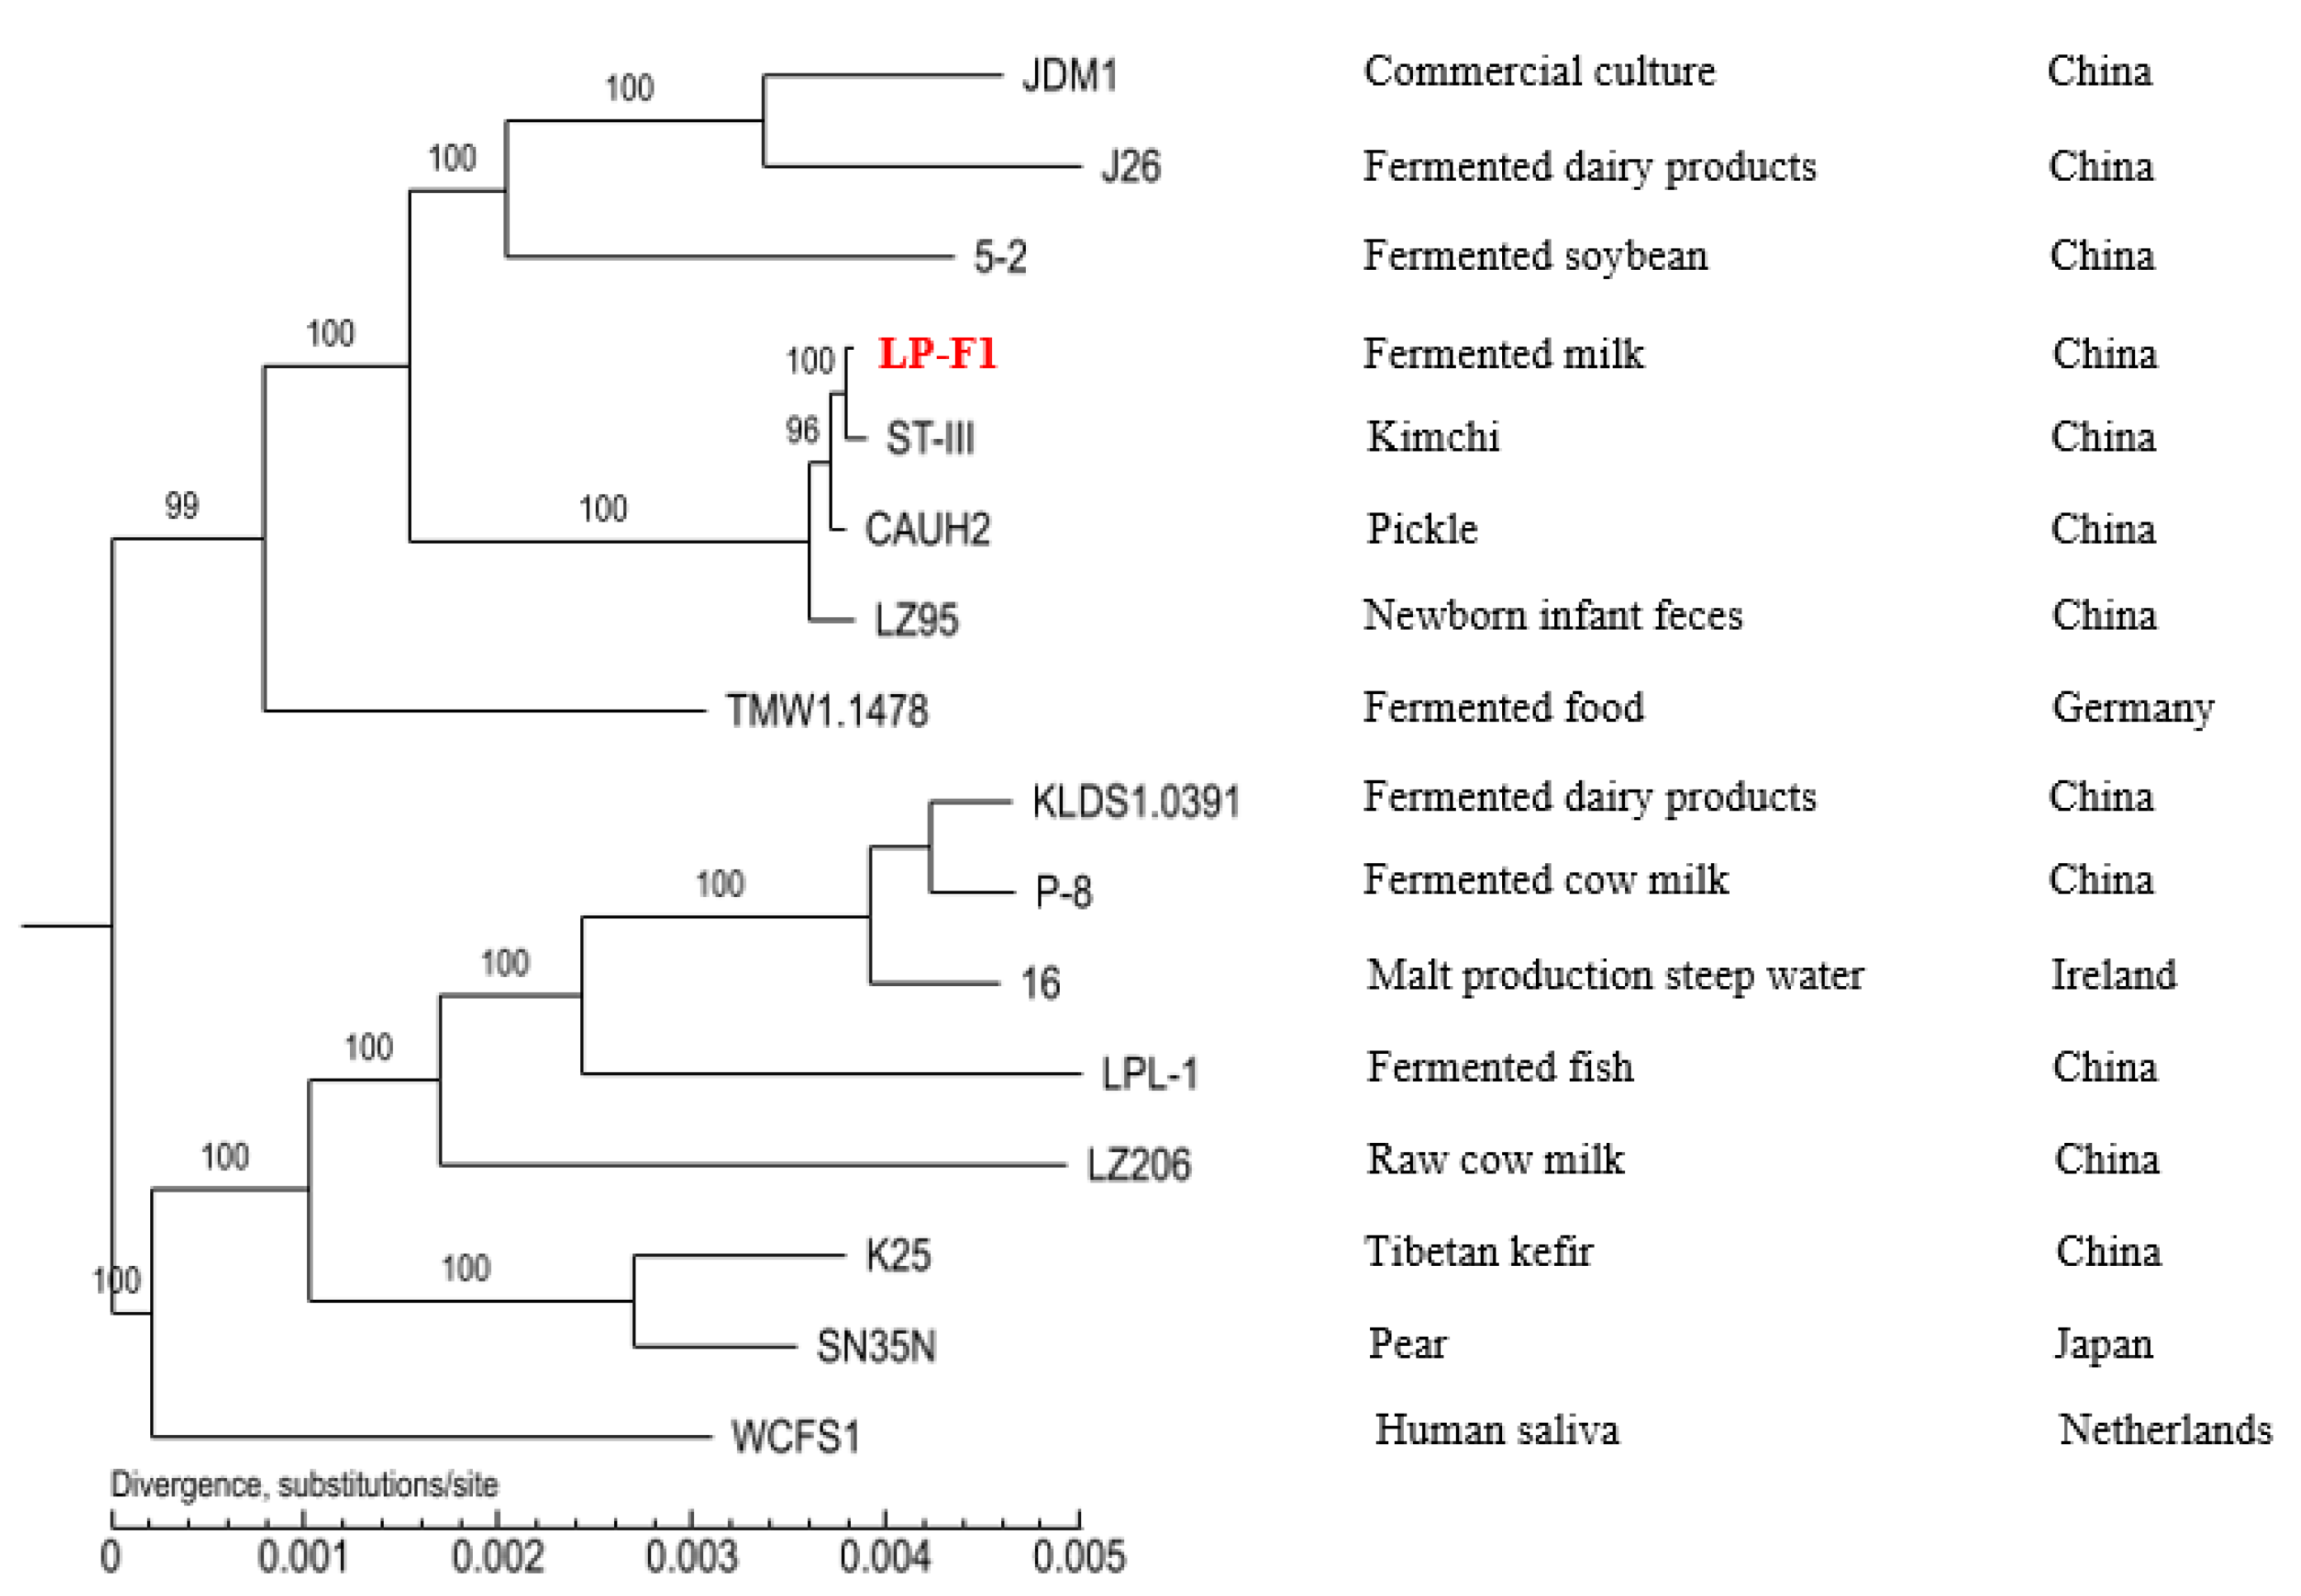
2.2. Genomic Analysis of L. plantarum Strain LP-F1

L. plantarum LP-F1 genome was sequenced by a combination of Pacbio RS and Illumina sequencing technology. LP-F1 contains one chromosome (3, 257, 539 bp), and one plasmid pLP-F1 (53, 560 bp), both of which are circular in molecular type, as shown in Figure 1. 15 L. plantarum strains genomes available in NCBI databases were used in a phylogenetic analysis with LP-F1 (Supplementary Table S2). It is found that the length of L. plantarum genomes ranged from 2.99 to 3.79 Mb, the G + C% contents were 43.3–46.5%. Compared with other L. plantarum strains, the genome size of LP-F1 is medium.
In this study, the phylogenetic analysis of 16 L. plantarum strains isolated from various environments was carried out based on the conserved proteins detected in all tested genome sequences (Figure 2). These strains were obtained from different environments, such as fermented dairy products, fermented fish, fermented vegetables, raw milk, fruit, infant feces, and human saliva [4,30,31,32,33,34,35,36,37].
Seven strains from China are clustered into the same branch. However, K25 and SN35N are clustered together, which were from China and Japan, respectively [32,34]. Strain 16 from Ireland has a closer relationship with KLDS1.0391 and P-8 than those of other strains from China [30,31,35]. Therefore, it could be concluded that the phylogenetic reconstruction based on the sequenced genomes of strains was not obviously associated with their geographic distributions.
Furthermore, strains from different isolation sources were also clustered together. For example, strains LP-F1, ST-III, and CAUH2 are clustered on the same branch, while the former from fermented milk and the latter two from fermented vegetables [36,37]. The results indicated that the survival environments of strains are not resulting in the differences in their genomes. The results were consistent with those of previous studies [18,38].

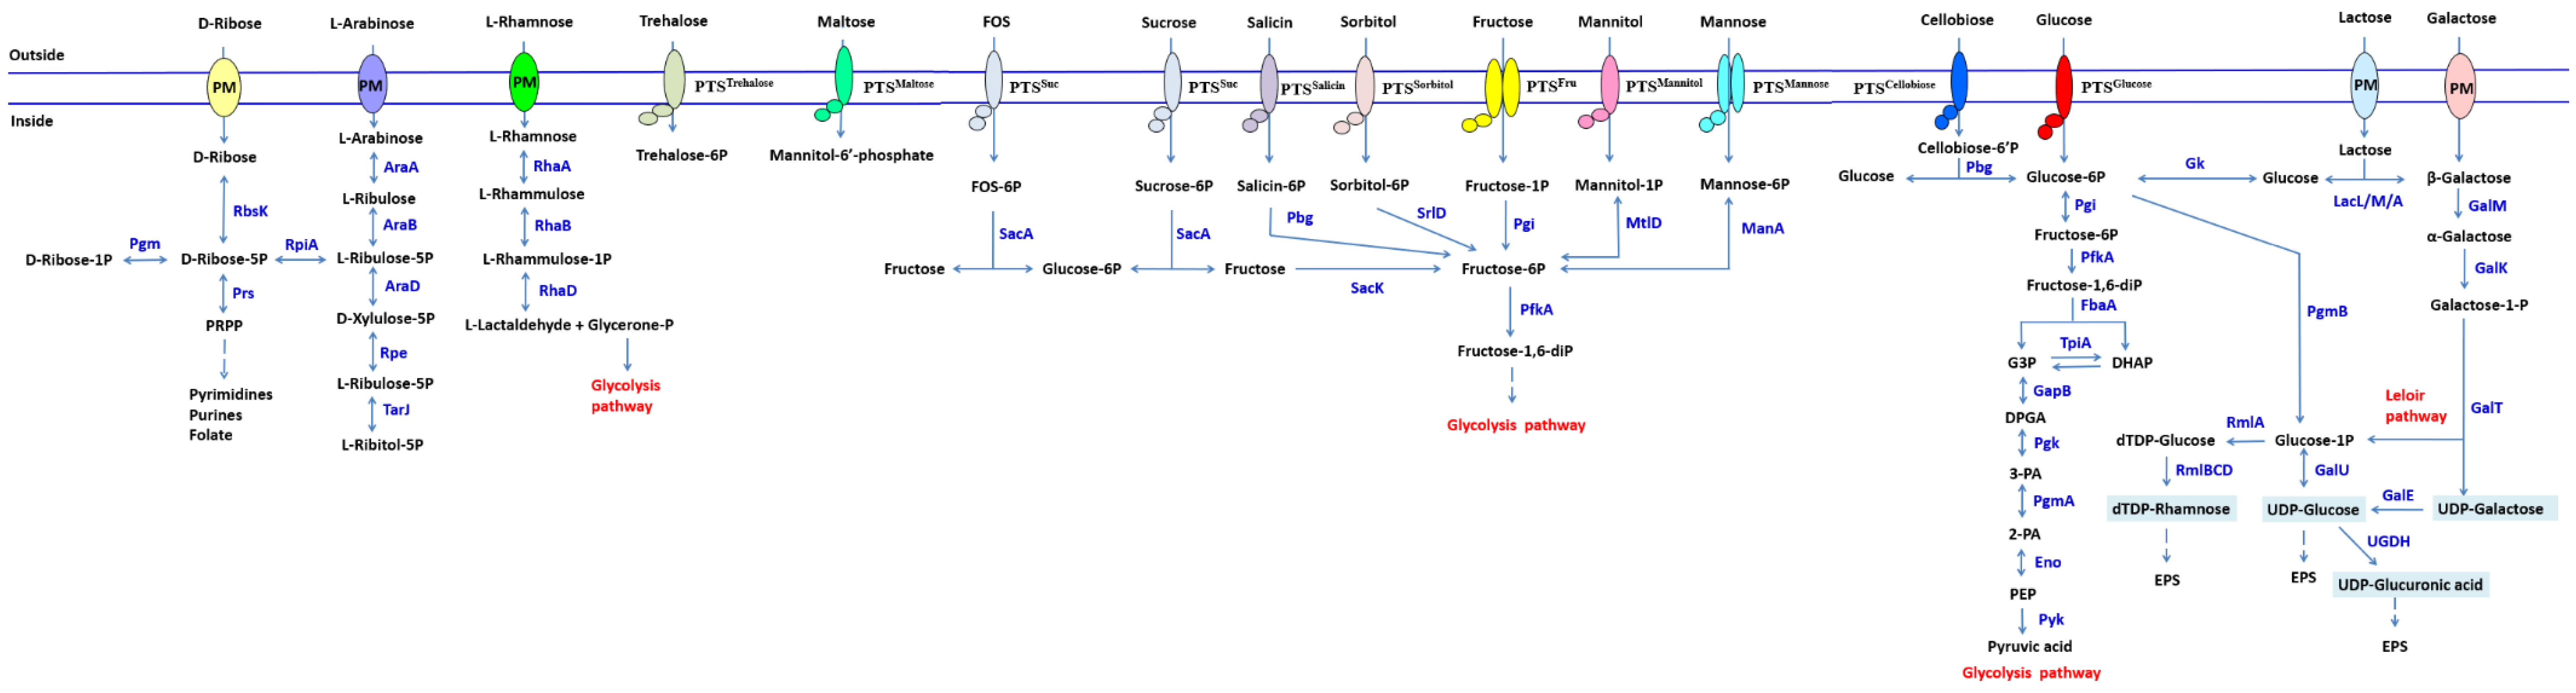
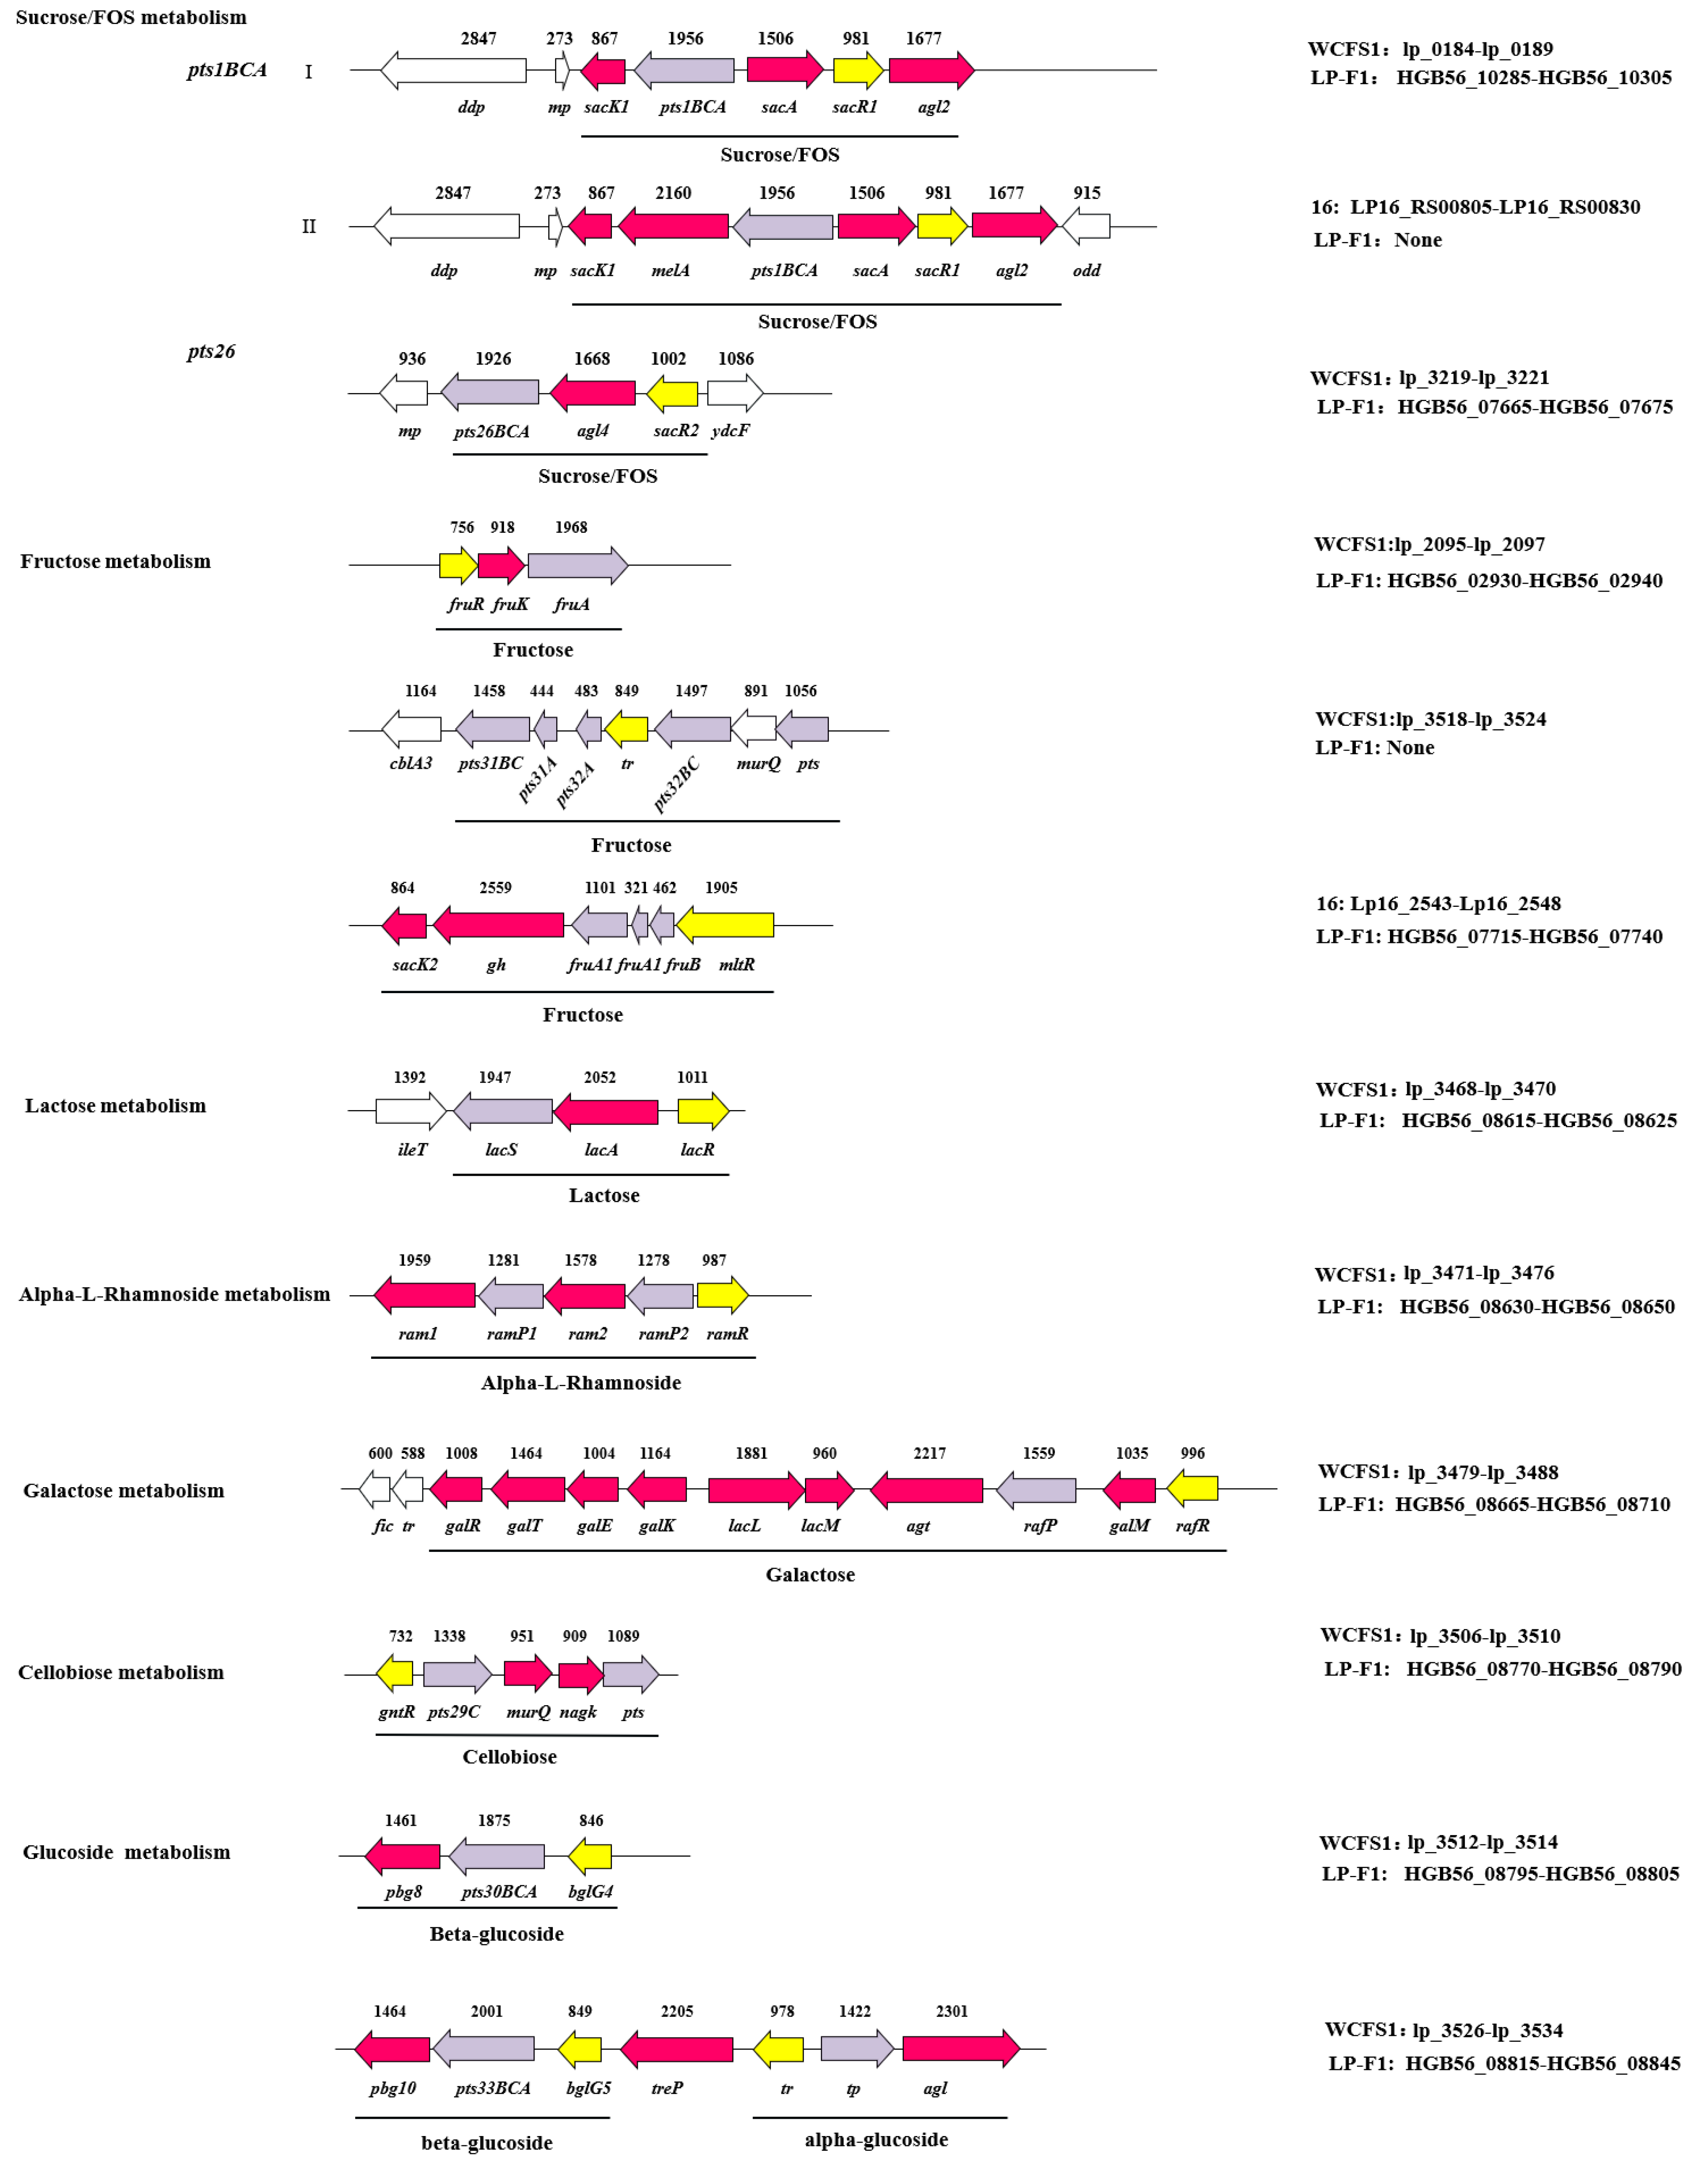
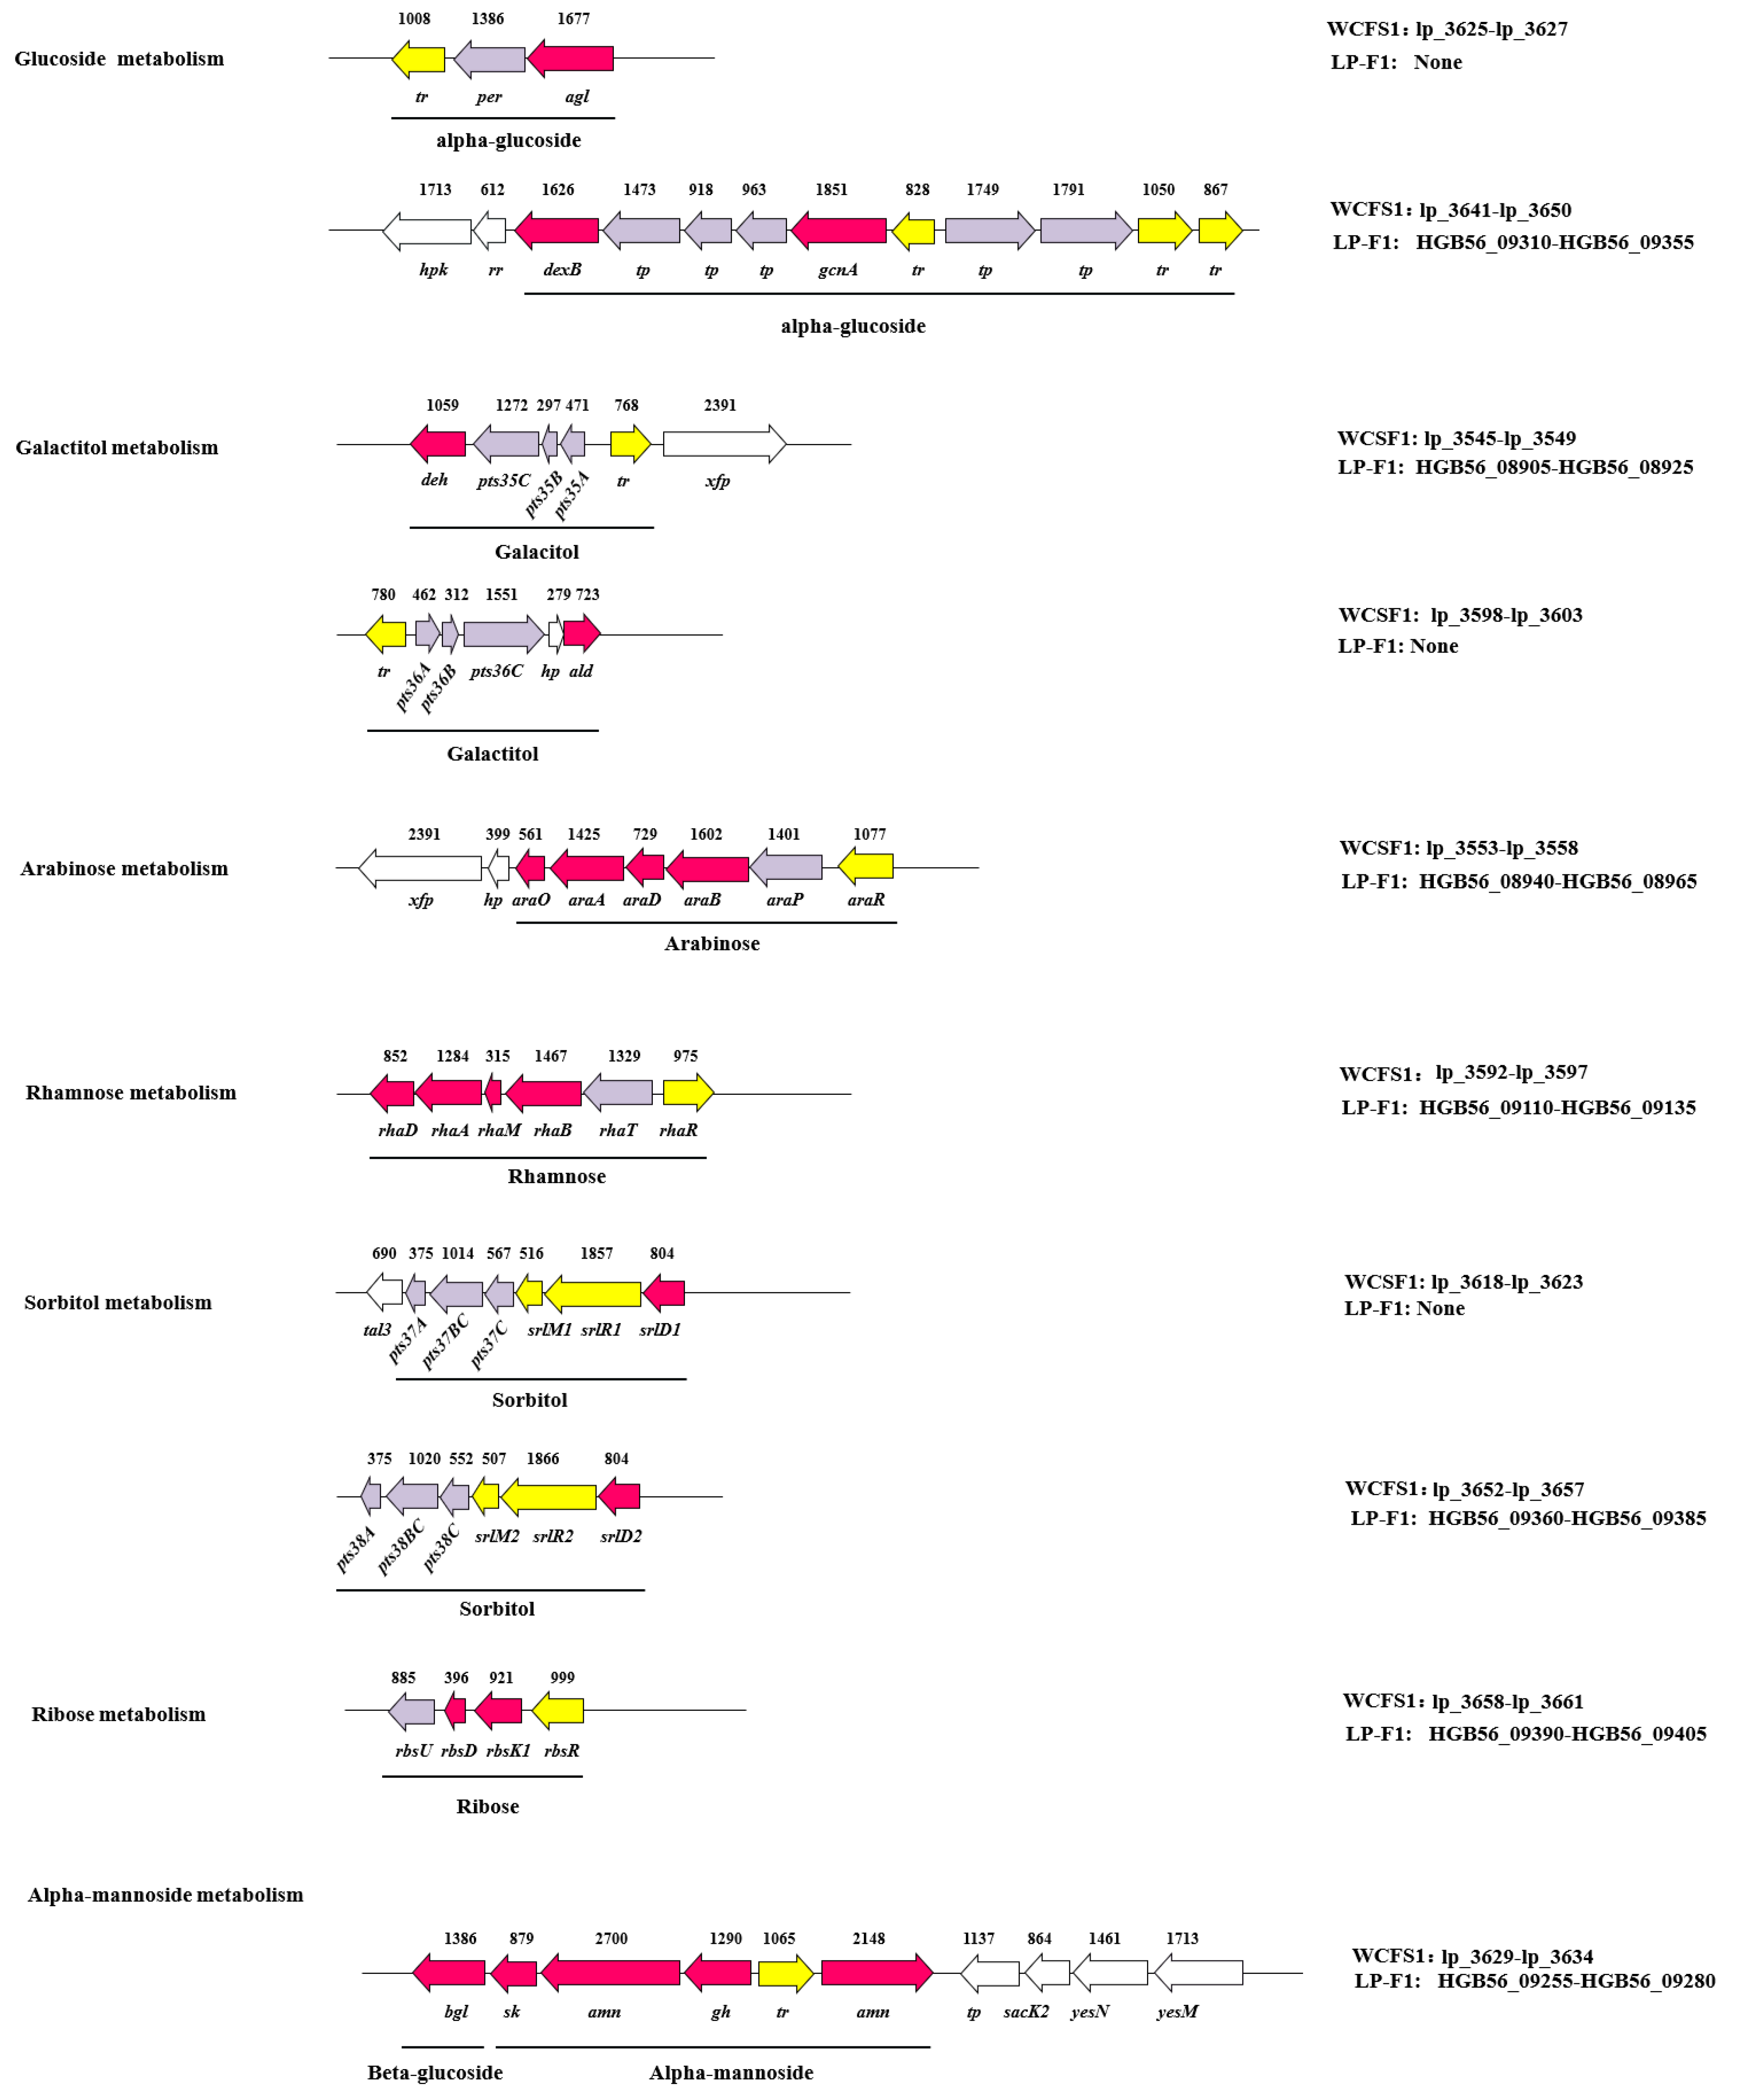
2.3. Carbohydrate Metabolism Systems Analysis of LP-F1 Based on the Genome

L. plantarum is a heterofermentative lactic acid bacterium, which possesses both glycolysis and phosphoketolase pathways. The genes encoding enzymes responsible for these two pathways have been found on the strain LP-F1’s chromosome. Bioinformatics analysis revealed that LP-F1 strain possesses a plenty of carbohydrate utilization genes (Figure 3 and Figure 4, Supplementary Table S3-1-1). There are 130 enzymes related to carbohydrate metabolism in L. plantarum LP-F1 based on the CAZy analysis, which belong to auxiliary activities (AAs, 9), carbohydrate-binding modules (CBMs, 17), carbohydrate esterases (CEs, 16), glycoside hydrolases (GHs, 53), and glycosyl transferases (GTs, 35) (Supplementary Table S3-1-2). Some enzymes belong to two classes.

2.3.1. Monosaccharide and Disaccharide

Glucose

L. plantarum transports glucose through PTS11ABC encoded by pts11A and pts11BC, and glucose enters cells in the form of 6-phosphate-glucose. The latter is transformed into 6-phosphate-fructose by 6-phosphate-glucose isomerase (pgi) and metabolized by glycolysis pathway (Figure 3). The most genes encoding enzymes in the glycolysis pathway located in two operons HGB56_12590-HGB56_12605 and HGB56_01890-HGB56_01895 (Supplementary Table S3-1). The organization is similar to those in the other LAB. It was considered that this genetic linkage is beneficial for the regulation of expressions of these enzymes according to the change of the level and type of available sugars in the habitat [4]. Furthermore, two phosphopyruvate hydratases were found in the genome.

Lactose and Galactose

The lactose is fermented by the lactose gene cluster (HGB56_08615-HGB56_08625), encoding a lactose permease (lacS, HGB56_08615), a beta-galactosidase (lacA, HGB56_08620) and a regulator protein(lacR, HGB56_08625). Except few strains, for examples LZ206, KLDS1.0391, 16, and P-8, most strains have this gene cluster (Supplementary Table S3-2). The gene cluster was also found in the Lactiplantibacillus argentoratensis, Lactiplantibacillus paraplantarum, and Lactiplantibacillus pentosus (Supplementary Table S3-2). The lactose entered cell by the permease, and was catalyzed by beta-galactosidase, producing galactose and glucose.
The galactose is metabolized via Leloir pathway. A gal operon galKETRM is involved in encoding of enzymes of the Leloir pathway in L. plantarum LP-F1, consisting of a galactokinase gene galK (HGB56_08680), an UDP-galactose 4-epimerase gene galE (HGB56_08675), a galactose-1-phosphate uridylyltransferase gene galT (HGB56_08670), a repressor protein gene galR (HGB56_08665), a galactose mutarotase gene galM (HGB56_08705). Furthermore, the genes lacL (HGB56_08685) and lacM (HGB56_08690) encode large subunit and small subunit of beta-galactosidase, respectively. The gene HGB56_08695 encodes an alpha-galactosidase. The gene HGB56_08700 encodes an MFS transporter. The locus is present in most L. plantarum strains (Supplementary Table S3-3).

Fructose and Sucrose

The strain LP-F1 contained multiple phosphotransferase systems (PTSs) responsible for fructose transport, which were encoded by fruA (HGB56_02940), fruA1-fruA2-fruB (HGB56_07725, HGB56_07730, HGB56_07735), pts9ABCD (HGB56_11950, HGB56_11955, HGB56_11960) and pts10AB (HGB56_11975, HGB56_11980) genes, respectively (Supplementary Table S3-4). Fructose enters cells in the form of 6-phosphate-fructose through these PTSs, then 6-phosphate-fructose is transformed into 1, 6-2P-fructose at the action of phosphofructokinase encoded by pfk gene, and enters the glycolysis pathway (Figure 3).
The sacPTS1 gene cluster is involved in sucrose metabolism in L. plantarum, encoding fructokinase (sacK1), sucrose PTS (pts1BCA), 6-phosphate sucrose hydrolase (scrB, also known as sacA), sucrose operon repressor protein (srcR, also known as sacR1) and α-glucosidase (agl2) (Figure 3, Supplementary Table S3-5). Furthermore, the gene cluster is also involved in FOS utilization [39].

Arabinose

A gene cluster (HGB56_08940-HGB56_08965) related to the L-arabinose metabolism was found in the strain LP-F1, encoding a arabinose O-acetyltransferase (HGB56_08940), L-arabinose isomerase (araA, HGB56_08945), L-ribulose 5-phosphate 4-epimerase (araD, HGB56_08950), L-ribulokinase (araB, HGB56_08955), arabinose transporter (araP, HGB56_08960), transcription regulator (araR, HGB56_08965, GntR family), and hypothetical protein (HGB56_08935). The strains WCFS1, LP-F1, JDM1, 5-2, SN35N, K25, ST-III, CAUH2, J26, and LZ95 possess the gene cluster (Supplementary Table S3-6). Some strains have not the gene cluster, for examples, LZ206, KLDS1.0391, 16, LPL-1, P-8, and TMW1.1478. Furthermore, the arabinose gene cluster has been found in a few L. paraplantarum and L. pentosus strains.
The previous study revealed the arabinose gene cluster indeed perfectly correlates with the growth ability on the medium containing L-arabinose via the analysis of the relationship between the fermentation experiment and genome sequences (i.e., the strain with the gene cluster could grow on L-arabinose, while the strain without the gene cluster does not grow on L-arabinose) [12,17].

Rhamnose

The rhamnose gene cluster rhaDAMBTR (HGB56_09110-HGB56_09135) was identified in the strain LP-F1, composed of a rhamnulose-1-phosphate aldolase gene (rhaD, HGB56_09110), a L-rhamnose isomerase gene (rhaA, HGB56_09115), a L-rhamnose mutarotase gene (rhaM, HGB56_09120), a rhamnulokinase gene (rhaB, HGB56_09125), a beta-rhamnose transporter gene (major facilitator superfamily, rhaT, HGB56_09130), and a transcription regulator gene (rhaR, HGB56_09135). It is worth noting the L-rhamnose isomerase gene is a pseudo gene in strain LP-F1, which probably influences the L-rhamnose utilization. The strains WCFS1, JDM1, 5-2, TMW 1.1478, LPL-1, LZ95, CAUH2, and ST-III contain rhaDAMBTR (Supplementary Table S3-7). However, the gene cluster is absent in some strains, such as LZ206, KLDS1.0391, 16, SN35N, K25, P-8, and J26. In addition, the rhamnose gene cluster is present in a few L. pentosus, Latilactobacillus sakei, Ligilactobacillus salivarius, Pediococcus acidilactici, and Pediococcus pentosaceus strains.

2.3.2. Sugar Alcohol

Galactitol

The gene cassette (HGB56_08905- HGB56_08920) is involved in uptake and metabolism of galactitol, consisting of a three-component PTS gene (HGB56_08910, HGB56_08915, HGB56_08920) and a dehydrogenase gene (HGB56_08905). The galactitol gene cluster is conserved in most strains (Supplementary Table S3-8). Another gene cassette (lp_3599-lp_3603) encodes a PTS (lp_3599, lp_3600, lp_3601), a sugar-phosphate aldolase, and a hypothetical protein (lp_3602), which is also responsible for the galactitol utilization, and the gene cluster was only found in limited strains, such as WCFS1, JDM1, and LPL-1(Supplementary Table S3-8).

Sorbitol

The sorbitol gene cluster sor1 (HGB56_09360-HGB56_09385) is present in the L. plantarum LP-F1, encoding a PTS, a sorbitol operon activator, a sorbitol operon transcription antiterminator, and a sorbitol-6-phosphate 2-dehydrogenase. The gene cluster is conserved in most tested L. plantarum strains except strain J26 only with a sorbitol-6-phosphate 2-dehydrogenase gene (Supplementary Table S3-9). In addition, L. plantarum WCFS1 has another sorbitol gene cluster (lp_3618-lp_3623), which is absent in the other L. plantarum strains. These two operons have same organization structures, and have about 58.68% nucleotide sequence identity.

2.3.3. Oligosaccharides and Polysaccharides

The genome analysis showed that LP-F1 strain contained sacPTS1 and sacPTS26 gene clusters (Figure 3, Supplementary Table S3-5). Studies have confirmed that sacPTS1 gene cluster is responsible for short chain FOS metabolism in L. plantarum WCSF1 [39]. The short chain FOS was transported into cells via sucrose PTS, then it was hydrolyzed at the catalysis of 6-phosphate sucrose hydrolase to produce 6-phosphate-glucose and fructose. Furthermore, another gene cluster sacPTS26 (LPST_C2650 to LPST_C2652) was found in ST-III strain, and was also involved in the utilization of FOS, was composed of pts26BCA, agl4 and sacR2 [40]. The genomic analysis indicated that most L. plantarum strains harbor sacPTS1 and sacPTS26 gene clusters, which could contribute to the ability to ferment FOS (Supplementary Table S3-5). Interestingly, almost half of strains contain an additional alpha-galactosidase gene in the sacPTS1 gene cluster, compared with that of L. plantarum WCSF1.
In L. plantarum P14 and P76, the fosRABCDXE gene cluster was found to be involved in inulin utilization, encoding a PTS (fosABCD), β-fructosidase (fosE), a transcription regulator (fosR) and unknown functional protein (fosX). In the FOS metabolism regulated by sacPTS1 and sacpPTS26 gene clusters, FOS are first transported to cells and then catabolized; while the inulin metabolism regulated by fosRABCDXE gene cluster is that inulin is hydrolyzed to sucrose and fructose by β-fructosidase outside cells and then into intracellular metabolism [10]. Bioinformatics analysis showed that fosRABCDXE gene cluster was not found in other L. plantarum strains including LP-F1, indicating that the gene cluster rarely appeared in L. plantarum. Therefore, it needs to be further studied how L. plantarum, which does not contain fosRABCDXE gene cluster but can utilize inulin, metabolizes inulin.

2.3.4. The Difference of Different L. plantarum Strains in Carbohydrates Utilization Genes

The L. plantarum strains present a plenty of diversity in the carbohydrate utilization-related key genes profiles (Supplementary Tables S4-1 and S4-2). A few carbohydrate metabolism genes are conserved in the L. plantarum, such as ribose and rhamnose utilization-related genes. However, most carbohydrates utilization genes in L. plantarum strains are various. For examples, some L. plantarum strains contain two galactitol gene clusters, whereas most strains only have one galactitol gene cluster. Some L. plantarum strains lack arabinose metabolism gene cluster araOADBPR and rhamnose utilization gene cluster rhaDAMBTR. The strains B21, GR0128, NCIMB8826, NCU116, SRCM102022, SRCM103357, and WCFS1 contain all tested sugar fermentation gene clusters (Supplementary Tables S4-1 and S4-2). It was speculated that these strains have stronger sugar fermentation capabilities compared with other strains.
The carbohydrate metabolism genes in strains are key factors for the carbohydrate utilization capability. The genes will contribute to the sugar fermentation potentials of strains. These results indicated that L. plantarum strains present different carbohydrate utilization capabilities since they possess various carbohydrate utilization-related key genes profiles.
L. plantarum strains are isolated from different ecological niches, most of them from fermented vegetables, other strains from raw fruits and vegetables, raw milk, fermented milk, healthy infant fecal samples, wine, etc. [1,3,4,11,12,13,30,31,32,33,34,35,36,37,38]. Some strains from the same niches present the similar carbohydrate metabolism genes. For examples, L. plantarum ATG-K6 and ATG-K8 isolated from kimchi [41], these two strains possess the same gene clusters responsible for the utilization of sucrose, cellobiose, lactose, galactose, fructose, sorbitol, galactitol, arabinose, rhamnose, and ribose (Supplementary Tables S4-1 and S4-2). L. plantarum SRCM100438, SRCM100440, and SRCM100442 from infant feces samples, these three strains harbor the same carbohydrate utilization genes.
Furthermore, some strains from the same habitat also have different carbohydrate metabolism genes profiles, for example, strains from the fermented vegetables show obvious differences in the sugar fermentation genes (Supplementary Tables S4-1 and S4-2). In addition, some strains from different niches possess same carbohydrate metabolism genes profiles, such as L. plantarum LPL-1 and b-2 have same sugar fermentation genes, whereas they were isolated from fermented fish and pickle, respectively [42] (Supplementary Tables S4-1 and S4-2). The situation is also present in the other LAB with wide distribution, such as Lacticaseibacillus casei, Lacticaseibacillus paracasei, and Lacticaseibacillus rhamnosus [14]. Therefore, the sugar fermentation capability of strains might not depend on the isolation sources of strains.
What’s more, the related species of L. plantarum, L. paraplantarum and L. pentosus, belong to Lactiplantibacillus genus, some strains of them harbor some similar carbohydrate metabolism genes with L. plantarum, such as lactose, galactose, arabinose, rhamnose, ribose, sucrose, and sorbitol utilization genes (Supplementary Tables S4-1 and S4-2). Furthermore, similar cellobiose and rhamnoside metabolism genes are found in some L. paraplantarum strains, and alpha-glucosides and galactitol gene clusters are present in some L. pentosus strains. These results indicated that these species have a close relationship. It is worth noting that the genome information of L. pentosus and L. paraplantarum is limited. Up to August 2021, 53 L. pentosus strains and 13 L. paraplantarum strains have been sequenced at the genome level. Among these strains, the complete genome sequences of 5 L. pentosus strains have been finished, and 2, 29, and 17 L. pentosus strains are under chromosome, contig, and scaffold stages, respectively. The complete genomes sequences of 3 L. paraplantarum strains have been determined, 1, 5 and 4 L. paraplantarum strains are under chromosome, contig and scaffold stages, respectively.
Furthermore, compared with other LAB species, L. plantarum also presents obvious differences in the carbohydrate metabolism genes. For examples, the species Lactic. casei, Lactic. paracasei, and Lactic. rhamnosus, common LAB in fermented milk, ferment FOS via a fosRABCDXE operon, while most L. plantarum strains take sacPTS1 and sacPTS26 gene clusters to utilize FOS [14]. Lactic. casei and Lactic. paracasei metabolize galactose by means of Leloir and tagatose-6-phosphate pathways [14]. However, galactose is fermented via Leloir pathway in L. plantarum.

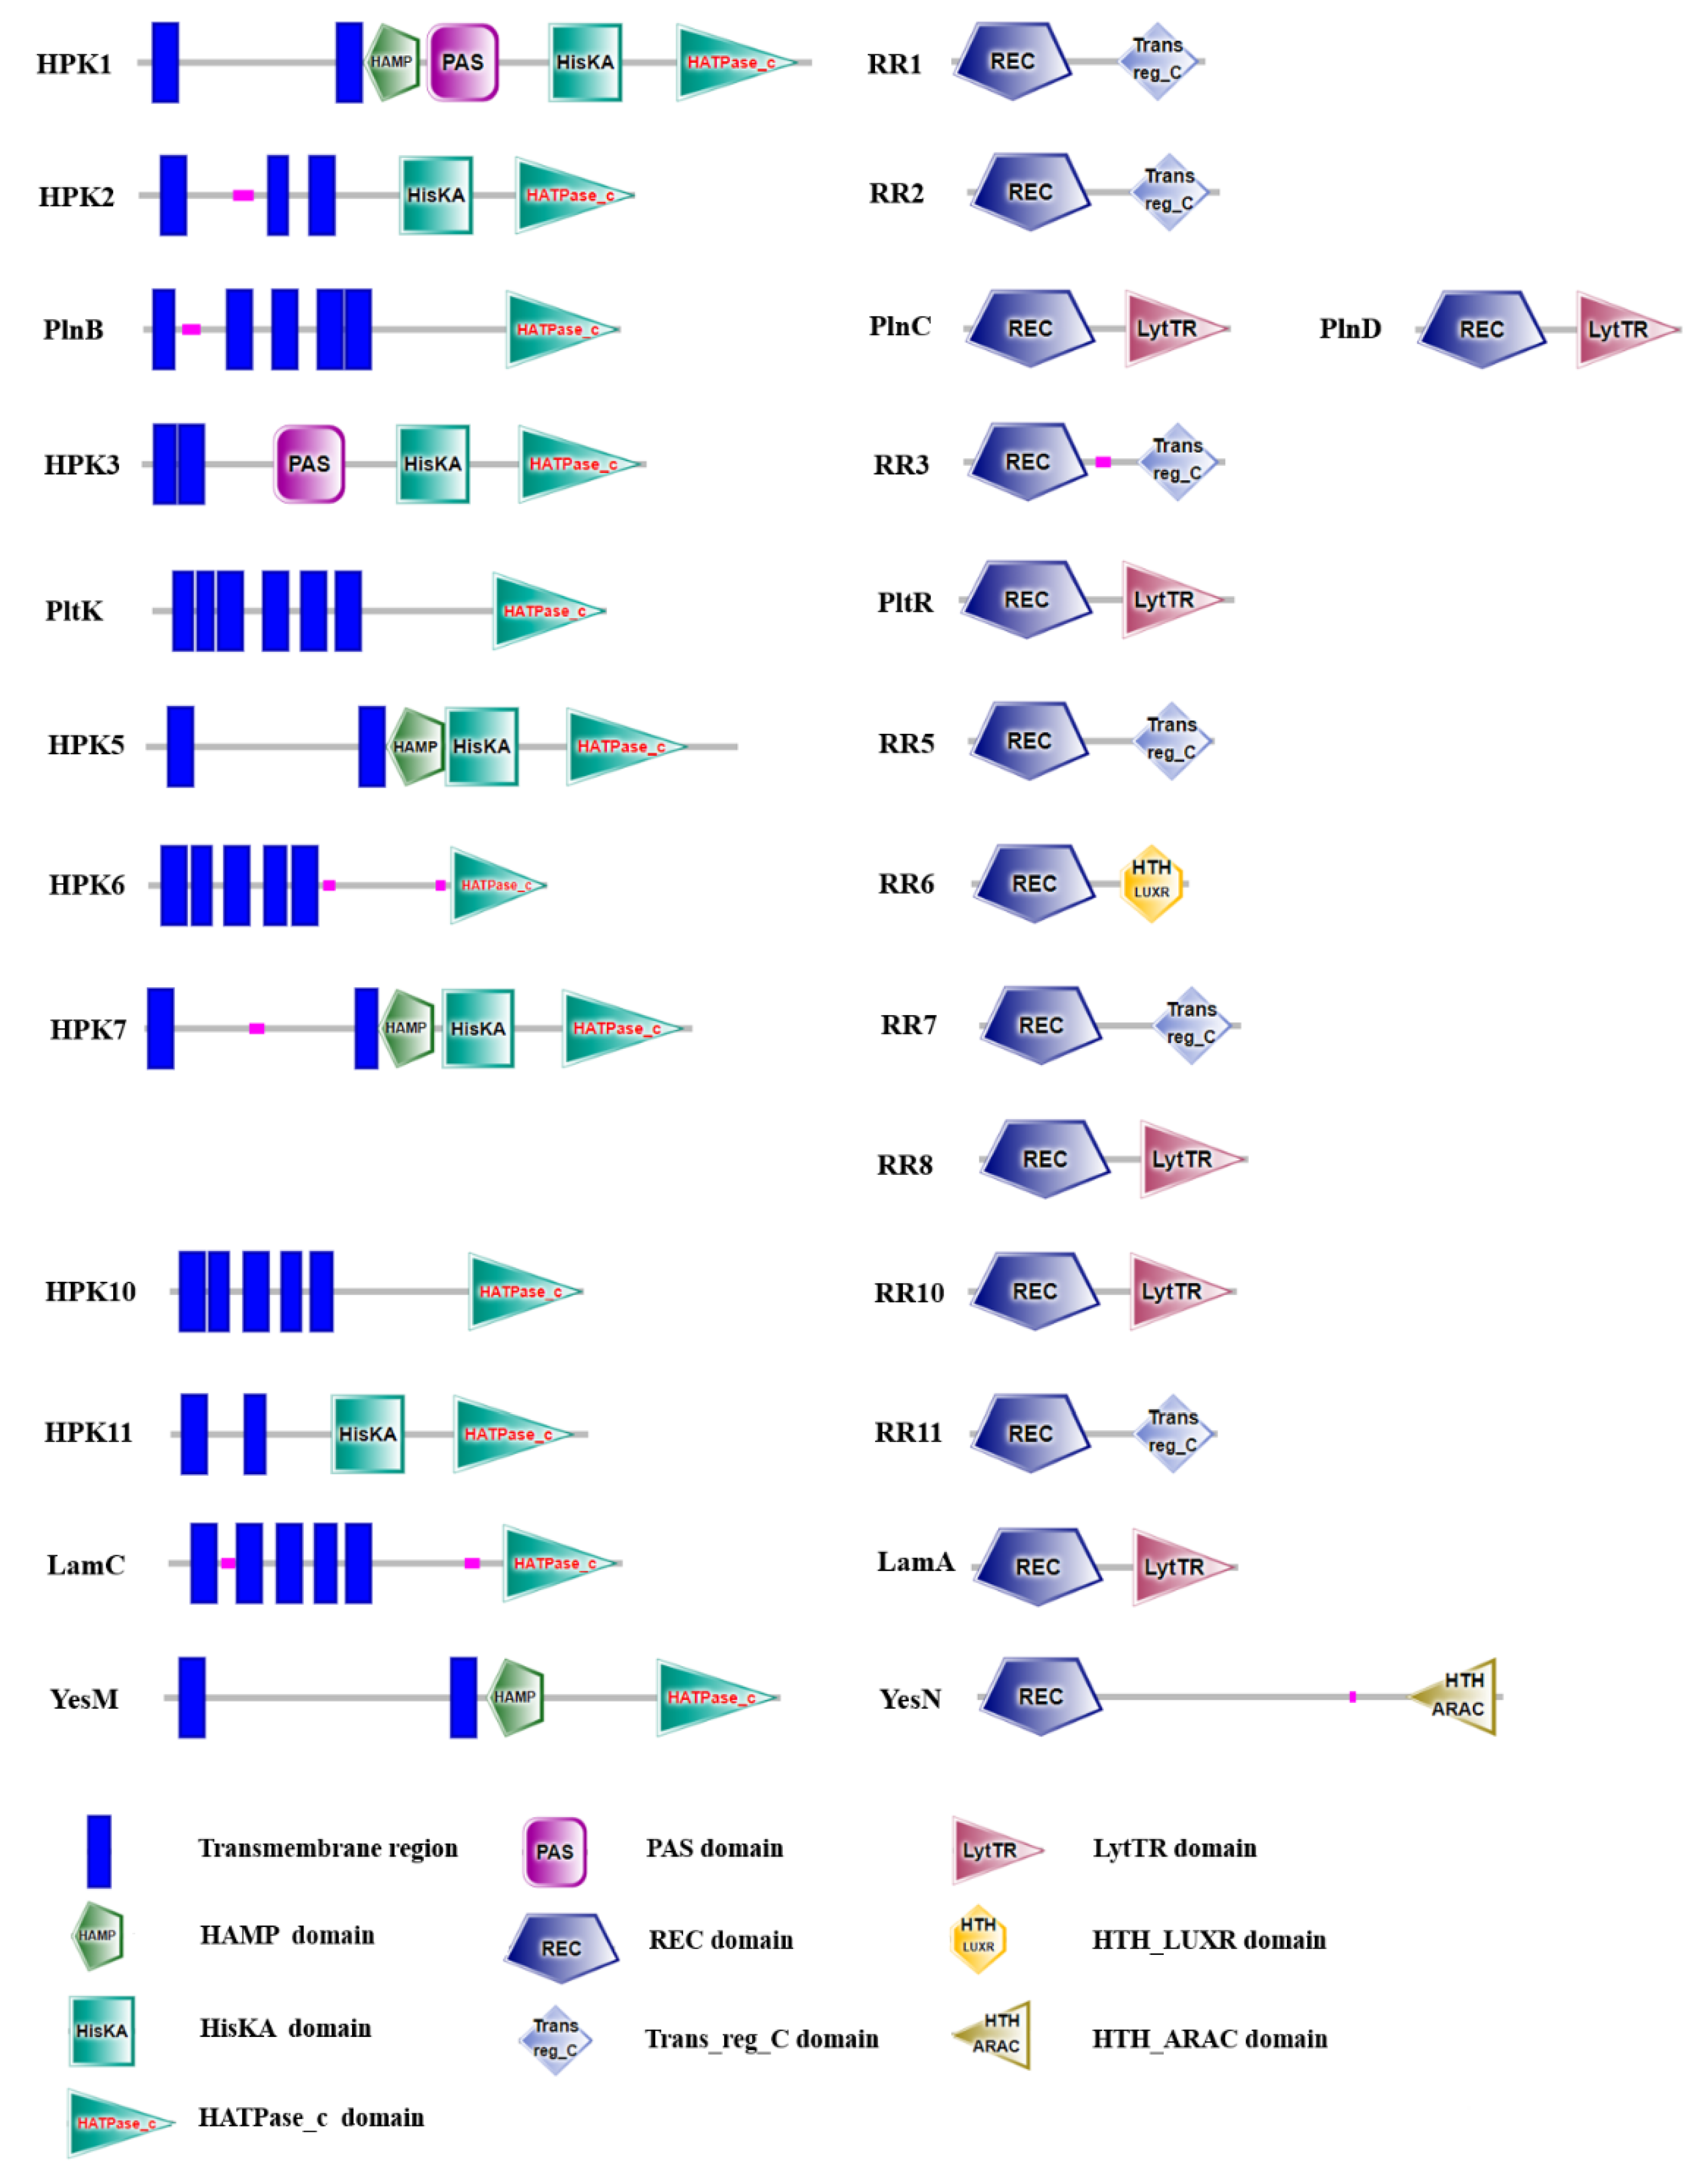
2.4. Two-Component Systems Analysis of LP-F1 Based on the Genome

Twelve pairs TCSs genes and an orphan RR gene (rr8) were found in the genome LP-F1 (Figure 5). The HPK located in the membrane, all HPKs in LP-F1 contain transmembrane regions at their N-terminals. HPK1 and HPK3 possess PAS domain, which is an important signal sensor domain and involved in the perception of various environmental changes, such as oxygen, redox potential, and light [43]. The HisKA domain with a conserved histidine residue is a core domain of HPK, which is responsible for the signal transfer via autophosphorylation.
All RRs in LP-F1 have a conversed REC response regulatory domain and a flexible receptor region. The former contains a phosphor-acceptor site, and is in charge of the accept and transmit of phosphate group. The latter is expected to bind to specific DNA sequences in the upstream regions of target genes. LytTR and Trans-reg_C are major receptor region types. Interestingly, HTH_LUXR and HTH_ARAC domains were found in the RR6 and YesN, respectively.
The genomic analysis indicated that most L. plantarum strains contains 10–13 TCSs genes and an orphan RR gene (Supplementary Table S5). TCSs hpk4/rr4, plnBCD, and yesNM are present in 37.88%, 47.20%, and 52.17% of strains with known genome sequences, respectively. The other TCSs genes are common in most strains. Interestingly, there are two copies of hpk7/rr7 in the strain CXG9, which is very rare in the LAB species. It was speculated that the various TCS distributions in the L. plantarum strains might contribute to the different adaptabilities of strains.

2.5. Carbohydrate Metabolism Ability Analysis of LP-F1

The LP-F1 genome contains glucose, galactose, sucrose, fructose, lactose, maltose, mannose, and glucose metabolism gene clusters (Supplementary Table S3). Sugar fermentation experiments showed that LP-F1 could utilize the above sugars. No gene clusters related to L-sorbose and L-fucose were found in LP-F1 genome. The results of sugar fermentation showed that LP-F1 could not utilize these two sugars.
Rhamnose metabolism related genes were found in LP-F1 genome (Supplementary Table S3-7). However, the L-rhamnose isomerase gene rhaA is a pseudo gene. Sugar fermentation experiments showed that LP-F1 could not ferment rhamnose, which might be related to the inactivity of L-rhamnose isomerase. The results of genomic bioinformatics analysis were consistent with fermentation experiments.

2.6. Quantification of the Expressions of Sugar Metabolism Related Genes in LP-F1

In order to clarify the expression changes of sugar metabolism related genes under different carbohydrate fermentation conditions, the expressions of 27 genes were analyzed (Supplementary Table S6).
In the study, FOS contains 10% glucose, fructose, and sucrose mixture. Taking MRS media with 0.2% glucose, 0.2% fructose or 0.2% sucrose as controls, the expressions of genes were analyzed in MRS medium with 2% FOS at 4 h and 12 h (Supplementary Tables S6-1 and S6-2).
Compared with the conditions with 0.2% glucose and with 0.2% fructose, the expressions of FOS and sucrose metabolism genes sacA, sacR1, sacK1, pts1BCA, and agl2 were up-regulated in MRS medium with 2% FOS at 4 h (Supplementary Table S6-1). Compared with 0.2% sucrose condition, the expressions of FOS and sucrose metabolism genes did not show significant changes.
In addition, glucose metabolism related genes pts11A, pts11BC, and pgi also showed similar expression. Under 2% FOS condition, compared with the condition with 0.2% glucose, the expression of pgi was significantly increased, the expressions of pts11A and pts11BC were not significantly changed. Compared with the conditions with 0.2% fructose and 0.2% sucrose, the expressions of pts11A and pgi were significantly increased, but pts11BC was not obviously changed.
When cultured for 12 h, under 2% FOS condition, compared with 0.2% glucose, 0.2% fructose and 0.2% sucrose conditions, the most genes expressions were increased (Supplementary Table S6-2). The above results showed that under 2% FOS fermentation condition, the change of gene expression was determined by FOS rather than a small amount of glucose, fructose and sucrose.

2.6.1. The Different Fermentation Times

On the whole, with the extension of fermentation time, most sugar metabolism genes expressions were down-regulated (Supplementary Table S6-3).
Compared with those after 4 h fermentation, the expressions of sacA, sacK1, and agl4 were significantly up-regulated after 12 h in MRS medium without sugar, and the expression levels of sacR1 and agl2 were also increased. In the MRS medium with 0.2% glucose, the expressions of sacA, sacR1, and agl2 have no significant change. The expressions of sacK1, pts1BCA, pts26BCA, and sacR2 were decreased significantly.
In 0.2% fructose, the expression levels of sacA, sacR1, and agl4 had no significant change. The expressions of sacK1, agl2, pts26BCA, and sacR2 were decreased significantly. The expression of pts1BCA was increased to 2.179 ± 0.688. In 0.2% sucrose, the expressions of sacA, sacR1, sacK1, pts1BCA, agl2, and sacR2 were decreased significantly, while the expression of pts26BCA did not obviously change, and the expression of agl4 was significantly increased.
In 2% FOS, the expressions of sacA, sacR1, sacK1, pts1BCA, and agl2 were decreased significantly, while the expressions of pts26BCA and sacR2 were significantly increased, and the expression of agl4 did not significantly change. In 2% inulin, except for agl4 and pts11BC, other tested genes expressions were significantly decreased, indicating that the sugar metabolism ability of the strain was weakened at the later stage of fermentation, which was consistent with the results of growth ability test of the strain.

2.6.2. The Effect of Different Sugars on the Expressions of Sugar Metabolism Related Genes under 4 h

Using the MRS medium without sugar as control, the changes of sugar metabolism gene expression under different carbohydrate fermentation conditions for 4 h were analyzed (Supplementary Table S6-4). The addition of glucose, fructose, sucrose, FOS, and inulin promoted significantly most sugar metabolism genes expressions.
When glucose was used as carbon source, the expression of pts11ABC, which was responsible for glucose transport, increased significantly, while the expression of pgi gene did not significantly change, indicating that the bacteria mainly carried out glucose transport at 4 h of fermentation, and the corresponding transformation did not start immediately. When sucrose, FOS and inulin were used as carbon sources, the expression levels of pts11ABC, pgi, and fruK genes were increased in varying degrees, indicating that glucose metabolism produced by the decomposition of sucrose, FOS, and inulin was active.
When sucrose, FOS or inulin were used as the sole carbon source, except for the genes pts26BCA and agl4 in the sacPTS26 gene cluster, the expressions of the other genes were up-regulated, especially the genes in sacPTS1 gene cluster. These results indicated that sacPTS1 gene cluster plays a leading role in the metabolism of sucrose, FOS and inulin in LP-F1 strain.
When glucose was used as carbon source, there was no significant change in the expressions of sacA and sacR1, while the expressions of sacK1, pts1BCA, agl2, pts26BCA, agl4 and sacR2 were increased. When fructose was used as carbon source, the expression levels of FOS and sucrose metabolism genes sacA, sacR1, pts1BCA, agl2 and pts26BCA did not change significantly, while the expression levels of sacK1, agl4 and sacR2 were increased.
The expressions of fruA, fruA1, pst9D and pts10AB were increased after adding fructose. After adding fructose, sucrose, FOS and inulin, respectively, the expression of fruK gene was increased significantly, indicating that the metabolism of fructose produced by the above four kinds of sugars was active. Under the condition of inulin addition, the expressions of fruA, fruA1, fruA2, fruB and pts10AB genes encoding PTS were increased, especially fruA, fruA1, fruA2 and fruB. These results suggest that the PTS encoded by the above genes may be involved in the transportation of inulin, which needs further study.

2.6.3. The Effect of Different Sugars on the Expressions of Sugar Metabolism Related Genes under 12 h

Using the MRS medium without sugar as control, the changes of sugar metabolism gene expression under different carbohydrate fermentation conditions for 12 h were analyzed (Supplementary Table S6-5).
Compared with the MRS medium without sugar, the expression levels of glucose PTS transporter PTS11ABC and 6-phosphate-glucose isomerase PGI coding genes had no significant change in glucose condition, indicating that glucose transport and utilization had stabilized after 12 h fermentation. Interestingly, the expression of pgi was significantly decreased in the medium supplemented with fructose, sucrose, or inulin, but obviously increased in the medium supplemented with FOS. The above results showed that the metabolism of glucose produced by FOS decomposition was still vigorous after 12 h fermentation.
In the medium containing FOS, the expression of sacK1 gene was increased, indicating that fructose produced by FOS decomposition was further metabolized. At the same time, the expression of pts1BCA was significantly increased, indicating that the transportation of FOS was still active. The expression of pts26BCA, another transport system coding gene, was also increased. After 12 h of fermentation, the expressions of most FOS and sucrose metabolism genes were significantly decreased in the inulin medium compared with the sugar free medium, and the expression of pts1BCA remained unchanged.
It was speculated that PTS26BCA encoded by pts26BCA replaced PTS1BCA in the late stage of fermentation and was responsible for the transport of substrates. The above results showed that FOS and inulin depended on different transport systems after 12 h fermentation. This may be the reason for the difference of metabolic ability of LP-F1 strain to these two sugars.
At 12 h, compared with the medium without sugar, the expressions of most fructose transport and metabolism genes were up-regulated significantly in the FOS medium, except fruA1, fruB and mtlR, indicating that the metabolism of fructose was active. In inulin medium, the expressions of fruA and mtlR were not significantly changed, and the other genes related to fructose transport and metabolism were significantly decreased, indicating that fructose produced by inulin decomposition was significantly reduced, and fructose metabolism was also significantly decreased.

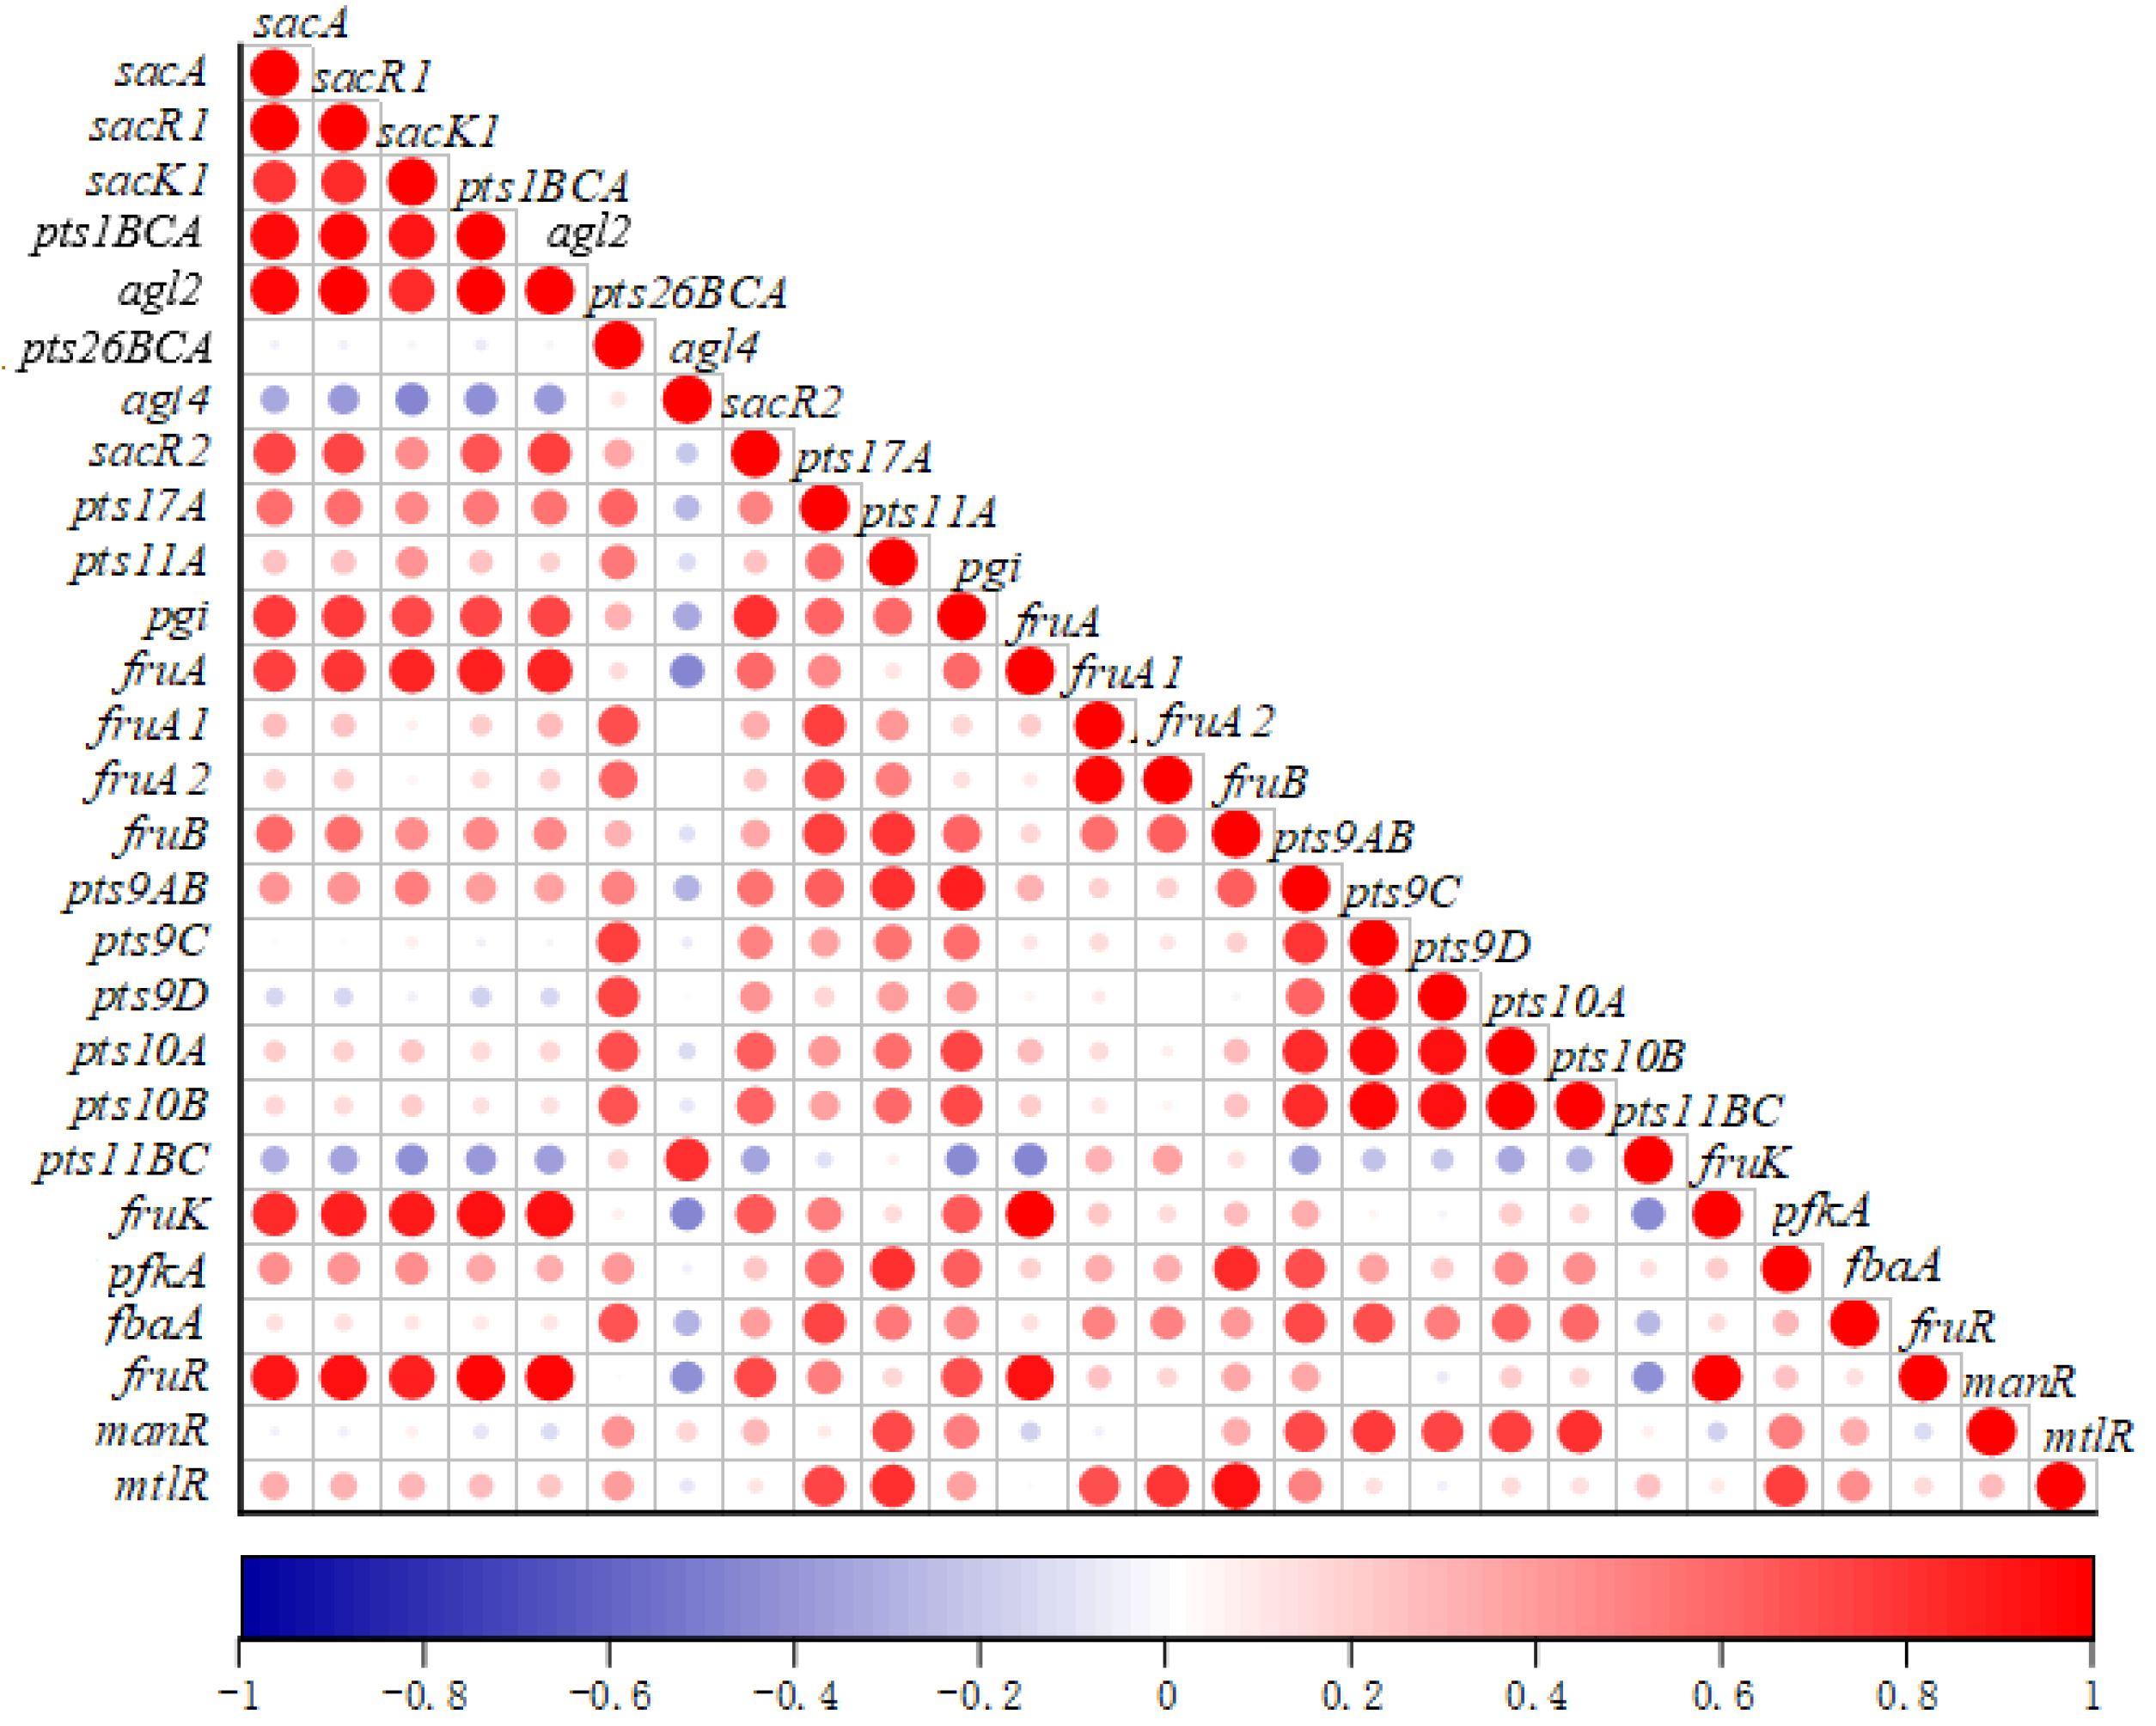
2.6.4. The Correlation of the Sugar Metabolism Related Genes

According to the expressions of genes in different fermentation conditions, the correlation map of genes expressions was drawn (Figure 6). The results showed that most sugar metabolism related genes were positively correlated with each other, such as sacA, sacR1, sacK1, pts1BCA, and agl2, while only a few genes were negatively correlated with other genes. For example, agl4 was negatively correlated with other genes except pts11BC.
The genes sacA, sacR1, sacK1, pts1BCA, and agl2, which are key genes in the FOS metabolism have a high positive correlation with each other, indicating the transport genes, hydrolysis genes and regulatory genes in the pathway of FOS metabolism interact with each other to improve their expressions.
In addition, the expressions of glucose-6-phosphate isomerase encoding gene pgi, fructose PTS transporter subunit IIA encoding gene fruA, and phosphofructokinase encoding fruK, and transcription regulator gene fruR were positively correlated with FOS metabolism-related genes. It was speculated that there is a high correlation between genes related to different carbohydrates metabolisms.

2.7. Quantification of the Expressions of TCSs Genes in LP-F1

In order to clarify the expression changes of regulatory genes under different carbohydrate fermentation conditions, the expressions of ccpA and TCSs genes were analyzed (Supplementary Table S7).
Compared with the MRS media with 0.2% glucose, 0.2% fructose and 0.2% sucrose, the expressions of most genes were up-regulated in the MRS with 2% FOS at fermentation 4 h, for examples, hpk1, rr2, plnBCD, rr3, rr5, rr7, rr8, lamA/lamC, etc (Supplementary Table S7-1). It is significant that the expressions of rr6/hpk6 were decreased compared with 0.2% fructose fermentation condition. There was no significant change in the expressions of other genes.
Compared with the MRS media containing 0.2% glucose, 0.2% fructose, and 0.2% sucrose, the expressions of rr1, hpk1, hpk3, and rr8 were up-regulated in 2% FOS at 12 h (Supplementary Table S7-2). The expressions of hpk6 and lamR were down-regulated. There was no significant change in the expressions of rr2, plnB, pltK, hpk5, and hpk11. The above results showed that a small amount of glucose, fructose, and sucrose mixed in FOS had no significant effect on the expressions of most genes.

2.7.1. The Fermentation Stages

With the extension of fermentation time, the expression of ccpA was significantly up-regulated in the media with fructose, sucrose, and FOS as carbon sources, but was down-regulated in the media without sugar, and glucose, and inulin as carbon sources (Supplementary Table S7-3). The expressions of TCSs genes presented differences under different fermentation conditions with the extension of fermentation time (Supplementary Table S7-3).
In the MRS medium without sugar, after 12 h, compared with 4 h, the expressions of other genes were up-regulated or not significantly changed, except that the plnC gene was down-regulated. In MRS medium with 0.2% glucose, the expressions of lamR and yesN were up-regulated.
In MRS medium with 0.2% fructose, the expressions of hpk7, lamR and lamC were up- regulated. In addition, the expressions of hpk2, plnC, plnD, hpk3, rr7, and rr11 were down-regulated. There was no significant change in other genes. In 0.2% sucrose, the expressions of hpk2/rr2, plnBCD, and rr3/hpk3 were down-regulated with the extension of fermentation time, while the expressions of rr5/hpk5, rr6/hpk6, lamR/lamK, and yesN/yesM were up-regulated.
Interestingly, with the extension of fermentation time, most TCSs genes expressions showed the same trend in 2% FOS and 2% inulin. In 2% FOS, with the extension of fermentation time, the expressions of hpk and rr in most TCSs showed the same trend, and the expressions of hpk2/rr2, plnBCD, rr3/hpk3, and rr8 were under-regulated, while the expressions of pltK/pltR, rr6/hpk6, lamR/lamK, and yesN/yesM did not change significantly. A few TCSs are specific, such as the expression of hpk7 was increased and rr7 decreased. There was no significant change in the expression of hpk11, but the expression of rr11 was decreased.

2.7.2. The Effect of Different Sugars on the Expressions of Genes under 4 h

The expressions of ccpA and TCSs genes in different carbohydrate sources were analyzed (Supplementary Table S7-4). Compared with the MRS medium without sugar, the expressions of most genes were significantly up-regulated after the supplement of glucose, fructose, sucrose, FOS, and inulin.
After adding glucose as carbon source, the expressions of most genes, except ccpA, rr1/hpk1, hpk5, rr7, and rr8, were significantly increased compared with those in the sugar free medium. When fructose was as the sole carbon source, the expressions of hpk3, plnK/plnR, rr6/hpk6, hpk7, lamR/lamK, hpk11/rr11, lamA, and yesN/yesM were significantly increased, while the expressions of other genes were not significantly changed. Compared with those in sugar free medium, the expressions of rr2, plnBCD, rr3, and lamA/lamC were up-regulated in sucrose, but the expressions of other genes were not significantly changed. In contrast, the expression changes of most genes in fructose medium were more significant than that in sucrose medium. It is speculated that the structure of fructose is simpler and easier to be metabolized by the strain, which promotes the rapid growth of the strain and increases the expressions of most genes.
Compared with the sugar free medium, the expressions of ccpA, hpk2/rr2, plnBCD, rr3/hpk3, pltR, rr5, hpk7/rr7, rr8, lamR, rr11, and lamA/lamC were up-regulated in the medium supplemented with FOS or inulin. It was found that FOS and inulin present similar regulatory effects on the expressions of most TCSs genes.

2.7.3. The Effect of Different Sugars on the Expressions of Genes under 12 h

The expression of ccpA was obviously up-regulated at 12 h in the medium containing fructose, sucrose, FOS, and inulin, compared with the medium without sugar (Supplementary Table S7-5).
Compared with the sugar free medium, the expressions of plnC and rr11 in the glucose medium were significantly up-regulated, while the other genes were not obviously changed. In the medium containing fructose, the expressions of hpk7 and lamC were up-regulated by 12.343 ± 1.916 and 2.677 ± 0.194 times, respectively, while the expressions of hpk2, plnC, hpk3, rr5, and rr11 were down-regulated. In a sucrose medium, the expressions of plnC, rr5, hpk7, rr7, and lamC were up-regulated, and the expression of hpk7 was increased by 9.297 ± 0.319 times; the expression of hpk2 was decreased, and the other genes had no significant change.
When FOS was used as the sole carbon source, the expressions of rr1/hpk1, plnC, rr5, hpk7/rr7, rr8, rr11, and lamC were increased, and the expression of hpk1 was up-regulated by 19.956 ± 5.703 times, the expressions of hpk6, lamR, and yesN were decreased, but the expressions of other genes did not change significantly. In the medium containing inulin, the expression of hpk7 was increased, while the expressions of most other genes were decreased.

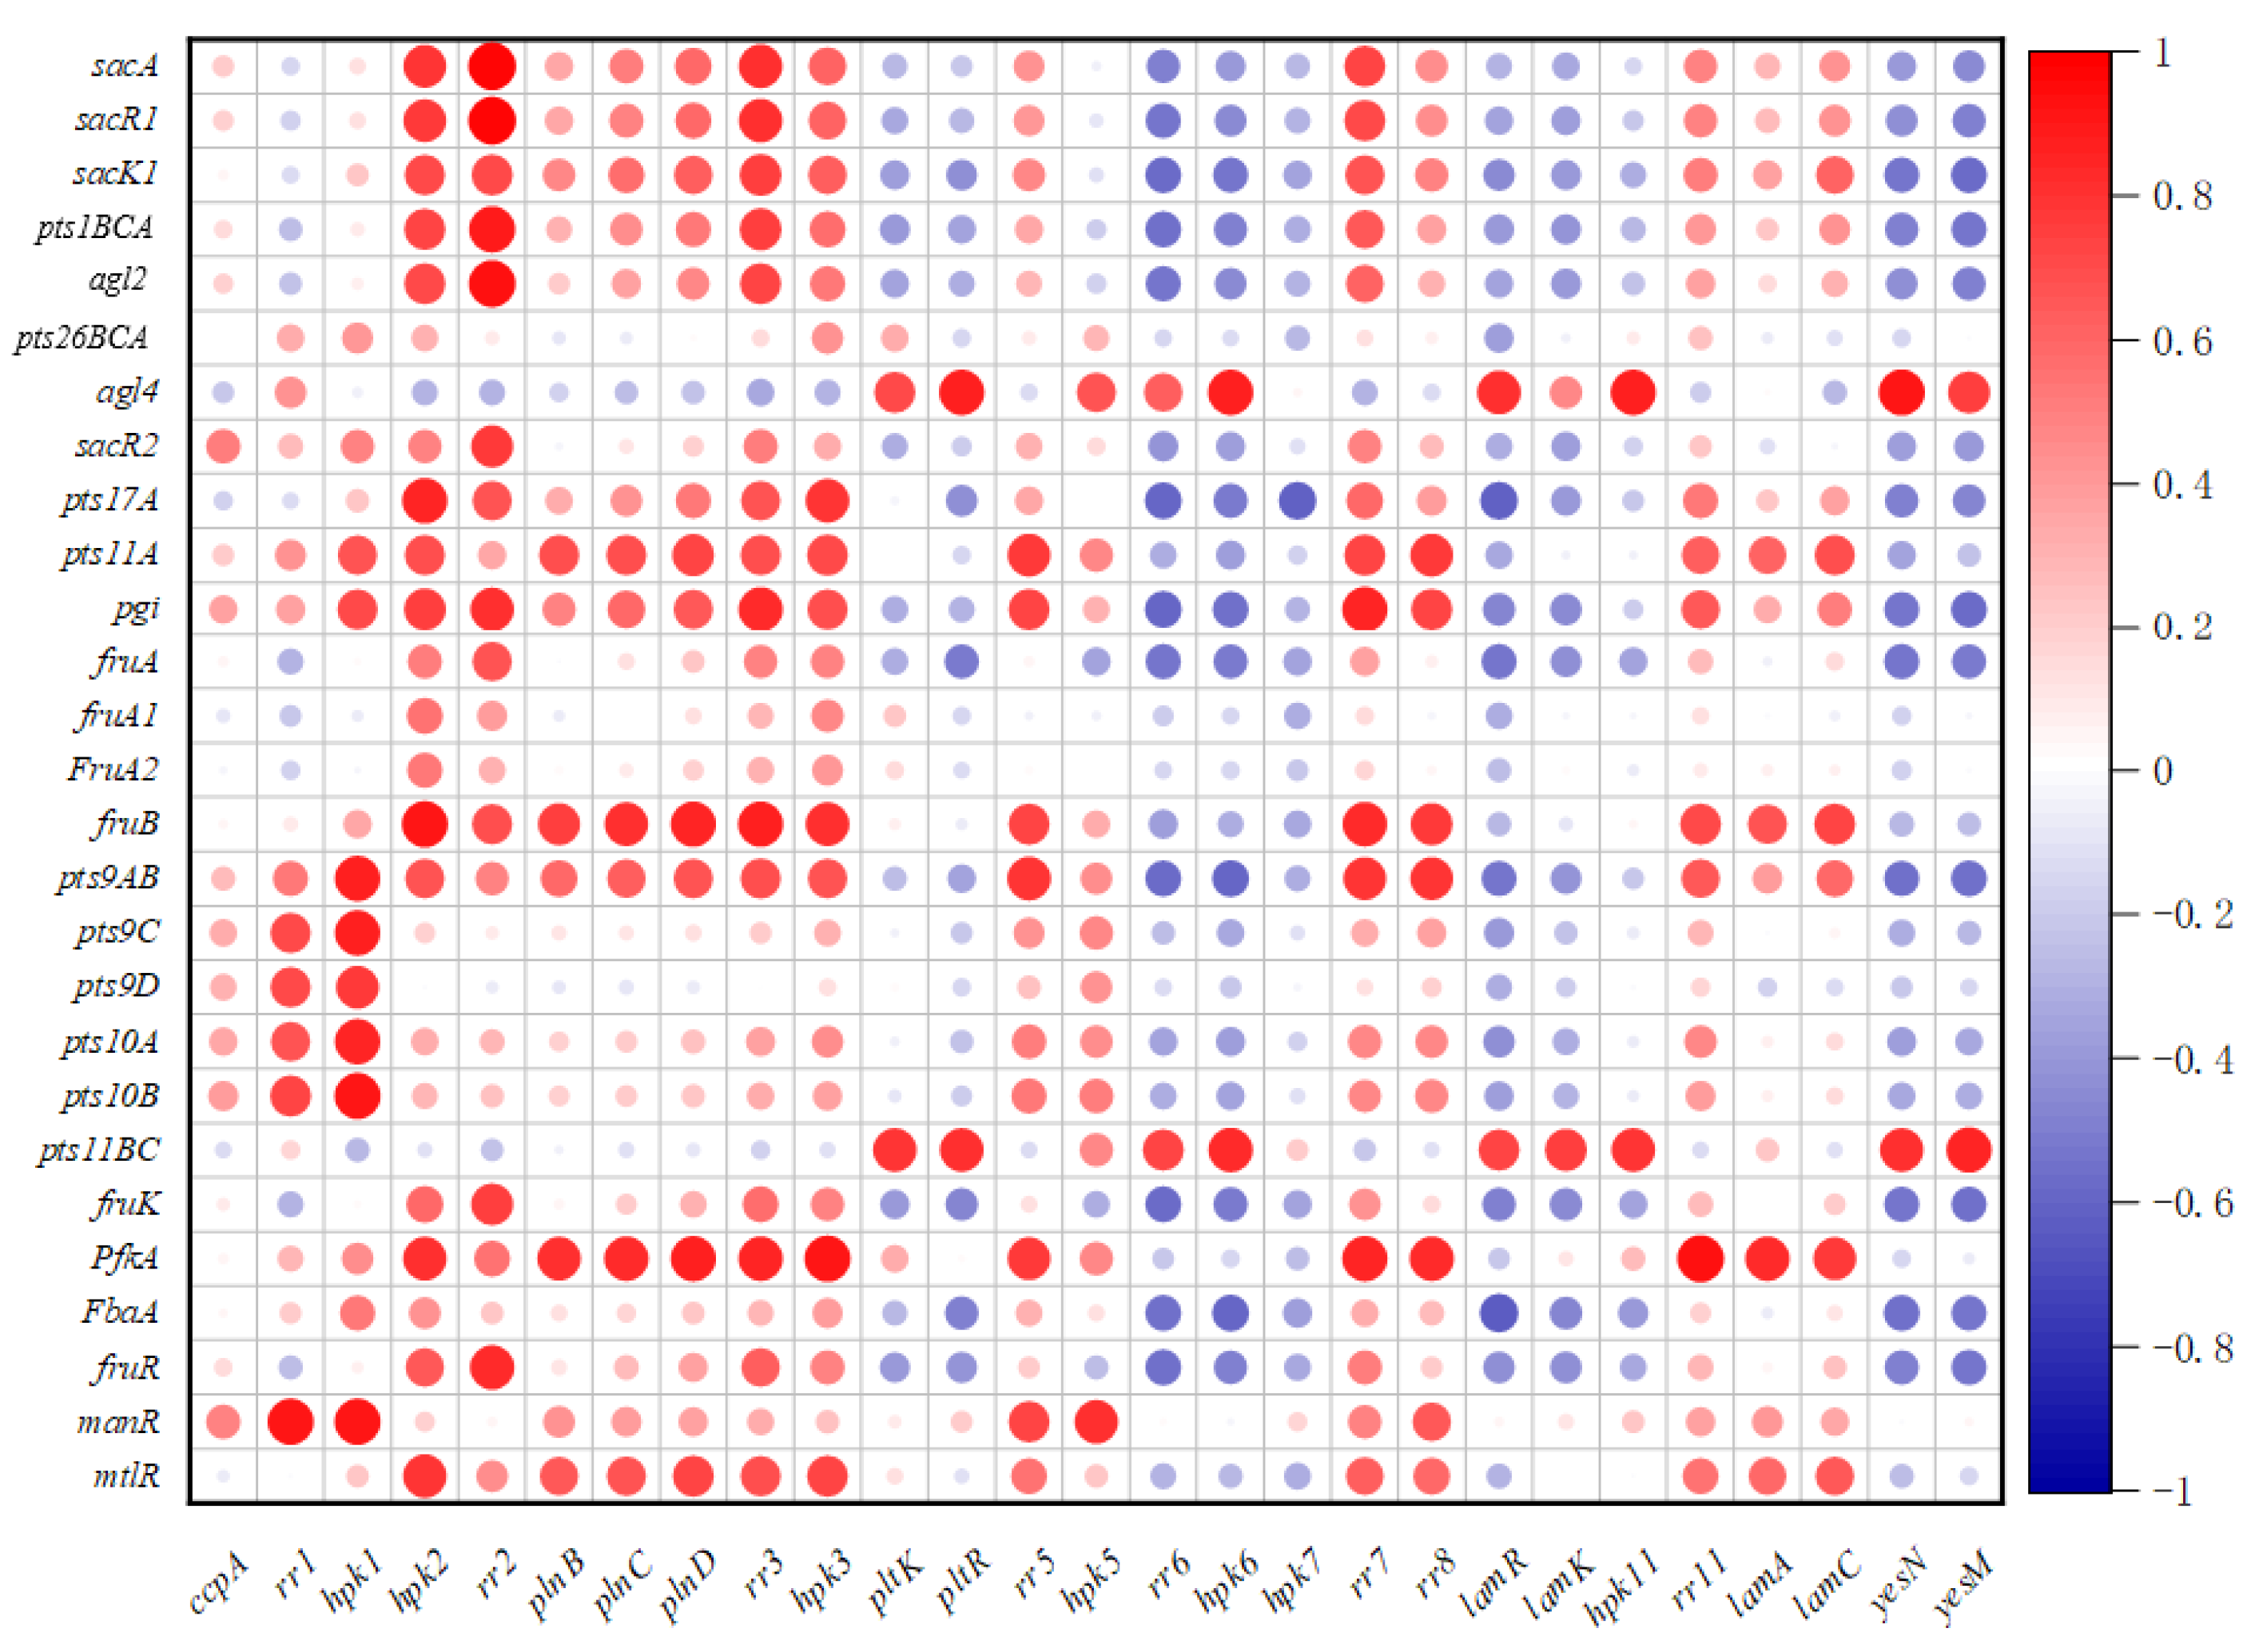
2.8. Correlation between the Sugar Metabolism Related Genes and Regulatory Genes

According to the expressions of sugar metabolism genes and regulatory genes in different fermentation conditions, the correlation map of different genes was drawn (Figure 7). The ccpA has a high positive correlation with regulation related genes manR and sacR2. In addition, the TCSs genes rr1/hpk1, rr2/hpk2, plnBCD, and rr3/hpk3 have high positive correlations with most of the sugar metabolism genes, especially with the key genes of FOS transport and metabolism. The regulatory genes rr6/hpk6, hpk7, lamR/lamK, hpk11, and yesN/yesM were negatively correlated with most of the sugar metabolism genes. The rr6/hpk6 and yesN/yesM were negatively correlated with most other genes except agl4 and pts11BC.

3. Discussion

L. plantarum is found in various environments and has a strong carbohydrate utilization capability [1,2,3,10,11,12,13]. The L. plantarum LP-F1 has a high sugar fermentation ability and shows potential in application. 165 L. plantarum strains with known genomic sequences have been analyzed. These results indicated that the species L. plantarum has a large number of carbohydrate metabolism genes and presents a strain specificity. Different L. plantarum strains showed a plenty of diversities in the sugar metabolism genes profiles. 165 L. plantarum strains could be classified into 89 types according to the distribution of carbohydrate metabolism related genes (Supplementary Tables S4-1 and S4-2). The various genes profiles might give strains different sugars fermentation abilities. The result will be beneficial for screening strains with strong carbohydrates metabolism capacities by means of the identification of key sugar utilization genes. Furthermore, it will helpful for the understanding the difference mechanism of different strains with various properties.
As key regulation systems, TCSs play key roles in the growth and adaptability of strains. TCSs genes analysis of 165 L. plantarum strains revealed that the species has more TCSs than other LAB, and the distribution of TCSs also showed the strain specificity. The functions of some TCSs in L. plantarum and other bacteria have been identified. However, most studies have focused on one specific TCS [23,24,25,26,27,28]. The effects of TCSs distribution in different strains of same species on their properties are rarely studied, although they are interesting topics and will accelerate the screening of strains with excellent characteristics if deeply studied.
Under fermentation, the supplements of glucose, fructose, sucrose, FOS, and inulin promoted the expression of most of the sugar metabolism genes. It was found FOS metabolism key genes sacA, sacR1, sacK1, pts1BCA, and agl2 have high positive correlations with each other, indicating the transport genes, hydrolysis genes and regulatory genes in the FOS metabolism pathway interact with each other to improve their expressions.
In addition, the expressions of fructose metabolism genes (fruA, fruK, fruR) and glucose metabolism gene pgi were positively correlated with those of FOS metabolism related genes. These results suggested the whole carbohydrate metabolism in bacterium are affected by the types of carbohydrates in the environments, and different carbohydrates utilizations have tight correlations.
Compared with the fermentation condition of sugar free, the expressions of most of the TCSs genes were up-regulated significantly in the media containing sugars, such as hpk2/rr2, plnBCD, and rr3/hpk3. Furthermore, the expression trends of most hpk genes and their corresponding rr genes in the same TCS were consistent. The correlation analysis between the expressions of regulatory genes (ccpA and TCSs genes) and sugar metabolism related genes showed that the expressions of regulatory genes rr1/hpk1, rr2/hpk2, plnBCD, and rr3/hpk3 were positively correlated with those of most of the sugar metabolism genes, while the expressions of rr6/hpk6, hpk7, lamR/lamK, hpk11, and yesN/yesM were negatively correlated with those of most of the sugar metabolism genes, suggesting that TCSs might be involved in the regulation of sugar metabolism. The roles of these TCSs in the prebiotics FOS and inulin metabolism require study in the future.
These results indicated that prebiotic utilization of bacteria is a complex process, which is closely related to sugar transport, decomposition, metabolism, and regulatory genes. There remains a lot of work to be performed in order to clarify the complex mechanism of prebiotic metabolism in bacteria.

4. Materials and Methods

4.1. Bacterial Strain and Growth Conditions

L. plantarum strains LP-F1, LP-E1, LP-A4, LP-I5, LP-1, and LP-4 were isolated from fermented milk samples, which were grown in a de Man-Rogosa-Sharpe (MRS) medium under 37 °C and kept in liquid MRS culture with 25% (w/v) glycerol at −70 °C [29].

4.2. Genome Sequencing of the L. plantarum LP-F1

The genome of L. plantarum LP-F1 was sequenced using a combination of Pacbio RS and Illumina platforms by LC-BIO (Hangzhou, China). The Illumina data was used to evaluate the complexity of the genome and correct the PacBio long reads. The ABySS (http://www.bcgsc.ca/platform/bioinfo/software/abyss, accessed on 9 December 2021) was used to do genome assembly with multiple-Kmer parameters and got the optimal results of the assembly [44]. Secondly, a canu (https://github.com/marbl/canu, accessed on 9 December 2021) was used to assemble the PacBio corrected long reads. GapCloser software was applied to fill up the remaining local inner gaps and correct the single base polymorphism (https://sourceforge.net/projects/soapdenovo2/files/GapCloser/, accessed on 9 December 2021) [45]. The genome sequence of LP-F1 has been submitted on NCBI and was assigned as CP051192. 15 L. plantarum strains genomes available in public databases were used in the construction of phylogenetic tree, including 5-2, ST-III, TMW 1.1478, WCFS1, 16, CAUH2, J26, JDM1, K25, KLDS1.0391, LPL-1, LZ95, LZ206, P-8, and SN35N (Supplementary Table S2).

4.3. In Silico Analysis of the Carbohydrate Metabolism Genes of L. plantarum

Carbohydrate-Active enzyme (CAZy) in L. plantarum LP-F1 was annotated with dbCAN (http://bcb.unl.edu/dbCAN2/, accessed on 9 December 2021) and CAZy database (http://www.cazy.org/, accessed on 9 December 2021) [46,47]. 165 L. plantarum strains genomes available in public databases were used in the carbohydrate metabolism genes analysis (Supplementary Table S2).

4.4. Carbohydrate Fermentation Tests

Carbohydrate utilization patterns were evaluated according to the method of Hu et al. (2018) [24]. The 23 carbohydrate fermentation tests were performed to determine the phenotypic variability of strains, including D(+)glucose, D(+)galactose, D(+)fructose, D(+)lactose, D(+)sucrose, D(+)maltose, D(+) mannose, D(+)mannitol, D(-)salicin, D(+)xylose, D(+)ribose, D(+)sorbitol, Galactitol, L(+)-rhamnose, L(-)sorbose, L(-)fucose, L(+)arabinose, D(+)cellobiose, D(+)trehalose, D(+)melibiose, D(+)-melezitose, fructooligosaccharides (FOS), and inulin.
Cells from overnight cultures were pelleted by centrifugation (12,000 g, 5 min) and were then washed and resuspended in peptone broth (peptone 20 g/L, NaCl 5 g/L, K2HPO4 0.2 g/L). Then, the cells were cultured in peptone broth with 2% sugar for 24 h at 37 °C, containing 3% BTB-MR (bromo phenol blue 0.2 g, methyl red 0.1 g, 95% ethanol 300 mL, distilled water 200 mL) as the pH indicator. Cell suspension without any sugar was negative control. Sugar fermentation resulted in the change of the color from blue to yellow, and turbidity was increased.

4.5. Quantitative Real-Time -PCR

The L. plantarum strain LP-F1 was cultivated in MRS media with different carbohydrates (2% FOS, or 2% inulin). The FOS in this study contain 10% other sugars mixture (glucose, fructose, sucrose). Therefore, MRS media with 0.2% glucose, 0.2% fructose, and 0.2% sucrose were used as controls, in order to identify the influences of these sugars. Cells were collected after 4 h (logarithmic phase), and 12 h (stationary phase) cultivation. Total RNA was extracted using Trizol reagent according to the previous method [23]. Total RNA was quantified by measuring the OD260 value with SpectraMax iD3 (Molecular Devices, San Jose, CA, USA). Complementary DNA (cDNA) was synthesized by means of the ReverTra Ace qPCR RT Master Mix gDNA Remover (TOYOBO, Osaka, Osaka Prefecture City, Japan).
Twenty-seven genes related to the L. plantarum carbohydrate metabolism were selected, focusing FOS metabolism genes (sacA, sacR1, sacK1, pts1BCA, agl2, pts26BCA, agl4, and sacR2), glucose transport and hydrolysis genes (pfkA, fbaA, pts17A, pts11A, pts11BC, and pgi) and fructose transport and hydrolysis related genes (fruA, fruA1, fruA2, fruB, pts9AB, pts9C, pts9D, pts10A, pts10B, fruK, fruR, manR, and mtlR).
Furthermore, the catabolite control protein A (CcpA) gene ccpA, as well as twelve pairs of TCSs genes and an orphan rr gene (hpk1/rr1, hpk2/rr2, hpk3/rr3, hpk5/rr5, hpk6/rr6, hpk7/rr7, hpk11/rr11, plnB/C/D, pltKR, lamRK(rr10/hpk10), lamAC, yesNM, and rr8) were used in the study. The qPCR primers were designed by Primer3 web [48] (Supplementary Table S8).
Quantitative RT-PCR (qRT-PCR) reactions were performed with Applied Biosystem QuantStudio 5.0 (Thermo Fisher, Waltham, MA, USA) using 2 × SYBR Green qPCR Master Mix (Low Rox) (Bimake, Houston, TX, USA) according to the manufacturer’s instructions. Each reaction was repeated three times. Data were measured using the method of comparative critical threshold (2−ΔΔCT) [49]. The 16s rRNA gene was used as a reference gene in all cases. R software was used for correlation analysis.

5. Conclusions

In the present study, the distribution of carbohydrate metabolism genes in 165 L. plantarum strains with known genomic sequences have been analyzed, indicating different strains present various sugar utilization genes profiles. These results demonstrated that L. plantarum is a good material used in the research of carbohydrate metabolism mechanism, and has wide potential applications in prebiotic utilization. FOS, and inulin promoted the expressions of most sugar metabolism genes in L. plantarum LP-F1, a potential starter strain with outstanding characteristics. The key genes in FOS metabolism presented high positive correlations. In addition, different carbohydrates utilizations have close relationships. The expressions of regulatory genes (ccpA and TCSs genes) and sugar metabolism genes also have tight links. It was speculated that some TCSs might be responsible for the regulation of sugar metabolism in L. plantarum LP-F1.

Supplementary Materials

The following are available online at https://www.mdpi.com/article/10.3390/ijms222413452/s1.

Author Contributions

Y.C. conceived and designed research, analyzed the data, and wrote the manuscript. M.W., Y.Z. and K.M. conducted some experiments, and analyzed some data. X.Q. revised the whole manuscript. All authors have read and agreed to the published version of the manuscript.

Funding

This research received no external funding.

Conflicts of Interest

The authors declare no conflict of interest.

References

  1. Turpin, W.; Weiman, M.; Guyot, J.P.; Lajus, A.; Cruveiller, S.; Humblot, C. The genomic and transcriptomic basis of the potential of Lactobacillus plantarum A6 to improve the nutritional quality of a cereal based fermented food. Int. J. Food Microbiol. 2018, 266, 346–354. [Google Scholar] [CrossRef] [PubMed]
  2. Aquilanti, L.; Santarelli, S.; Silvestri, G.; Osimani, A.; Petruzzelli, A.; Clementi, F. The microbial ecology of a typical Italian salami during its natural fermentation. Int. J. Food Microbiol. 2007, 120, 136–145. [Google Scholar] [CrossRef] [PubMed]
  3. Axelsson, L.; Rud, I.; Naterstad, K.; Blom, H.; Renckens, B.; Boekhorst, J.; Kleerebezem, M.; van Hijum, S.; Siezen, R.J. Genome sequence of the naturally plasmid-free Lactobacillus plantarum strain NC8 (CCUG 61730). J. Bacteriol. 2012, 194, 2391–2392. [Google Scholar] [CrossRef] [PubMed] [Green Version]
  4. Kleerebezem, M.; Boekhorst, J.; van Kranenburg, R.; Molenaar, D.; Kuipers, O.P.; Leer, R.; Tarchini, R.; Peters, S.A.; Sandbrink, H.M.; Fiers, M.W.; et al. Complete genome sequence of Lactobacillus plantarum WCFS1. Proc. Natl. Acad. Sci. USA 2003, 100, 1990–1995. [Google Scholar] [CrossRef] [Green Version]
  5. Li, X.; Gu, Q.; Lou, X.; Zhang, X.; Song, D.; Shen, L.; Zhao, Y. Complete genome sequence of the probiotic Lactobacillus plantarum strain ZJ316. Genome Announc. 2013, 1, e0009413. [Google Scholar] [CrossRef] [Green Version]
  6. Seddik, H.A.; Bendali, F.; Gancel, F.; Fliss, I.; Spano, G.; Drider, D. Lactobacillus plantarum and its probiotic and food potentialities. Probiotics Antimicrob. Proteins 2017, 9, 111–122. [Google Scholar] [CrossRef]
  7. Zhou, Y.; Cui, Y.; Qu, X. Exopolysaccharides of lactic acid bacteria: Structure, bioactivity and associations. Carbohydr. Polym. 2019, 207, 317–332. [Google Scholar] [CrossRef]
  8. Cui, Y.; Miao, K.; Niyaphorn, S.; Qu, X. Production of gamma-aminobutyric acid from lactic acid bacteria: A systematic review. Int. J. Mol. Sci. 2020, 21, 995. [Google Scholar] [CrossRef] [Green Version]
  9. Wegkamp, A.; Mars, A.E.; Faijes, M.; Molenaar, D.; de Vos, R.C.; Klaus, S.M.; Hanson, A.D.; de Vos, W.M.; Smid, E.J. Physiological responses to folate overproduction in Lactobacillus plantarum WCFS1. Microb. Cell Factories 2010, 9, 100. [Google Scholar] [CrossRef] [Green Version]
  10. Buntin, N.; Hongpattarakere, T.; Ritari, J.; Douillard, F.P.; Paulin, L.; Boeren, S.; Shetty, S.A.; de Vos, W.M. An inducible operon is involved in inulin utilization in Lactobacillus plantarum strains, as revealed by comparative proteogenomics and metabolic profiling. Appl. Environ. Microb. 2017, 83, e02402-16. [Google Scholar] [CrossRef] [Green Version]
  11. Fuhren, J.; Rösch, C.; Napel, M.T.; Schols, H.A.; Kleerebezem, M. Synbiotic matchmaking in Lactobacillus plantarum: Substrate screening and gene-trait matching to characterize strain-specific carbohydrate utilization. Appl. Environ. Microbiol. 2020, 86, e01081-20. [Google Scholar] [CrossRef]
  12. Siezen, R.J.; Tzeneva, V.A.; Castioni, A.; Wels, M.; Phan, H.T.; Rademaker, J.L.; Starrenburg, M.J.; Kleerebezem, M.; Molenaar, D.; van Hylckama Vlieg, J.E. Phenotypic and genomic diversity of Lactobacillus plantarum strains isolated from various environmental niches. Environ. Microbiol. 2010, 12, 758–773. [Google Scholar] [CrossRef]
  13. Mao, B.; Yin, R.; Li, X.; Cui, S.; Zhang, H.; Zhao, J.; Chen, W. Comparative genomic analysis of Lactiplantibacillus plantarum isolated from different niches. Genes 2021, 12, 241. [Google Scholar] [CrossRef]
  14. Cui, Y.; Qu, X. Genetic mechanisms of prebiotic carbohydrate metabolism in lactic acid bacteria: Emphasis on Lacticaseibacillus casei and Lacticaseibacillus paracasei as flexible, diverse and outstanding prebiotic carbohydrate starters. Trends Food Sci. Technol. 2021, 115, 486–499. [Google Scholar] [CrossRef]
  15. Bringel, F.; Quenee, P.; Tailliez, P. Polyphasic investigation of the diversity within Lactobacillus plantarum related strains revealed two L. plantarum subgroups. Syst. Appl. Microbiol. 2001, 24, 561–571. [Google Scholar] [CrossRef]
  16. Molenaar, D.; Bringel, F.; Schuren, F.H.; de Vos, W.M.; Siezen, R.J.; Kleerebezem, M. Exploring Lactobacillus plantarum genome diversity by using microarrays. J. Bacteriol. 2005, 187, 6119–6127. [Google Scholar] [CrossRef] [Green Version]
  17. Siezen, R.; van Hylckama Vlieg, J. Genomic diversity and versatility of Lactobacillus plantarum, a natural metabolic engineer. Microb. Cell Factories 2011, 10, S3. [Google Scholar] [CrossRef] [Green Version]
  18. Choi, S.; Jin, G.D.; Park, J.; You, I.; Kim, E.B. Pan-genomics of Lactobacillus plantarum revealed group-specific genomic profiles without habitat association. J. Microbiol. Biotechnol. 2018, 28, 1352–1359. [Google Scholar] [CrossRef]
  19. Alcantara, C.; Revilla-Guarinos, A.; Zuniga, M. Influence of two-component signal transduction systems of Lactobacillus casei BL23 on tolerance to stress conditions. Appl. Environ. Microb. 2011, 77, 1516–1519. [Google Scholar] [CrossRef] [Green Version]
  20. Azcarate-Peril, M.; McAuliffe, O.; Altermann, E.; Lick, S.; Russell, W.M.; Klaenhammer, T.R. Microarray analysis of a two-component regulatory system involved in acid resistance and proteolytic activity in Lactobacillus acidophilus. Appl. Environ. Microbiol. 2005, 71, 5794–5804. [Google Scholar] [CrossRef] [Green Version]
  21. Bourret, R.B.; Silversmith, R.E. Two-component signal transduction. Curr. Opin. Microbiol. 2010, 13, 113–115. [Google Scholar] [CrossRef] [Green Version]
  22. Thevenard, B.; Besset, C.; Choinard, S.; Fourcassié, P.; Boyaval, P.; Monnet, V. Response of S. thermophilus LMD-9 to bacitracin: Involvement of a BceRS/AB-like module and of the rhamnose-glucose polysaccharide synthesis pathway. Int. J. Food Microbiol. 2014, 177, 89–97. [Google Scholar] [CrossRef]
  23. Cui, Y.; Liu, W.; Qu, X.; Chen, Z.; Zhang, X.; Liu, T. A two component system is involved in acid adaptation of Lactobacillus delbrueckii subsp. bulgaricus. Microbiol. Res. 2012, 167, 253–261. [Google Scholar] [CrossRef]
  24. Hu, T.; Zhang, Y.; Cui, Y.; Zhao, C.; Jiang, X.; Zhu, X.; Wang, Y.; Qu, X. Technological properties assessment and two component systems distribution of Streptococcus thermophilus strains isolated from fermented milk. Arch. Microbiol. 2018, 200, 567–580. [Google Scholar] [CrossRef]
  25. Sturme, M.H.J.; Francke, C.; Siezen, R.J.; de Vos, W.M.; Kleerebezem, M. Making sense of quorum sensing in lactobacilli: A special focus on Lactobacillus plantarum WCFS1. Microbiology 2007, 153, 3939–3947. [Google Scholar] [CrossRef] [Green Version]
  26. Diep, D.B.; Johnsborg, O.; Risøen, P.A.; Nes, I.F. Evidence for dual functionality of the operon plnABCD in the regulation of bacteriocin production in Lactobacillus plantarum. Mol. Microbiol. 2001, 41, 633–644. [Google Scholar] [CrossRef]
  27. Sturme, M.H.J.; Nakayama, J.; Molenaar, D.; Murakami, Y.; Kunugi, R.; Fujii, T.; Vaughan, E.E.; Kleerebezem, M.; de Vos, W.M. An agr-like two-component regulatory system in Lactobacillus plantarum is involved in production of a novel cyclic peptide and regulation of adherence. J. Bacteriol. 2005, 187, 5224–5235. [Google Scholar] [CrossRef] [Green Version]
  28. Fujii, T.; Ingham, C.; Nakayama, J.; Beerthuyzen, M.; Kunuki, R.; Molenaar, D.; Sturme, M.; Vaughan, E.; Kleerebezem, M.; de Vos, W. Two homologous Agr-like quorum-sensing systems cooperatively control adherence, cell morphology, and cell viability properties in Lactobacillus plantarum WCFS1. J. Bacteriol. 2008, 190, 7655–7665. [Google Scholar] [CrossRef] [Green Version]
  29. Miao, K. Optimization of Fermentation Conditions of γ-Aminobutytic Acid Produced by Lactobacillus plantrum and Genome Analysis. Master’s Thesis, Harbin Institute of Technology, Harbin, China, 2020. [Google Scholar]
  30. Crowley, S.; Bottacini, F.; Mahony, J.; van Sinderen, D. Complete genome sequence of Lactobacillus plantarum strain 16, a broad-spectrum antifungal-producing lactic acid bacterium. Genome Announc. 2013, 1, e00533-13. [Google Scholar] [CrossRef] [Green Version]
  31. Jia, F.F.; Zhang, L.J.; Pang, X.H.; Gu, X.X.; Abdelazez, A.; Liang, Y.; Sun, S.R.; Meng, X.C. Complete genome sequence of bacteriocin-producing Lactobacillus plantarum KLDS1.0391, a probiotic strain with gastrointestinal tract resistance and adhesion to the intestinal epithelial cells. Genomics 2017, 109, 432–437. [Google Scholar] [CrossRef]
  32. Jiang, Y.Y.; Zhang, J.; Zhao, X.; Zhao, W.; Yu, Z.J.; Chen, C.; Yang, Z.N. Complete genome sequencing of exopolysaccharide-producing Lactobacillus plantarum K25 provides genetic evidence for the probiotic functionality and cold endurance capacity of the strain. Biosci. Biotechnol. Biochem. 2018, 82, 1225–1233. [Google Scholar] [CrossRef] [PubMed] [Green Version]
  33. Liu, C.; Wang, R.; Gong, F.; Liu, X.; Zheng, H.; Luo, Y.; Li, X. Complete genome sequences and comparative genome analysis of Lactobacillus plantarum strain 5-2 isolated from fermented soybean. Genomics 2015, 106, 404–411. [Google Scholar] [CrossRef]
  34. Noda, M.; Shiraga, M.; Kumagai, T.; Danshiitsoodol, N.; Sugiyama, M. Characterization of the SN35N strain-specific exopolysaccharide encoded in the whole circular genome of a plant-derived Lactobacillus plantarum. Biol. Pharm. Bull. 2018, 41, 536–545. [Google Scholar] [CrossRef] [PubMed] [Green Version]
  35. Zhang, W.; Sun, Z.; Bilige, M.; Zhang, H. Complete genome sequence of probiotic Lactobacillus plantarum P-8 with antibacterial activity. J. Biotechnol. 2015, 193, 41–42. [Google Scholar] [CrossRef] [PubMed]
  36. Zhai, Z.Y.; Yang, Y.; Wang, J.J.; Wang, G.H.; Ren, F.Z.; Hao, Y.L. Complete genome sequencing of Lactobacillus plantarum CAUH2 reveals a novel plasmid pCAUH203 associated with oxidative stress tolerance. 3 Biotech 2019, 9, 116. [Google Scholar] [CrossRef]
  37. Wang, Y.Y.; Chen, C.; Ai, L.Z.; Zhou, F.F.; Zhou, Z.M.; Wang, L.; Zhang, H.; Chen, W.; Guo, B.H. Complete genome sequence of the probiotic Lactobacillus plantarum ST-III. J. Bacteriol. 2011, 193, 313–314. [Google Scholar] [CrossRef] [Green Version]
  38. Martino, M.E.; Bayjanov, J.R.; Caffrey, B.E.; Wels, M.; Joncour, P.; Hughes, S.; Gillet, B.; Kleerebezem, M.; van Hijum, S.A.F.T.; Leulier, F. Nomadic lifestyle of Lactobacillus plantarum revealed by comparative genomics of 54 strains isolated from different habitats. Environ. Microbiol. 2016, 18, 4974–4989. [Google Scholar] [CrossRef]
  39. Saulnier, D.M.A.; Molenaar, D.; de Vos, W.M.; Gibson, G.R.; Kolida, S. Identification of prebiotic fructooligosaccharide metabolism in Lactobacillus plantarum WCFS1 through microarrays. Appl. Environ. Microb. 2007, 73, 1753–1765. [Google Scholar] [CrossRef] [Green Version]
  40. Chen, C.; Zhao, G.; Chen, W.; Guo, B. Metabolism of fructooligosaccharides in Lactobacillus plantarum ST-III via differential gene transcription and alteration of cell membrane fluidity. Appl. Environ. Microb. 2015, 81, 7697–7707. [Google Scholar] [CrossRef] [Green Version]
  41. Beck, B.R.; Park, G.S.; Lee, Y.H.; Im, S.; Jeong, D.Y.; Kang, J. Whole genome analysis of Lactobacillus plantarum strains isolated from Kimchi and determination of probiotic properties to treat mucosal infections by Candida albicans and Gardnerella vaginalis. Front Microbiol. 2019, 10, 433. [Google Scholar] [CrossRef]
  42. Wang, Y.; Shang, N.; Qin, Y.; Zhang, Y.; Zhang, J.; Li, P. The complete genome sequence of Lactobacillus plantarum LPL-1, a novel antibacterial probiotic producing class IIa bacteriocin. J. Biotechnol. 2018, 266, 84–88. [Google Scholar] [CrossRef]
  43. Taylor, B.L.; Zhulin, I.B. PAS domains: Internal sensors of oxygen, redox potential, and light. Microbiol. Mol. Biol. Rev. 1999, 63, 479–506. [Google Scholar] [CrossRef] [Green Version]
  44. Jackman, S.D.; Vandervalk, B.P.; Mohamadi, H.; Chu, J.; Yeo, S.; Hammond, S.A.; Jahesh, G.; Khan, H.; Coombe, L.; Warren, R.L.; et al. ABySS 2.0: Resource-efficient assembly of large genomes using a bloom filter. Genome Res. 2017, 27, 768–777. [Google Scholar] [CrossRef] [Green Version]
  45. Koren, S.; Walenz, B.P.; Berlin, K.; Miller, J.R.; Bergman, N.H.; Phillippy, A.M. Canu: Scalable and accurate long-read assembly via adaptive k-mer weighting and repeat separation. Genome Res. 2017, 27, 722–736. [Google Scholar] [CrossRef] [Green Version]
  46. Yin, Y.; Mao, X.; Yang, J.; Chen, X.; Mao, F.; Xu, Y. dbCAN: A web resource for automated carbohydrate-active enzyme annotation. Nucleic Acids Res. 2012, 40, 445–451. [Google Scholar] [CrossRef]
  47. Lombard, V.; Ramulu, H.G.; Drula, E.; Coutinho, P.M.; Henrissat, B. The carbohydrate-active enzymes database (CAZy) in 2013. Nucleic Acids Res. 2014, 42, D490–D495. [Google Scholar] [CrossRef] [Green Version]
  48. Andreas, U.; Ioana, C.; Triinu, K.; Jian, Y.; Faircloth, B.C.; Maido, R. Primer3—New capabilities and interfaces. Nucleic Acids Res. 2012, 40, e115. [Google Scholar]
  49. Livak, K.J.; Schmittgen, T.D. Analysis of relative gene expression data using real-time quantitative PCR and the 2−ΔΔC(T) method. Methods 2001, 25, 402–408. [Google Scholar] [CrossRef]
Figure 1. Circular genome map of the L. plantarum LP-F1 chromosome and plasmid. (A) Chromosome. (B) Plasmid pLP-F1.
Ijms 22 13452 g001
Figure 2. Phylogenetic trees of 16 L. plantarum strains. In order to highlight the strain LP-F1 in this study, the strain name LP-F1 is shown in red.
Ijms 22 13452 g002
Figure 3. Sugar metabolism and central carbon pathways in L. plantarum LP-F1. 2-PA, 2-phosphoglyceric acid; 3-PA, 3-phosphoglyceric acid; AraA, L-arabinose isomerase; AraB, L-ribulokinase; AraD, L-ribulose 5-phosphate 4-epimerase; DHAP, dihydroxyacetone phosphate; DPGA, 1, 3-diphosphoglyceric acid; Eno, enolase; EPS, exopolysaccharide; FbaA, fructose bisphosphate aldolase; G3P, glyceralodehyde-3-phosphate; GalE, UDP-galactose 4-epimerase; GalK, galactokinase; GalM, galactose epimerase; GalT, UDP-glucose: alpha-D-galactose-1-phosphate uridylyltransferase; GalU, UDP-glucose pyrophosphorylase; GapB, glyceraldehyde-3-phosphate dehydrogenase; Gk, glucokinase; LacA, beta-galactosidase; LacL, beta-galactosidase large subunit; LacM, beta-galactosidase small subunit; ManA, mannose-6-phosphate isomerase; MtlD, mannitol-1-phosphate 5-dehydrogenase; Pbg, 6-phosphate -β-glucosidase; PEP, phosphoenolpyruvate; PfkA, 6-phosphofructokinase; Pgi, glucose-6-phosphate isomerase; Pgk, phosphoglycerate kinase; Pgm, beta-phosphoglucomutase; PgmA, phosphoglycerate mutase; PRPP, 5-phosphoribosyldiphosphate; Prs, ribose-phosphate pyrophosphokinase; Pyk, pyruvate kinase; RbsK, ribokinase; RhaA, L-rhamnose isomerase; RhaB, rhamnulokinase; RhaD, rhamnulose-1-phosphate aldolase; RmlA, glucose-1-phosphate thymidylyltransferase; RmlB, dTDP-glucose 4, 6-dehydratase; RmlC, dTDP-4-dehydrorhamnose 3,5-epimerase; RmlD, dTDP-4-keto-L-rhamnose reductase; Rpe, ribulose-phosphate 3-epimerase; RpiA, ribose-5-phosphate epimerase; SacA, sucrose-6-phosphate hydrolase; SacK, fructokinase; SrlD1/SrlD2, sorbitol-6-phosphate 2-dehydrogenase;TarJ, ribitol-5-phosphate 2-dehydrogenase; TpiA, triosephosphate isomerase; UGDH, UDP-glucose 6-dehydrogenase. The important pathways are shown in red.
Ijms 22 13452 g003
Figure 4. The distribution of carbohydrate metabolism genes clusters in the L. plantarum LP-F1.
Ijms 22 13452 g004aIjms 22 13452 g004b
Figure 5. The distribution of TCSs in the L. plantarum LP-F1. The TCSs were predicted by SMART domain (http://smart.embl.de/, accessed on 9 December 2021).
Ijms 22 13452 g005
Figure 6. Correlation analysis between the expressions of different sugar metabolism related genes.
Ijms 22 13452 g006
Figure 7. Correlation analysis between the expressions of regulated genes and different sugar metabolism related genes.
Ijms 22 13452 g007
Publisher’s Note: MDPI stays neutral with regard to jurisdictional claims in published maps and institutional affiliations.

