Article

Putative RNA Ligase RtcB Affects the Switch between T6SS and T3SS in Pseudomonas aeruginosa

1
Department of Oral Biology, Rady Faculty of Health Sciences, Dr. Gerald Niznick College of Dentistry, University of Manitoba, Winnipeg, MB R3E 0W2, Canada
2
College of Life Sciences, Northwest University, Xi’an 710069, China
3
Department of Human Anatomy and Cell Science, Rady Faculty of Health Sciences, Max Rady College of Medicine, University of Manitoba, Winnipeg, MB R3E 0W2, Canada
4
Department of Medical Microbiology and Infectious Disease, Rady Faculty of Health Sciences, University of Manitoba, Winnipeg, MB R3E 0W2, Canada
*
Author to whom correspondence should be addressed.
Int. J. Mol. Sci. 2021, 22(22), 12561; https://doi.org/10.3390/ijms222212561
Submission received: 2 September 2021 / Revised: 4 November 2021 / Accepted: 6 November 2021 / Published: 22 November 2021
(This article belongs to the Special Issue Biotechnology-Recent Advances)

Abstract

:
The opportunistic pathogen Pseudomonas aeruginosa is a significant cause of infection in immunocompromised individuals, cystic fibrosis patients, and burn victims. To benefit its survival, the bacterium adapt to either a motile or sessile lifestyle when infecting the host. The motile bacterium has an often activated type III secretion system (T3SS), which is virulent to the host, whereas the sessile bacterium harbors an active T6SS and lives in biofilms. Regulatory pathways involving Gac-Rsm or secondary messengers such as c-di-GMP determine which lifestyle is favorable for P. aeruginosa. Here, we introduce the RNA binding protein RtcB as a modulator of the switch between motile and sessile bacterial lifestyles. Using the wild-type P. aeruginosa PAO1, and a retS mutant PAO1(∆retS) in which T3SS is repressed and T6SS active, we show that deleting rtcB led to simultaneous expression of T3SS and T6SS in both PAO1(∆rtcB) and PAO1(∆rtcBretS). The deletion of rtcB also increased biofilm formation in PAO1(∆rtcB) and restored the motility of PAO1(∆rtcBretS). RNA-sequencing data suggested RtcB as a global modulator affecting multiple virulence factors, including bacterial secretion systems. Competitive killing and infection assays showed that the three T6SS systems (H1, H2, and H3) in PAO1(∆rtcB) were activated into a functional syringe, and could compete with Escherichia coli and effectively infect lettuce. Western blotting and RT-PCR results showed that RtcB probably exerted its function through RsmA in PAO1(∆rtcBretS). Quantification of c-di-GMP showed an elevated intracellular levels in PAO1(∆rtcB), which likely drove the switch between T6SS and T3SS, and contributed to the altered phenotypes and characteristics observed. Our data demonstrate a pivotal role of RtcB in the virulence of P. aeruginosa by controlling multiple virulence determinants, such as biofilm formation, motility, pyocyanin production, T3SS, and T6SS secretion systems towards eukaryotic and prokaryotic cells. These findings suggest RtcB as a potential target for controlling P. aeruginosa colonization, establishment, and pathogenicity.

1. Introduction

P. aeruginosa is a motile Gram-negative bacterium and a nosocomial pathogen causing life-threatening infections in humans [1]. Its large genome and numerous regulatory elements allow the bacterium to thrive in versatile environments [2].
P. aeruginosa produces a variety of virulence factors, including cell-associated structural features such as flagellum and pili, and extracellular effectors such as exotoxins and pyocyanin [3]. These exotoxins are secreted to the environment or directly to the host and/or other bacteria [4,5,6]. During the early stages of infection, the bacterial pathogen in a planktonic and motile lifestyle induces tissue damage and inflammation in the host [7]. The bacterium can physically connect with the host and initiate the translocation of toxins directly to the host tissue through the type three secretion system (T3SS) [8]. Together with LasB protease, T3SS effectors damage host cell integrity, and lead to rapid bacterial growth and spread, resulting in an acute infection of the host [7]. Under conditions of chronic infection, the bacterium forms a mucoid matrix and loses its motility and T3SS activity, rendering a sessile biofilm-forming stage [9]. Biofilm formation promotes long-term bacterial survival and the development of resistance to clearance by the host immune system and drug interventions [7].
The phosphorylation of GacA leads to an upregulation of two small RNAs (sRNAs), RsmY and RsmZ. RsmY/Z sRNAs bind to the global post-transcriptional regulator RsmA and sequester this protein, resulting in the expression of type six secretion systems (T6SSs) and biofilm formation-related genes. The sensor kinase RetS modulates the activity of GacS, which, in turn, inhibits the phosphorylation of GacA and represses the transcription of RsmY/Z. Without antagonizing sRNAs, RsmA promotes the expression of T3SS genes and negatively affects T6SS [10,11,12,13,14]. The sessile lifestyle of P. aeruginosa, marked by biofilm production and higher pyocyanin pigmentation, was reported as a specific characteristic of PAO1(∆retS) [10]. Signaling associated with cyclic diguanylate (c-di-GMP) has emerged as a key mediator of the switch between the motile and sessile P. aeruginosa lifestyles by controlling features such as flagella rotation, antibiotic resistance, adhesin expression, type four pili retraction, secondary messengers, and stress responses [15,16]. C-di-GMP biogenesis is responsive to cellular stress and can promote or prevent either lifestyle of the bacteria [17].
The stress response protein RtcB is a conserved protein in all three domains of life [18]. In bacteria, it is believed to splice the 5′-OH ends of RNA to either 2′, 3′-cyclic phosphate or 3′-phosphate ends [19]. In E. coli, RtcB re-ligates a fragment of 16S rRNA to the rRNA body after cleavage by a stress-induced endonuclease [20]. In P. aeruginosa, RtcB is encoded by an operon containing an RNA cyclase RtcA and two conserved proteins of unknown function; PA4582 and PA4584 [21,22]. The operon transcription is regulated by the adjacent protein RtcR, encoded in the opposite direction [21]. The activation of RtcR and its divergent CARF (CRISPR-associated Rossman fold) domain were recently discussed [23,24]. CARF is a ligand-binding regulator [25], and damaged tRNAs activate the transcription of the rtcBA operon in the presence of RtcA [26]. It was suggested that the highly conserved RtcB might play a vital role in bacterial survival [18]. There is no report so far on the role of RtcB in the virulence of bacteria.
In this study, we identified RtcB as a modulator of T6SSs and T3SS expression. We explored the role of RtcB beyond its stress response activity (RNA 2′, 3′-cyclic phosphate, and 5′-OH ligase) in P. aeruginosa. We also investigated the role of RtcB P. aeruginosa in pathogenicity and the underlying mechanisms using the wild type P. aeruginosa PAO1, which has an active T3SS and inactive T6SS under normal lab conditions, and a retS mutant PAO1(∆retS), in which T3SS is repressed and T6SS is constitutively active. RNA-sequencing was also performed to examine the global effect of RtcB.

2. Results

2.1. RtcB Controls the Expression of Multiple Phenotypes and Virulence Factors

The conserved RtcB protein is involved in the repair of stress-induced RNA damage [18,27,28]. Protein blast analysis of RtcB in E. coli and P. aeruginosa showed that the proteins are 70% identical, thus expectedly fulfilling similar functions [18]. Since the role of RtcB in the virulence of bacteria has not yet been fully explored, we examined the possible function of RtcB in the pathogenicity of P. aeruginosa. The PAO1(∆rtcB) in wild type background PAO1, and PAO1(∆rtcBretS) in PAO1(ΔretS) background, were generated to investigate the role of RtcB in both motile and sessile bacteria, respectively. In PAO1(ΔretS), multiple virulence factors are down-regulated, including T3SS [10,29,30,31].
We tested multiple phenotypes of PAO1(∆rtcB) and PAO1(∆rtcBretS), including pyocyanin production, biofilm formation, and motility, as compared with PAO1 and PAO1(∆retS), respectively. The first noticeable difference was that PAO1(∆rtcB) cultures showed a significantly higher production of pyocyanin compared to PAO1 [32]. To evaluate the effects of rtcB deletion on pyocyanin production in these cells, the double mutant PAO1(∆rtcBretS) was constructed. Subsequently, pyocyanin biosynthesis was assayed in the PAO1, PAO1(∆rtcB), PAO1(∆retS), and PAO1(∆rtcBretS) strains. Although production of pyocyanin increased in PAO1(∆rtcB) compared to PAO1, there was no significant difference (p = 0.433) between PAO1(∆rtcBretS) and PAO1(∆retS) (Figure 1A). We further tested the impact of rtcB deletion on the biofilm production and motility of P. aeruginosa.
Interestingly, biofilm formation in PAO1(∆rtcBretS) was reduced to wild-type levels, indicating that the increase due to deletion of retS was normalized by rtcB deletion (p < 0.0001) (Figure 1B). It appeared that PAO1(∆rtcB) formed slightly more biofilm; however, this did not reach statistical significance.
Bacterial motility is the hallmark of the acute phase of infection and is importantly controlled by the complex regulatory interplay of flagellar assembly, chemotaxis, type four pili, the Gac-Rsm two-component system, and quorum sensing [33,34,35,36,37]. As shown in Figure 1C, twitching motility did not show an apparent change in PAO1(∆rtcB), whereas it increased in PAO1(∆rtcBretS) compared to PAO1(∆retS). Swarming and swimming of PAO1(∆rtcB) were decreased compared to wild type PAO1 and were highly elevated in PAO1(∆rtcBretS) compared to background PAO1(∆retS).

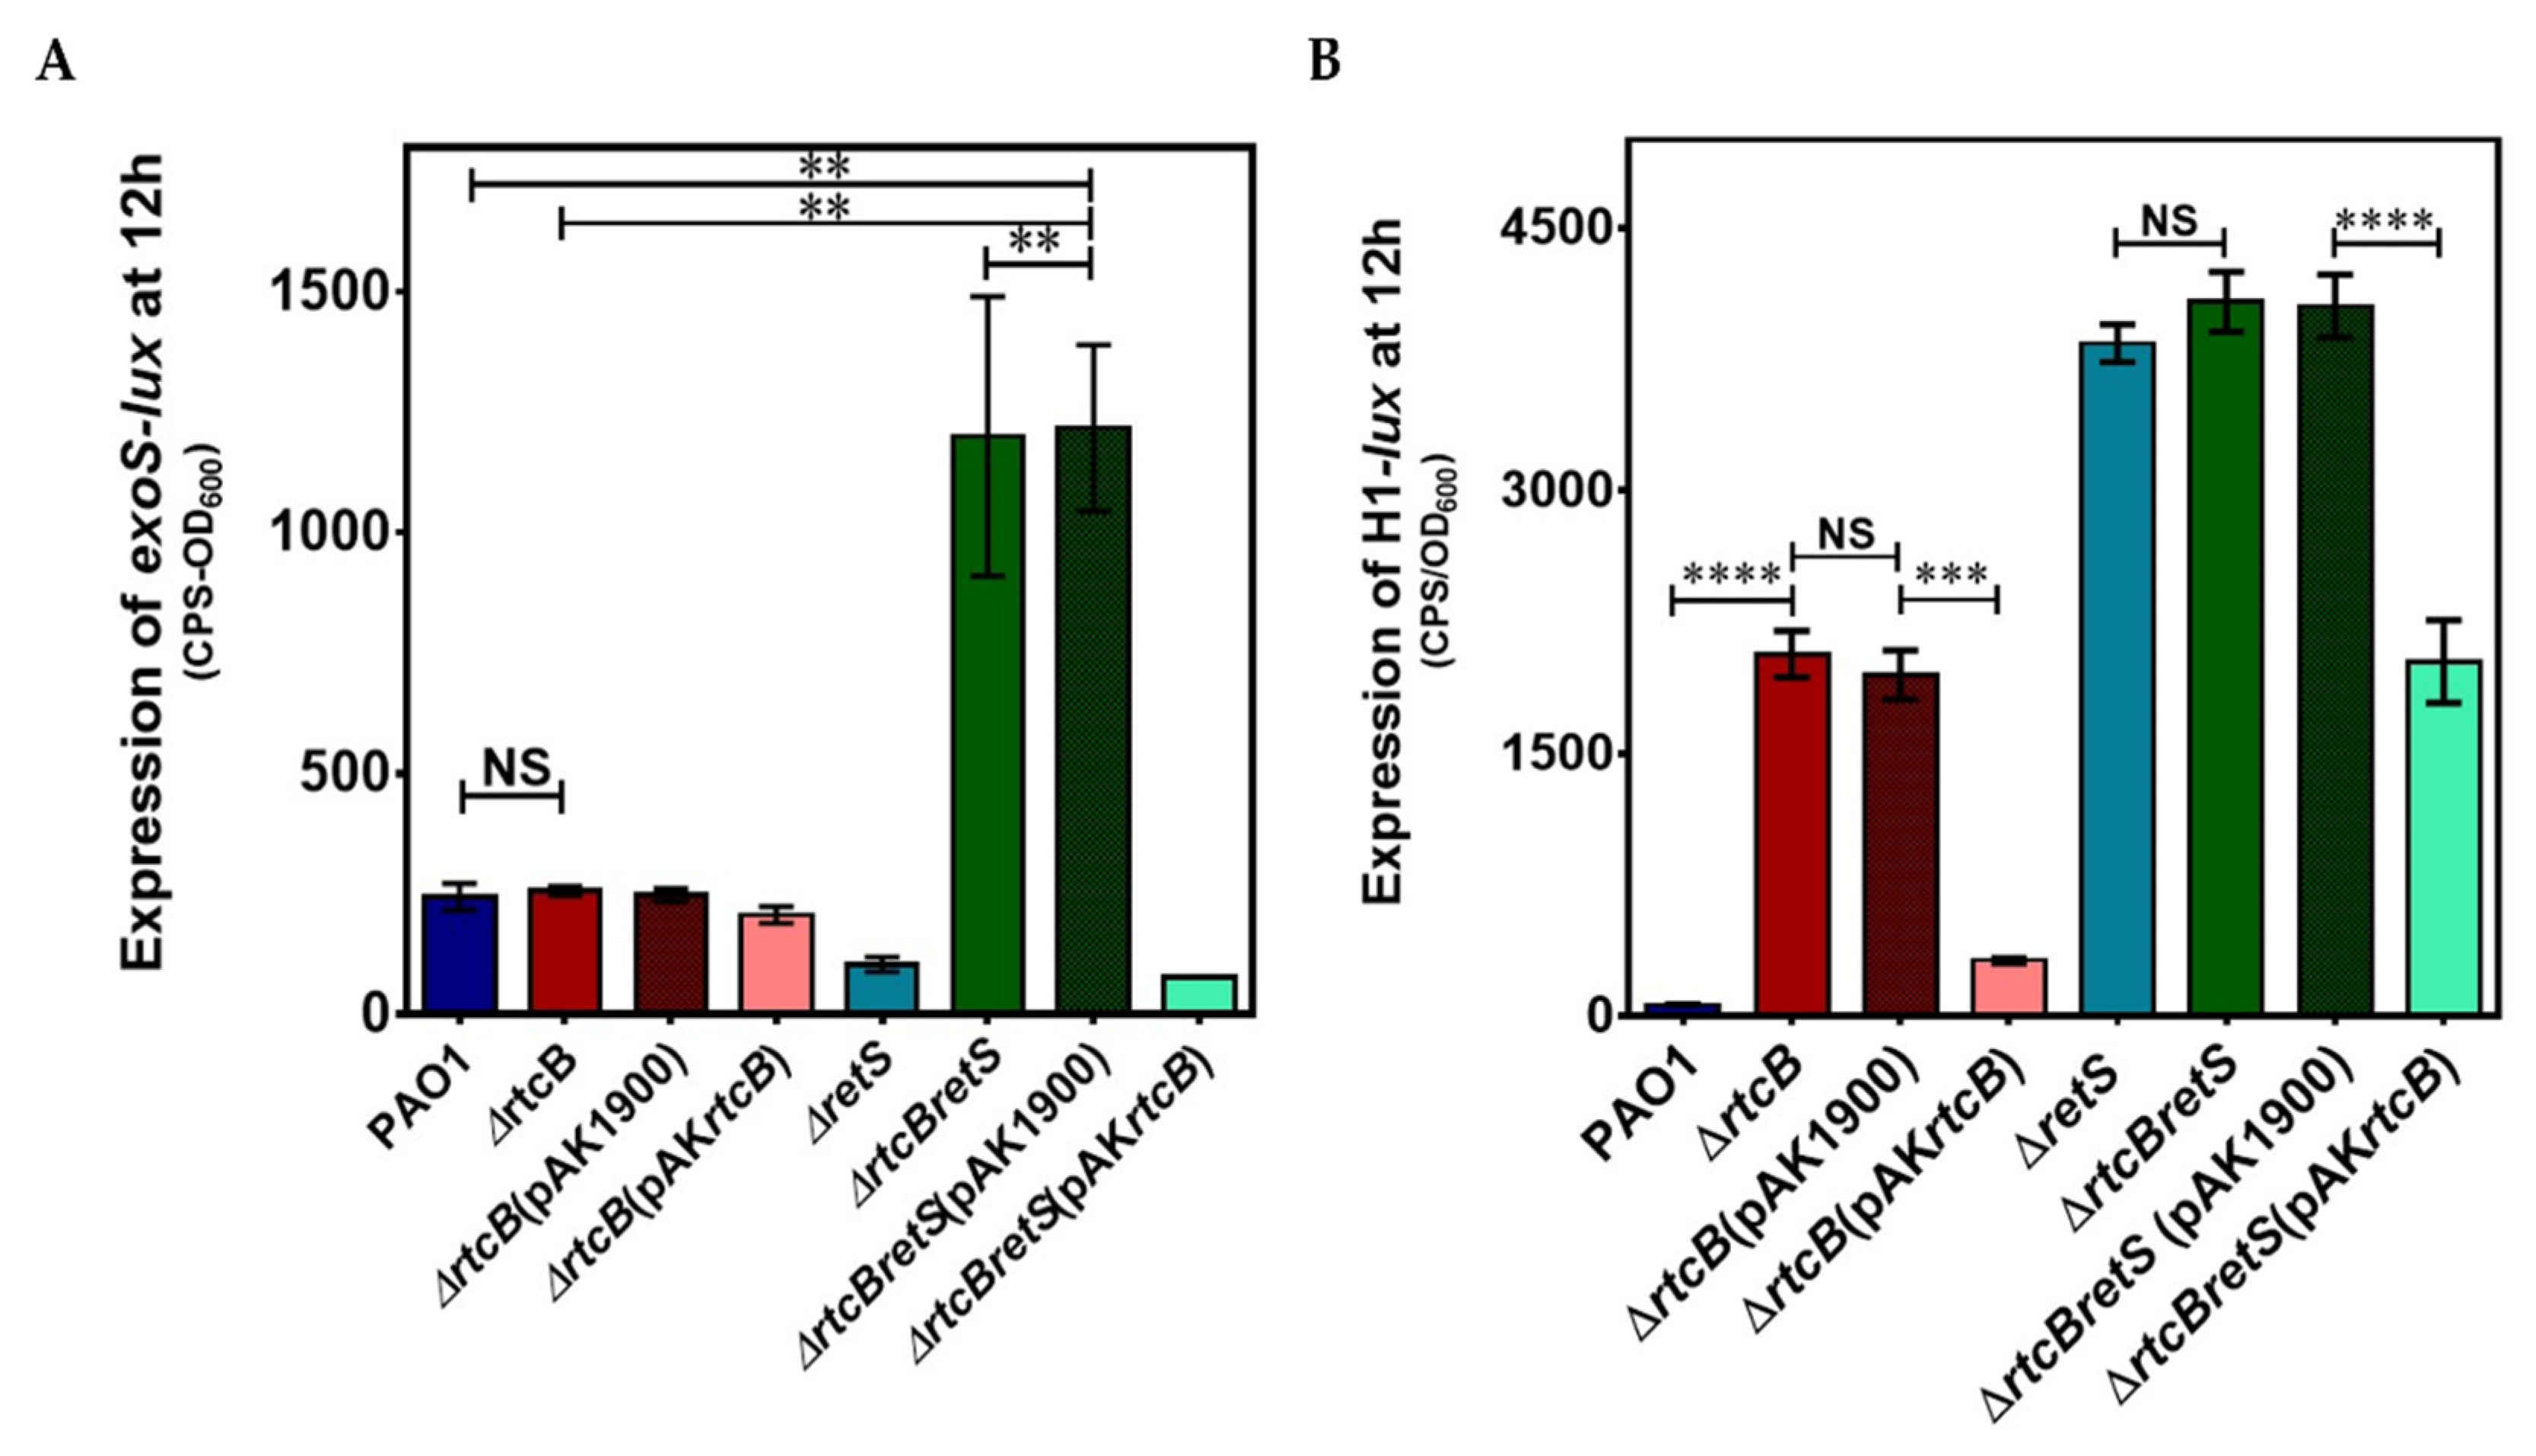
2.2. Putative RNA Ligase RtcB Affects T6SS and T3SS Transcription and Its Deletion Inactivates the Gac-Rsm Controlled Switch between the Two Secretion Systems

Lower biofilm formation and higher motility concomitant with T3SS expression have been repeatedly reported as typical characteristics of motile bacteria [37,38]. Moreover, when T3SS is activated under the Gac-Rsm system, T6SS is repressed in an opposite manner. To assess if lower biofilm formation in PAO1(∆rtcBretS) is the result of a switch to a motile lifestyle due to active T3SS, the transcriptional activity of T3SS was examined in the PAO1, PAO1(∆rtcB), PAO1(∆retS), and PAO1(∆rtcBretS) strains. No differences were observed in the expression of exoS, an effector of T3SS, between PAO1 (∆rtcB) and the wild-type strain. Interestingly, while deletion of retS alone resulted in a moderate decrease in exoS expression, combined deletion of rtcB and retS dramatically increased its abundance (Figure 2A). We also measured the transcription of the T6SS reporter, using H1-T6SS as a representative of T6SSs, to verify if T6SS is repressed in PAO1(∆rtcBretS). While no change was observed in H1-T6SS promoter activity in PAO1(∆rtcBretS), a considerable increase could be detected in PAO1(∆rtcB) (p < 0.0001). The active T3SS and T6SS in rtcB deletion mutants suggested that the switch between the activation of T3SS and T6SS by Gac-Rsm pathway was voided by the deletion of rtcB, and both secretion systems are expressed in PAO1(∆rtcB) and PAO1(∆rtcBretS) simultaneously (Figure 2B). These results show a pivotal role of RtcB in the control of some of the major virulence factors of P. aeruginosa.

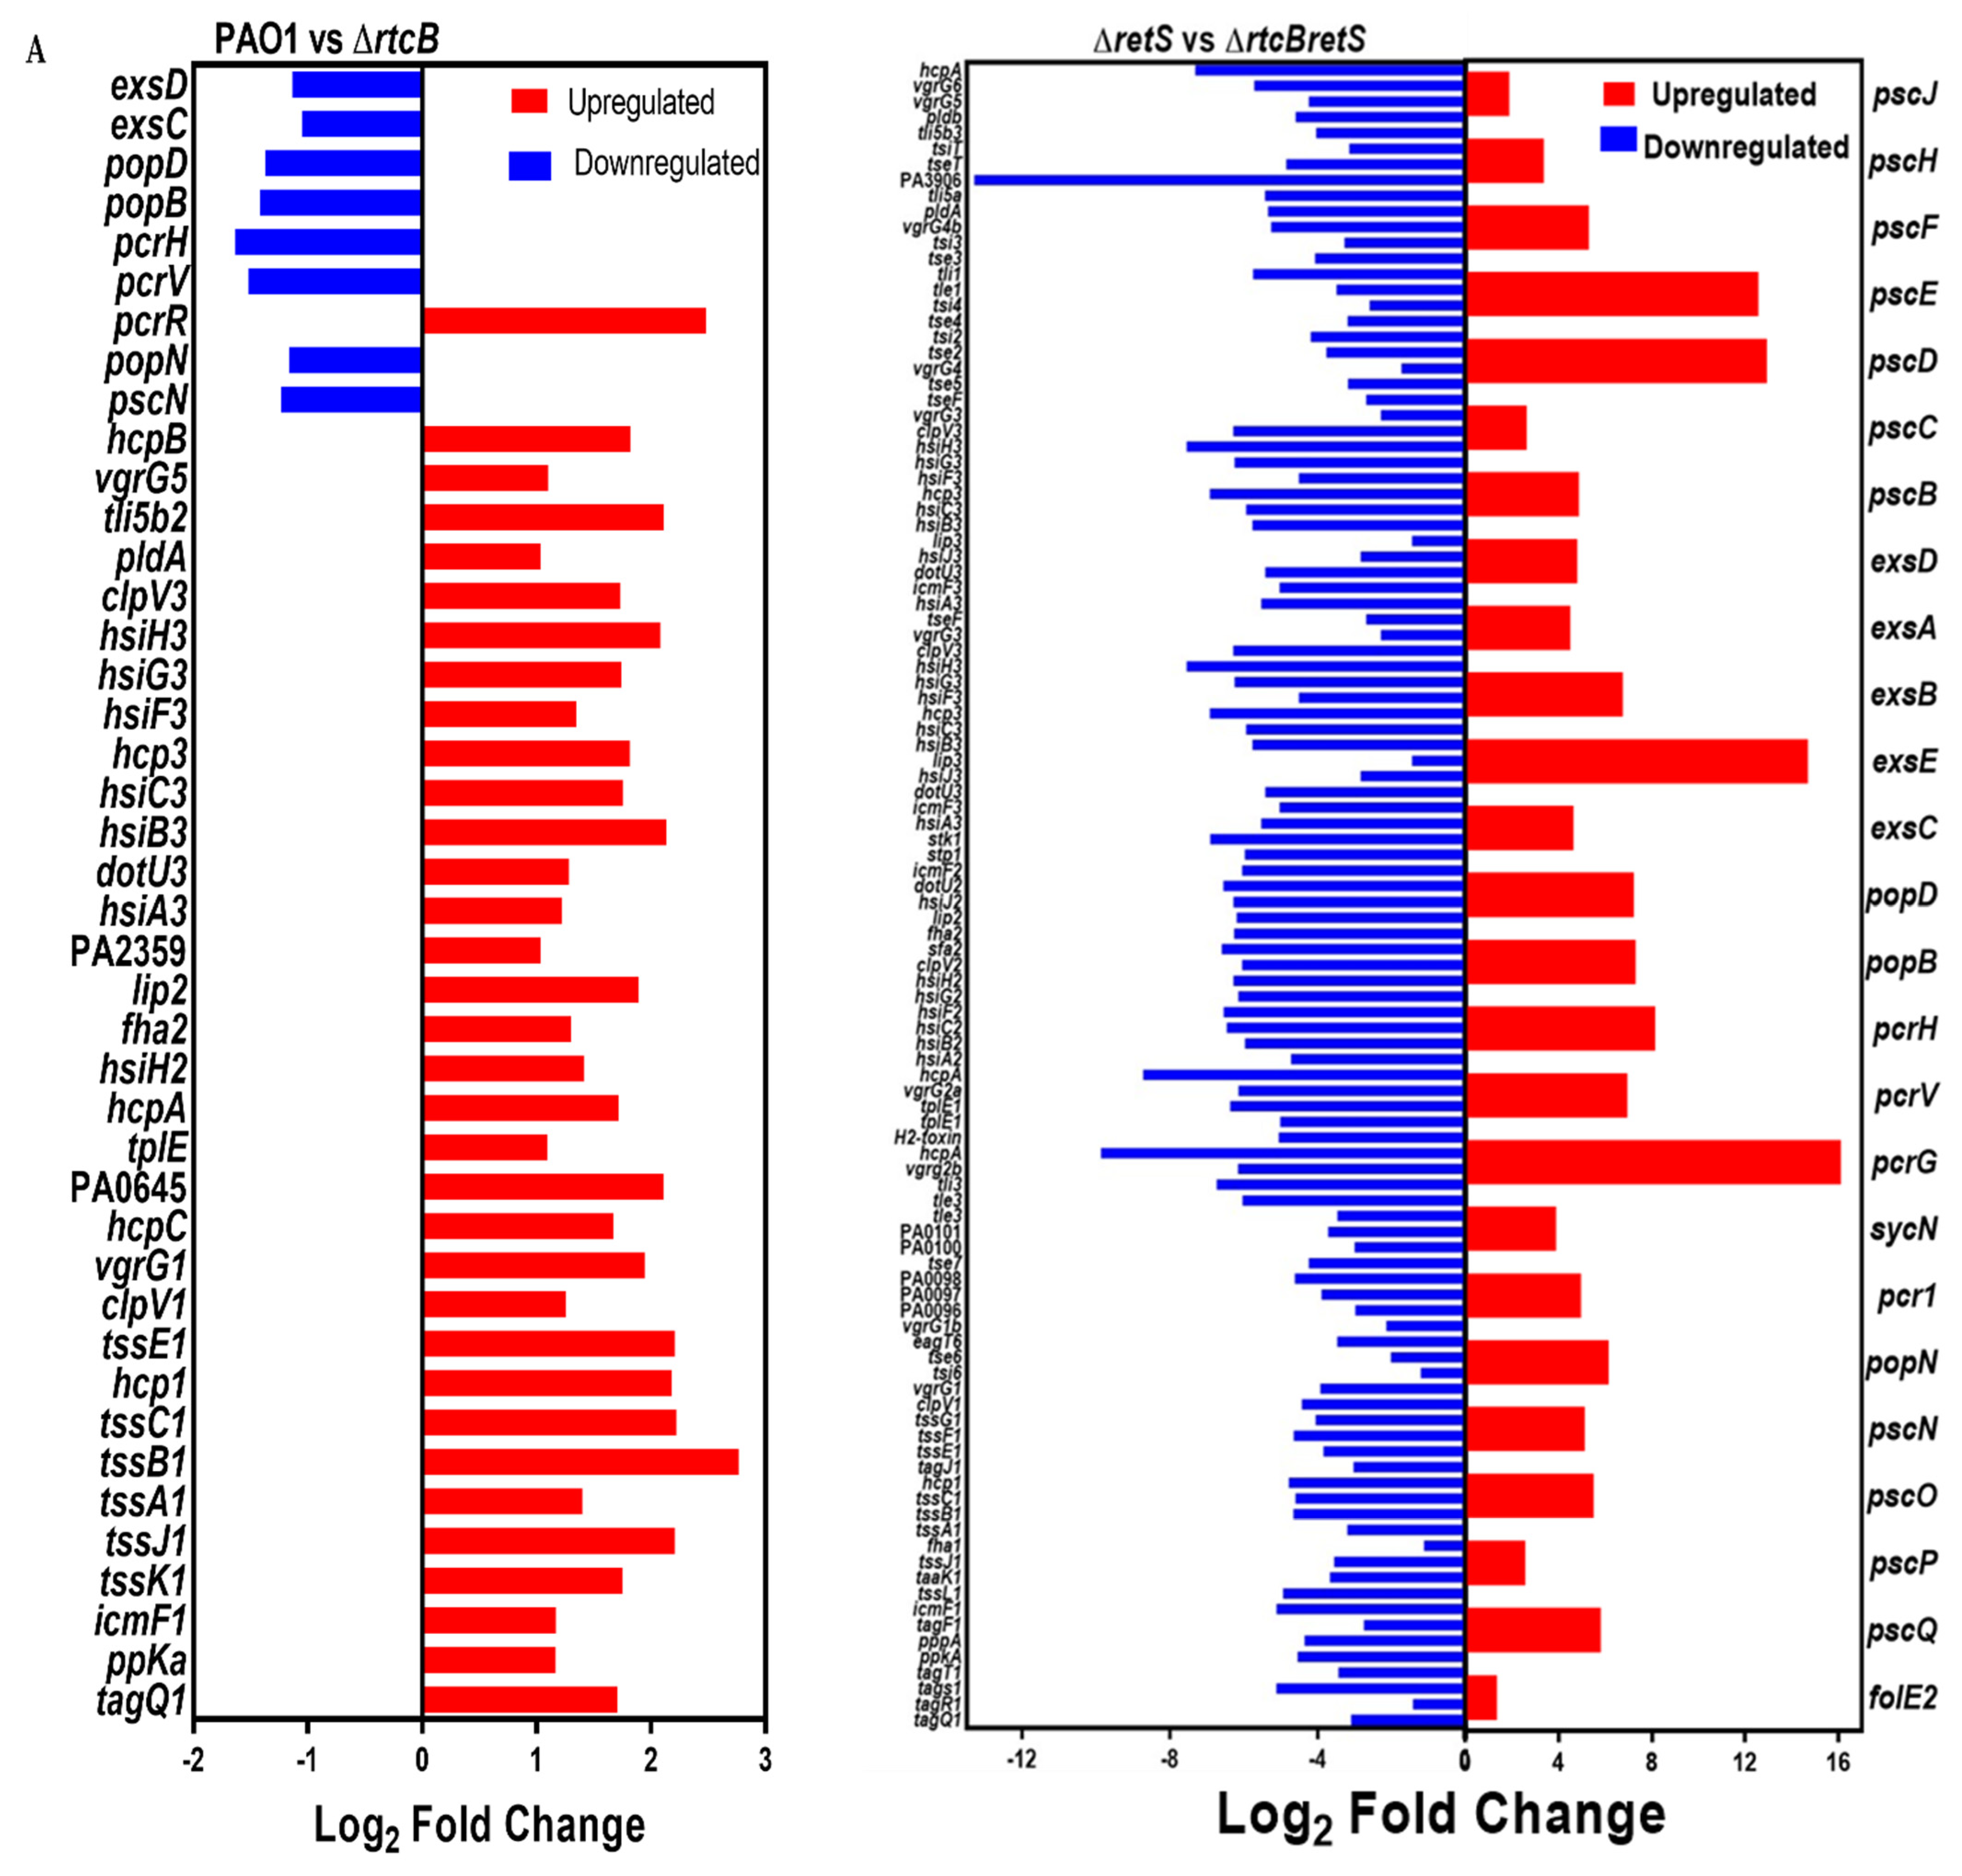
2.3. Transcriptional Profiling of the rtcB Knockout Mutant

To further investigate the impact of RtcB on the expression dynamics associated with T3SS and T6SS activities in P. aeruginosa, RNAseq analysis was carried out in two groups: (1) PAO1 vs. PAO1(∆rtcB) and (2) PAO1(∆retS) vs. PAO1(∆rtcBretS).
Differentially expressed genes (DEGs) across samples with fold change ≥±2 (log 2 fold change ≥±1) and false discovery rate-adjusted p (q value) < 0.05 were identified by edgeR package (http://www.r-project.org/; accessed on 11 January 2019). The effect of rtcB deletion on gene expression of the whole P. aeruginosa genome is presented in Supplementary Materials, Tables S1 and S2. DEGs of the transcriptome analysis showed that a total of 370 genes were differentially expressed in group 1: 271 genes were upregulated, and 99 genes were downregulated (Supplementary Materials, Table S3). In group 2, 1030 DEGs were revealed, of which 498 were up- and 532 were downregulated (Figure 3A) (Supplementary Materials, Table S4). The DEGs filtered by significance of log 2-fold change are shown in Supplementary Materials, Tables S5 and S6.
DEGs were specified based on the sequence homology and the gene ontology (GO) of those that were significantly enriched (p < 0.05). Comparing results to the Kyoto encyclopedia of genes and genomes (KEGG), enrichments indicated that the transcription of genes participating in cellular metabolic processes, including global pathways, the metabolism of carbohydrates and amino acids, and biodegradation of xenobiotics, were significantly altered in both groups. This confirms that RtcB plays a key role in the modulation of the cell metabolism. Also, KEGG enrichments show that deletion of rtcB affects secondary metabolites, signal transduction pathways, and cell motility. Of particular interest to our study, bacterial secretion systems (a subcategory of transmembrane proteins) represent the sixth and fifth most affected DEGs in groups 1 and 2, respectively. That includes T2SS, T5SS, T3SS, T6SS, and Sec-SRP in both groups. The top 20 KEGG enrichments modulated by the deletion of rtcB are presented in Figure 3C for groups 1 (left panel) and 2 (right panel). DEGs related to bacterial secretion systems T2SS, T5SS, and Sec-SRP are outlined in Table 1, whereas those associated with T3SS and T6SS are shown separately.

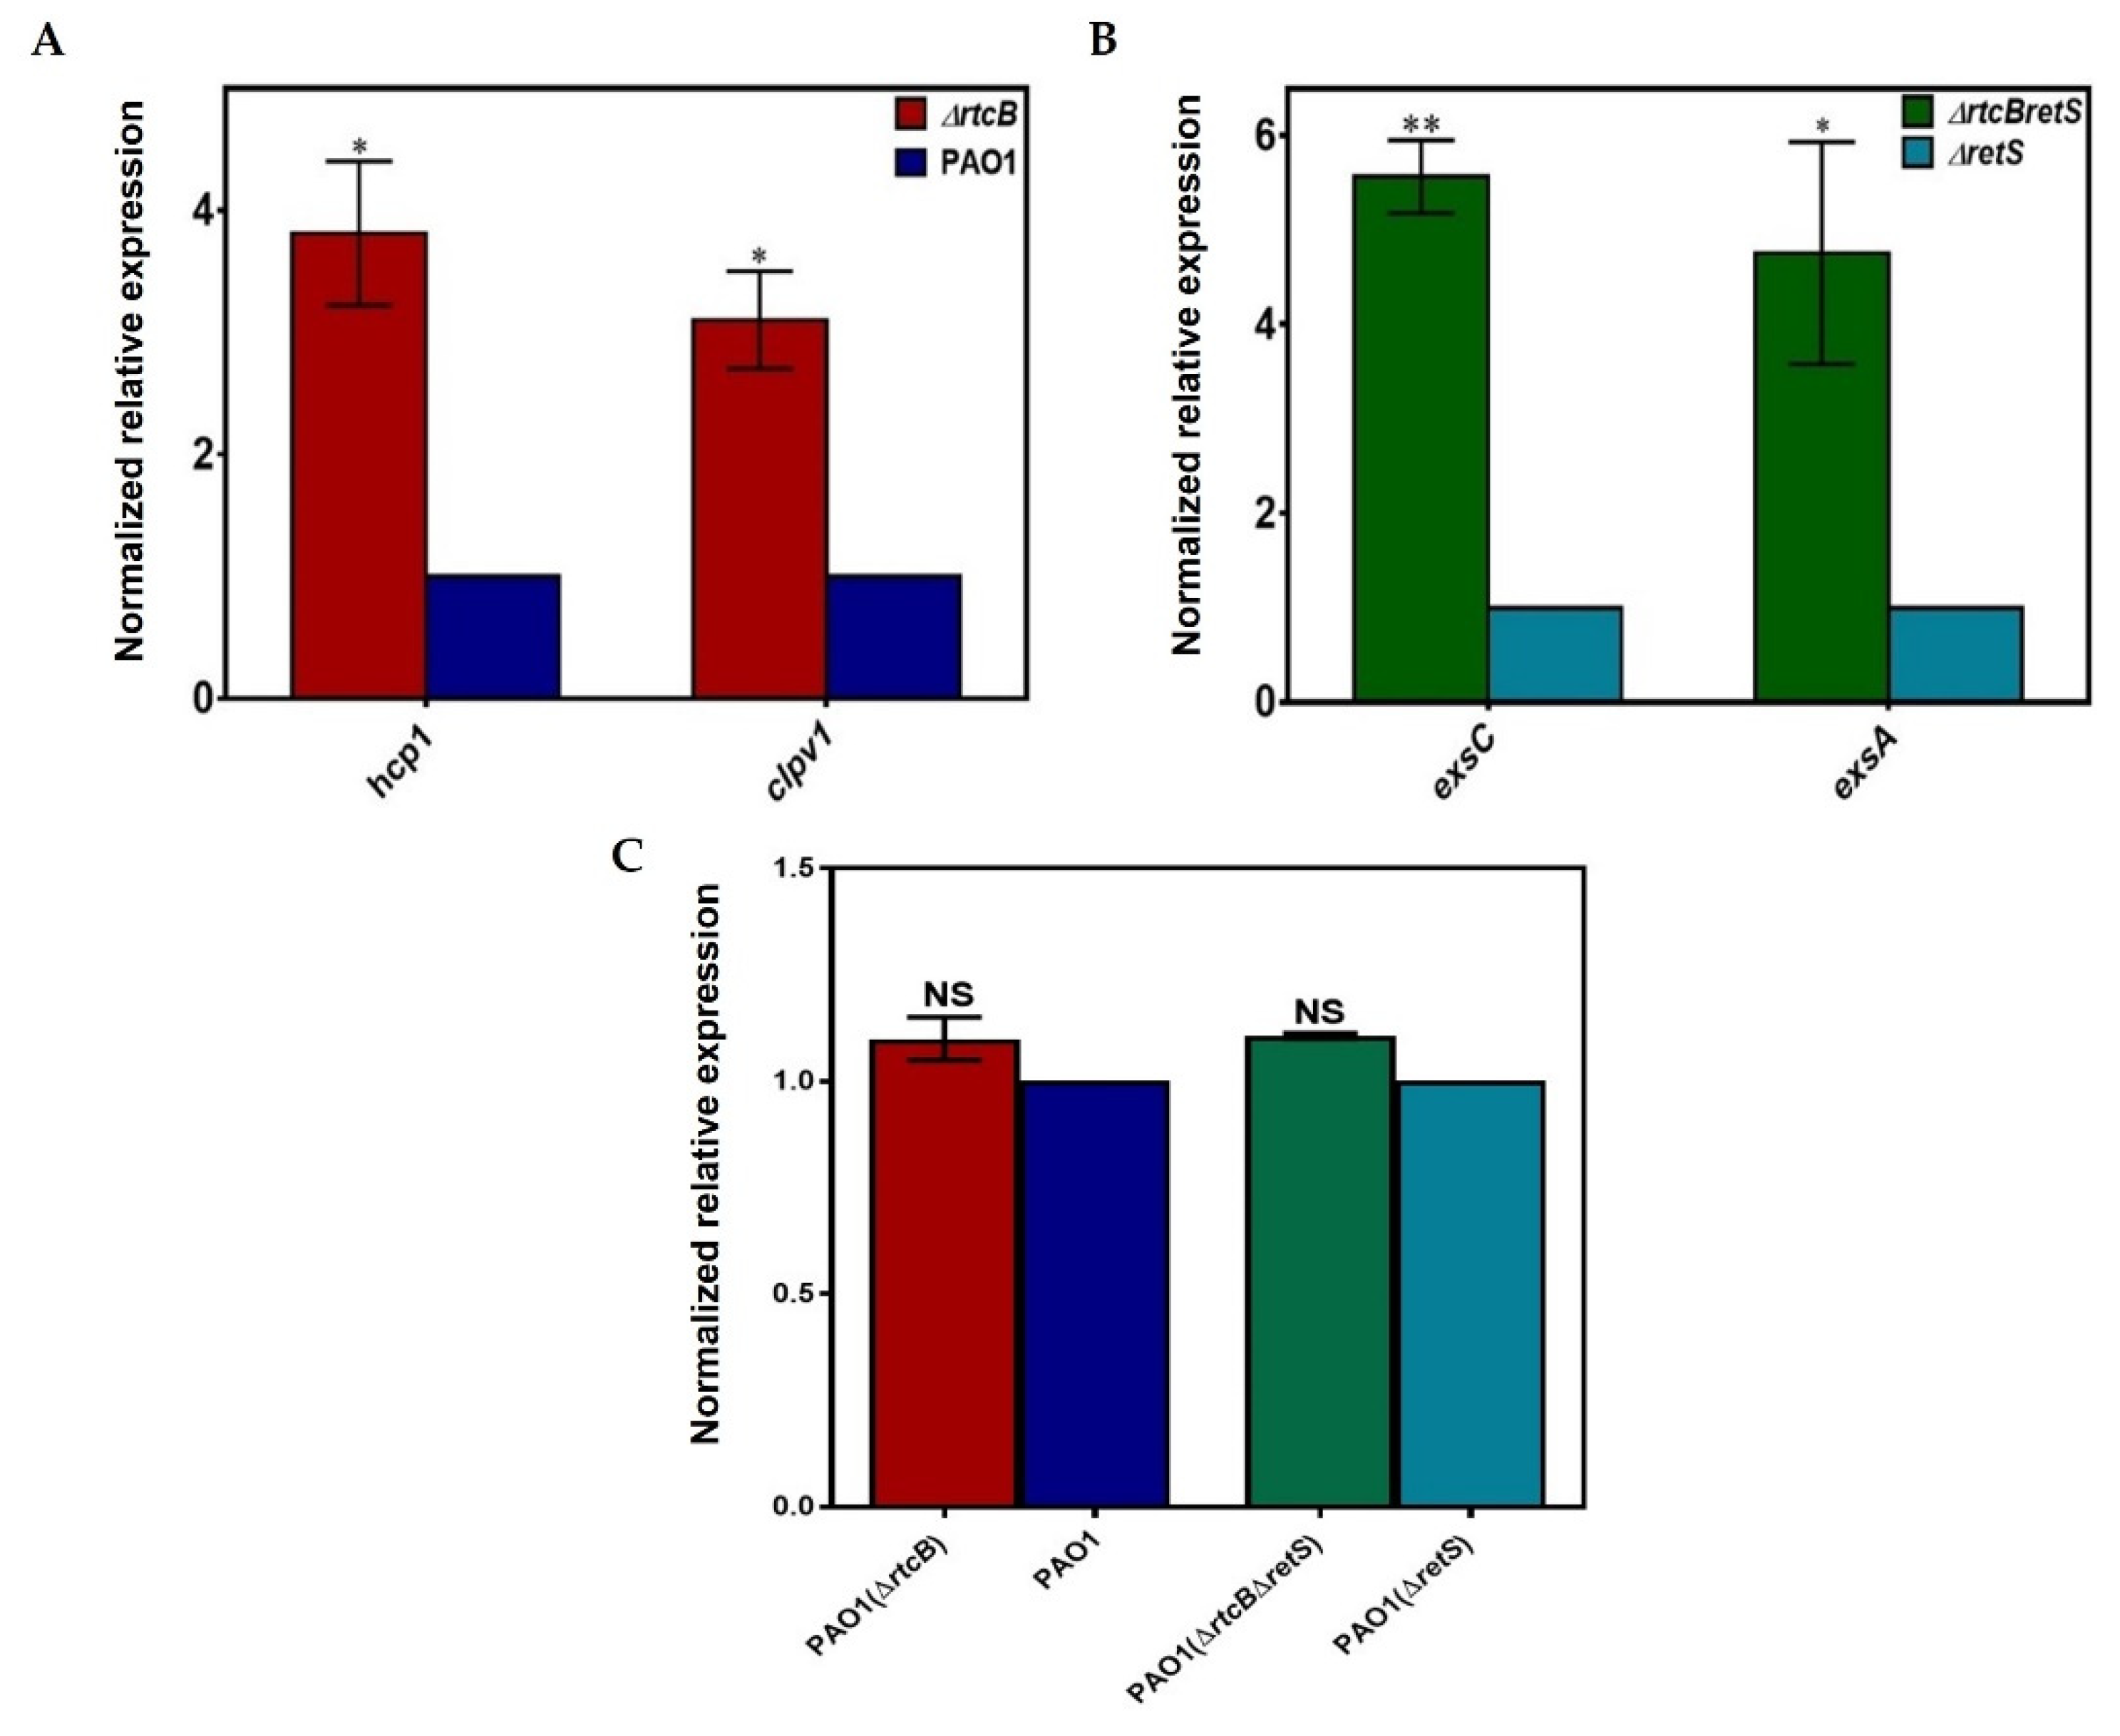
2.4. Deletion of rtcB Does Not Affect Transcription of rsmA but Upregulates the Expression of clpV1, hcp1, exsC, and exsA

To confirm the RNA-sequencing data, we selected various genes of T3SS and T6SS, and quantified those by RT-PCR: hcp1, clpV1, and rsmA for PAO1(∆rtcB) vs. PAO1, and exsA, exsC, and rsmA for PAO1(∆rtcBretS) vs. PAO1(∆retS).
Hcp1 secretion is an indication of active H1-T6SS [39] and ClpV1 is the ATPase of H1-T6SS required for the phosphorylation-dependent secretion of H1-T6SS [40]. Gene expression relative to the rpoD housekeeping gene was analyzed. The results showed that the mRNA levels of clpV1 and hcp1 were increased more than 3- and 3.5-fold, respectively, in PAO1(∆rtcB) compared to PAO1 (* p < 0.05, Figure 4A). In PAO1(∆rtcBretS), the expression of exsA and exsC was 4.5- (* p < 0.05) and 5.5-fold (** p < 0.01) higher than in PAO1(∆retS) (Figure 4B). The transcription of rsmA remained unchanged upon the deletion of rtcB in both PAO1 and PAO1(∆retS) (Figure 4C).

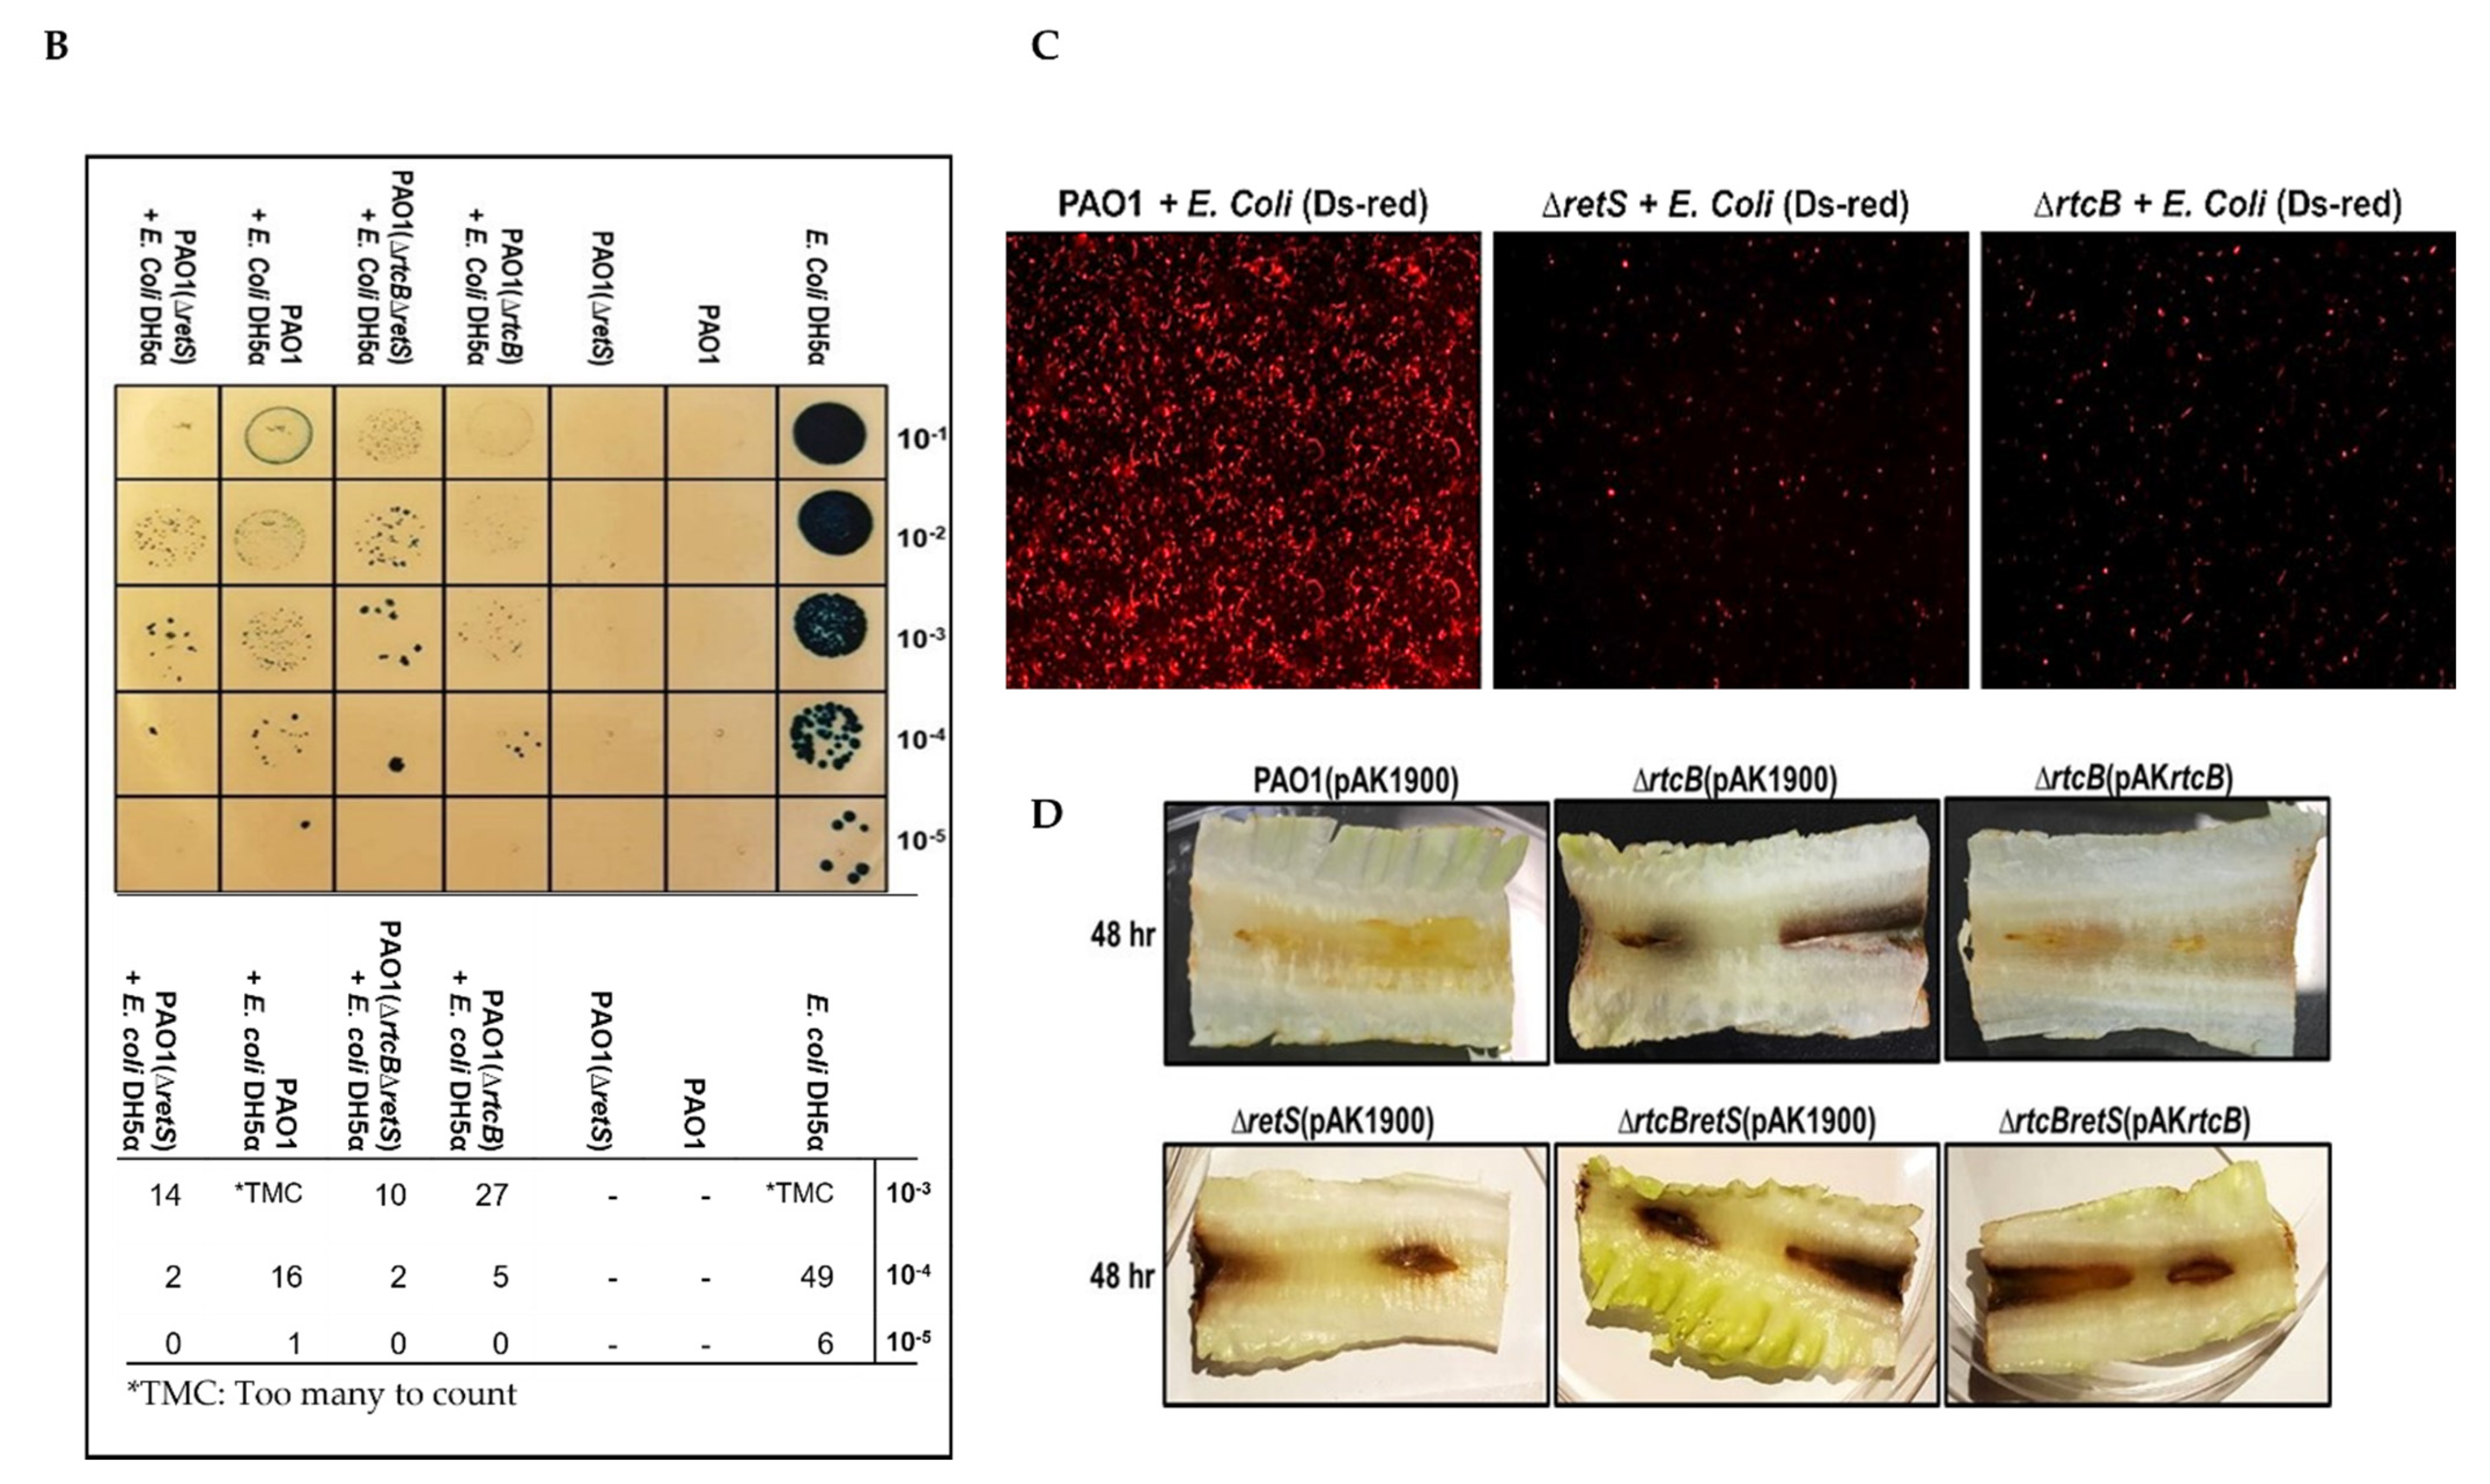
2.5. The Three T6SSs Are Activated upon Deletion of rtcB and Promote the Pathogenicity of P. aeruginosa

Transcriptomics showed that all three T6SSs (H1-, H2-, H3-T6SS) are affected by rtcB deletion. Figure 5A represents the expression of specific T6SSs and T3SS genes significantly affected by deletion of rtcB. To confirm the sequencing data and assess the involvement of RtcB in the pathogenicity of P. aeruginosa, we performed a competition assay for both prokaryotic [41,42] and eukaryotic prey [43,44] targeted by H1-, H2-, and H3-T6SS, respectively. In the prokaryotic competition assay, live E. coli prey cells not killed by P. aeruginosa appear blue in the colonies. Thus, a higher blue color intensity indicates an increased survival rate of E. coli due to less virulence of P. aeruginosa. PAO1(∆retS) harbors constitutively active T6SS (T6SS+) and was used as a positive control. As expected, PAO1(∆retS) exhibited significantly higher virulence compared to wild-type PAO1, as evidenced by a lower survival rate of E. coli cells. Importantly, PAO1(∆rtcB) also showed a higher killing potential than PAO1, similar to that of PAO1(∆retS), implying that T6SS in PAO1(∆rtcB) is activated (Figure 5B). To verify the increased pathogenicity of PAO1(∆rtcB) toward prokaryotes, we conducted a fluorometric killing assay in which prey E. coli cells were transformed with a vector harboring a pilG-DsRed fluorescent reporter; the density of red fluorescence is representative of viable E. coli. Fully confirming the results of our initial killing assay, PAO1(∆rtcB) demonstrated a similar killing force to PAO1(∆retS). These findings imply that T6SS is functionally active in PAO1(∆rtcB) and able to kill E. coli cells at a higher rate than PAO1 (Figure 5C).
Next, we performed a eukaryotic (plant) infection assay to validate the functionality of H2-T6SS and H3-T6SS by deletion of rtcB. Lettuce midribs inoculated with PAO1(∆rtcB) were highly infected, as shown by a much darker infection site color as compared to leaves exposed to PAO1. Furthermore, PAO1(∆rtcBretS) appeared to exhibit a slightly higher virulence toward the plant in comparison with PAO1(∆retS) (Figure 5D). These results further support that T6SS is activated after the deletion of rtcB in PAO1.

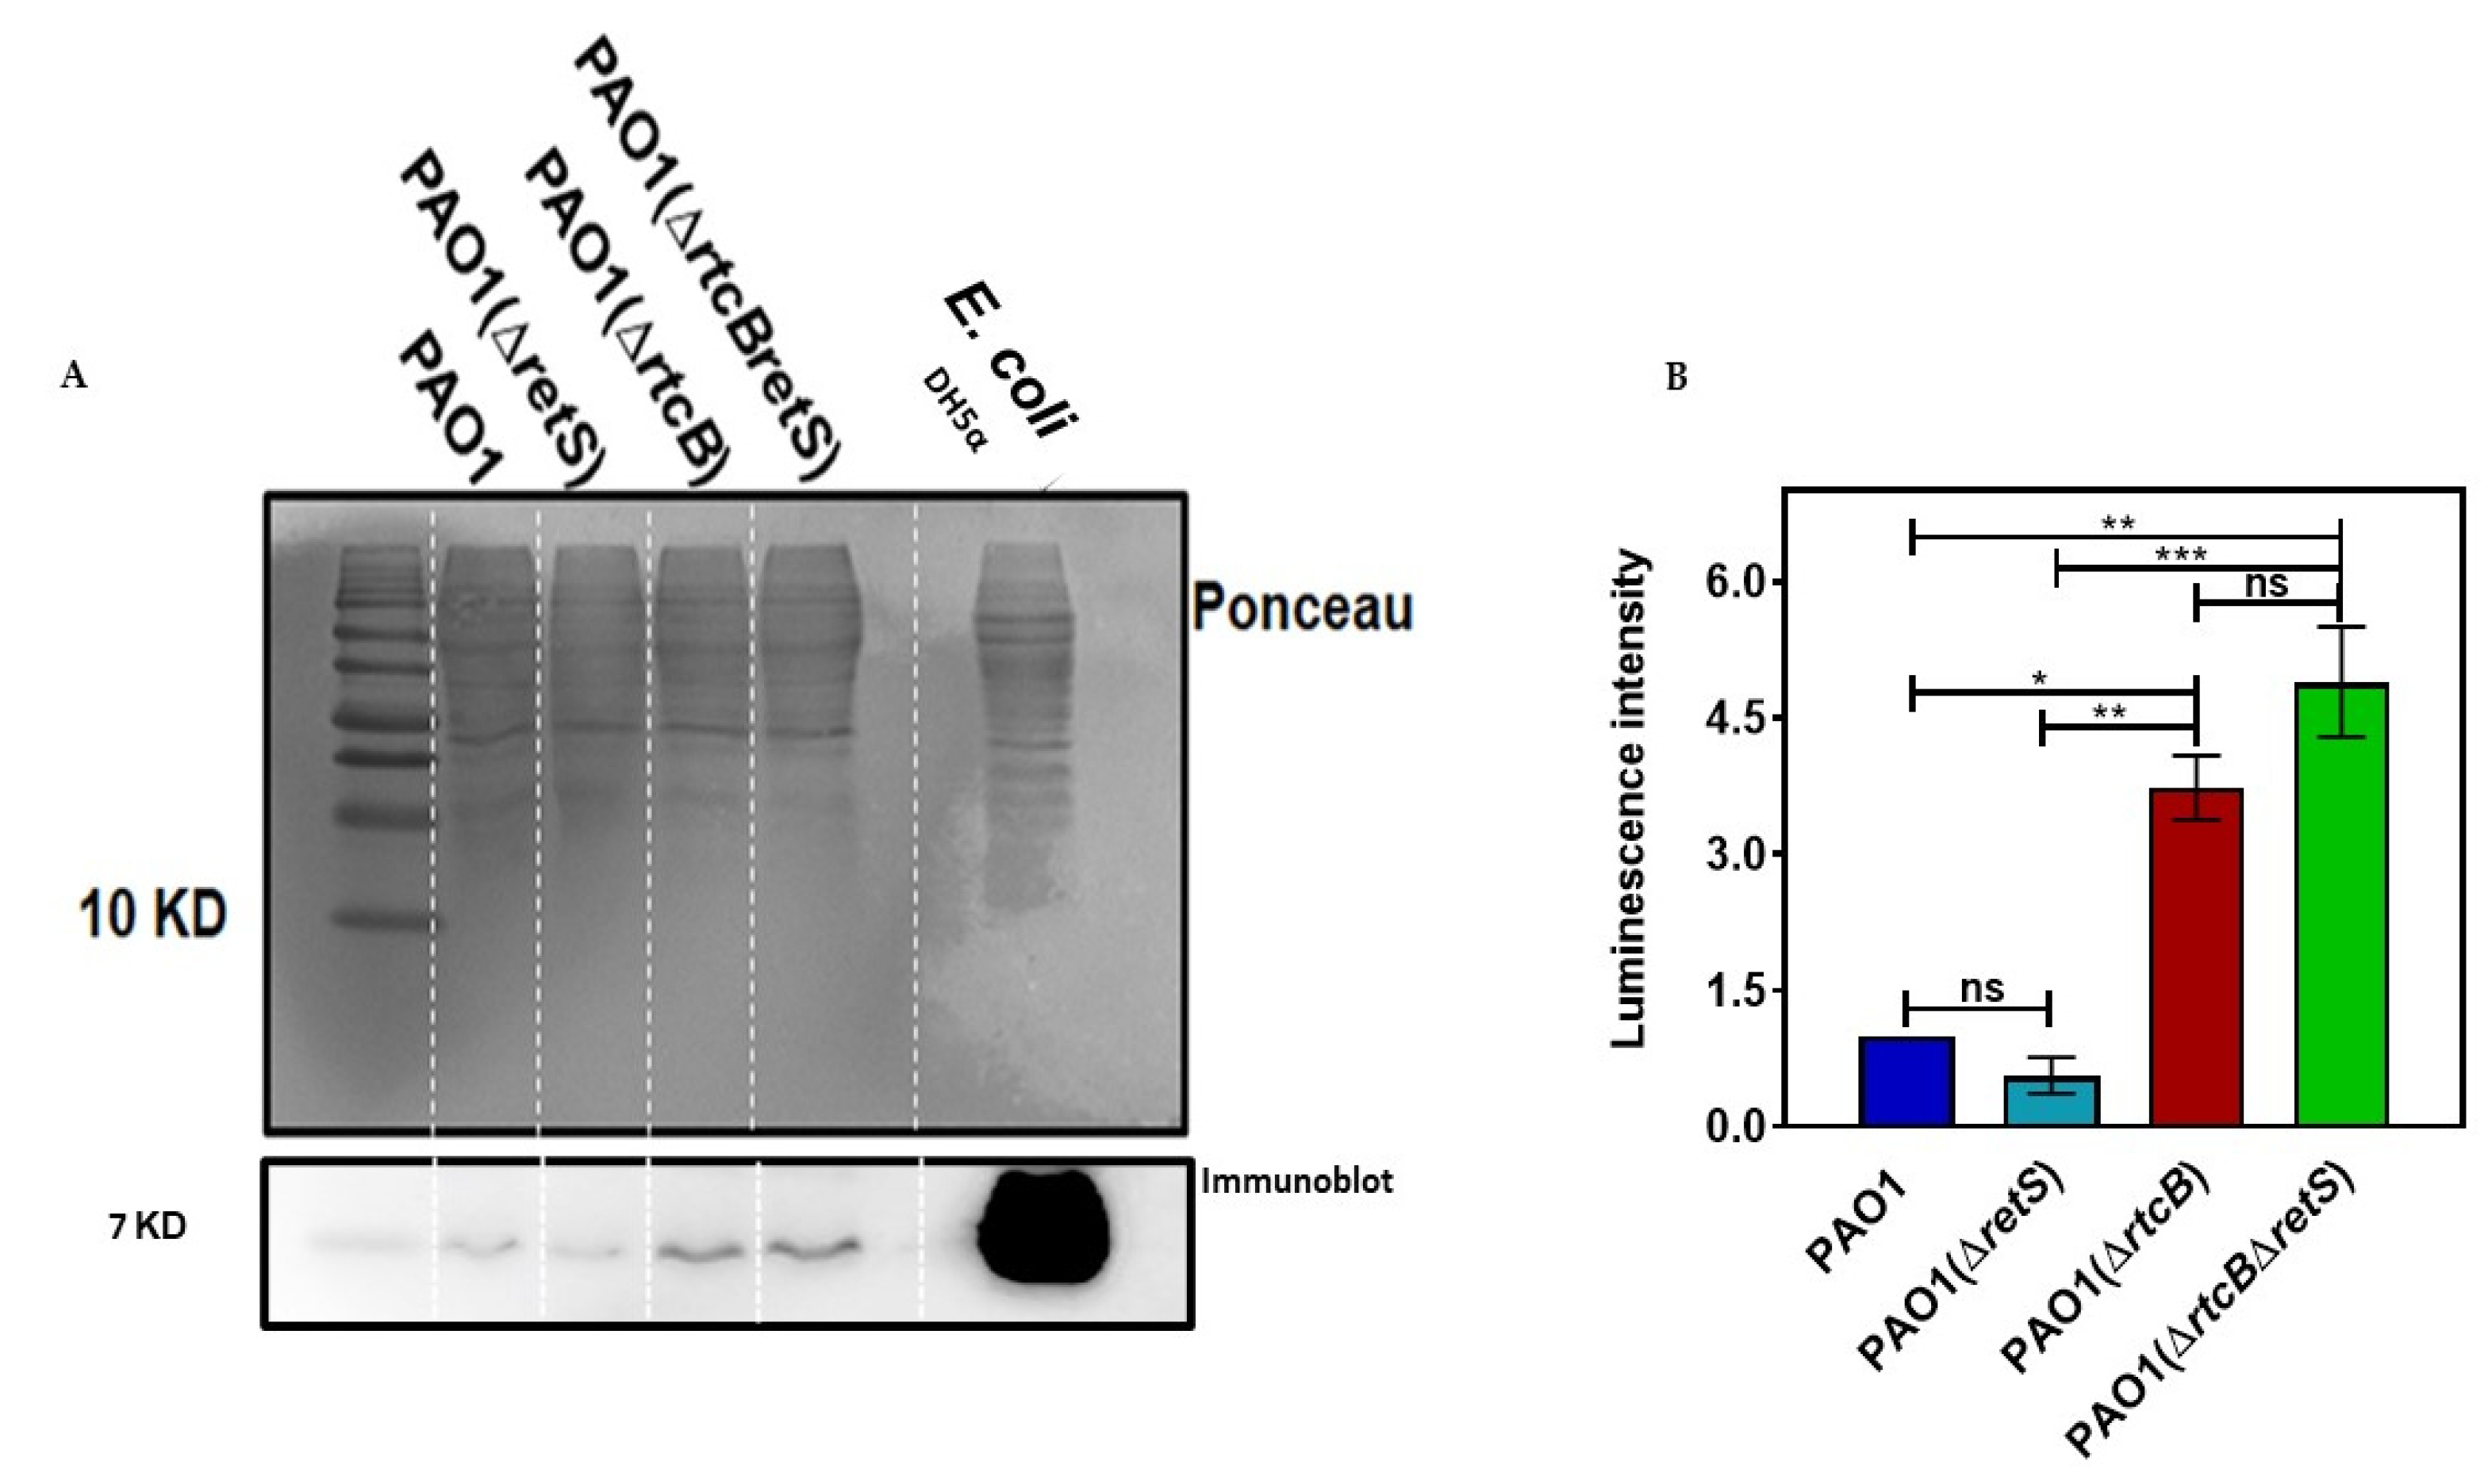
2.6. RsmA Protein Concentration Is Increased by Deletion of rtcB

To explore how rtcB deletion modulates the transcription of T3SS and T6SS genes, we performed immune blotting experiments to determine the expression of the RNA binding protein RsmA. As indicated earlier, mRNA expression of RsmA was unaltered by rtcB deletion in both strains; however, RsmA function is post-translationaly regulated by RsmY, RsmZ, and RsmV sRNAs [45,46]. Western blot analysis revealed that protein expression of RsmA was markedly increased in PAO1(∆rtcB) and PAO1(∆rtcBretS), as compared to their respective controls (Figure 6), while the transcription of rsmA was unaffected by the deletion of rtcB. These data could explain the increase in exoS reporter activity in PAO1(∆rtcBretS) (Figure 2A,B), as more RsmA would increasingly activate T3SS. However, the expected outcome of increased RsmA in PAO1(∆rtcB) as a repressor of T6SSs would be the downregulation of H1-T6SS. These results suggest that RtcB exerts its function on secretion systems through multiple pathways.

2.7. Complementation of PAO1(∆rtcB∆retS) with pAKrsmY and pAKrsmY Diminishes the Expression of T6SS and Represses T3SS

We generated strains of PAO1(∆rtcB), PAO1(∆rtcBretS), and PAO1(∆retS) overexpressing rsmY and rsmZ sRNAs to assess the reporter activity of H1-T6SS and exoS as a representative of T6SSs and T3SS, respectively. The overexpression of RsmY/Z lowered the reporter activity of H1-T6SS in PAO1(∆rtcB). The result confirmed that the upregulation of H1-T6SS in PAO1(∆rtcB) is probably as a result of more RsmY/Z sequestering the RsmA protein, instead of a change in RsmA protein amount (Figure 7A).
However, the complementation of PAO1(∆rtcBretS) with RsmY/Z overexpression vectors repressed the expression of T3SS (Figure 7B). The upregulation of T3SS in PAO1(∆rtcBretS) is achieved through the downregulation of RsmY/Z by the deletion of rtcB, resulting in increased RsmA and activation of T3SS. The results suggest that the RtcB protein might modulate H1-T6SS and T3SS activity through different pathways. This is perhaps the reason that both H1-T6SS and T3SS secretion systems remain active in PAO1(∆rtcB) and PAO1(∆rtcBretS).

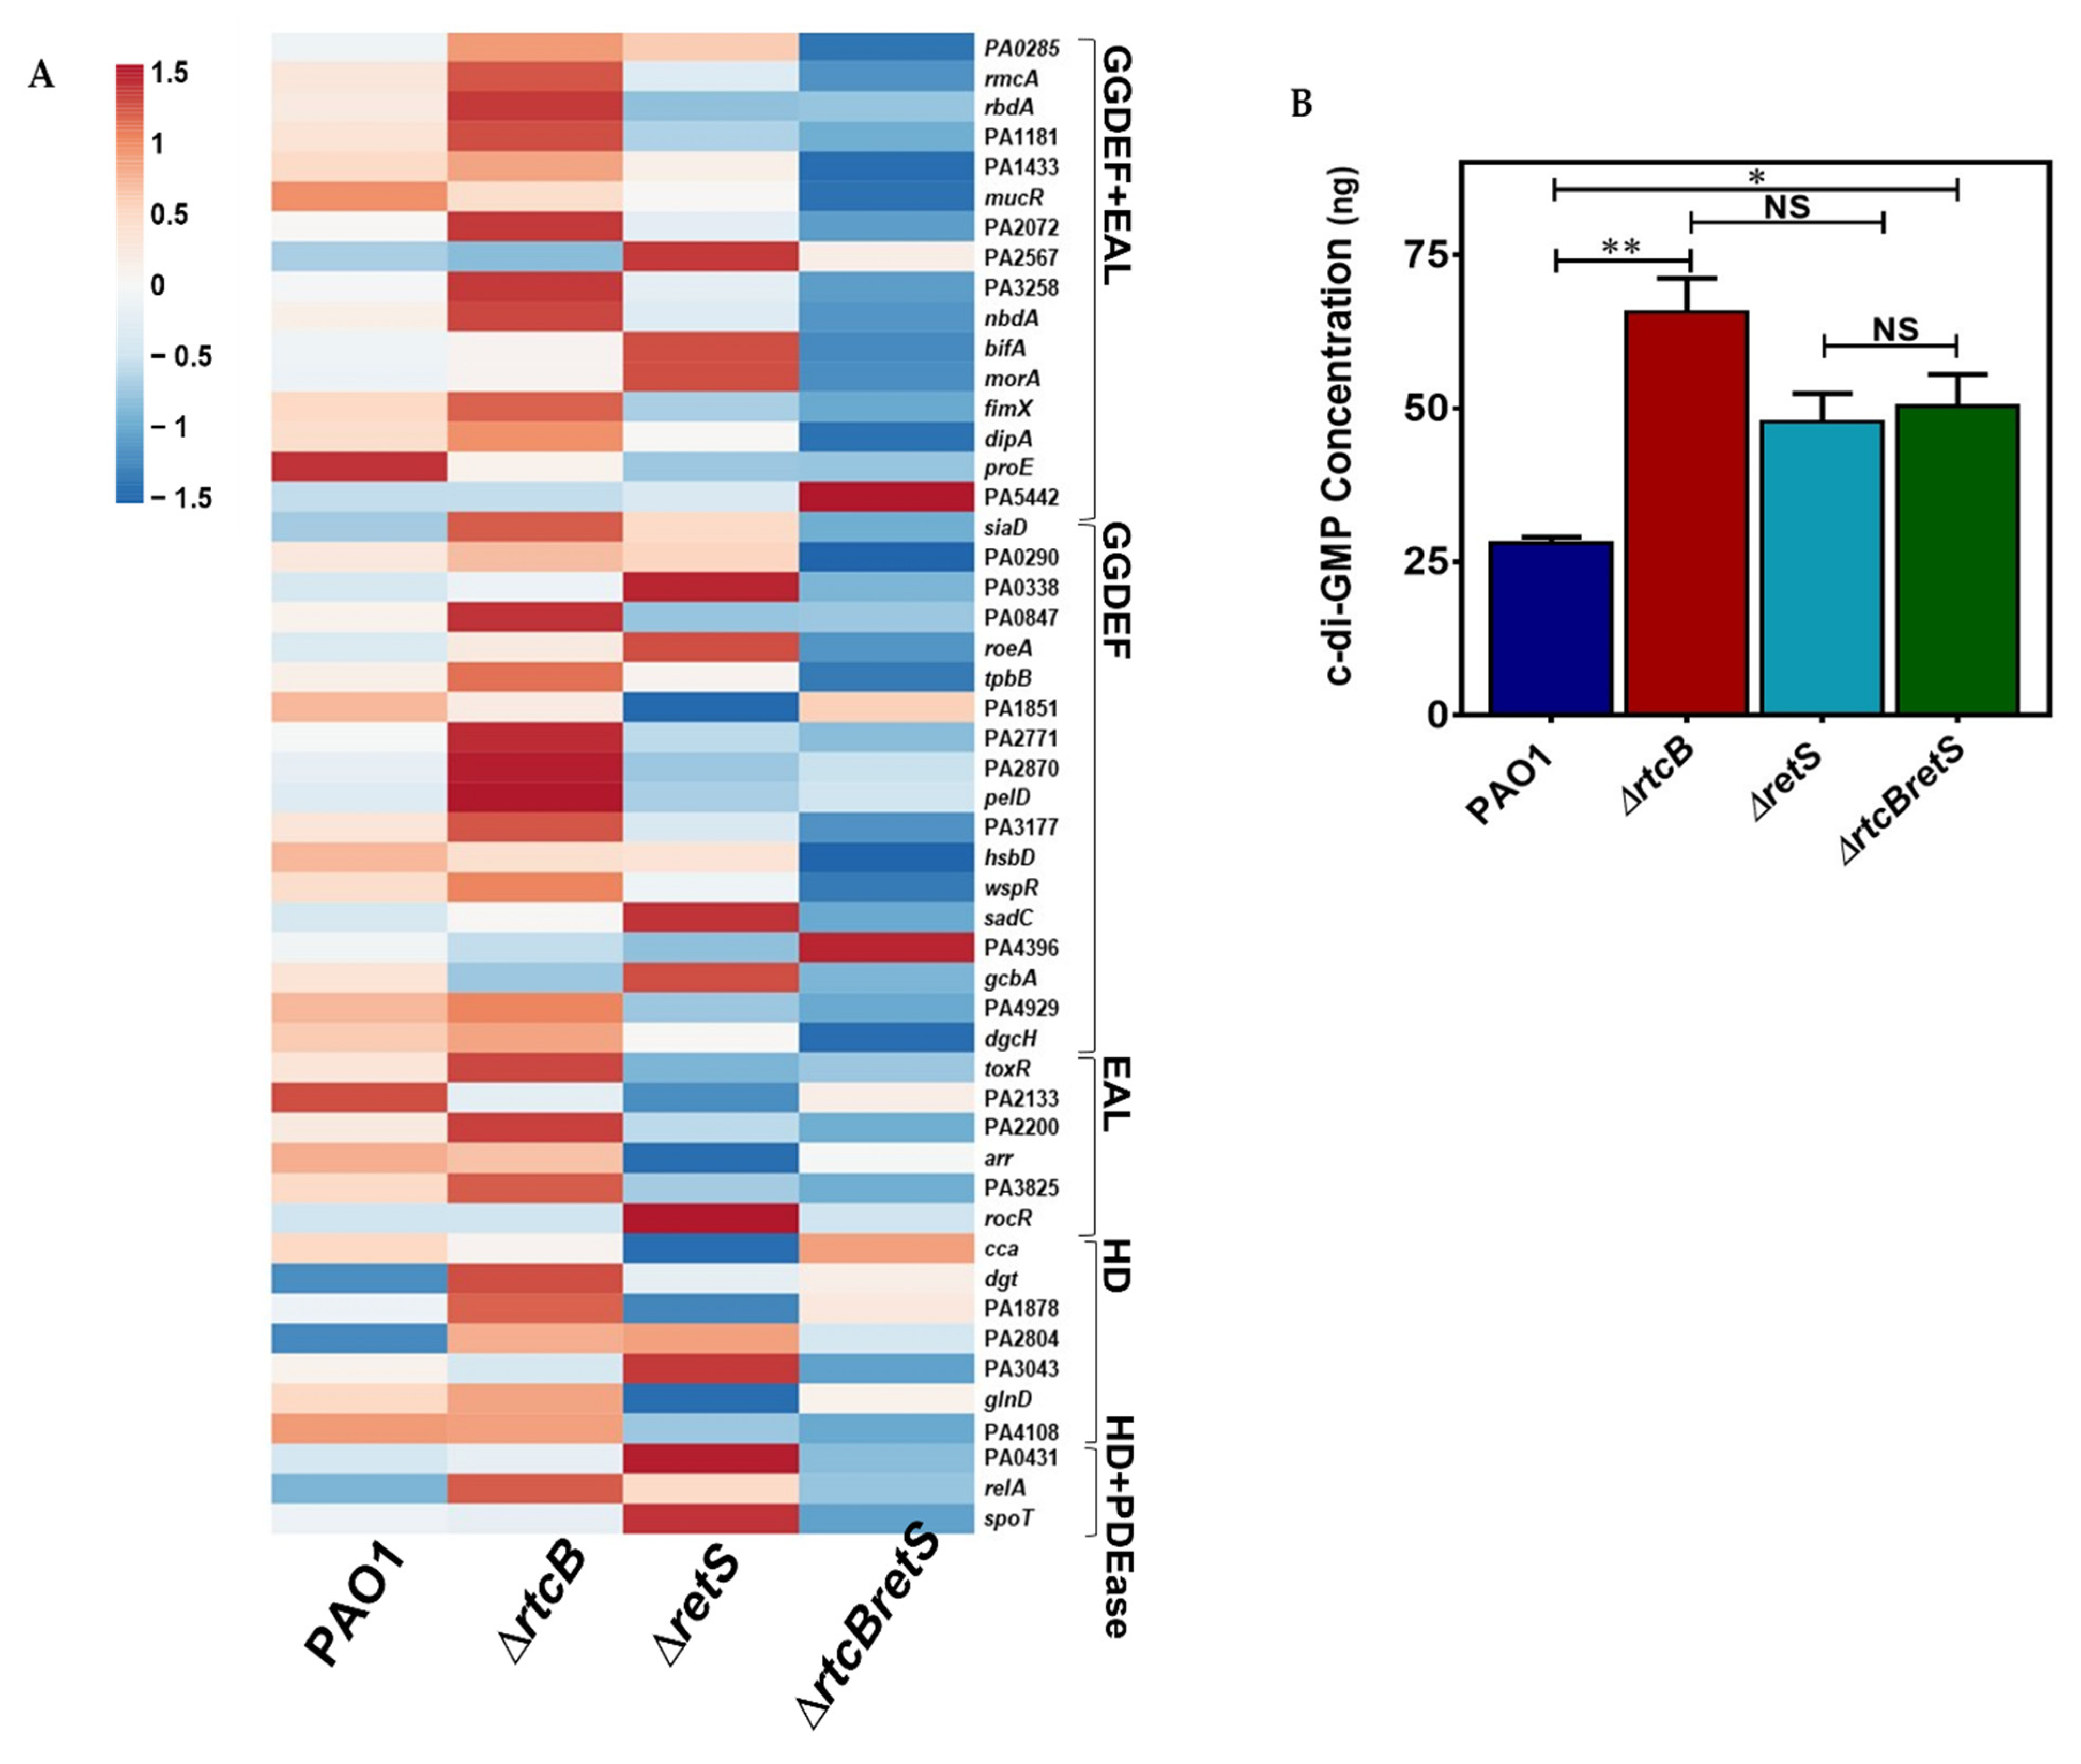
2.8. Intracellular Levels of c-di-GMP Are Significantly Increased in rtcB Deletion Mutant

Our RNA sequencing data showed that several genes associated with the synthesis and degradation of c-di-GMP are differentially expressed upon deletion of rtcB. Those genes are represented in a heatmap graph plotted by MATLAB graphical toolbox (Figure 8A). A higher rate of c-Di-GMP metabolism was observed in PAO1(∆rtcB) as compared to PAO1. In addition, hybrid proteins (harboring both GGDEF and EAL domains) and GGDEF domain-containing proteins were upregulated in PAO1(∆rtcB). In contrast, a lower expression of several GGDEF-containing genes was reported in PAO1(∆rtcBretS) than in the PAO1(∆retS) strain. To further confirm the data and elucidate the role of c-di-GMP in phenotypical and pathogenic changes of the bacterium after the deletion of rtcB, the intracellular content of c-di-GMP was quantified by lysing cells and subsequent analysis of the supernatants using ELISA (Figure 8B). The concentration of c-di-GMP was significantly higher in PAO1(∆rtcB) than in PAO1 cultures, whereas no significant difference could be observed in the c-di-GMP content of the PAO1(∆rtcBretS) and PAO1(∆retS) strains. Higher concentrations of c-di-GMP in PAO1(∆rtcB) as a result of rtcB deletion likely account for the increased biofilm formation (Figure 1B) and reporter activity of T6SS (Figure 2B).

3. Discussion

In polymicrobial environments, P. aeruginosa competes against other colonizing bacteria for its survival [47,48,49]. Various regulatory elements and mechanisms, including quorum sensing, sRNAs, and two-component systems [50], control the pathogenicity and fitness of the bacterium. For the first time, this study introduces the stress response regulator RtcB, a highly conserved protein and part of the bacterial RNA repair operon that seals damaged RNA, as a modulator of P. aeruginosa pathogenicity.
To identify the impact of RtcB on the cellular transcriptome of P. aeruginosa, RNA-sequencing was performed and compared between PAO1 and PAO1(∆retS) backgrounds with and without the deletion of rtcB. The obtained results showed that RtcB was involved in modulating global and metabolic cellular pathways, as well as the metabolism of carbohydrates, amino acids, lipids, cofactors, and vitamins. Transmembrane proteins were part of the transcripts increased by rtcB deletion and included members of secretion systems. In addition, several virulence factors beyond secretion system-partners were affected by the deletion of rtcB, including but not limited to functions involved in pyocyanin production, the secondary messenger c-di-GMP metabolism, biofilm formation, motility, and modulation of quorum sensing pathways and several proteases.
The five secretion systems, T5SS, T2SS, Sec-SRP, T3SS, and T6SS, showed altered expression profiles based on RNAseq data. In P. aeruginosa, T2SS and T3SS excrete the greatest number of toxins. Exotoxin A, LasA and LasB proteases, phospholipases H and C, type IV proteases, and lipolytic enzymes are secreted by T2SS [51] and serve in favor of bacterial pathogenicity [52]. Among these effectors, secreted LasB and phospholipase C [53] cause the most harm during lung infections [54]. These exocellular proteins are translocated through the Sec or Tat system’s inner membrane and are subsequently secreted by T2SS or T5SS [55]. T2SS is encoded by two operons, xcp and hxc [56], and an orphan xqhA, which is exclusively expressed when xcpQ is mutated [57]. The Sec pathway functions via SecB and Sec-SRP modules [58] and secretes proteins in their unfolded state through the inner membrane with the aid of the SRP particle and FtsY docking protein. T3SS is a hallmark of acute-phase infections by P. aeruginosa and excretes ExoSTUY to the eukaryotic host [59]. T5SS is formed from small autotransporters spanned over the cell’s outer membrane [60], organized in six subclasses (Va to Vf) [61]. In PAO1(∆rtcB), the expression levels of paAP and cdrA (members of T2SS and T5SS, respectively) were increased. CdrA is released to the biofilm matrix and promotes biofilm adherence and aggregation even in the absence of Psl exopolysaccharide [62]. In PAO1(∆rtcBretS), T2SS proteins (except for lasB, ToxA, and LipA) were decreased. In addition, the probable Sec-SRP pathway protein PA3822 was increased, while T5SS-related proteins were downregulated in the double mutant.
The exciting finding was the impact of rtcB deletion on T3SS and T6SSs. The results showed that RtcB controls the expression of T6SSs (H1-, H2-, H3-T6SS) and T3SS in an opposite manner. Thus, the deletion of rtcB confirmed that RtcB suppresses T6SS in PAO1 and T3SS in PAO1(∆retS). These data highlight the role of RtcB as a switch controller for the activity of T3SS and T6SSs. To validate the RNA-sequencing data, we selected and quantified various essential genes related to H1-T6SS and T3SS (rsmA, clpV1, hcp1, exsA, and exsC). ClpV1 is the cytoplasmic AAA+ ATPase of the H1-T6SS and is necessary for toxin delivery and disassembly of T6SS [39,63]. In Burkholderia thailandensis, localization of ClpV-5 in dynamic and discrete foci suggested functional roles beyond solely being an energy provider for T6SS [64]. ExsA is the global regulator of T3SS, binds to the promoters of T3SS-related genes, and upregulates their expression [65]. The expression of exsC promotes its antagonistic activity against ExsD and the release of ExsA, resulting in higher expression of T3SS genes [66]. Our RT-PCR quantification results were in line with and validated by RNA sequencing data. Moreover, exploring T3SS genes in PAO1(∆rtcB) of RNAseq data revealed that PcrR seems to negatively correlate with this secretory system, which needs to be confirmed in future research.
We examined the involvement of RsmA as a potential mechanism underlying the RtcB-mediated control of T3SS and T6SSs. Immunoblotting indicated that the cellular free RsmA protein was increased in PAO1(∆rtcB) and PAO1(∆rtcBretS) as compared to their respective background strains. As the transcription of RsmA showed no change, as evidenced by our RNA-sequencing and RT-PCR data, we envisioned that perhaps the sequestration of RsmA by sRNAs RsmY/Z was reduced, and led to higher RsmA content. Although RNA sequencing showed that transcription of RsmY/Z was not different between strains, deletion of rtcB as an RNA processing protein may affect the stability and/or functionality of sRNAs. We bear in mind that the physiological role of RtcB in bacteria remains to be further investigated as there are no tRNA splicing events in bacteria [18,20]. The overexpression of RsmY and RsmZ in the PAO1, PAO1(∆rtcB), PAO1(∆retS), and PAO1(∆rtcBretS) corroborated that the presence of higher RsmA level is not a consequence of initial lower expression of RsmY/Z, as overexpression of RsmY/Z should theoretically lead to sequestration of RsmA and, consequently, a higher expression of H1-T6SS [46]. In contrast, and to our surprise, the overexpression of RsmY/Z lowered H1-T6SS expression in PAO1(∆rtcB). This strongly suggests that RtcB controls the expression of H1-T6SS in PAO1(∆rtcB) through a different regulatory pathway that does not directly involve RsmY/Z and RsmA. Our findings did confirm that higher levels of free RsmA protein accounted for the increase of T3SS in PAO1(∆rtcBretS). Finally, active T3SS and T6SS importantly contribute to increased virulence of the RtcB deficient P. aeruginosa strains, as evidenced by prokaryotic and eukaryotic competition assays.
Our in vitro findings identify RtcB as a pivotal factor in the pathogenicity and survival of P. aeruginosa. Considering that the expression patterns of genes are often different under in vitro and in vivo conditions, our future work will focus on validating the role of RtcB in the pathogenicity of the bacterium by in vivo infection assays using P. aeruginosa rtcB deficient strains.
We observed a significant role of RtcB in the modulation of QS genes (Supplementary Materials). The xcp of T2SS, and ExsA of T3SS and T6SSs, are regulated by QS-related genes. Generally, the expressions of Las, RhlI, and PQS proteins were increased in PAO1(∆rtcB). LasI and RhlI showed higher expression in PAO1(∆rtcBretS), in which the PQS system was repressed. Also, the transcription of phz operons was inversely regulated in PAO1(∆rtcB) and PAO1(∆rtcBretS) compared to their background strains. Pyocyanin, as a phenotypic marker of the QS system and activity of phz operons, was quantified [67]. The production of pyocyanin was manipulated by deletion of rtcB and considerably increased in PAO1(∆rtcB). Multiple factors, such as higher expression of QS, T2SS, or phz operons, could contribute to this observation. In addition, it should be noted that the role of increased transcripts of phzA2, phzB2, and phzC2 cannot be neglected in the elevation of pyocyanin production in PAO1(∆rtcB).
The cellular c-di-GMP profile was significantly altered by the deletion of rtcB. Thus, the metabolism of c-di-GMP was increased in PAO1(∆rtcB). A higher expression of GGDEF domain-containing protein was attributed to an overall higher intracellular concentration of c-di-GMP. For instance, siaD showed an increase of 2.6-fold in PAO1(∆rtcB) compared to PAO1. SiaD contains a GGDEF domain which contributes to synthesizing c-di-GMPs. This was confirmed by a previous study demonstrating that siaD deletion lowered intracellular c-di-GMP content [68]. Contrary to PAO1(∆rtcB), a lower expression of several GGDEF-containing genes was observed in PAO1(∆rtcBretS) compared to PAO1(∆retS). The secondary messenger c-di-GMP plays a crucial role in multiple events that drive virulence, including motility and biofilm formation, and, importantly, the transitions between the sessile and motile bacterial lifestyle. There is no doubt that the considerable elevation in the metabolism of c-di-GMP can be contributed to the notable shift in genotypic and phenotypic features in PAO1(∆rtcB) and PAO1(∆rtcBretS).

4. Materials and Methods

4.1. Bacterial Strains, Growth Conditions, and Antibiotic Reagents

Bacterial strains and plasmids used in this study are presented in Table 2. Escherichia coli and Pseudomonas aeruginosa were routinely grown at 37 °C on LB agar or in LB broth unless indicated otherwise. The concentration of antibiotics used are as follows: for E. coli cultures: gentamycin (Gm) at 15 µg mL−1, tetracycline (Tc) at 12.5 µg mL−1, kanamycin (Kn) at 50 µg mL−1, and ampicillin (Ap) at 50 µg mL−1; for P. aeruginosa cultures: Gm at 150 µg mL−1 in Pseudomonas isolation agar (PIA) and 50 µg mL−1 in LB, carbenicillin (Cb) at 250 µg mL−1 in LB, Tc at 200 µg mL−1 in PIA and 70 µg mL−1 in LB, and trimethoprim (Tmp) at 300 µg mL−1 in LB.

4.2. Construction of Gene Expression Reporters

The promoterless plasmid pMS402 carrying the luxCDABE gene cluster was used for the construction of reporter fusion of desired genes [70]. Primers used in this study are presented in Table 3. The promoter of H1-T6SS operon and exoS was PCR-amplified and cloned into the BamHI-XhoI site upstream of the lux-Box on pMS402 plasmid, resulting in the so-called pKDH1 reporter. The PacI digested fragment of pKDH1 was cloned into integration plasmid CTX6.1, originated from mini-CTX-lux to construct a chromosomally integrated reporter [74]. CTXH1 was transferred to E. coli SM10-λ pir [69], and biparental-mating between E. coli SM10-λ pir, Pseudomonas recipients was set up to construct the H1-T6SS reporter strain [75,76]. For the construction of other reporters, the same strategy was applied. Gene expression measurements were carried out by quantifying the light production (luminescence per second-LPS) of the reporter strain using Synergy2 Multimode Microplate Reader (BioTek). Bacterial growth was recorded at OD600 during the luminescence readout. The measurement continued for 24 h with 30 min intervals at 37 °C. Reporter activity graphs are shown at the 12 h time point when bacteria enter the stationary phase of growth and reporter activity remains stable.

4.3. Construction of Mutant Strains

The sacB-based method was applied to construct the knockout mutants, as previously described [72]. In brief, approximately 1 kb of each upstream and downstream region of the desired gene was PCR-amplified with the incorporation of restriction sites. The primers used in this study are listed in Table 3. The PCR products were cloned into suicide vector pEX18Tc. Triparental mating was set up using E. coli strains carrying helper plasmid pRK2013, pEX18Tc carrier, and PAO1 and PAO1(ΔretS) to generate mutant strains [71]. The mutants were confirmed by PCR and agarose gel electrophoresis.

4.4. Pyocyanin Assay

Bacteria were grown overnight for 16 h after which supernatants were collected. The pyocyanin content was measured according to a previously described protocol [77]. Five mL of supernatant was mixed with 3 mL chloroform. The chloroform layer was separated by centrifugation and transferred into a fresh falcon tube. One mL of 0.2 N HCL was added to the falcon tubes and mixed well, following centrifugation at 5488× g for 10 min. The top layer was separated, and its absorbance was measured at 520 nm. The cellular content of pyocyanin was presented as µg pyocyanin per mL supernatant, calculated by multiplying the extinction coefficient of 17.072 at 520 nm.

4.5. Biofilm Formation and Bacterial Motility Assay

Static biofilm formation was assessed as previously described by O’Toole and Kolter [78]. A dilution ratio of 1:100 was made from an overnight culture (37 °C) of bacteria into 96-well polystyrene microtiter plates (Costar), which were subsequently incubated for 24 h at 37 °C. The cultures were rinsed with phosphate-buffered saline (PBS) three times and stained with 1% crystal violet for 20 min at room temperature. After rinsing with distilled water, 150 µL 2 mM acetic acid was added to each well to dissolve the remaining crystal violet; 100 µL of this solution was transferred to a new microtiter plate and the absorbance was read at 550 nm (OD550).
Motility was assessed as described previously [79]. Three different media compositions were made for swarming (0.5% agar, 5 gl−1 glucose, 8 gl−1 nutrient broth mix), swimming (0.3% agar, 5 gl−1 NaCl, 10 gl−1 tryptone), and twitching (LB broth with 1% agar). Overnight cultures (2 µL) of bacteria were spotted on the surface of swarming and swimming plates and stabbed into twitching plates. Swarm plates were incubated at 37 °C, swim plates at 30 °C for 15 h, and twitch plates at 37 °C for 24 h. Images of all plates were obtained using the Fusion FX imaging system.

4.6. RNA Isolation and RNA-Sequencing and Analysis of Differentially Expressed Genes

Strains were grown overnight at 37 °C for 16 h followed by sub-culturing into fresh LB medium for 6 h (to mid-exponential phase). RNAlater stabilization solution (invitrogenTM) was added to the samples to fix the RNAs. Total RNA was extracted from PAO1, PAO1(ΔrtcB), PAO1(ΔretS), and PAO1(ΔrtcBΔretS) by TRIzol-based method (Life Technologies, Carlsbad, CA, USA). Briefly, the sub-cultures were centrifuged at 12,000× g for 5 min. Pellets were resuspended in 1 mL of TRIzol and incubated at room temperature for 5 min. Then, 0.2 mL of chloroform were added into the tubes and vortexed, following centrifugation. The upper aqueous phase from each strain was transferred to a fresh tube and 0.5 mL of cold isopropanol was added to precipitate RNA. After centrifugation (12,000× g for 10 min), the pellets were resuspended in 1 mL 75% ethanol and centrifuged. The RNA pellets were air-dried and dissolved in 50 µL RNase-free water.
RNA-sequencing analysis was carried out by GENE DENOVO, China. Consecutively, rRNA was depleted from 1 µg of the total RNA using the Ribo-Zero Magnetic Gold Kit (Epicentre Biotechnologies, Madison, WI, USA). The complementary DNC (cDNA) library was constructed, and samples were sequenced using the Illumina HiseqTM 2500 platform with paired-end 150 base reads. The raw data were filtered and reproducibility between samples was evaluated. The gene expression level was normalized using the fragments per kilobase of transcript per million mapped reads (FPKM) method. Differentially expressed genes (DEGs) in samples with a fold change ≥ 2 and q-value < 0.05 were identified using the edgeR package (http://www.r-project.org/; accessed on 19 January 2019). Ultimately, DEGs were used for enrichment analysis of KEGG and GO pathways. Experiments were carried out using three independent biological replicates for each strain.

4.7. Quantitative Real-Time PCR Analysis

Single colonies of each desired strain were grown (three times) overnight in 2 mL LB broth at 37 °C. Following 3 h subculture in 2 mL fresh LB broth, 1 mL aliquots of the cell cultures were harvested at the mid-exponential phase. RNeasy bacteria protect solution (Qiagen, Hilden, Germany) was added to each aliquot and total RNA was isolated using TriRNA Pure Kit (Geneaid, New Taipei, Taiwan) according to the manufacturer’s protocol. Eluted total RNA was purified a second time by RNA Cleanup Kit (Geneaid) with a residual DNA elimination treatment step. DNase was deactivated by the addition of ethylene diamine tetra-acetic acid (EDTA). Following the manufacturer’s instructions, cDNA was synthesized using Maxima First Strand can Synthesis Kit for RT-qPCR with dsDNase (Thermo Fisher Scientific, Waltham, MA, USA). Also, a set of reverse transcriptase minus (RT-) negative controls was amplified to confirm the lack of gDNA contamination. The mRNA levels were measured using the PowerUp SYBR Green Master Mix (Thermo Fisher Scientific) and an Illumina real-time PCR system by following the manufacturer’s instructions. For data interpretation, mRNA levels of the desired genes were normalized to the expression of the rpoD housekeeping gene, and fold change was calculated using the 2−∆∆Ct method [80]. Primers used for qRT-PCR analysis are listed in Table 2.

4.8. Bacterial Competition Assay

To evaluate activated T6SSs (H1-, H2-T6SS) in PAO1 strains, an in vitro bacterial competition assay was carried out as described previously with minor modifications of the protocol [81]. E. coli DH5α expressing β-galactosidase was chosen as the prokaryote prey. PAO1, PAO1(ΔrtcB), PAO1(ΔretS), and PAO1(ΔrtcBΔretS) strains were co-incubated with prey as spots on filter papers on LB agar at 37 °C. After a 5 h incubation, each filter paper was resuspended in cold PBS and washed three times. Samples were serially diluted from 10 to 10−5 and 5 μL of each dilution was spotted on a coliform agar plate for the visual assay. After incubating the plates at 37 °C for 24 h, LacZ-positive E. coli abundance was assessed by counting the blue-colored colonies. A fluorometric competition assay was performed with E. coli harboring the pilG-DsRed expressing vector, emitting red fluorescence to confirm the competition. Slides were prepared from post-co-incubation of prey and predator, and inspected using an inverted microscope (Nikon ECLIPSE Ti-E).

4.9. Plant Virulence Assay

The plant infection assay was performed in lettuce leaves as described previously [82]. Bacterial cultures were grown overnight, adjusted to OD600 = 0.01, and washed three times with cold PBS buffer. The pellets were resuspended in 10 mM MgSO4 and used to inoculate the mid-ribs of romaine lettuce leaves. The inoculated leaves were incubated at room temperature for 2 days in plates containing a Whatman filter paper soaked in 10 mM MgSO4. The leaves were closely monitored during the incubation and imaged at 48 h.

4.10. Immunoblotting Assay

P. aeruginosa strains were grown in 2 mL LB broth at 37 °C for 12h. Bacteria were spun down by centrifugation and the pellet was washed 3 times with cold 1X PBS. A 20 µL protease inhibitor cocktail (Abcam, Cambridge, UK) and 1 mL of 0.6 M perchloric acid were added to the pellet, after which cells were resuspended and stored on a rotatory shaker for 30 min at 4 °C. Following centrifugation at 16,128× g for 10 min at 4 °C, pellets were resuspended in 6 M urea and protein concentrations were determined by the Bradford assay [83]. Equal amounts of protein from the prepared samples were subjected to SDS-PAGE at 100 V on 15% polyacrylamide gels for approximately 1h. Polyvinylidene difluoride (PVDF) membranes were activated in methanol and placed in a transfer buffer. Next, proteins were transferred to PVDF membranes, which were subsequently blocked for 90 min using a TBST buffer containing 5% non-fat milk. Membranes were then washed with TBST buffer and probed overnight (4 °C) using 1:500 dilution (TBST+5% non-fat milk) of CsrA- E. coli antibody (rabbit). After incubation, membranes were washed 3 times for 20 min with TBST buffer and subsequently incubated with anti-rabbit IgG antibody (1:1000 dilution in TBST+1% non-fat milk) for 1 h followed by 3 washes (20 min each) on a rotatory shaker. Protein bands were visualized using an enhanced chemiluminescence (ECL) kit. To confirm equal loading for all samples, membranes were stained with Ponceau S for 10 min. The Fusion FX imaging system was used to obtain images.

4.11. Construction of Overexpression Vectors

The multi-copy-number E. coli-P. aeruginosa shuttle vector pAK1900 carrying a lac promoter was used to express the RtcB in trans [84]. The entire DNA region of these genes was PCR-amplified in-frame, with the incorporation of restriction sites. The primers used are listed in Table 2. PCR products were cloned into BamHI and HindIII sites of pAK1900 and transferred into Pseudomonas by electroporation.

4.12. C-di-GMP Quantification

C-di-GMP was quantified using a CdiGMP Elisa Kit from Mybiosource (#MBS288159). To determine intracellular c-di-GMP content in cultures, we extracted c-di-GMP from bacterial cells following a previously described protocol with some modifications [85]. In brief, bacterial strains were grown in 5 mL LB broth for 24 h at 37 °C and bacterial density was adjusted to OD600 1.8. Cells were pelleted down for 7 min at 1792× g and washed three times with PBS buffer. Next, 250 µL of 0.6 M perchloric acid was added to the washed pellet, followed by a 30 min incubation at 4 °C on a rotatory shaker to ensure proper lysis. Following centrifugation at 18,928× g for 10 min, the supernatant was transferred to a fresh Eppendorf tube. Two hundred µL of 1M KOH was added to the tubes, and the salt by-product was settled by centrifuging at 18,928× g for 10 min. The clear supernatant was used for the quantification of c-di-GMP according to the kit manual.

4.13. Statistical Analysis

Statistical analysis was performed using unpaired student’s t-test or one-way analysis of variance (ANOVA) with Dunnett post hoc tests. All data represent means ± SEM from independent experiments. Where applicable, the statistical significance is: **** p < 0.0001; *** p < 0.001; ** p < 0.01; * p < 0.05; NS p > 0.05.

Supplementary Materials

The following are available online at https://www.mdpi.com/article/10.3390/ijms222212561/s1.

Author Contributions

K.D. supervised the design and development of the research. M.D. conducted most of the experiments. L.C. contributed to the RNAseq experiment. S.G., A.N. contributed to the Immunoblotting assay. K.D., M.D. analyzed the data. K.D., S.G. and M.D. wrote the manuscript. All authors have read and agreed to the published version of the manuscript.

Funding

This study was supported by a grant from the Natural Sciences and Engineering Research Council of Canada (RGPIN-05864-2019). The funder had no role in study design, data collection, and interpretation, or the decision to submit the work for publication.

Institutional Review Board Statement

Not applicable.

Informed Consent Statement

Not applicable.

Data Availability Statement

Not applicable.

Acknowledgments

The authors would like to thank Science Impact (Winnipeg, MB, Canada) for the critical review and post-editing of the manuscript.

Conflicts of Interest

The authors declare no conflict of interest.

References

  1. Fuentefria, D.B.; Ferreira, A.E.; Corção, G. Antibiotic-resistant Pseudomonas aeruginosa from hospital wastewater and superficial water: Are they genetically related? J. Environ. Manag. 2011, 92, 250–255. [Google Scholar] [CrossRef] [PubMed]
  2. Klockgether, J.; Cramer, N.; Wiehlmann, L.; Davenport, C.F.; Tümmler, B. Pseudomonas aeruginosa Genomic Structure and Diversity. Front. Microbiol. 2011, 2, 150. Available online: https://www.frontiersin.org/articles/10.3389/fmicb.2011.00150/full (accessed on 21 June 2021). [CrossRef] [PubMed] [Green Version]
  3. Kipnis, E.; Sawa, T.; Wiener-Kronish, J. Targeting mechanisms of Pseudomonas aeruginosa pathogenesis. Med. Mal. Infect. 2006, 36, 78–91. [Google Scholar] [CrossRef]
  4. Sharma, A.K.; Dhasmana, N.; Dubey, N.; Kumar, N.; Gangwal, A.; Gupta, M.; Singh, Y. Bacterial Virulence Factors: Secreted for Survival. Indian J. Microbiol. 2017, 57, 1–10. [Google Scholar] [CrossRef] [PubMed] [Green Version]
  5. Green, E.R.; Mecsas, J. Bacterial Secretion Systems: An Overview. Microbiol. Spectr. 2016, 4, 12. [Google Scholar] [CrossRef] [Green Version]
  6. Kepseu, W.D.; Van Gijsegem, F.; Sepulchre, J.-A. Modelling the Onset of Virulence in Pathogenic Bacteria. Methods Mol. Biol. 2011, 804, 501–517. [Google Scholar] [CrossRef]
  7. Valentini, M.; Gonzalez, D.; Mavridou, D.; Filloux, A. Lifestyle transitions and adaptive pathogenesis of Pseudomonas aeruginosa. Curr. Opin. Microbiol. 2018, 41, 15–20. [Google Scholar] [CrossRef]
  8. Berube, B.J.; Rangel, S.M.; Hauser, A.R. Pseudomonas aeruginosa: Breaking down barriers. Curr. Genet. 2015, 62, 109–113. [Google Scholar] [CrossRef]
  9. Lam, J.; Chan, R.; Lam, K.; Costerton, J.W. Production of mucoid microcolonies by Pseudomonas aeruginosa within infected lungs in cystic fibrosis. Infect. Immun. 1980, 28, 546–556. [Google Scholar] [CrossRef]
  10. Goodman, A.L.; Kulasekara, B.; Rietsch, A.; Boyd, D.; Smith, R.S.; Lory, S. A Signaling Network Reciprocally Regulates Genes Associated with Acute Infection and Chronic Persistence in Pseudomonas aeruginosa. Dev. Cell 2004, 7, 745–754. [Google Scholar] [CrossRef] [Green Version]
  11. Goodman, A.L.; Merighi, M.; Hyodo, M.; Ventre, I.; Filloux, A.; Lory, S. Direct interaction between sensor kinase proteins mediates acute and chronic disease phenotypes in a bacterial pathogen. Genes Dev. 2009, 23, 249–259. [Google Scholar] [CrossRef] [Green Version]
  12. Brencic, A.; McFarland, K.A.; McManus, H.R.; Castang, S.; Mogno, I.; Dove, S.L.; Lory, S. The GacS/GacA signal transduction system of Pseudomonas aeruginosa acts exclusively through its control over the transcription of the RsmY and RsmZ regulatory small RNAs. Mol. Microbiol. 2009, 73, 434–445. [Google Scholar]
  13. Moscoso, J.A.; Mikkelsen, H.; Heeb, S.; Williams, P.; Filloux, A. The Pseudomonas aeruginosa sensor RetS switches Type III and Type VI secretion via c-di-GMP signalling. Environ. Microbiol. 2011, 13, 3128–3138. [Google Scholar] [CrossRef] [PubMed]
  14. Allsopp, L.; Wood, T.; Howard, S.A.; Maggiorelli, F.; Nolan, L.; Wettstadt, S.; Filloux, A. RsmA and AmrZ orchestrate the assembly of all three type VI secretion systems in Pseudomonas aeruginosa. Proc. Natl. Acad. Sci. USA 2017, 114, 7707–7712. [Google Scholar] [CrossRef] [PubMed] [Green Version]
  15. Merritt, J.H.; Brothers, K.M.; Kuchma, S.L.; O’Toole, G.A. SadC Reciprocally Influences Biofilm Formation and Swarming Motility via Modulation of Exopolysaccharide Production and Flagellar Function. J. Bacteriol. 2007, 189, 8154–8164. [Google Scholar] [CrossRef] [PubMed] [Green Version]
  16. Römling, U.; Galperin, M.Y.; Gomelsky, M. Cyclic di-GMP: The First 25 Years of a Universal Bacterial Second Messenger. Microbiol. Mol. Biol. Rev. 2013, 77, 1–52. [Google Scholar] [CrossRef] [Green Version]
  17. Chua, S.L.; Sivakumar, K.; Rybtke, M.; Yuan, M.; Andersen, J.B.; Nielsen, T.E.; Givskov, M.; Tolker-Nielsen, T.; Cao, B.; Kjelleberg, S.; et al. C-di-GMP regulates Pseudomonas aeruginosa stress response to tellurite during both planktonic and biofilm modes of growth. Sci. Rep. 2015, 5, 10052. [Google Scholar] [CrossRef] [Green Version]
  18. Manwar, M.R.; Shao, C.; Shi, X.; Wang, J.; Lin, Q.; Tong, Y.; Kang, Y.; Yu, J. The bacterial RNA ligase RtcB accelerates the repair process of fragmented rRNA upon releasing the antibiotic stress. Sci. China Life Sci. 2019, 63, 251–258. [Google Scholar] [CrossRef]
  19. Englert, M.; Sheppard, K.; Aslanian, A.; Yates, J.R.; Söll, D. Archaeal 3′-phosphate RNA splicing ligase characterization identifies the missing component in tRNA maturation. Proc. Natl. Acad. Sci. USA 2011, 108, 1290–1295. [Google Scholar] [CrossRef] [PubMed] [Green Version]
  20. Temmel, H.; Müller, C.; Sauert, M.; Vesper, O.; Reiss, A.; Popow, J.; Martinez, J.; Moll, I. The RNA ligase RtcB reverses MazF-induced ribosome heterogeneity in Escherichia coli. Nucleic Acids Res. 2017, 45, 4708–4721. [Google Scholar] [PubMed] [Green Version]
  21. Genschik, P.; Drabikowski, K.; Filipowicz, W. Characterization of the Escherichia coli RNA 3′-Terminal Phosphate Cyclase and Its ς54-Regulated Operon. J. Biol. Chem. 1998, 273, 25516–25526. [Google Scholar] [CrossRef] [PubMed] [Green Version]
  22. Winsor, G.L.; Griffiths, E.J.; Lo, R.; Dhillon, B.K.; Shay, J.A.; Brinkman, F.S.L. Enhanced annotations and features for comparing thousands of Pseudomonas genomes in the Pseudomonas genome database. Nucleic Acids Res. 2015, 44, D646–D653. [Google Scholar] [CrossRef] [PubMed] [Green Version]
  23. Kazlauskiene, M.; Kostiuk, G.; Venclovas, Č.; Tamulaitis, G.; Siksnys, V. A cyclic oligonucleotide signaling pathway in type III CRISPR-Cas systems. Science 2017, 357, 605–609. [Google Scholar] [CrossRef] [Green Version]
  24. Niewoehner, O.; Doval, C.G.; Rostøl, J.T.; Berk, C.; Schwede, F.; Bigler, L.; Hall, J.; Marraffini, L.A.; Jinek, M. Type III CRISPR–Cas systems produce cyclic oligoadenylate second messengers. Nature 2017, 548, 543–548. [Google Scholar] [CrossRef] [PubMed]
  25. Makarova, K.S.; Anantharaman, V.; Grishin, N.V.; Koonin, E.V.; Aravind, L. CARF and WYL domains: Ligand-binding regulators of prokaryotic defense systems. Front. Genet. 2014, 5, 102. [Google Scholar] [CrossRef]
  26. Hughes, K.J.; Chen, X.; Burroughs, A.M.; Aravind, L.; Wolin, S.L. An RNA Repair Operon Regulated by Damaged tRNAs. Cell Rep. 2020, 33, 108527. [Google Scholar] [CrossRef] [PubMed]
  27. Tanaka, N.; Chakravarty, A.K.; Maughan, B.; Shuman, S. Novel mechanism of RNA repair by RtcB via sequential 2′,3′-cyclic phosphodiesterase and 3′-Phosphate/5′-hydroxyl ligation reactions. J. Biol. Chem. 2011, 286, 43134–43143. [Google Scholar] [CrossRef] [PubMed] [Green Version]
  28. Tanaka, N.; Shuman, S. RtcB Is the RNA Ligase Component of an Escherichia coli RNA Repair Operon. J. Biol. Chem. 2011, 286, 7727–7731. [Google Scholar] [CrossRef] [Green Version]
  29. Yahr, T.L.; Greenberg, E. The Genetic Basis for the Commitment to Chronic versus Acute Infection in Pseudomonas aeruginosa. Mol. Cell 2004, 16, 497–498. [Google Scholar] [CrossRef]
  30. Zolfaghar, I.; Angus, A.A.; Kang, P.J.; To, A.; Evans, D.J.; Fleiszig, S.M. Mutation of retS, encoding a putative hybrid two-component regulatory protein in Pseudomonas aeruginosa, attenuates multiple virulence mechanisms. Microbes Infect. 2005, 7, 1305–1316. [Google Scholar] [CrossRef]
  31. Laskowski, M.A.; Osborn, E.; Kazmierczak, B.I. A novel sensor kinase-response regulator hybrid regulates type III secretion and is required for virulence in Pseudomonas aeruginosa. Mol. Microbiol. 2004, 54, 1090–1103. [Google Scholar] [CrossRef] [PubMed] [Green Version]
  32. Jennings, L.K.; Storek, K.M.; Ledvina, H.E.; Coulon, C.; Marmont, L.S.; Sadovskaya, I.; Secor, P.R.; Tseng, B.S.; Scian, M.; Filloux, A.; et al. Pel is a cationic exopolysaccharide that cross-links extracellular DNA in the Pseudomonas aeruginosa biofilm matrix. Proc. Natl. Acad. Sci. USA 2015, 112, 11353–11358. [Google Scholar] [CrossRef] [Green Version]
  33. Tamar, E.; Koler, M.; Vaknin, A. The role of motility and chemotaxis in the bacterial colonization of protected surfaces. Sci. Rep. 2016, 6, 19616. [Google Scholar] [CrossRef]
  34. Kilmury, S.L.N.; Burrows, L.L. The Pseudomonas aeruginosa PilSR Two-Component System Regulates Both Twitching and Swimming Motilities. mBio 2018, 9, e01310-18. [Google Scholar] [CrossRef] [PubMed] [Green Version]
  35. Joge, S.; Kollaran, A.M.; Kotian, H.S.; Badal, D.; Prakash, D.; Mishra, A.; Varma, M.; Singh, V. Two-component systems regulate swarming in Pseudomonas aeruginosa PA14. bioRxiv 2018, 16, 445015. [Google Scholar]
  36. Miller, R.M.; Tomaras, A.P.; Barker, A.P.; Voelker, D.R.; Chan, E.D.; Vasil, A.I.; Vasil, M.L. Pseudomonas aeruginosa Twitching Motility-Mediated Chemotaxis towards Phospholipids and Fatty Acids: Specificity and Metabolic Requirements. J. Bacteriol. 2008, 190, 4038–4049. [Google Scholar] [CrossRef] [PubMed] [Green Version]
  37. Pletzer, D.; Sun, E.; Ritchie, C.; Wilkinson, L.; Liu, L.T.; Trimble, M.J.; Wolfmeier, H.; Blimkie, T.M.; Hancock, R.E.W. Surfing motility is a complex adaptation dependent on the stringent stress response in Pseudomonas aeruginosa LESB58. PLOS Pathog. 2020, 16, e1008444. [Google Scholar] [CrossRef] [Green Version]
  38. Diaz, M.R.; King, J.M.; Yahr, T.L. Intrinsic and extrinsic regulation of type III secretion gene expression in Pseudomonas aeruginosa. Front. Microbiol. 2011, 2, 89. [Google Scholar] [CrossRef] [Green Version]
  39. Hachani, A.; Lossi, N.S.; Hamilton, A.; Jones, C.; Bleves, S.; Albesa-Jové, D.; Filloux, A. Type VI Secretion System in Pseudomonas aeruginosa. J. Biol. Chem. 2011, 286, 12317–12327. [Google Scholar] [CrossRef] [Green Version]
  40. Hsu, F.; Schwarz, S.; Mougous, J.D. TagR Promotes PpkA-Catalyzed Type VI Secretion Activation in Pseudomonas aeruginosa. Mol. Microbiol. 2009, 72, 1111–1125. [Google Scholar] [CrossRef] [Green Version]
  41. Hood, R.D.; Singh, P.; Hsu, F.; Güvener, T.; Carl, M.A.; Trinidad, R.R.; Silverman, J.M.; Ohlson, B.B.; Hicks, K.G.; Plemel, R.L.; et al. A Type VI Secretion System of Pseudomonas aeruginosa Targets a Toxin to Bacteria. Cell Host Microbe 2010, 7, 25–37. [Google Scholar] [CrossRef] [PubMed] [Green Version]
  42. Wood, T.; Howard, S.A.; Förster, A.; Nolan, L.; Manoli, E.; Bullen, N.P.; Yau, H.; Hachani, A.; Hayward, R.D.; Whitney, J.C.; et al. The Pseudomonas aeruginosa T6SS Delivers a Periplasmic Toxin that Disrupts Bacterial Cell Morphology. Cell Rep. 2019, 29, 187–201.e7. [Google Scholar] [CrossRef] [PubMed] [Green Version]
  43. Sana, T.; Hachani, A.; Bucior, I.; Soscia, C.; Garvis, S.; Termine, E.; Engel, J.; Filloux, A.; Bleves, S. The Second Type VI Secretion System of Pseudomonas aeruginosa Strain PAO1 Is Regulated by Quorum Sensing and Fur and Modulates Internalization in Epithelial Cells. J. Biol. Chem. 2012, 287, 27095–27105. [Google Scholar] [CrossRef] [Green Version]
  44. Sana, T.; Soscia, C.; Tonglet, C.M.; Garvis, S.; Bleves, S. Divergent Control of Two Type VI Secretion Systems by RpoN in Pseudomonas aeruginosa. PLoS ONE 2013, 8, e76030. [Google Scholar] [CrossRef]
  45. Janssen, K.H.; Diaz, M.R.; Gode, C.J.; Wolfgang, M.C.; Yahr, T.L. RsmV a small non-coding regulatory RNA in Pseudomonas aeruginosa that sequesters RsmA and RsmF from target mRNAs. bioRxiv 2018, 200, e00277-18. [Google Scholar] [CrossRef] [Green Version]
  46. Janssen, K.; Diaz, M.R.; Golden, M.; Graham, J.W.; Sanders, W.; Wolfgang, M.C.; Yahr, T.L. Functional Analyses of the RsmY and RsmZ Small Noncoding Regulatory RNAs in Pseudomonas aeruginosa. J. Bacteriol. 2018, 200, e00736-17. [Google Scholar] [CrossRef] [PubMed] [Green Version]
  47. Bhagirath, A.Y.; Li, Y.; Somayajula, D.; Dadashi, M.; Badr, S.; Duan, K. Cystic fibrosis lung environment and Pseudomonas aeruginosa infection. BMC Pulm. Med. 2016, 16, 174. [Google Scholar] [CrossRef] [PubMed] [Green Version]
  48. Sibley, C.D.; Parkins, M.D.; Rabin, H.R.; Duan, K.; Norgaard, J.C.; Surette, M.G. A polymicrobial perspective of pulmonary infections exposes an enigmatic pathogen in cystic fibrosis patients. Proc. Natl. Acad. Sci. USA 2008, 105, 15070–15075. [Google Scholar] [CrossRef] [Green Version]
  49. Filkins, L.M.; O’Toole, G.A. Cystic Fibrosis Lung Infections: Polymicrobial, Complex, and Hard to Treat. PLoS Pathog. 2015, 11, e1005258. [Google Scholar] [CrossRef] [Green Version]
  50. Bernard, C.S.; Brunet, Y.R.; Gueguen, E.; Cascales, E. Nooks and Crannies in Type VI Secretion Regulation. J. Bacteriol. 2010, 192, 3850–3860. [Google Scholar] [CrossRef] [Green Version]
  51. Cianciotto, N.P. Type II secretion: A protein secretion system for all seasons. Trends Microbiol. 2005, 13, 581–588. [Google Scholar] [CrossRef] [PubMed]
  52. Sijbrandi, R.; Urbanus, M.L.; Hagen-Jongman, C.M.T.; Bernstein, H.D.; Oudega, B.; Otto, B.R.; Luirink, J. Signal Recognition Particle (SRP)-mediated Targeting and Sec-dependent Translocation of an Extracellular Escherichia coli Protein. J. Biol. Chem. 2003, 278, 4654–4659. [Google Scholar] [CrossRef] [PubMed] [Green Version]
  53. Ostroff, R.M.; Wretlind, B.; Vasil, M.L. Mutations in the hemolytic-phospholipase C operon result in decreased virulence of Pseudomonas aeruginosa PAO1 grown under phosphate-limiting conditions. Infect. Immun. 1989, 57, 1369–1373. [Google Scholar] [CrossRef] [Green Version]
  54. Elsheikh, L.E.; Kronevi, T.; Wretlind, B.; Abaas, S.; Iglewski, B.H. Assessment of elastase as a Pseudomonas aeruginosa virulence factor in experimental lung infection in mink. Vet. Microbiol. 1987, 13, 281–289. [Google Scholar] [CrossRef]
  55. Filloux, A. The underlying mechanisms of type II protein secretion. Biochim. Biophys. Acta BBA—Mol. Cell Res. 2004, 1694, 163–179. [Google Scholar] [CrossRef] [Green Version]
  56. Ball, G.; Durand, E.; Lazdunski, A.; Filloux, A. A novel type II secretion system in Pseudomonas aeruginosa. Mol. Microbiol. 2002, 43, 475–485. [Google Scholar] [CrossRef]
  57. Martinez, A.; Ostrovsky, P.; Nunn, D.N. Identification of an additional member of the secretin superfamily of proteins in Pseudomonas aeruginosa that is able to function in type II protein secretion. Mol. Microbiol. 1998, 28, 1235–1246. [Google Scholar] [CrossRef] [Green Version]
  58. Hartl, F.U.; Lecker, S.; Schiebel, E.; Hendrick, J.P.; Wickner, W. The binding cascade of SecB to SecA to SecY/E mediates preprotein targeting to the E. coli plasma membrane. Cell 1990, 63, 269–279. [Google Scholar] [CrossRef]
  59. Engel, J.; Balachandran, P. Role of Pseudomonas aeruginosa type III effectors in disease. Curr. Opin. Microbiol. 2009, 12, 61–66. [Google Scholar] [CrossRef]
  60. Klauser, T.; Pohlner, J.; Meyer, T.F. The secretion pathway of IgA protease-type proteins in gram-negative bacteria. BioEssays 1993, 15, 799–805. [Google Scholar] [CrossRef]
  61. Grijpstra, J.; Arenas, J.; Rutten, L.; Tommassen, J. Autotransporter secretion: Varying on a theme. Res. Microbiol. 2013, 164, 562–582. [Google Scholar] [CrossRef] [PubMed]
  62. Reichhardt, C.; Wong, C.; da Silva, D.P.; Wozniak, D.J.; Parsek, M.R. CdrA Interactions within the Pseudomonas aeruginosa Biofilm Matrix Safeguard It from Proteolysis and Promote Cellular Packing. mBio 2018, 9, e01376-18. [Google Scholar] [CrossRef] [PubMed] [Green Version]
  63. Forster, A.; Planamente, S.; Manoli, E.; Lossi, N.S.; Freemont, P.S.; Filloux, A. Coevolution of the ATPase ClpV, the sheath proteins TssB and TssC, and the accessory protein TagJ/HsiE1 distinguishes type VI secretion classes. J. Biol. Chem. 2014, 289, 33032–33043. [Google Scholar] [CrossRef] [PubMed] [Green Version]
  64. Lennings, J.; Mayer, C.; Makhlouf, M.; Brötz-Oesterhelt, H.; Schwarz, S. Polar localization of the ATPase ClpV-5 occurs independent of type VI secretion system apparatus proteins in Burkholderia thailandensis. BMC Res. Notes 2019, 12, 109. [Google Scholar] [CrossRef] [PubMed]
  65. Hauser, A.R. The type III secretion system of Pseudomonas aeruginosa: Infection by injection. Nat. Rev. Genet. 2009, 7, 654–665. [Google Scholar] [CrossRef] [Green Version]
  66. Lykken, G.L.; Chen, G.; Brutinel, E.D.; Chen, L.; Yahr, T.L. Characterization of ExsC and ExsD Self-Association and Heterocomplex Formation. J. Bacteriol. 2006, 188, 6832–6840. [Google Scholar] [CrossRef] [PubMed] [Green Version]
  67. Frank, L.H.; DeMoss, R.D. On the biosynthesis of pyocyanine. J. Bacteriol. 1959, 77, 776–782. [Google Scholar] [CrossRef] [PubMed] [Green Version]
  68. Colley, B.; Dederer, V.; Carnell, M.; Kjelleberg, S.; Rice, S.A.; Klebensberger, J. SiaA/D Interconnects c-di-GMP and RsmA Signaling to Coordinate Cellular Aggregation of Pseudomonas aeruginosa in Response to Environmental Conditions. Front. Microbiol. 2016, 7, 179. [Google Scholar] [CrossRef] [PubMed]
  69. Simon, R.; Priefer, U.B.; Pühler, A. A Broad Host Range Mobilization System for In Vivo Genetic Engineering: Transposon Mutagenesis in Gram Negative Bacteria. Bio/Technology 1983, 1, 784–791. [Google Scholar] [CrossRef]
  70. Duan, K.; Dammel, C.; Stein, J.; Rabin, H.; Surette, M.G. Modulation of Pseudomonas aeruginosa gene expression by host microflora through interspecies communication. Mol. Microbiol. 2003, 50, 1477–1491. [Google Scholar] [CrossRef] [Green Version]
  71. Ditta, G.; Stanfield, S.; Corbin, D.; Helinski, D.R. Broad host range DNA cloning system for gram-negative bacteria: Construction of a gene bank of Rhizobium meliloti. Proc. Natl. Acad. Sci. USA 1980, 77, 7347–7351. [Google Scholar] [CrossRef] [PubMed] [Green Version]
  72. Hoang, T.T.; Karkhoff-Schweizer, R.R.; Kutchma, A.J.; Schweizer, H.P. A broad-host-range Flp-FRT recombination system for site-specific excision of chromosomally-located DNA sequences: Application for isolation of unmarked Pseudomonas aeruginosa mutants. Gene 1998, 212, 77–86. [Google Scholar] [CrossRef]
  73. Sharp, R.; Jansons, I.S.; Gertman, E.; Kropinski, A.M. Genetic and sequence analysis of the cos region of the temperate Pseudomonas aeruginosa bacteriophage, D3. Gene 1996, 177, 47–53. [Google Scholar] [CrossRef]
  74. Becher, A.; Schweizer, H.P. Integration-Proficient Pseudomonas aeruginosa Vectors for Isolation of Single-Copy Chromosomal lacZ and lux Gene Fusions. BioTechniques 2000, 29, 948–952. [Google Scholar] [CrossRef] [PubMed] [Green Version]
  75. Hoang, T.T.; Kutchma, A.J.; Becher, A.; Schweizer, H.P. Integration-Proficient Plasmids for Pseudomonas aeruginosa: Site-Specific Integration and Use for Engineering of Reporter and Expression Strains. Plasmid 2000, 43, 59–72. [Google Scholar] [CrossRef]
  76. Liang, H.; Li, L.; Dong, Z.; Surette, M.G.; Duan, K. The YebC Family Protein PA0964 Negatively Regulates the Pseudomonas aeruginosa Quinolone Signal System and Pyocyanin Production. J. Bacteriol. 2008, 190, 6217–6227. [Google Scholar] [CrossRef] [Green Version]
  77. Essar, D.W.; Eberly, L.; Hadero, A.; Crawford, I.P. Identification and characterization of genes for a second anthranilate synthase in Pseudomonas aeruginosa: Interchangeability of the two anthranilate synthases and evolutionary implications. J. Bacteriol. 1990, 172, 884–900. [Google Scholar] [CrossRef] [Green Version]
  78. O’Toole, G.A.; Kolter, R. Initiation of biofilm formation in Pseudomonas fluorescens WCS365 proceeds via multiple, convergent signalling pathways: A genetic analysis. Mol. Microbiol. 1998, 28, 449–461. [Google Scholar] [CrossRef]
  79. Rashid, M.H.; Kornberg, A. Inorganic polyphosphate is needed for swimming, swarming, and twitching motilities of Pseudomonas aeruginosa. Proc. Natl. Acad. Sci. USA 2000, 97, 4885–4890. [Google Scholar] [CrossRef] [Green Version]
  80. Livak, K.J.; Schmittgen, T.D. Analysis of Relative Gene Expression Data Using Real-Time Quantitative PCR and the 2−ΔΔCT Method. Methods 2001, 25, 402–408. [Google Scholar] [CrossRef]
  81. Hachani, A.; Lossi, N.S.; Filloux, A. A Visual Assay to Monitor T6SS-mediated Bacterial Competition. J. Vis. Exp. 2013, 5, e50103. [Google Scholar] [CrossRef] [PubMed]
  82. Rahme, L.G.; Tan, M.-W.; Le, L.; Wong, S.M.; Tompkins, R.G.; Calderwood, S.B.; Ausubel, F.M. Use of model plant hosts to identify Pseudomonas aeruginosa virulence factors. Proc. Natl. Acad. Sci. USA 1997, 94, 13245–13250. [Google Scholar] [CrossRef] [PubMed] [Green Version]
  83. Harlow, E.; Lane, D. Bradford assay. CSH Protoc. 2006, 2006, 4644. [Google Scholar] [CrossRef] [PubMed]
  84. Poole, K.; Neshat, S.; Krebes, K.; Heinrichs, D.E. Cloning and nucleotide sequence analysis of the ferripyoverdine receptor gene fpvA of Pseudomonas aeruginosa. J. Bacteriol. 1993, 175, 4597–4604. [Google Scholar] [CrossRef] [PubMed] [Green Version]
  85. Irie, Y.; Parsek, M.R. LC/MS/MS-Based Quantitative Assay for the Secondary Messenger Molecule, c-di-GMP. In Pseudomonas Methods and Protocols; Filloux, A., Ramos, J.-L., Eds.; Springer: New York, NY, USA, 2014; pp. 271–279. [Google Scholar]
Figure 1. Deletion of rtcB influenced multiple virulence factors of P. aeruginosa. (A) Measurement of pyocyanin production in PAO1, PAO1(∆rtcB), PAO1(∆retS), and PAO1(∆rtcBretS), and the complemented deletion strains with rtcB expression vector. Pyocyanin was produced in significantly higher amounts in PAO1(∆rtcB) and PAO1 (∆retS) compared to PAO1. The complementation of rtcB deletion mutants restored the pyocyanin production. (B) Biofilm formation was assayed in a 96-multi-well plate under static conditions. Biofilm formation was significantly higher in PAO1(∆retS) than in PAO1. The PAO1(∆rtcBretS) strain formed significantly less biofilms compared to PAO1(∆retS). Biofilm formation in the complemented strains returned to the levels of PAO1 and PAO1(∆retS), respectively. (C) Motility assays revealed that swarming and swimming motilities of PAO1(∆rtcB) were decreased compared to the wild-type PAO1. Swarming, swimming, and twitching were increased in PAO1(∆rtcBretS) compared with PAO1(∆retS). Overexpression of rtcB in the rtcB deletion strains reduced the motilities to levels similar to the background. (A,B): Data from three independent experiments were analyzed using one-way ANOVA with Dunnette post-hoc test. (C): images are representative of three independent experiments. ns, p > 0.05, * p < 0.05, *** p < 0.001, and **** p < 0.0001.
Ijms 22 12561 g001
Figure 2. The promoter activities of exoS (A), an effector of T3SS, and H1-T6SS (B) in PAO1 and its derivative mutants at the 12 h growth time point. CTX-H1 and CTX-exoS reporter fusions were integrated into the chromosome of P. aeruginosa. Complementing vector pAK1900-rtcB was introduced to the mutant strains PAO1(∆rtcB) and PAO1(∆rtcBretS), respectively, to construct the complementation strains. Expression is reported as light production (counts per second) normalized to growth (OD600). The results shown are the average of three independent readouts performed in triplicate. Data were analyzed using one-way ANOVA with Dunnette post-hoc test. NS p > 0.05, ** p < 0.01, *** p < 0.001, and **** p < 0.0001.
Ijms 22 12561 g002
Figure 3. The effect of rtcB deletion on the transcriptome of P. aeruginosa. (A) A total of 370 genes showed significantly altered expression when comparing PAO1(∆rtcB) to PAO1 (group 1), while 1030 genes were differentially expressed between PAO1(∆rtcBretS) and PAO1(∆retS) (group 2). (B) The pie charts represent the Gene Ontology analysis of DEGs in groups 1 (upper panel) and 2 (lower panel). In group 1, 80.68% of DEGs belonged to global and metabolic pathways. The largest group of genes after metabolic-related genes were membrane transport genes (5.19%) and bacterial secretion systems (shown as a separate slice) (4.90%). In group 2, a similar pattern was observed, with the biggest difference belonging to the signal transduction (5.38%) and bacterial secretion systems (5.03%). (C) KEGG enrichment in groups 1 (left panel) and 2 (right panel). The Y-axis shows the top 20 pathways affected by the deletion of rtcB. The X-axis represents the ratio of the number of enriched DEGs in the categorized KEGG to the total genes of that category. Dot size represents the number of DEGs in the pathway, while dot color indicates the Q-value. The Q-value is the enrichment level of each category and represents how significant genes are affected in rtcB deficient strains. In group 1, the only virulence-related pathway shown in the KEGG plot was bacterial secretion systems; in group 2, the expression of genes associated with bacterial secretion systems and bacterial chemotaxis was significantly different.
Ijms 22 12561 g003
Figure 4. Confirmation of RtcB effect on rsmA and genes associated with H1-T6SS and T3SS. The mRNA levels of H1-T6SS and T3SS genes were quantified by qPCR. (A) The transcription levels of clpV1 and hcp1 were significantly higher in PAO1(∆rtcB) than in PAO1 (* p < 0.05). (B) The expression of exsA and exsC was upregulated considerably in PAO1(∆rtcBretS) compared to PAO1(∆retS) (* p < 0.05 and ** p < 0.01). (C) The expression level of rsmA remained unchanged in all strains, confirming the RNAseq data. Expression levels were normalized to the levels of housekeeping gene rpoD and presented as a fold change relative to the control (=1). Data were analyzed using unpaired Student’s t-test. Two independent experiments were performed in triplicate. NS p > 0.05.
Ijms 22 12561 g004
Figure 5. Functional T6SS in ∆rtcB participated in the killing of E. coli and infection of lettuce leaves. (A) Differential expression of T3SS and T6SS genes in PAO1 vs. PAO1(∆rtcB) and PAO1(∆retS) vs. PAO1(∆rtcBretS). (B) Competitive prokaryotic killing assay, in which co-cultures of E. coli with predator Pseudomonas strains were spotted on coliform agar plates. The blue color represents live E. coli cells. The table shows the colony forming unit (CFU) at 10−5, 10−4, and 10−3 dilutions. Lower CFU of live E. coli cells (blue colonies) in co-cultures of PAO1(∆rtcB)+E. coli, in comparison with co-cultures of PAO1+E. coli strains, represent the higher killing potential of PAO1(∆rtcB) with activated T6SSs. (C) Fluorescence competition assay showing live E. coli harboring pilG-DsRed fluorescent reporter in red. (D) Photographed lettuce midribs show the infection sites after 48 h. PAO1(∆rtcB) and PAO1(∆rtcBretS) caused a more robust infection than PAO1 and PAO1(∆retS), respectively.
Ijms 22 12561 g005aIjms 22 12561 g005b
Figure 6. RsmA protein abundance was increased in PAO1(∆rtcB) and PAO1(∆rtcB∆retS), compared to their respective controls. (A) The total protein content of each strain was determined by Bradford assay, separated by SDS-PAGE, and probed with the E. coli CsrA antibody. Ponceau staining was used as a loading control. The RtcB deficient strain showed an increased content of RsmA compared with PAO1 and PAO1(∆retS). (B) Densitometric analysis of the protein bands showed that the amount of RsmA in PAO1(∆rtcB) and PAO1(∆rtcBretS) was significantly increased. The luminescence intensity was measured with ImageJ software. Results are the average of three independent experiments. Data were analyzed using one-way ANOVA with Dunnette post-hoc test. ns p > 0.05, * p < 0.05, ** p < 0.01, and *** p < 0.001.
Ijms 22 12561 g006
Figure 7. Complementation of rtcB deletion mutants with RsmY/Z overexpressing vectors altered H1-T6SS and exoS reporter activity. Expression of H1-T6SS (A) and exoS (B) was measured in mutant strains. Data were analyzed using one-way ANOVA with Dunnette post-hoc test, NS p > 0.05, **** p < 0.0001.
Ijms 22 12561 g007
Figure 8. Comparison of c-di-GMP-related transcriptome and intracellular c-di-GMP concentration in PAO1, PAO1(∆rtcB), PAO1(∆retS), and PAO1(∆rtcBretS) strains. (A) The transcription levels of genes involved in c-di-GMP secondary messenger metabolism were calculated from FPKM values using the MATLAB graphical toolbox and represented as color-coded boxes (blue, downregulation; red-code, upregulation). (B) Deletion of rtcB significantly increased the intracellular concentration of c-di-GMP (PAO1 vs. PAO1(∆rtcB)), indicating an important role of rtcB in the modulation of c-di-GMP metabolism. Data were analyzed using one-way ANOVA with Dunnette post-hoc test, NS p > 0.05, * p < 0.05, ** p < 0.01.
Ijms 22 12561 g008
Table 1. Differential expression of secretory proteins of T2SS and T5SS.
Gene LocusSecretion SystemSecreted Proteinp ValueFDRLog 2-Fold Change
PAO1(∆rtcB)
PA2939T2SSPaAP6.97 × 10−153.55 × 10−131
PA4625T5SSCdrA5.24 × 10−431.53 × 10−402.1
PAO1(∆rtcBretS)
PA0572T2SSProtease2.25 × 10−154.64 × 10⁻¹⁴−1.5
PA0852T2SSCbpD4.32 × 10−211.18 × 10⁻¹⁹−1.6
PA1249T2SSAprA5.56 × 10−64.76 × 10⁻⁵−1.2
PA1948T2SSToxA5.76 × 10−64.91 × 10−51.1
PA2862T2SSLipA1.08 × 10−71.17 × 10−64.8
PA2939T2SSPaAP3.42 × 10−177.92 × 10⁻¹⁶−1.5
PA2676T2SSHplS0.0107260.041385−1.8
PA2677T2SSHplR5.62 × 10−86.40 × 10⁻⁷−3
PA2678T2SSUnknown protein1.53 × 10−50.000119−3.3
PA3105T2SSXcpQ1.43 × 10−234.40 × 10⁻²²−2.1
PA3724T2SSLasB1.48 × 10−112.35 × 10−101.2
PA3822Sec-SRPUnknown protein1.14 × 10−59.19 × 10−51
PA4082T5SSCupB52.84 × 10−114.39 × 10⁻¹⁰−2.3
PA4624T5SSCdrB1.47 × 10−81.82 × 10⁻⁷−1.3
PA5210T2SSProbable ATPase3.32 × 10−94.30 × 10⁻⁸−1.1
Table 2. Bacterial strains and plasmids used in this study.
Bacterial Strains or PlasmidRelevant Characteristics/SequenceSource
E. coli strains
DH5αF φ80lacZ∆M15 ∆(lacZYA-argF) U169 recA1 endA1 hsdR17 (rk, mk+) phoA supE44 λ thi1 gyrA96 relA1Invitrogen
SM10-λ pirMobilizing strain, RP4 integrated into the chromosome; Knr[69]
Mach1™-T1RF- Φ80lacZΔM15 ΔlacΧ74 hsdR(rK- mK+) ΔrecA1398 endA1 tonAInvitrogen
P. aeruginosa strains
PAO1Wild type, lab strainIn-house
PAO1 (∆retS)retS replacement mutant of PAO1In-house
PAO1 (∆rtcB)rtcB replacement mutant of PAO1This study
PAO1 (∆rtcBretS)rtcB retS replacement mutant of PAO1This study
Plasmids
pMS402Expression reporter plasmid carrying the promoterless luxCDABE; Knr Tmpr[70]
CTX-6.1Integration plasmid origins of plasmid mini-CTX-lux; TcrIn-house
pRK2013Broad-host-range helper vector; Tra+, Knr[71]
pEX18TcoriT+sacB+ gene replacement vector with multiple-cloning site from pUC18; Tcr[72]
pAK1900E. coli-P. aeruginosa shuttle cloning vector, Ampr[73]
pAK-rtcBpAK1900 with a 1260 bp fragment of PA4583 between BamHI and HindIII; Ampr, CbrThis study
pEX18Tc-rtcBpEX18Tc carrying the upstream and downstream fragment of rtcBThis study
pKD-H1T6SSpMS402 containing H1-T6SS promoter region; Knr, TmprIn-house
CTX-H1T6SSIntegration plasmid, CTX6.1 with a fragment of pKD-H1-T6SS containing H1 promoter region and luxCDABE gene; Knr, Tmpr, TcrThis study
CTX-ExoSIntegration plasmid, CTX6.1 with a fragment of pKD-ExoS containing exoS promoter region and luxCDABE gene; Knr, Tmpr, TcrIn-house
pAK-rsmYpAK1900 with a 124 bp fragment of rsmY between BamHI and HindIII; Ampr, CbrThis study
pAK-rsmZpAK1900 with a 116 bp fragment of rsmZ between BamHI and HindIII; Ampr, CbrThis study
Table 3. Primers used in this study.
PrimerSequence (5′→3′) aRestriction Site
rtcB -UP-SacagcgGAATTCCTGGTGGAGCGCTACTTCACCEcoRI
rtcB -UP-ASacagcgGGATCCGTCCAGAGCTTGATCGGCTTBamHI
rtcB -DW-SacagcgGGATCCCGATGGCCTACAAGGACATCGBamHI
rtcB -DW-ASacagcgAAGCTTGATGTTGCGGATGCGCAGCHindIII
pAK-rtcB-SacagcgAAGCTTGGAGCACAAGGAAAGCACGATGHindIII
pAK-rtcB-ASacagcgGGATCCCGTCATCCTTTCACGCACACCBamHI
pKD-rtcB-SacagcgCTCGAGGCTCGAACGTTGCCTTAACGGCXhoI
pKD-rtcB-ASacagcgGGATCCGGAATACAGCAGGCCGCGTTCGBamHI
pAK-rsmY-SacagcgAAGCTTCATGCTGGGAAGGCTCGCGATGXhoI
pAK-rsmY-ASacagcgGAATTCCTGAAGGTCGGCCTGGTCTACCBamHI
pAK-rsmZ-SacagcgGGATCCGTGACGCGCTGTTCCAGTGACGXhoI
pAK-rsmZ-ASacagcgGGAATTCATCGAGCTGAACAGCBamHI
rpoD-SGATCTCCATGGAAACCCCGATC
rpoD-ASGAGGACTTCGCGGGTGGATTC
exsA-STTCTGCTCGAGGGCGAACTGAC
exsA-ASCGGCTGTCCTTTCCCTTGGTAC
clpv1-SCTGAACAGCCTGGCCTACAAGG
clpv1-ASGAGTCCGGCAACTGGAGGATC
hcp1-SGACGTCAAGGGTGAGTCCAAGG
hcp1-ASCAGGTTGGGCGTGGACTTGTC
exsC-SCAAGGTCAACCGACTGCTTGC
exsC-ASCATCGGCCTCCAGCAACAGAC
rsmA-SAGACCCTGATGGTAGGTGACGA
rsmA-ASTGGATGCGCTGGTAAATTTCCT
a, underlined are restriction site sequences. The overhanging base pairs are shown with lower case.
Publisher’s Note: MDPI stays neutral with regard to jurisdictional claims in published maps and institutional affiliations.

