
Direct Electrochemical Generation of Catalytically Competent Oxyferryl Species of Classes I and P Dye Decolorizing Peroxidases


Abstract
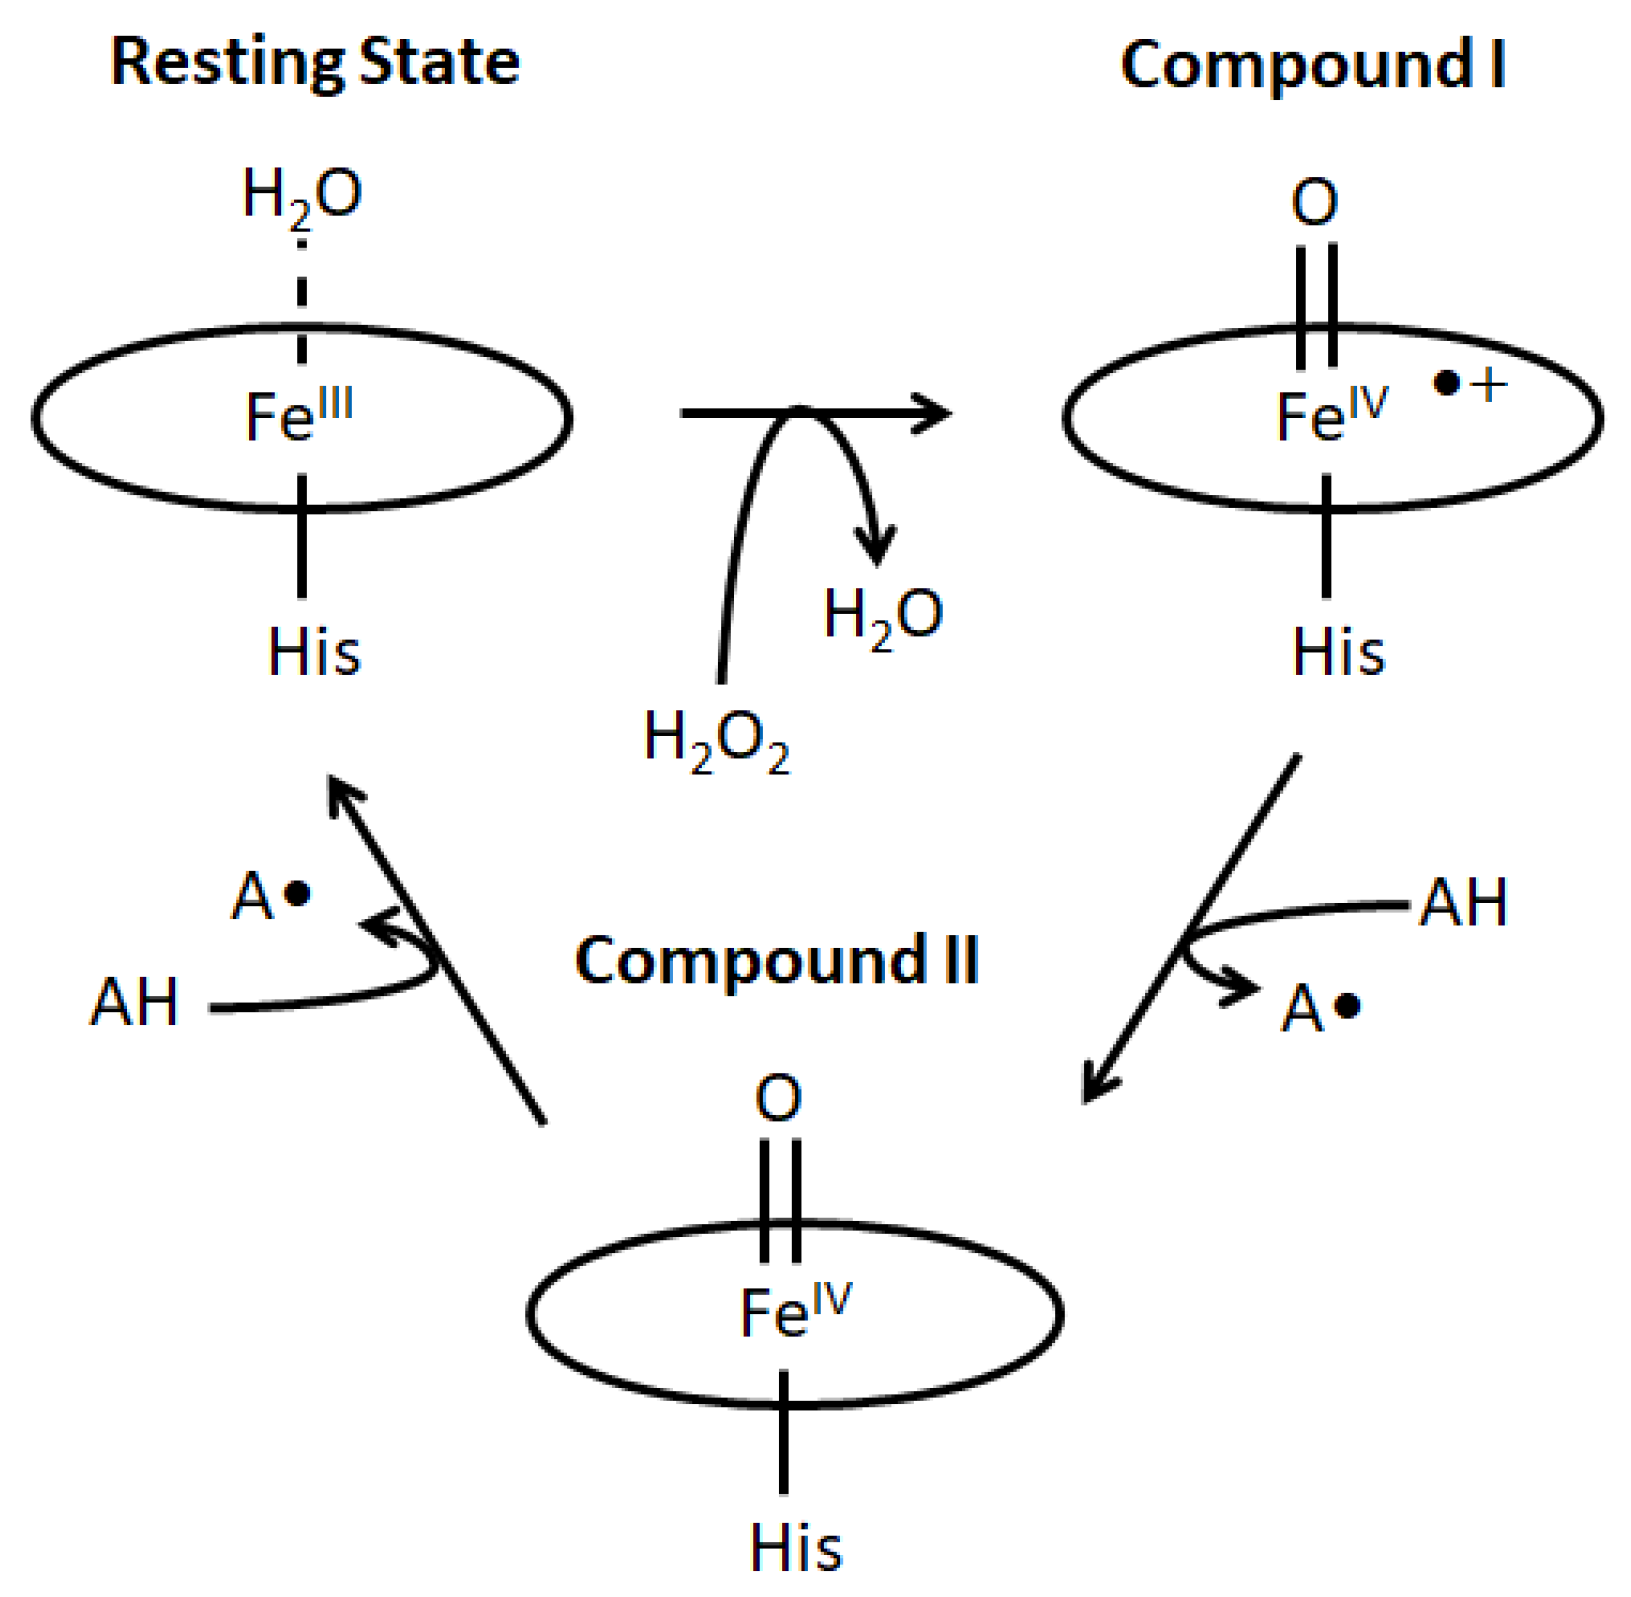
:1. Introduction
2. Results
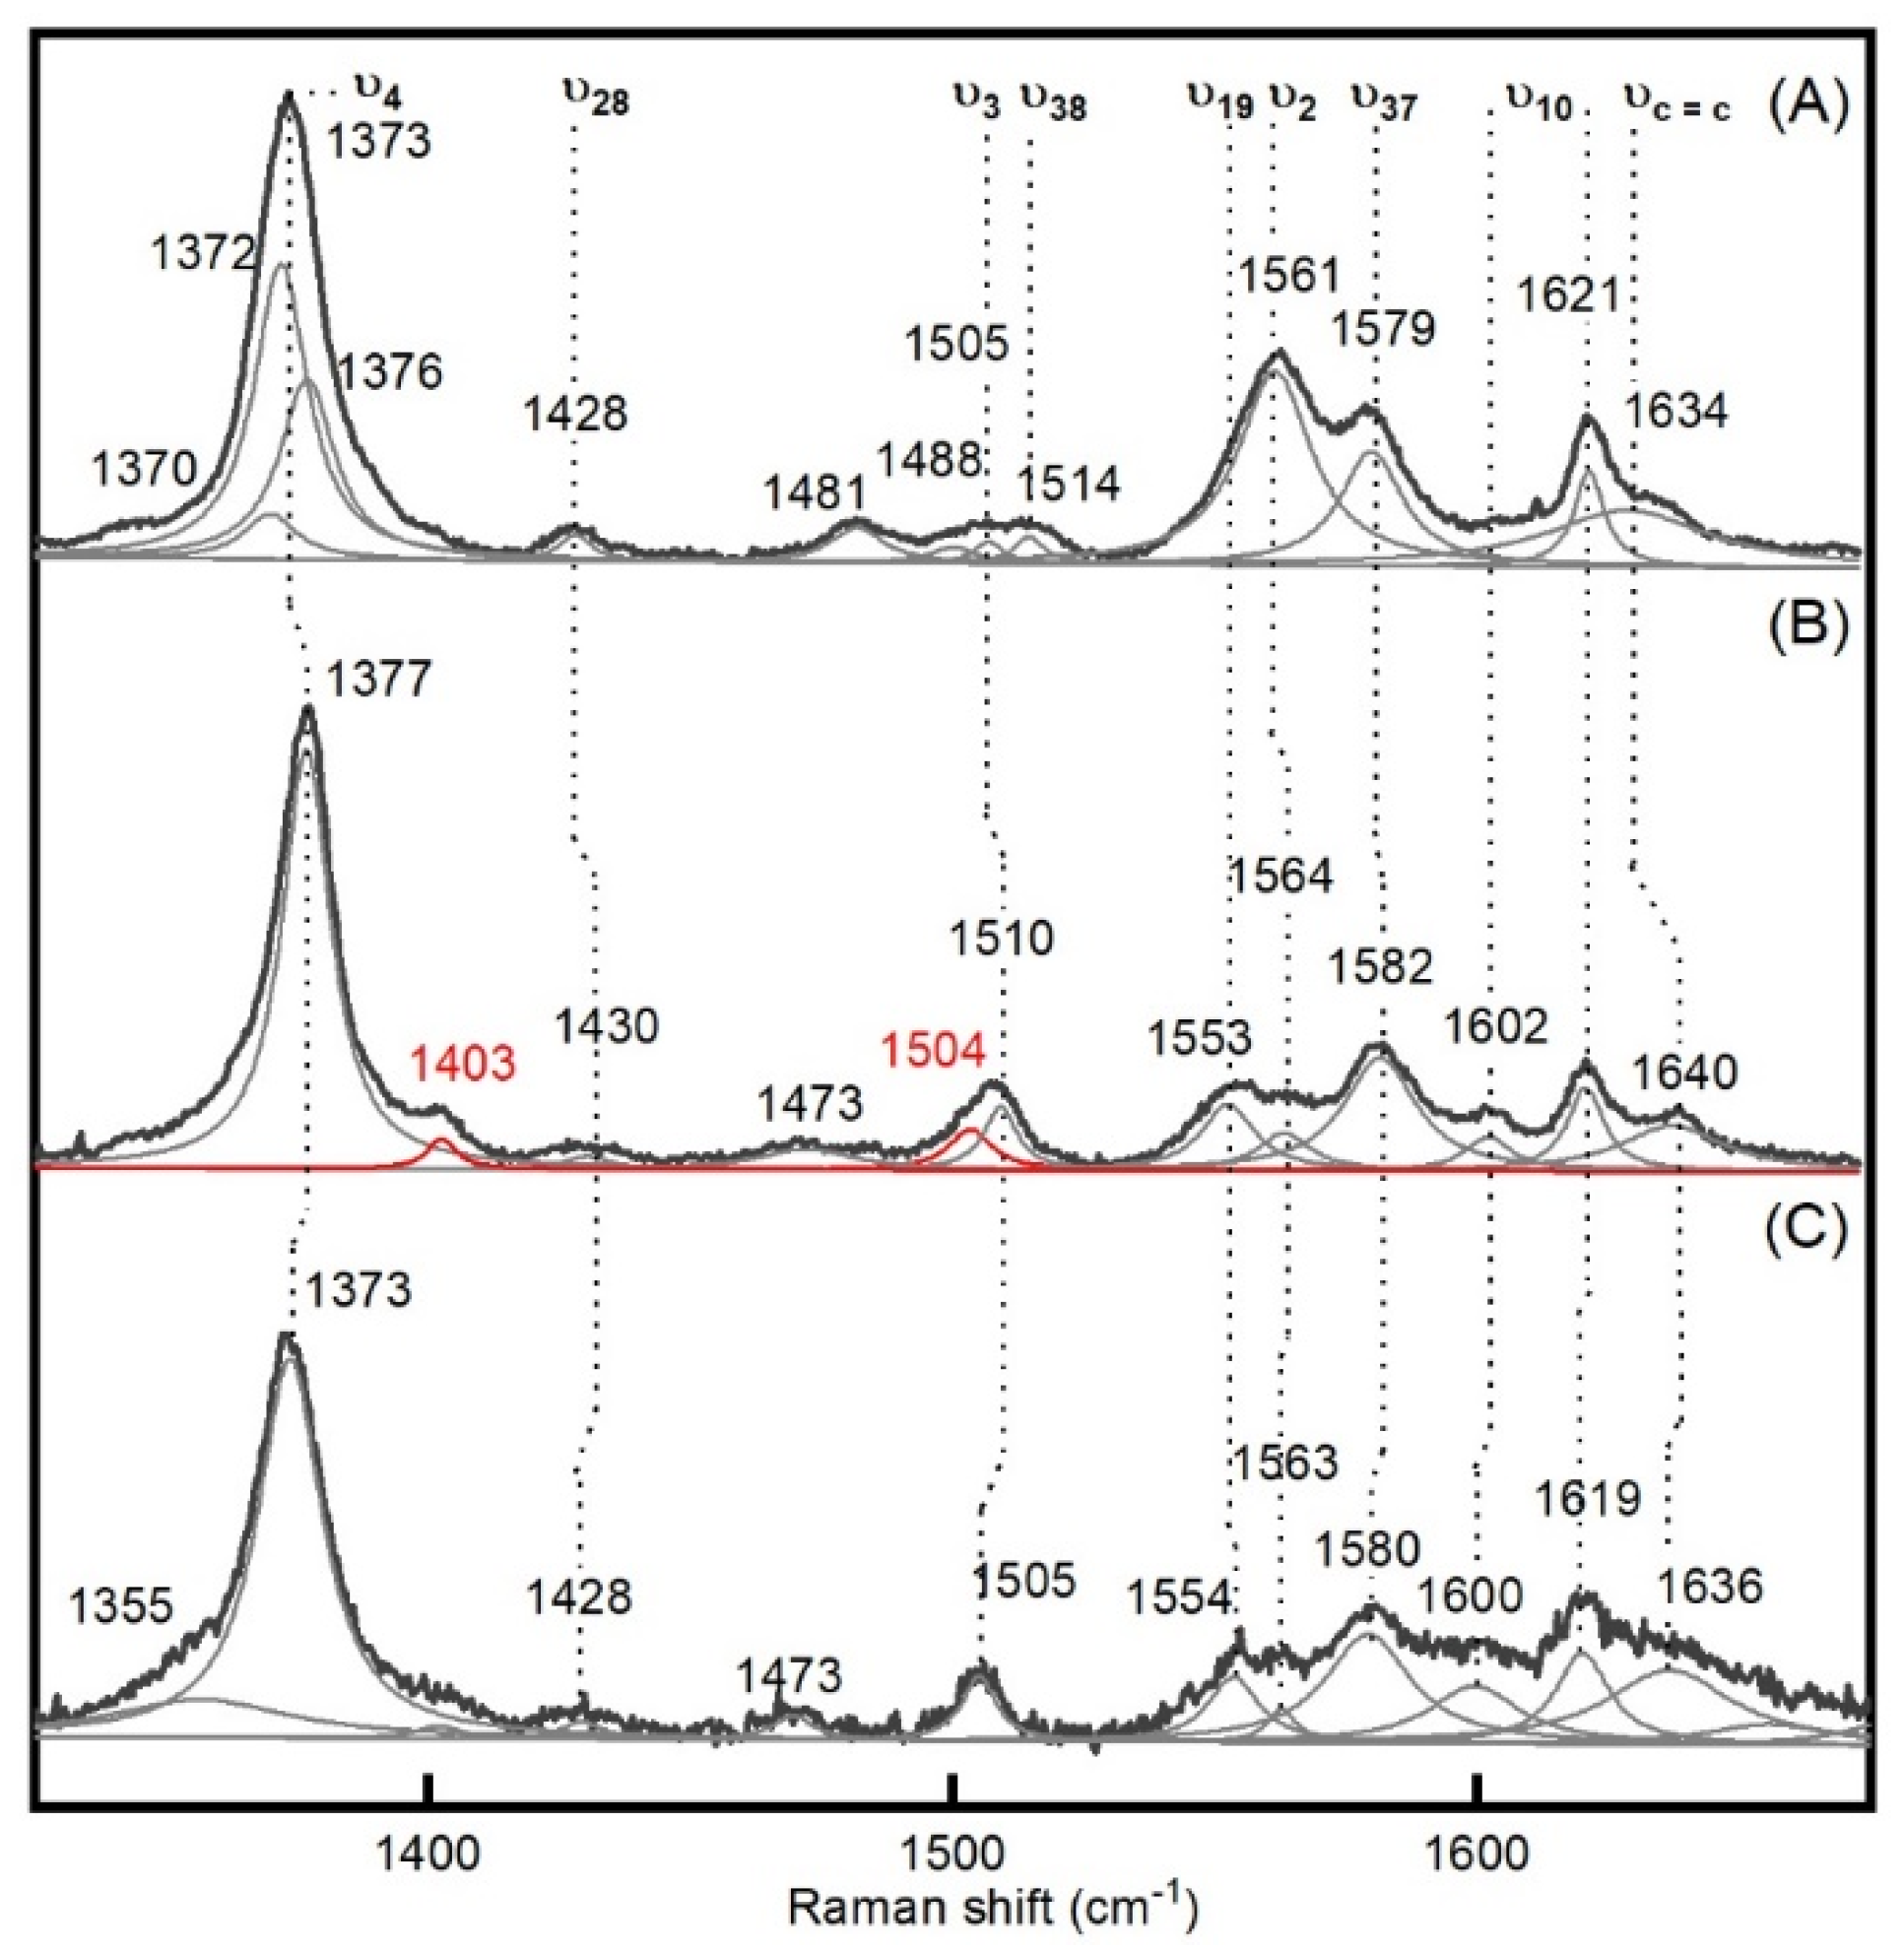
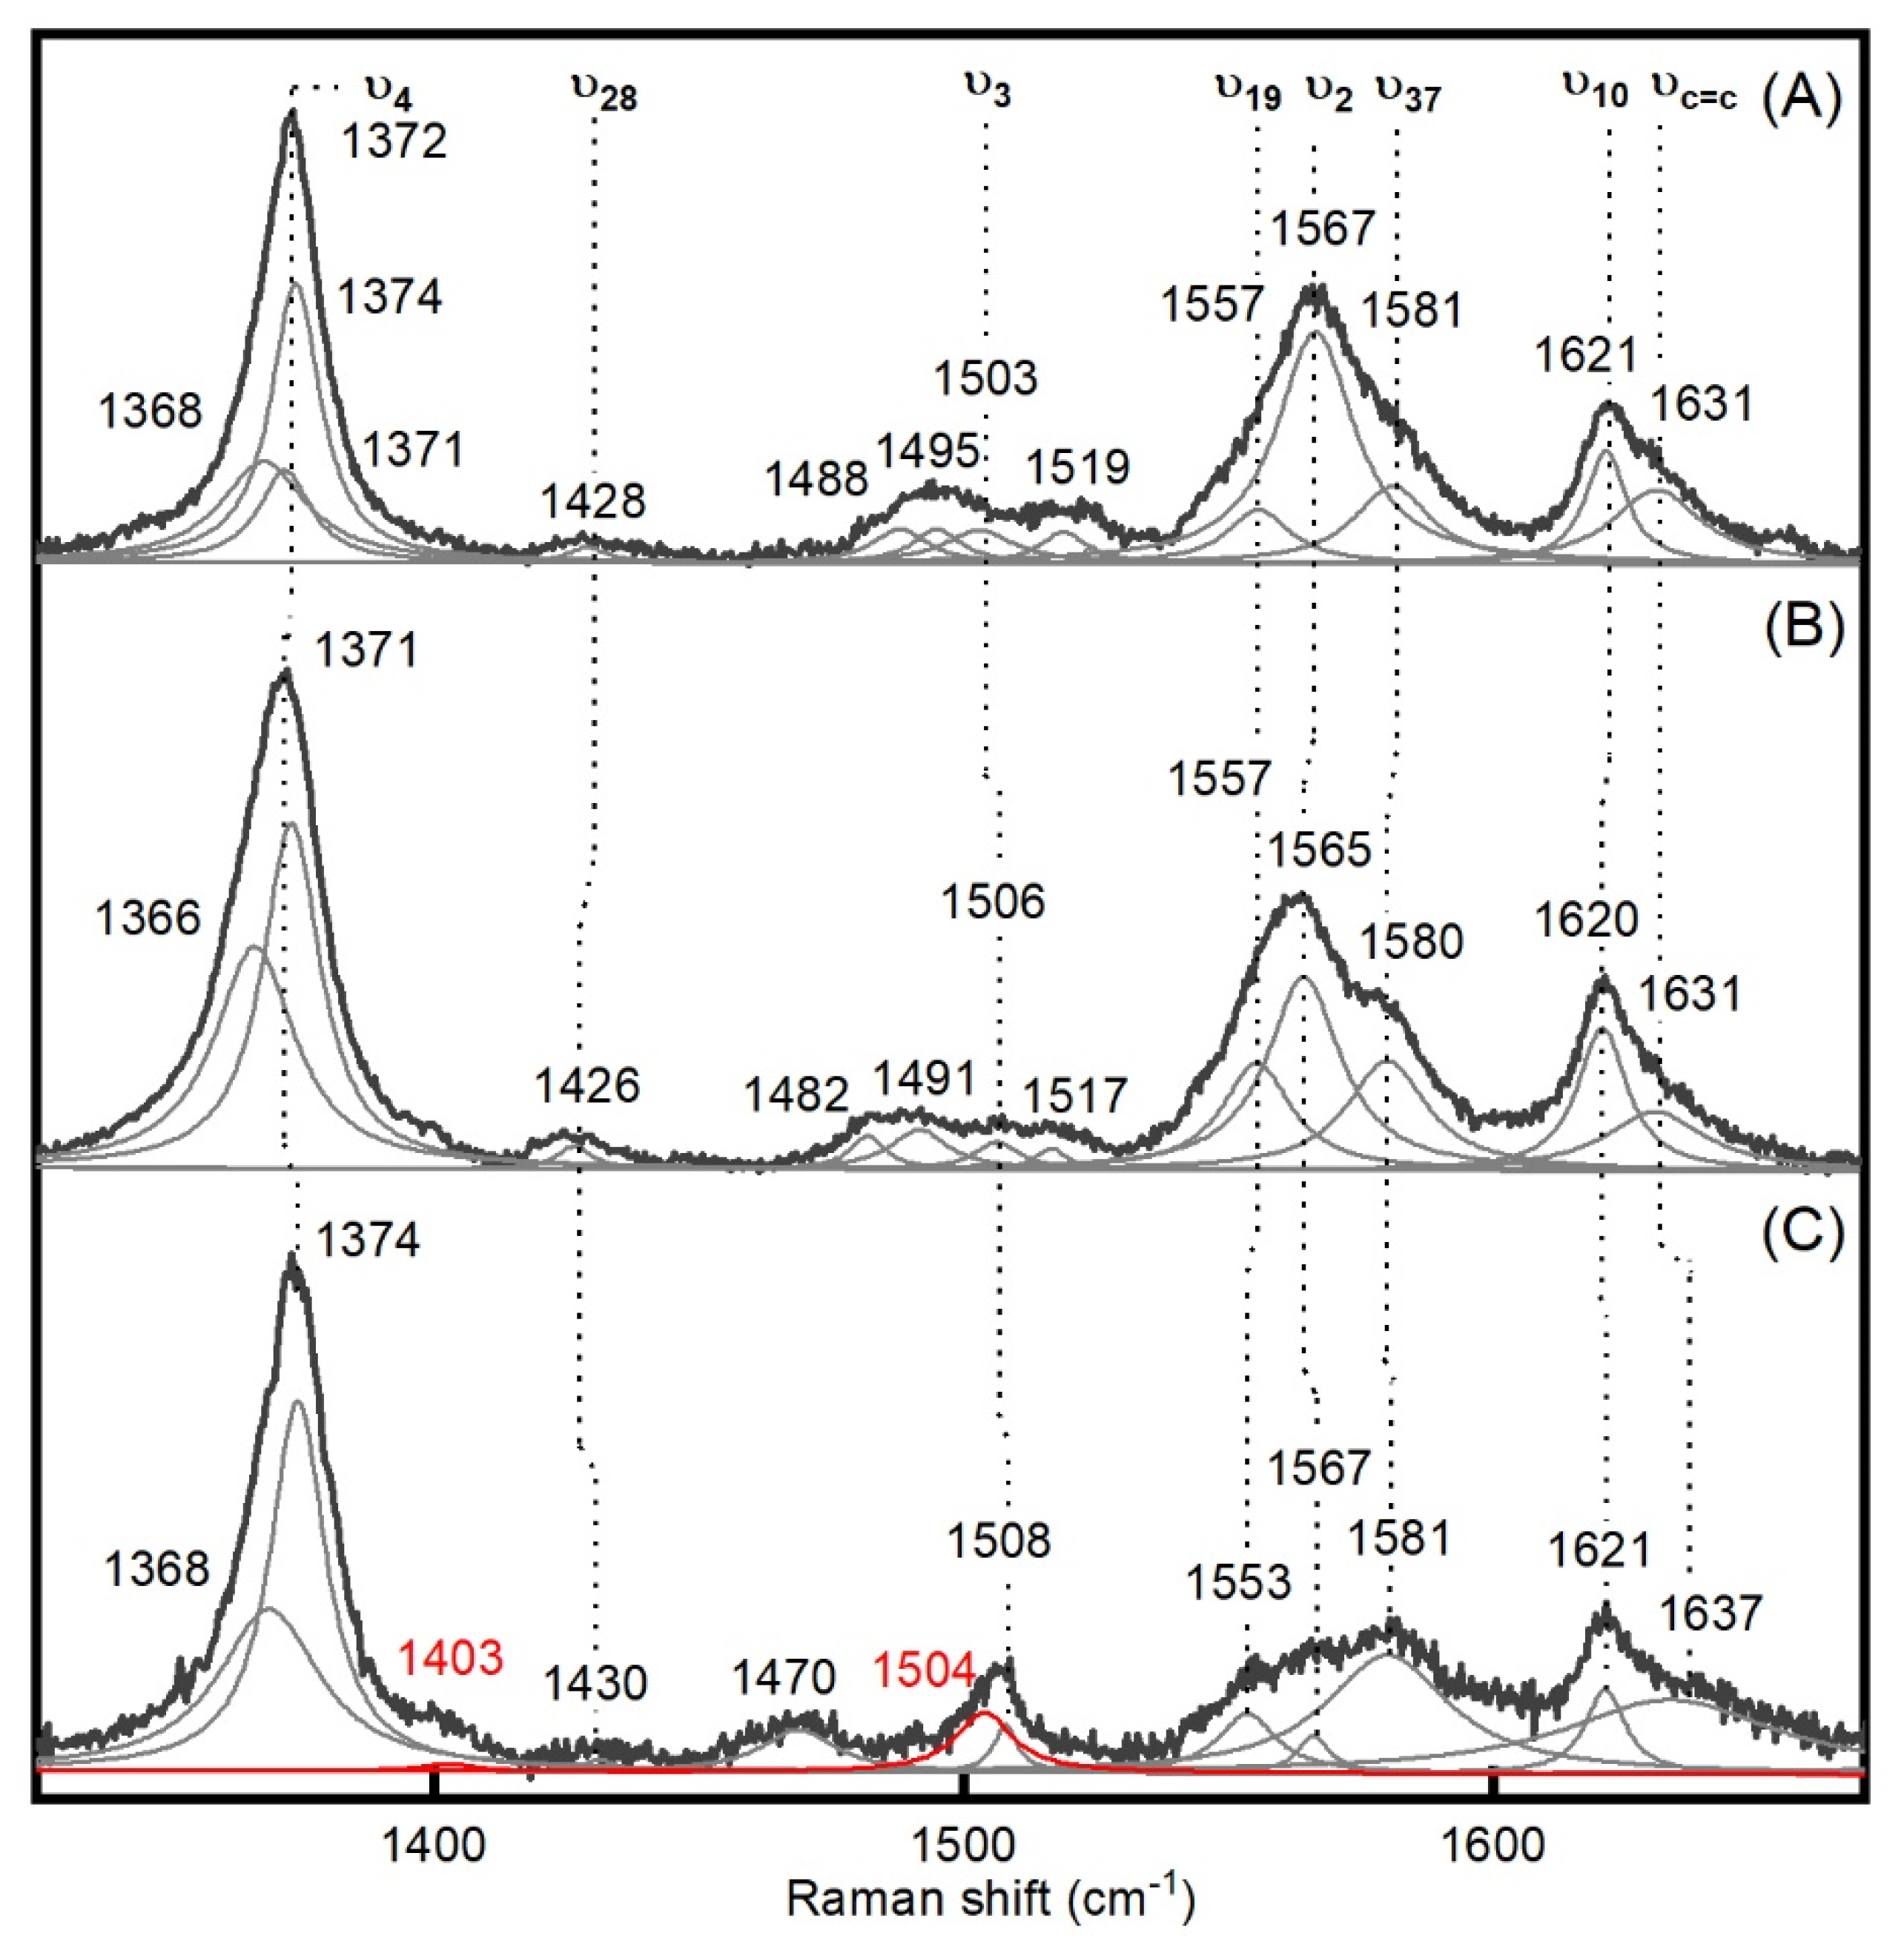
2.1. Generation and Spectroscopic Characterization of BsDyP and PpDyP High-Valent Catalytic Intermediates
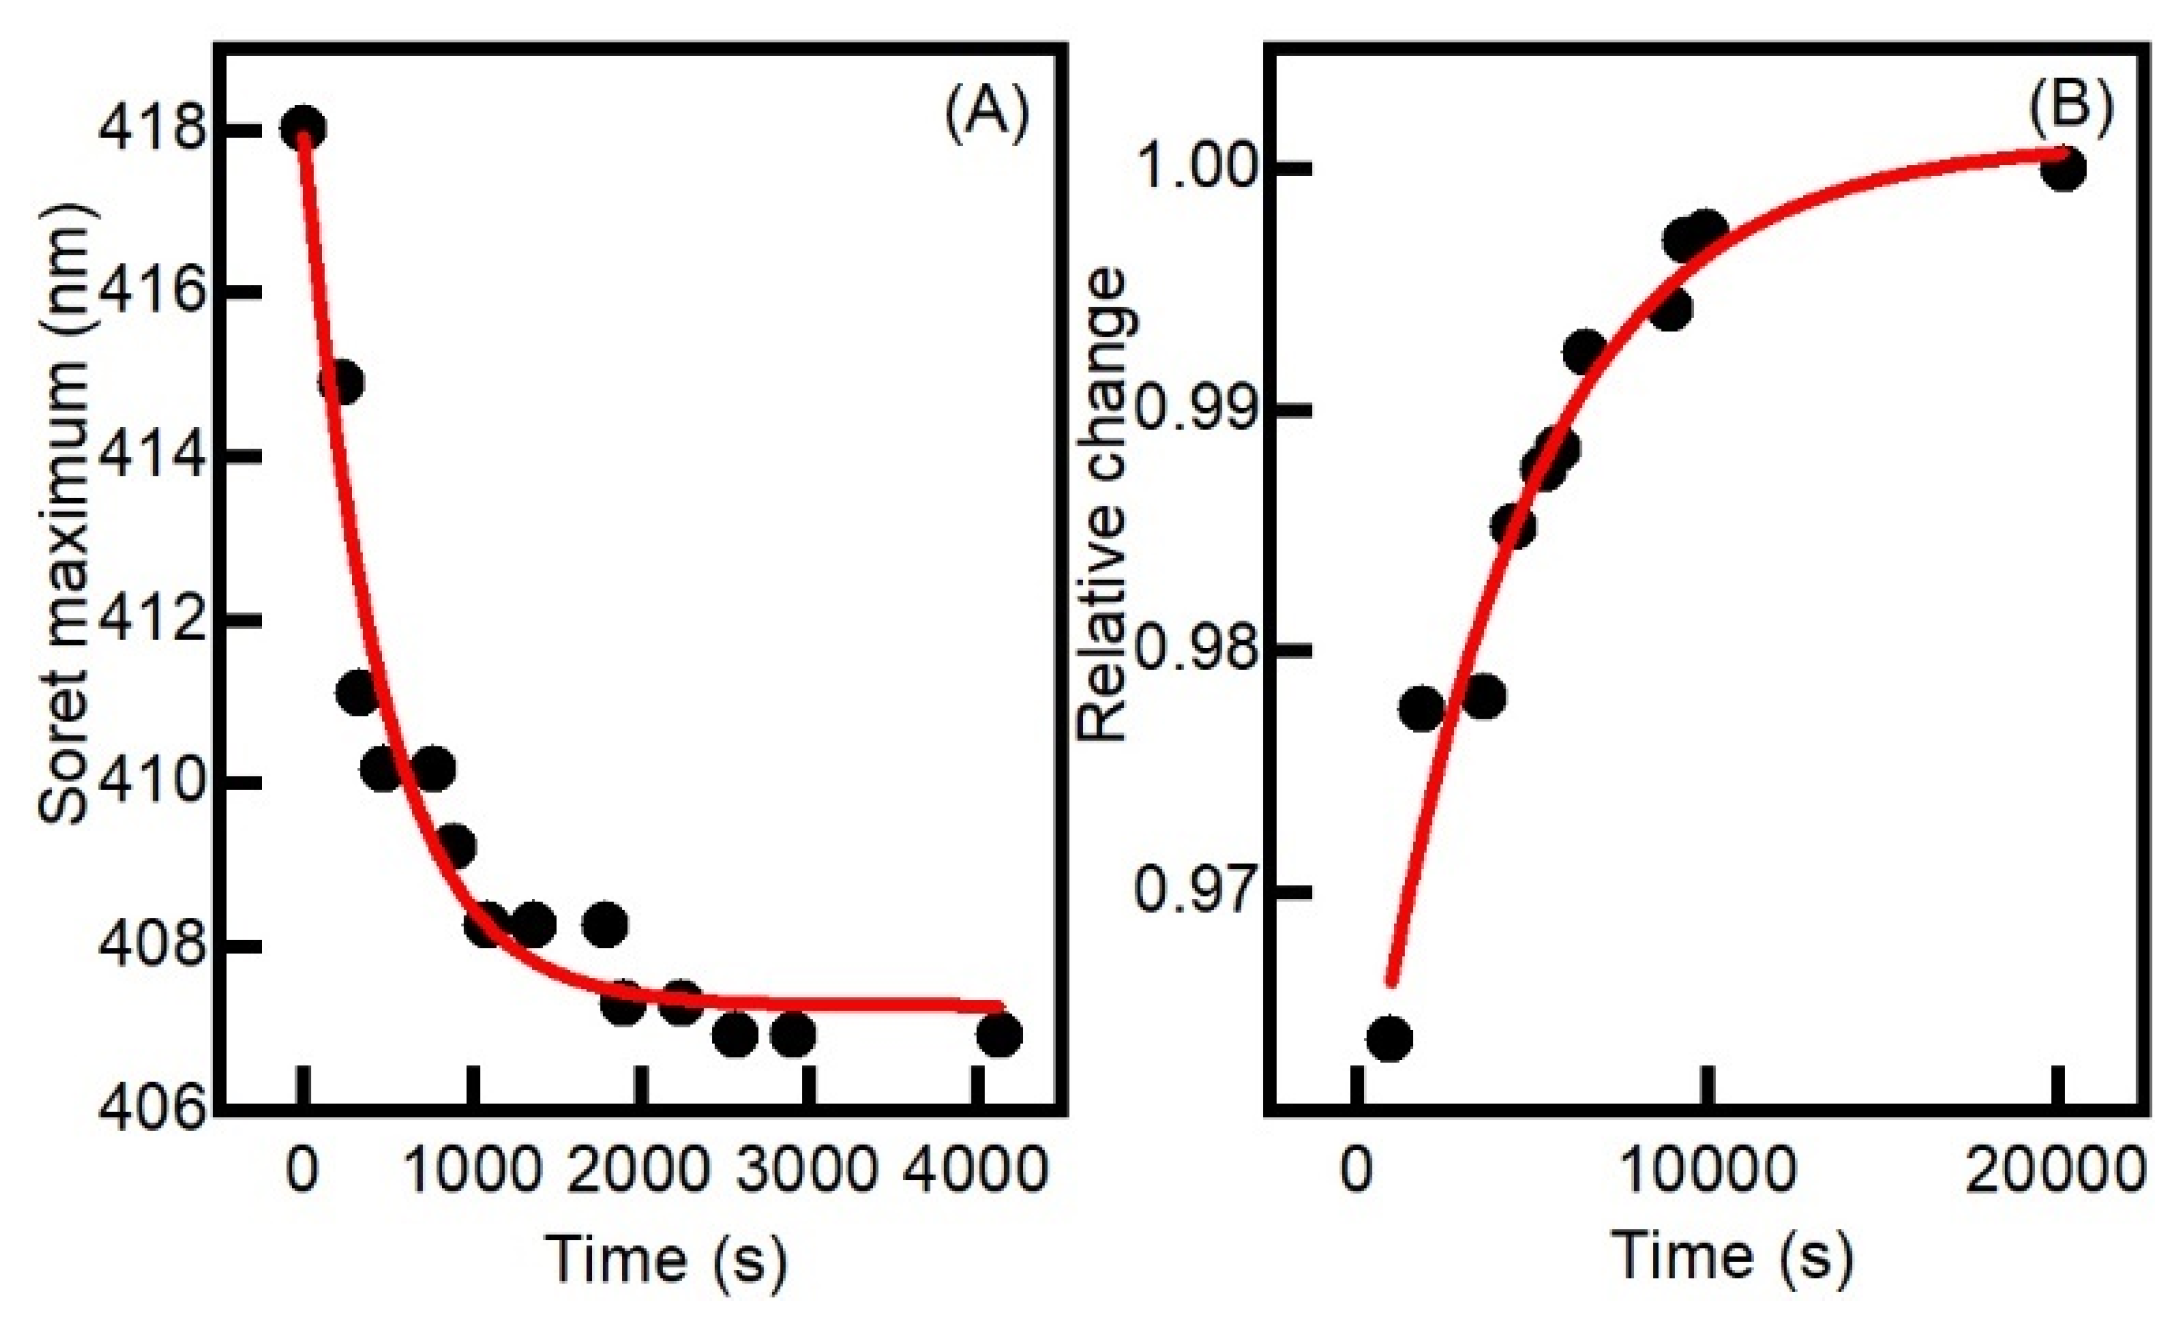
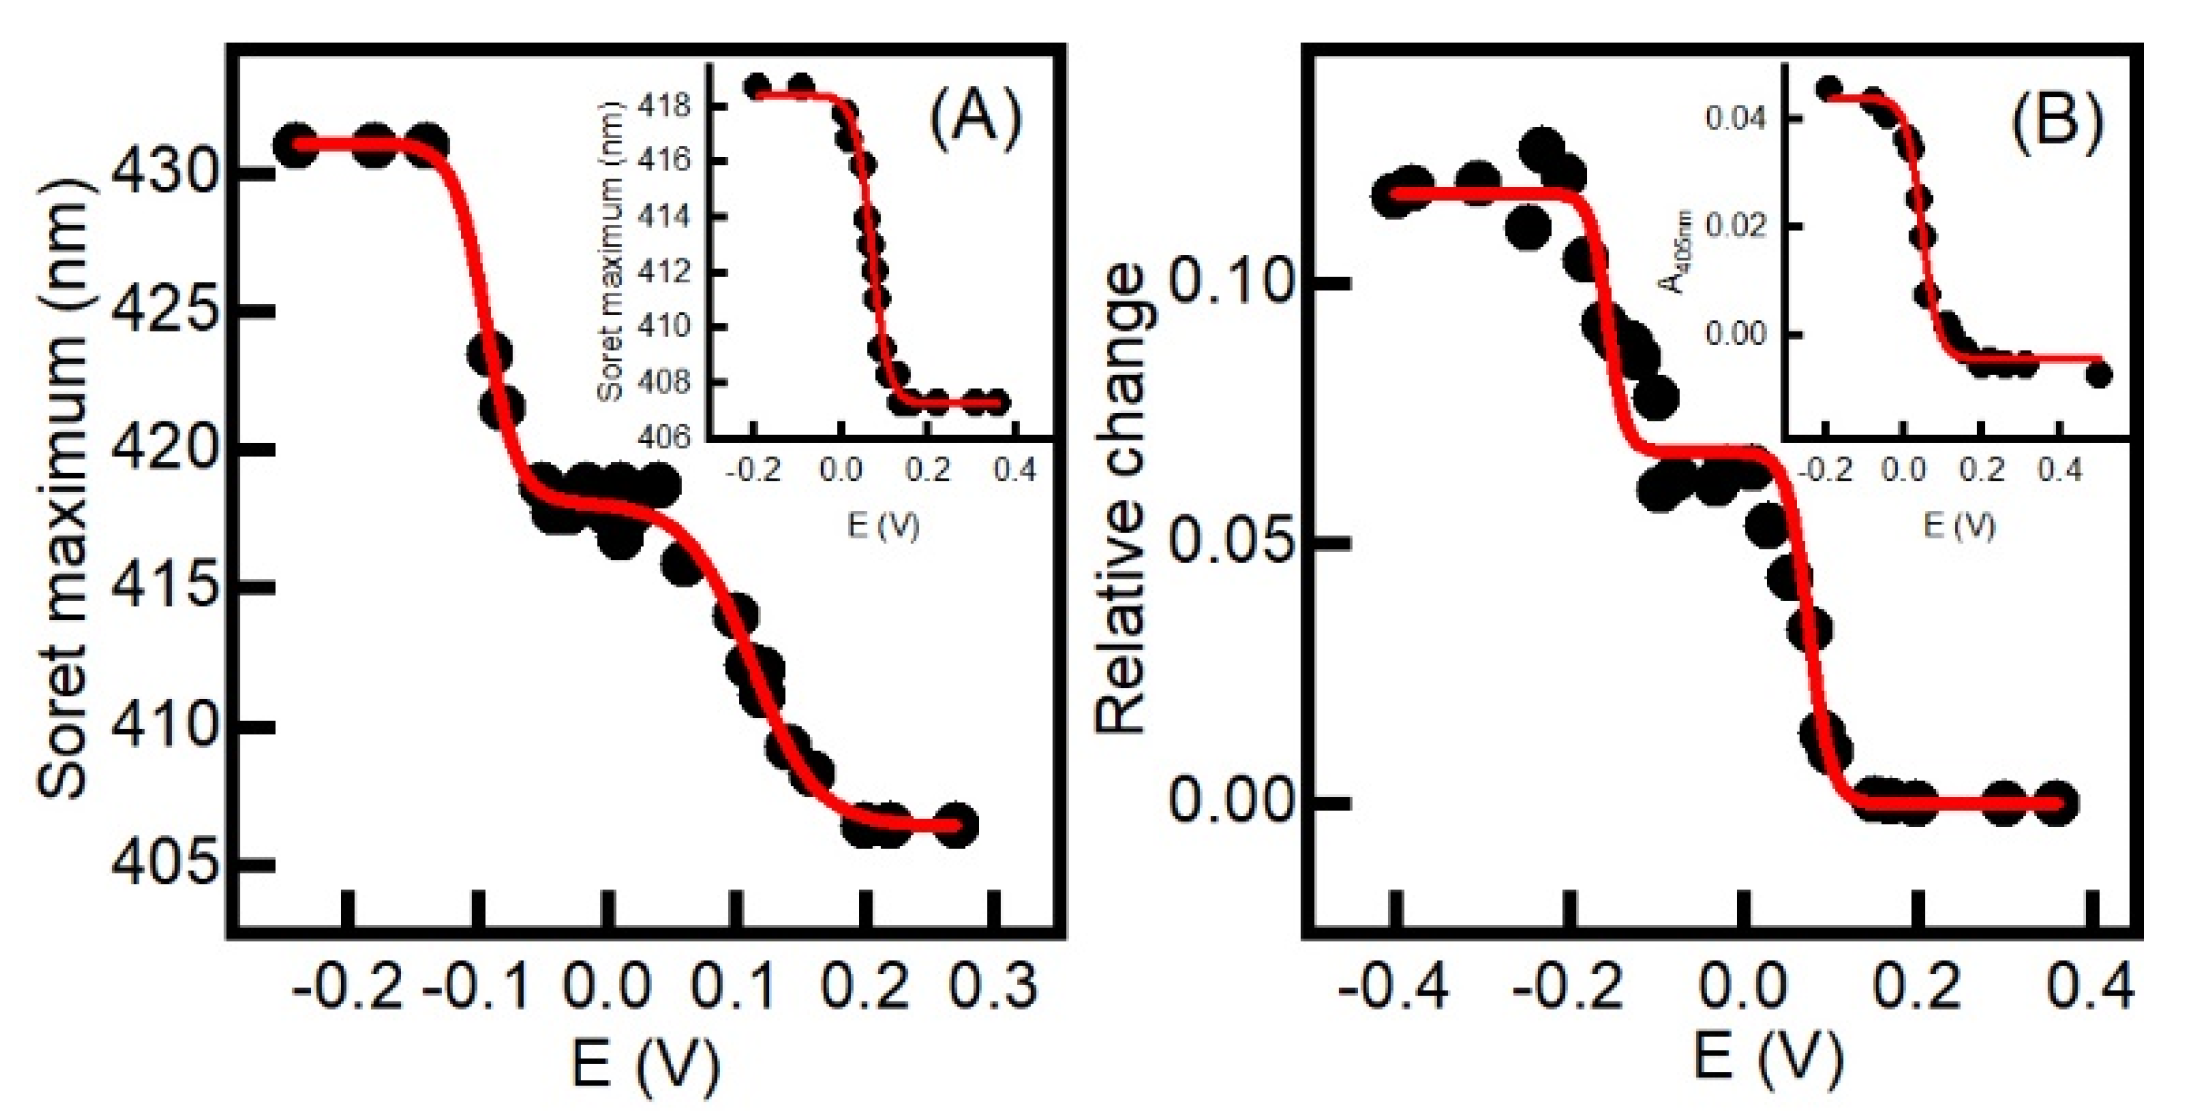
2.2. Aerobic versus Anaerobic Redox Titrations of BsDyP and PpDyP
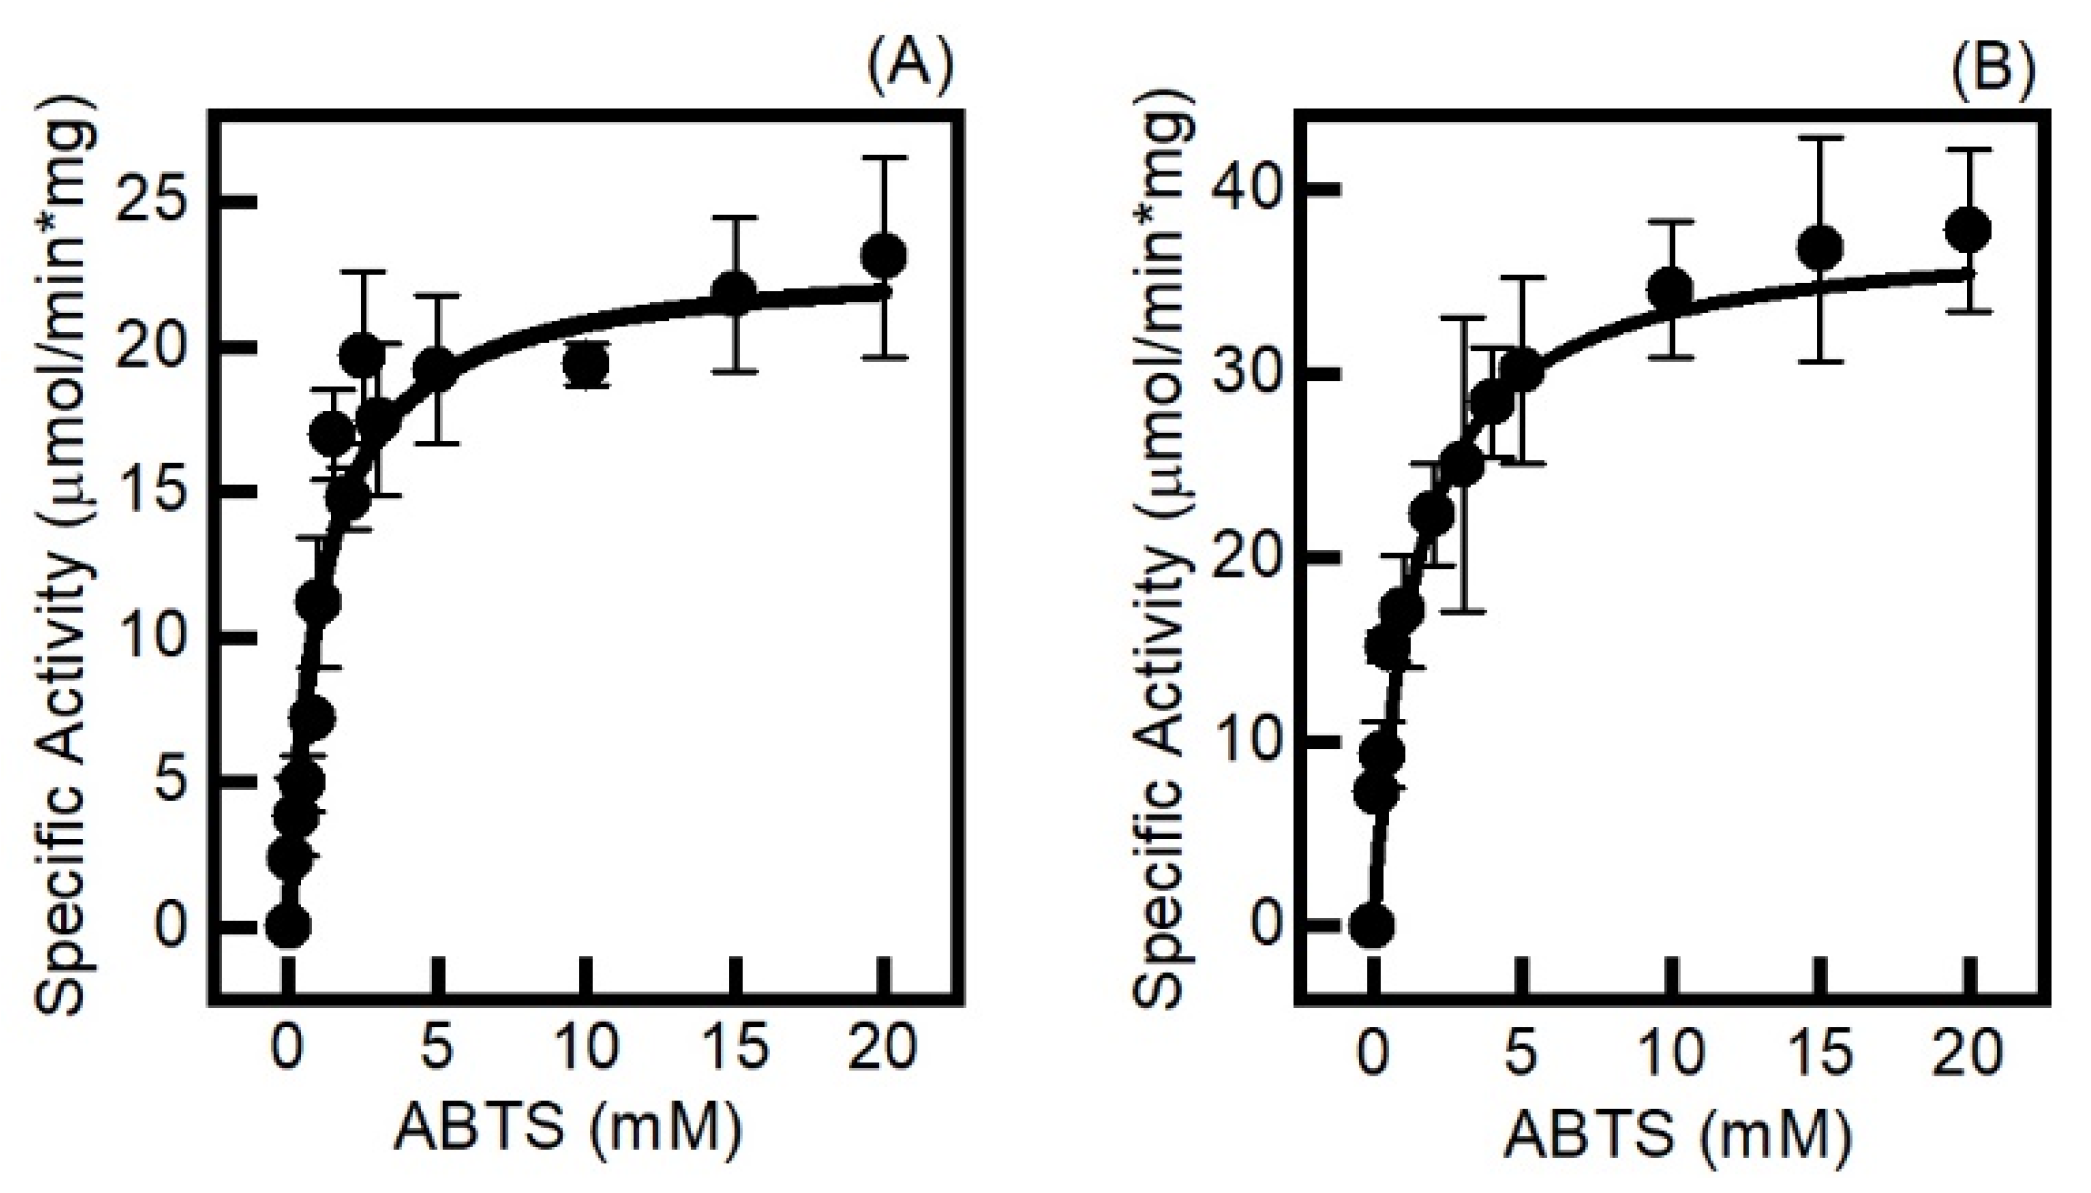
2.3. The Electrochemically Generated Oxyferryl Species Are Catalytic
3. Materials and Methods
3.1. Chemicals and Buffer Solutions
3.2. Construction, Overproduction and Purification of BsDyP and PpDyP
3.3. UV-Vis and Resonance Raman Experiments
3.4. Spectroelectrochemical Experiments
3.5. Steady State Kinetic Assays
3.6. Cyclic Voltammetry
4. Conclusions
Supplementary Materials
Author Contributions
Funding
Conflicts of Interest
References
- Sugano, Y.; Yoshida, T. DyP-Type Peroxidases: Recent Advances and Perspectives. Int. J. Mol. Sci. 2021, 22, 5556. [Google Scholar] [CrossRef]
- Colpa, D.I.; Fraaije, M.W.; van Bloois, E. DyP-Type Peroxidases: A Promising and Versatile Class of Enzymes. J. Ind. Microbiol. Biotechnol. 2014, 41, 1–7. [Google Scholar] [CrossRef] [Green Version]
- Catucci, G.; Valetti, F.; Sadeghi, S.J.; Gilardi, G. Biochemical Features of Dye-Decolorizing Peroxidases: Current Impact on Lignin Degradation. Biotechnol. Appl. Biochem. 2020, 67, 751–759. [Google Scholar] [CrossRef] [PubMed]
- Xu, L.; Sun, J.; Qaria, M.A.; Gao, L.; Zhu, D. Dye Decoloring Peroxidase Structure, Catalytic Properties and Applications: Current Advancement and Futurity. Catalysts 2021, 11, 955. [Google Scholar] [CrossRef]
- de Eugenio, L.I.; Peces-Pérez, R.; Linde, D.; Prieto, A.; Barriuso, J.; Ruiz-Dueñas, F.J.; Martínez, M.J. Characterization of a Dye-Decolorizing Peroxidase from Irpex Lacteus Expressed in Escherichia Coli: An Enzyme with Wide Substrate Specificity Able to Transform Lignosulfonates. J. Fungi 2021, 7, 325. [Google Scholar] [CrossRef] [PubMed]
- Sugano, Y.; Sasaki, K.; Shoda, M. CDNA Cloning and Genetic Analysis of a Novel Decolorizing Enzyme, Peroxidase Gene Dyp from Geotrichum Candidum Dec 1. J. Biosci. Bioeng. 1999, 87, 411–417. [Google Scholar] [CrossRef]
- Kim, S.J.; Shoda, M. Purification and Characterization of a Novel Peroxidase from Geotrichum Candidum Dec 1 Involved in Decolorization of Dyes. Appl. Environ. Microbiol. 1999, 65, 1029–1035. [Google Scholar] [CrossRef] [Green Version]
- Sugano, Y.; Muramatsu, R.; Ichiyanagi, A.; Sato, T.; Shoda, M. DyP, a Unique Dye-Decolorizing Peroxidase, Represents a Novel Heme Peroxidase Family: Asp171 replaces the distal histidine of classical peroxidases. J. Biol. Chem. 2007, 282, 36652–36658. [Google Scholar] [CrossRef] [Green Version]
- Raven, E.; Dunford, B. (Eds.) Heme Peroxidases; The Royal Society of Chemistry: London, UK, 2016. [Google Scholar] [CrossRef]
- Linde, D.; Ayuso-Fernández, I.; Laloux, M.; Aguiar-Cervera, J.E.; de Lacey, A.L.; Ruiz-Dueñas, F.J.; Martínez, A.T. Comparing Ligninolytic Capabilities of Bacterial and Fungal Dye-Decolorizing Peroxidases and Class-II Peroxidase-Catalases. Int. J. Mol. Sci. 2021, 22, 2629. [Google Scholar] [CrossRef]
- Zámocký, M.; Tafer, H.; Chovanová, K.; Lopandic, K.; Kamlárová, A.; Obinger, C. Genome Sequence of the Filamentous Soil Fungus Chaetomium Cochliodes Reveals Abundance of Genes for Heme Enzymes from All Peroxidase and Catalase Superfamilies. BMC Genom. 2016, 17, 763. [Google Scholar] [CrossRef] [Green Version]
- Santos, A.; Mendes, S.; Brissos, V.; Martins, L.O. New Dye-Decolorizing Peroxidases from Bacillus Subtilis and Pseudomonas Putida MET94: Towards Biotechnological Applications. Appl. Microbiol. Biotechnol. 2014, 98, 2053–2065. [Google Scholar] [CrossRef]
- Mendes, S.; Catarino, T.; Silveira, C.; Todorovic, S.; Martins, L.O. The Catalytic Mechanism of A-Type Dye-Decolourising Peroxidase BsDyP: Neither Aspartate nor Arginine Is Individually Essential for Peroxidase Activity. Catal. Sci. Technol. 2015, 5, 5196–5207. [Google Scholar] [CrossRef]
- Mendes, S.; Brissos, V.; Gabriel, A.; Catarino, T.; Turner, D.L.; Todorovic, S.; Martins, L.O. An Integrated View of Redox and Catalytic Properties of B-Type PpDyP from Pseudomonas Putida MET94 and Its Distal Variants. Arch. Biochem. Biophys. 2015, 574, 99–107. [Google Scholar] [CrossRef] [PubMed]
- Yoshida, T.; Sugano, Y. A Structural and Functional Perspective of DyP-Type Peroxidase Family. Arch. Biochem. Biophys. 2015, 574, 49–55. [Google Scholar] [CrossRef]
- Linde, D.; Ruiz-Dueñas, F.J.; Fernández-Fueyo, E.; Guallar, V.; Hammel, K.E.; Pogni, R.; Martínez, A.T. Basidiomycete DyPs: Genomic Diversity, Structural—Functional Aspects, Reaction Mechanism and Environmental Significance. Arch. Biochem. Biophys. 2015, 574, 66–74. [Google Scholar] [CrossRef] [PubMed] [Green Version]
- Salvachúa, D.; Prieto, A.; Martínez, Á.T.; Martínez, M.J. Characterization of a Novel Dye-Decolorizing Peroxidase (DyP)-Type Enzyme from Irpex Lacteus and Its Application in Enzymatic Hydrolysis of Wheat Straw. Appl. Environ. Microbiol. 2013, 79, 4316–4324. [Google Scholar] [CrossRef] [PubMed] [Green Version]
- Roberts, J.N.; Singh, R.; Grigg, J.C.; Murphy, M.E.P.; Bugg, T.D.H.; Eltis, L.D. Characterization of Dye-Decolorizing Peroxidases from Rhodococcus Jostii RHA1. Biochemistry 2011, 50, 5108–5119. [Google Scholar] [CrossRef] [PubMed]
- Chen, C.; Shrestha, R.; Jia, K.; Gao, P.F.; Geisbrecht, B.V.; Bossmann, S.H.; Shi, J.; Li, P. Characterization of Dye-Decolorizing Peroxidase (DyP) from Thermomonospora Curvata Reveals Unique Catalytic Properties of A-Type DyPs. J. Biol. Chem. 2015, 290, 23447–23463. [Google Scholar] [CrossRef] [PubMed] [Green Version]
- Shrestha, R.; Huang, G.; Meekins, D.A.; Geisbrecht, B.V.; Li, P. Mechanistic Insights into Dye-Decolorizing Peroxidase Revealed by Solvent Isotope and Viscosity Effects. ACS Catal. 2017, 7, 6352–6364. [Google Scholar] [CrossRef] [PubMed] [Green Version]
- Brissos, V.; Tavares, D.; Sousa, A.C.; Robalo, M.P.; Martins, L.O. Engineering a Bacterial DyP-Type Peroxidase for Enhanced Oxidation of Lignin-Related Phenolics at Alkaline PH. ACS Catal. 2017, 7, 3454–3465. [Google Scholar] [CrossRef]
- Jones, P. Roles of Water in Heme Peroxidase and Catalase Mechanisms. J. Biol. Chem. 2001, 276, 13791–13796. [Google Scholar] [CrossRef] [PubMed] [Green Version]
- Yoshida, T.; Tsuge, H.; Konno, H.; Hisabori, T.; Sugano, Y. The Catalytic Mechanism of Dye-Decolorizing Peroxidase DyP May Require the Swinging Movement of an Aspartic Acid Residue. FEBS J. 2011, 278, 2387–2394. [Google Scholar] [CrossRef]
- Strittmatter, E.; Liers, C.; Ullrich, R.; Wachter, S.; Hofrichter, M.; Plattner, D.A.; Piontek, K. First Crystal Structure of a Fungal High-Redox Potential Dye-Decolorizing Peroxidase: Substrate Interaction Sites and Long-Range Electron Transfer. J. Biol. Chem. 2013, 288, 4095–4102. [Google Scholar] [CrossRef] [Green Version]
- Acebes, S.; Ruiz-Dueñas, F.J.; Toubes, M.; Sáez-Jiménez, V.; Pérez-Boada, M.; Lucas, M.F.; Martínez, A.T.; Guallar, V. Mapping the Long-Range Electron Transfer Route in Ligninolytic Peroxidases. J. Phys. Chem. B 2017, 121, 3946–3954. [Google Scholar] [CrossRef] [PubMed]
- Miki, Y.; Pogni, R.; Acebes, S.; Lucas, F.; Fernández-Fueyo, E.; Baratto, M.C.; Fernández, M.I.; de los Ríos, V.; Ruiz-Dueñas, F.J.; Sinicropi, A.; et al. Formation of a Tyrosine Adduct Involved in Lignin Degradation by Trametopsis Cervina Lignin Peroxidase: A Novel Peroxidase Activation Mechanism. Biochem. J. 2013, 452, 575–584. [Google Scholar] [CrossRef] [PubMed] [Green Version]
- Strittmatter, E.; Wachter, S.; Liers, C.; Ullrich, R.; Hofrichter, M.; Plattner, D.A.; Piontek, K. Radical Formation on a Conserved Tyrosine Residue Is Crucial for DyP Activity. Arch. Biochem. Biophys. 2013, 537, 161–167. [Google Scholar] [CrossRef]
- Li, L.; Wang, T.; Chen, T.; Huang, W.; Zhang, Y.; Jia, R.; He, C. Revealing Two Important Tryptophan Residues with Completely Different Roles in a Dye-Decolorizing Peroxidase from Irpex Lacteus F17. Biotechnol. Biofuels 2021, 14, 128. [Google Scholar] [CrossRef]
- Shrestha, R.; Chen, X.; Ramyar, K.X.; Hayati, Z.; Carlson, E.A.; Bossmann, S.H.; Song, L.; Geisbrecht, B.V.; Li, P. Identification of Surface-Exposed Protein Radicals and A Substrate Oxidation Site in A-Class Dye-Decolorizing Peroxidase from Thermomonospora Curvata. ACS Catal. 2016, 6, 8036–8047. [Google Scholar] [CrossRef] [PubMed] [Green Version]
- Rai, A.; Klare, J.P.; Reinke, P.Y.A.; Englmaier, F.; Fohrer, J.; Fedorov, R.; Taft, M.H.; Chizhov, I.; Curth, U.; Plettenburg, O.; et al. Structural and Biochemical Characterization of a Dye-Decolorizing Peroxidase from Dictyostelium Discoideum. Int. J. Mol. Sci. 2021, 22, 6265. [Google Scholar] [CrossRef] [PubMed]
- Silveira, C.M.; Moe, E.; Fraaije, M.; Martins, L.O.; Todorovic, S. Resonance Raman View of the Active Site Architecture in Bacterial DyP-Type Peroxidases. RSC Adv. 2020, 10, 11095–11104. [Google Scholar] [CrossRef]
- Smulevich, G. Understanding Heme Cavity Structure of Peroxidases: Comparison of Electronic Absorption and Resonance Raman Spectra with Crystallographic Results. Biospectroscopy 1998, 4, S3–S17. [Google Scholar] [CrossRef]
- Howes, B.D.; Schiødt, C.B.; Welinder, K.G.; Marzocchi, M.P.; Ma, J.-G.; Zhang, J.; Shelnutt, J.A.; Smulevich, G. The Quantum Mixed-Spin Heme State of Barley Peroxidase:A Paradigm for Class III Peroxidases. Biophys. J. 1999, 77, 478–492. [Google Scholar] [CrossRef] [Green Version]
- Pfanzagl, V.; Bellei, M.; Hofbauer, S.; Laurent, C.V.F.P.; Furtmüller, P.G.; Oostenbrink, C.; Battistuzzi, G.; Obinger, C. Redox Thermodynamics of B-Class Dye-Decolorizing Peroxidases. J. Inorg. Biochem. 2019, 199, 110761. [Google Scholar] [CrossRef] [PubMed]
- Ferapontova, E.E.; Reading, N.S.; Aust, S.D.; Ruzgas, T.; Gorton, L. Direct Electron Transfer Between Graphite Electrodes and Ligninolytic Peroxidases from Phanerochaete Chrysosporium. Electroanalysis 2002, 14, 1411–1418. [Google Scholar] [CrossRef]
- Ivancich, A.; Mattioli, T.A.; Un, S. Effect of Protein Microenvironment on Tyrosyl Radicals. A High-Field (285 GHz) EPR, Resonance Raman, and Hybrid Density Functional Study. J. Am. Chem. Soc. 1999, 121, 5743–5753. [Google Scholar] [CrossRef]
- Tripathi, G.N.R.; Schuler, R.H. Resonance Raman Studies of Substituent Effects on the Electronic Structure of Phenoxyl Radicals. J. Phys. Chem. 1988, 92, 5129–5133. [Google Scholar] [CrossRef]
- Chuang, W.J.; Van Wart, H.E. Resonance Raman Spectra of Horseradish Peroxidase and Bovine Liver Catalase Compound I Species. Evidence for Predominant 2A2u Pi-Cation Radical Ground State Configurations. J. Biol. Chem. 1992, 267, 13293–13301. [Google Scholar] [CrossRef]
- Hewson, W.D.; Hager, L.P. Oxidation of Horseradish Peroxidase Compound II to Compound I. J. Biol. Chem. 1979, 254, 3182–3186. [Google Scholar] [CrossRef]
- Shimizu, N.; Kobayashi, K.; Hayashi, K. Kinetics of the Reaction of Superoxide Anion with Ferric Horseradish Peroxidase. Biochim. Biophys. Acta (BBA) Protein Struct. Mol. Enzymol. 1989, 995, 133–137. [Google Scholar] [CrossRef]
- Girvan, H.M.; Munro, A.W. Applications of Microbial Cytochrome P450 Enzymes in Biotechnology and Synthetic Biology. Curr. Opin. Chem. Biol. 2016, 31, 136–145. [Google Scholar] [CrossRef] [PubMed]
- Janik, I.; Tripathi, G.N.R. The Nature of the Superoxide Radical Anion in Water. J. Chem. Phys. 2013, 139, 014302. [Google Scholar] [CrossRef]
- Sezer, M.; Santos, A.; Kielb, P.; Pinto, T.; Martins, L.O.; Todorovic, S. Distinct Structural and Redox Properties of the Heme Active Site in Bacterial Dye Decolorizing Peroxidase-Type Peroxidases from Two Subfamilies: Resonance Raman and Electrochemical Study. Biochemistry 2013, 52, 3074–3084. [Google Scholar] [CrossRef] [PubMed]
- Rodrigues, C.F.; Borges, P.T.; Scocozza, M.F.; Silva, D.; Taborda, A.; Brissos, V.; Frazão, C.; Martins, L.O. Loops around the Heme Pocket Have a Critical Role in the Function and Stability of BsDyP from Bacillus Subtilis. Int. J. Mol. Sci. 2021, 22, 10862. [Google Scholar] [CrossRef] [PubMed]
- Camarero, S.; Sarkar, S.; Ruiz-Dueñas, F.J.; Martínez, M.J.; Martínez, Á.T. Description of a Versatile Peroxidase Involved in the Natural Degradation of Lignin That Has Both Manganese Peroxidase and Lignin Peroxidase Substrate Interaction Sites. J. Biol. Chem. 1999, 274, 10324–10330. [Google Scholar] [CrossRef] [PubMed] [Green Version]
- Veitch, N.C.; Tams, J.W.; Vind, J.; Dalbøge, H.; Welinder, K.G. NMR Studies of Recombinant Coprinus Peroxidase and Three Site-Directed Mutants. Eur. J. Biochem. 1994, 222, 909–918. [Google Scholar] [CrossRef]
- Doyle, W.A.; Blodig, W.; Veitch, N.C.; Piontek, K.; Smith, A.T. Two Substrate Interaction Sites in Lignin Peroxidase Revealed by Site-Directed Mutagenesis. Biochemistry 1998, 37, 15097–15105. [Google Scholar] [CrossRef]
- Dhankhar, P.; Dalal, V.; Mahto, J.K.; Gurjar, B.R.; Tomar, S.; Sharma, A.K.; Kumar, P. Characterization of Dye-Decolorizing Peroxidase from Bacillus Subtilis. Arch. Biochem. Biophys. 2020, 693, 108590. [Google Scholar] [CrossRef]
- Berry, E.A.; Trumpower, B.L. Simultaneous Determination of Hemes a, b, and c from Pyridine Hemochrome Spectra. Anal. Biochem. 1987, 161, 1–15. [Google Scholar] [CrossRef]
- Döpner, S.; Hildebrandt, P.; Rosell, F.I.; Mauk, A.G. Alkaline Conformational Transitions of Ferricytochrome c Studied by Resonance Raman Spectroscopy. J. Am. Chem. Soc. 1998, 120, 11246–11255. [Google Scholar] [CrossRef]
- Ray, K.; McCreery, R.L. Spatially Resolved Raman Spectroscopy of Carbon Electrode Surfaces: Observations of Structural and Chemical Heterogeneity. Anal. Chem. 1997, 69, 4680–4687. [Google Scholar] [CrossRef]
- Paeng, K.J.; Kincaid, J.R. The Resonance Raman Spectrum of Horseradish Peroxidase Compound I. J. Am. Chem. Soc. 1988, 110, 7913–7915. [Google Scholar] [CrossRef]


| Enzyme | Mode | Resting State | Compound I | Compound II | Δνox |
|---|---|---|---|---|---|
| BsDyP | ν4 | 1373 | 1373 | 1377 | −4 |
| ν28 | 1428 | 1428 | 1430 | −2 | |
| ν3 | 1505 | 1505 | 1510 | −5 | |
| ν19 | - | 1554 | 1553 | +1 | |
| ν2 | 1561 | 1563 | 1564 | −1 | |
| ν37 | 1579 | 1580 | 1582 | −2 | |
| ν10 | - | 1600 | 1602 | −2 | |
| 1621 | 1619 | 1621 | −2 | ||
| νC=C | 1634 | 1636 | 1640 | −4 | |
| UV-vis bands | |||||
| 406, 505, 540, 632 | 406, 524, 565 | 418, 528, 556 | |||
| PpDyP | ν4 | 1372 | 1374 | 1375 | −1 |
| ν28 | 1428 | 1426 | 1430 | −4 | |
| ν3 | 1503 | 1506 | 1508 | −2 | |
| ν19 | 1557 | 1557 | 1553 | +3 | |
| ν2 | 1567 | 1565 | 1567 | −2 | |
| ν37 | 1581 | 1580 | 1581 | −1 | |
| ν10 | 1621 | 1620 | 1621 | −1 | |
| νC=C | 1631 | 1631 | 1637 | −6 | |
| UV-vis bands | |||||
| 405, 506, 632 | 405, 530, 562, 644 | 419, 528, 557 |
| pH | kcat (s−1) | KM (mM) | kcat/KM (s−1 M−1) | ||
|---|---|---|---|---|---|
| BsDyP | 1 H2O2 | 3.7 | 15 ± 1 | 0.420 ± 0.030 | 3.6 × 10⁴ |
| Electrochemical | 3.7 | 13 ± 1 | 0.141 ± 0.040 | 9.2 × 10⁴ | |
| 7.6 | 18 ± 1 | 1.155 ± 0.100 | 1.6 × 10⁴ | ||
| 8.5 | 1.1 ± 0.1 | 2.334 ± 0.060 | 4.7 × 10² | ||
| PpDyP | 2 H2O2 | 4 | 17 ± 1 | 1.349 ± 0.115 | 1.3 × 10⁴ |
| Electrochemical | 3.7 | 4.2 ± 0.4 | 0.094 ± 0.016 | 4.5 × 10⁴ | |
| 7.6 | 19 ± 2 | 1.343 ± 0.190 | 1.4 × 10⁴ | ||
| 8.5 | 3.2 ± 0.2 | 0.070 ± 0.010 | 4.6 × 10⁴ |
Publisher’s Note: MDPI stays neutral with regard to jurisdictional claims in published maps and institutional affiliations. |
© 2021 by the authors. Licensee MDPI, Basel, Switzerland. This article is an open access article distributed under the terms and conditions of the Creative Commons Attribution (CC BY) license (https://creativecommons.org/licenses/by/4.0/).
Share and Cite
Scocozza, M.F.; Martins, L.O.; Murgida, D.H. Direct Electrochemical Generation of Catalytically Competent Oxyferryl Species of Classes I and P Dye Decolorizing Peroxidases. Int. J. Mol. Sci. 2021, 22, 12532. https://doi.org/10.3390/ijms222212532
Scocozza MF, Martins LO, Murgida DH. Direct Electrochemical Generation of Catalytically Competent Oxyferryl Species of Classes I and P Dye Decolorizing Peroxidases. International Journal of Molecular Sciences. 2021; 22(22):12532. https://doi.org/10.3390/ijms222212532
Chicago/Turabian StyleScocozza, Magalí F., Lígia O. Martins, and Daniel H. Murgida. 2021. "Direct Electrochemical Generation of Catalytically Competent Oxyferryl Species of Classes I and P Dye Decolorizing Peroxidases" International Journal of Molecular Sciences 22, no. 22: 12532. https://doi.org/10.3390/ijms222212532
APA StyleScocozza, M. F., Martins, L. O., & Murgida, D. H. (2021). Direct Electrochemical Generation of Catalytically Competent Oxyferryl Species of Classes I and P Dye Decolorizing Peroxidases. International Journal of Molecular Sciences, 22(22), 12532. https://doi.org/10.3390/ijms222212532