1. Introduction
Hepatocellular carcinoma (HCC) is one of the most common malignant tumors worldwide, with more than 800,000 new cases and deaths each year [
1]. The incidence and mortality rates of HCC are the fourth and third highest, respectively, in China, and the proportion of HCC patients in China is more than 50% [
2]. Although the occurrence and development of HCC have been intensively studied in recent years, the precise molecular mechanisms underlying the occurrence of HCC remain unclear. At present, tumor treatments mainly consist of surgery, chemoradiotherapy, immunotherapy, and small molecule compounds [
3]. Recent studies have shown that certain amino acids play an important role in the occurrence and development of tumors. These studies have included detection of potential tumor biomarkers [
4,
5], amino acid derivatives for the treatment of tumors [
6,
7], elucidation of tumor mechanisms [
8,
9], and targeted therapy for tumors [
10,
11].
In 2011, the reprogramming of the energy metabolism of tumor cells included in the top-10 characteristics of tumor cells summarized by Hanahan and Weinberg has become a new focus of tumor research. The energy of rapidly growing tumor cells is mainly derived from glycolysis, which is known as the Warburg effect [
12], confirming that amino-acid-based energy metabolism plays an important role in tumor research. The metabolism of some amino acids (i.e., glycine, arginine, and glutamine) provides raw materials for the synthesis of nucleic acids [
13,
14]. Previous studies on tumor metabolism have shown that tumor metabolic reprogramming can enable tumor cells to maintain selective growth advantages under adverse living conditions [
15]. In addition, amino acids also provide the nutritional and biosynthetic bases for immune responses of immune cells and the anabolism of reactive enzymes. Therefore, amino acids can affect tumor growth through their effects on the tumor immune microenvironment [
16]. Recent studies have confirmed that a variety of amino acids can directly or indirectly influence the tumor immune microenvironment; hence, modulating the metabolism of tumors via amino acid therapy provides a new direction for tumor-targeted therapies [
17].
Tryptophan, first extracted from casein by Hokinst in 1902, is one of the eight essential amino acids that cannot be synthesized in the human body. It is an indispensable component of proteins and plays an important role in maintaining the physiological activities of plants and animals [
18]. Tryptophan metabolism is involved in the regulation of immunity, neuronal function, and intestinal homeostasis. In addition to being used for protein synthesis, tryptophan can be broken down by tryptophan hydroxylase (TPH), which is used for the synthesis of 5-hydroxytryptophan (5-HT) and melatonin [
19]. Studies have shown that tryptophan metabolism contributes to aging and neurodegeneration by similar mechanisms [
20,
21]. There are two main tryptophan metabolic pathways: (1) the 5-HT pathway, catalyzed by tryptophan hydroxylase; and (2) the kynurenine pathway. More than 90% of tryptophan is metabolized by the kynurenine pathway [
22]. The catabolic pathway of tryptophan in mammals is divided into three steps. Tryptophan is first metabolized to kynurenine and is then metabolized to quinoline, after which it finally undergoes complete oxidative decomposition to produce ATP and CO
2 [
23]. The kynurenine pathway metabolizes various enzymes including indoleamine 2,3-dioxygenase1 (IDO1), indoleamine 2,3-dioxygenase2 (IDO2), and tryptophan-2,3-dioxygenase (TDO2). The enhanced activities of these enzymes can make tryptophan overproduce kynurenine, resulting in tryptophan deficiency and the production of large amounts of kynurenine, thus inhibiting the immune system [
24]. Moreover, kynurenine is an endogenous ligand that promotes tumor proliferation; it can bind to and activate aryl hydrocarbon receptor (AHR) to exert biological effects, both of which contribute to the occurrence and development of tumors [
25]. AHR is a ligand-activated transcription factor that plays a powerful role in immune cells [
26].
As the basis of other forms of metabolism (including those of other amino acids), enzymes have become the focus of metabolomics research. In addition to glycolysis, amino acid metabolism, and lipid metabolism, as well as their participation in the reactions of these metabolic pathways, enzymes have gradually attracted more attention and become key targets for the development of cancer treatment [
27]. In 1977, Joseph Roberts discovered and isolated a novel enzyme that oxidizes alpha carbon in the indole ring at site 3. Further studies showed that this enzyme can degrade tryptophan and oxidize the side chain of tryptophan to keto-tryptophan [
28]. Roberts et al. [
29] described the L-tryptophan degradation enzyme, indole-3-acyl alkane-hydroxylase, and named it as L-tryptophan side-chain oxidase. It was later found that TSO is composed of two kinds of isozymes, namely TSO I and TSO II. TSO I is approximately 60 kDa, whereas TSO II is approximately 44 kDa. The third isolated TSO was isolated by Schmer et al. and was named as TSO III, with a molecular weight of 42 kDa [
30].
The development of antitumor drugs targeting tryptophan metabolism has been primarily based on the tumor-promoting functions of IDO1 and TDO to develop small-molecule inhibitors of these enzymes for cancer treatments [
31,
32,
33,
34]. However, there are currently no known effective enzymes that can directly degrade tryptophan to inhibit tumors. Although Joseph and his team found that TSO degrades tryptophan, they did not study TSO in depth, investigate its anticancer function at the cellular level, or evaluate its efficacy after tumor-forming experiments.
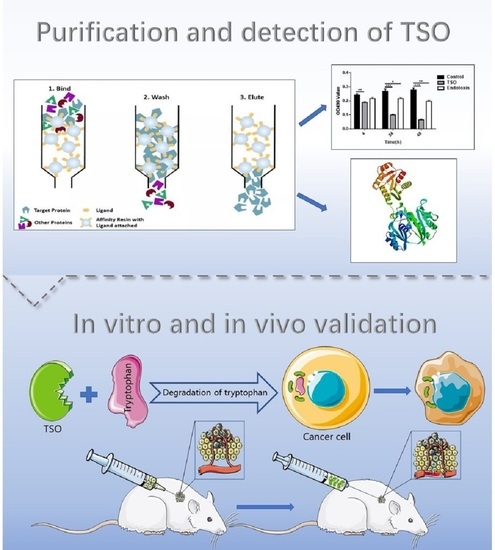
In the present study, TSO produced by Pseudomonas fermentation technology was used as a tumor treatment, and we found that it successfully inhibited the growth of tumor cells and further verified this effect in vivo. In addition, HPLC-MS was used to verify that TSO degraded tryptophan in tumor cells and prevented tryptophan from being metabolized in accordance with the canine urine pathway, thus partially inhibiting the proliferation and growth of tumor cells. Finally, we sequenced the amino acids of TSO, laying a foundation for future investigations of its targets and its development as an anticancer drug.
3. Discussion
Restricting the intake of certain essential amino acids can cause tumor nutrient deficiency, thus restricting tumor growth or even starving tumors while maintaining the normal nutritional requirements of the body. Therefore, regulating amino acid metabolism in the body may represent a new strategy for anticancer treatments [
35,
36]. Tryptophan metabolism plays an important role in cancer, which can promote tumor progression by inhibiting anti-tumor immune responses and increasing the malignant properties of cancer cells.
In the present study, we found that TSO can degrade tryptophan. In order to study its degradative activity, we isolated and purified high-purity TSO from Pseudomonas species. Unlike previous methods [
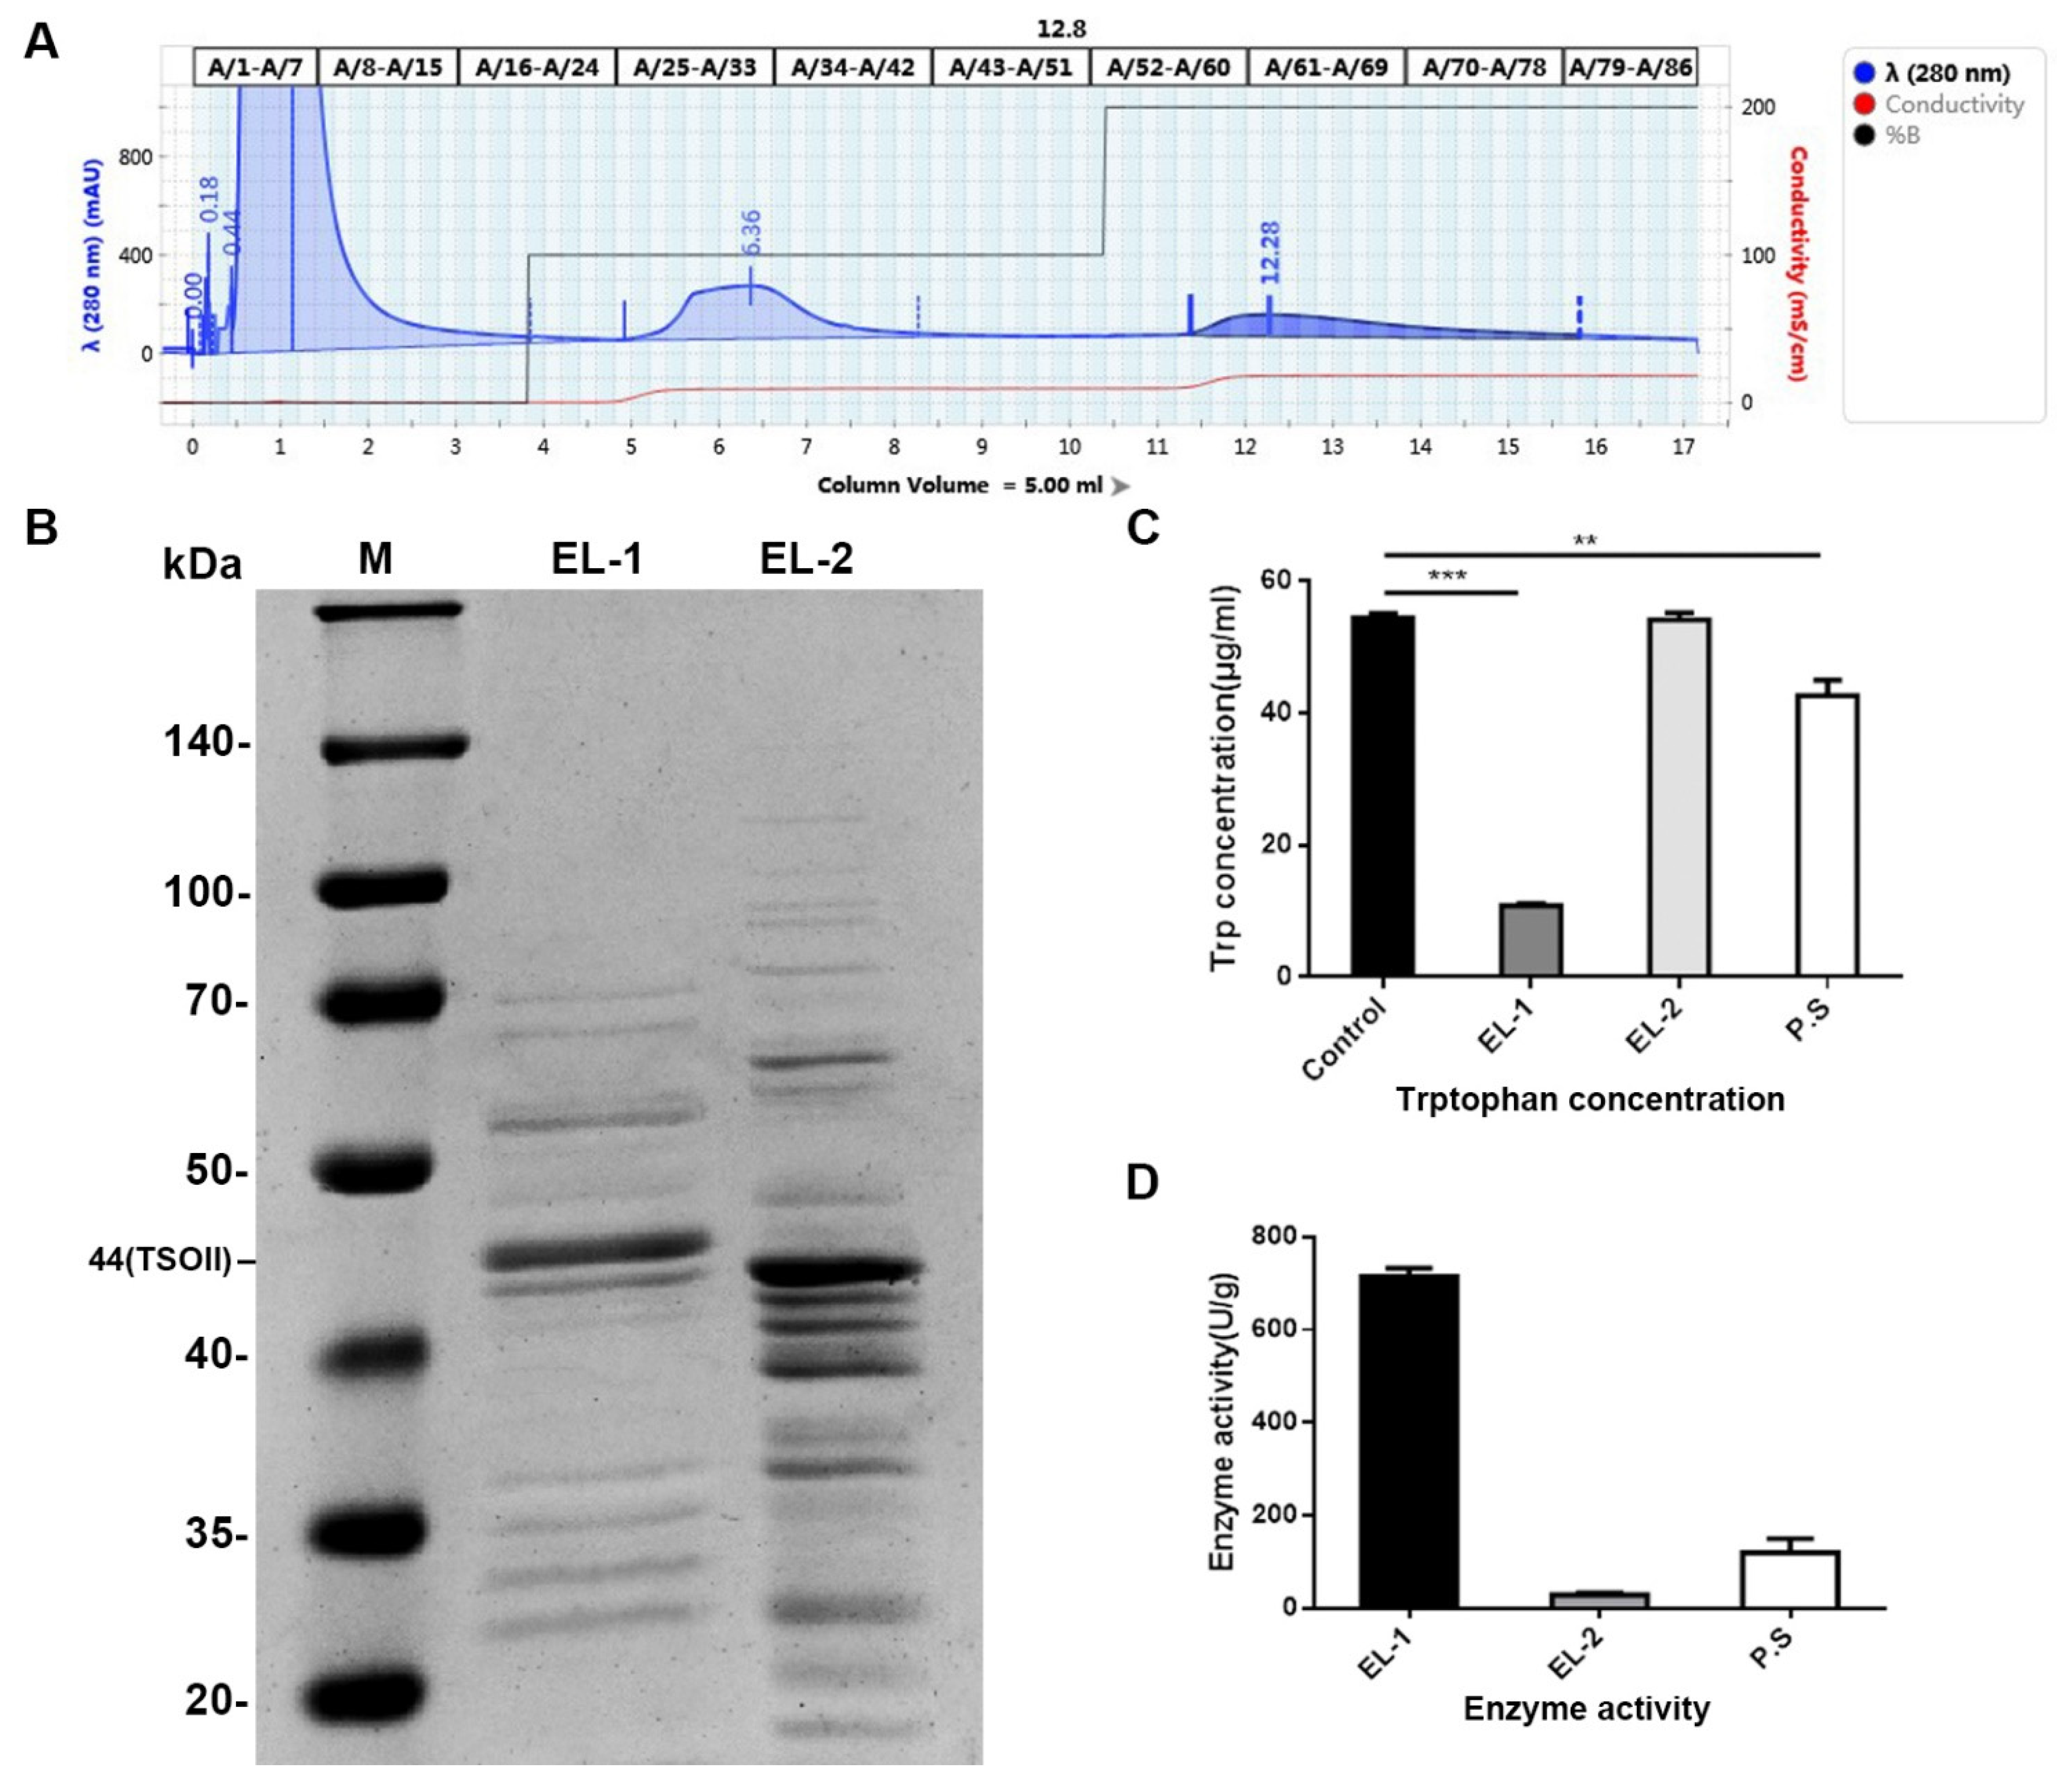
29], we selected 0.05 M and 0.2 M sodium acetate buffer for gradient elution, because we found that many TSO proteins were absent in the 0.1 M buffer as described previously. Additionally, our results showed that this gradient elution was more efficient than the 0.1 M buffer, with a purification efficiency of 78%. In order to study the effect of TSO and impurities on the activity, we added the activity of total protein and its degradation ability of tryptophan into the experiment to compare. It was found that under the premise of the same total amount, the higher the purity of TSO was, the stronger its activity was. As shown in
Figure 1 of the manuscript, EL-1 had the highest content of TSO and the strongest enzyme activity. Furthermore, we obtained a more concentrated and more active yield of TSO than that found previously using the 0.1 M buffer. We then tested the degradative activity of TSO and verified that it completely degraded tryptophan at 5 μg/mL within 1 h. Therefore, it can be concluded that TSO is an effective component for tryptophan degradation in purified products.
As 95% of tryptophan in human cells is metabolized in accordance with the kynurenine metabolic pathway, HPLC-MS was used to verify that the product produced by tryptophan after TSO metabolism was not kynurenine. In addition, to further verify that TSO had a stronger degradative effect on tryptophan in cells than that of TDO2, HCCLM3 cells were divided into groups and then the contents of tryptophan and kynurenine in each group were detected. We found that tryptophan was completely degraded in the TSO group and in the TDO2 inhibitor combined with TSO group, with almost no kynurenine production. This suggests that TSO was sufficient to metabolize tryptophan in the medium without inhibition of TDO. This result was likely due to the amount of tryptophan in the TSO group being nearly the same as that in the TDO inhibitor group. After verifying that there was no interference of the kynurenine pathway in cells, we confirmed that TSO had a specific and efficient degradative effect on tryptophan. We also found that the combination of a TDO2 inhibitor and TSO completely degraded tryptophan and blocked the metabolism of kynurenine in the body. In subsequent studies, we will investigate the effects of the combination TSO and a TDO2 inhibitor on cancer treatments [
37].
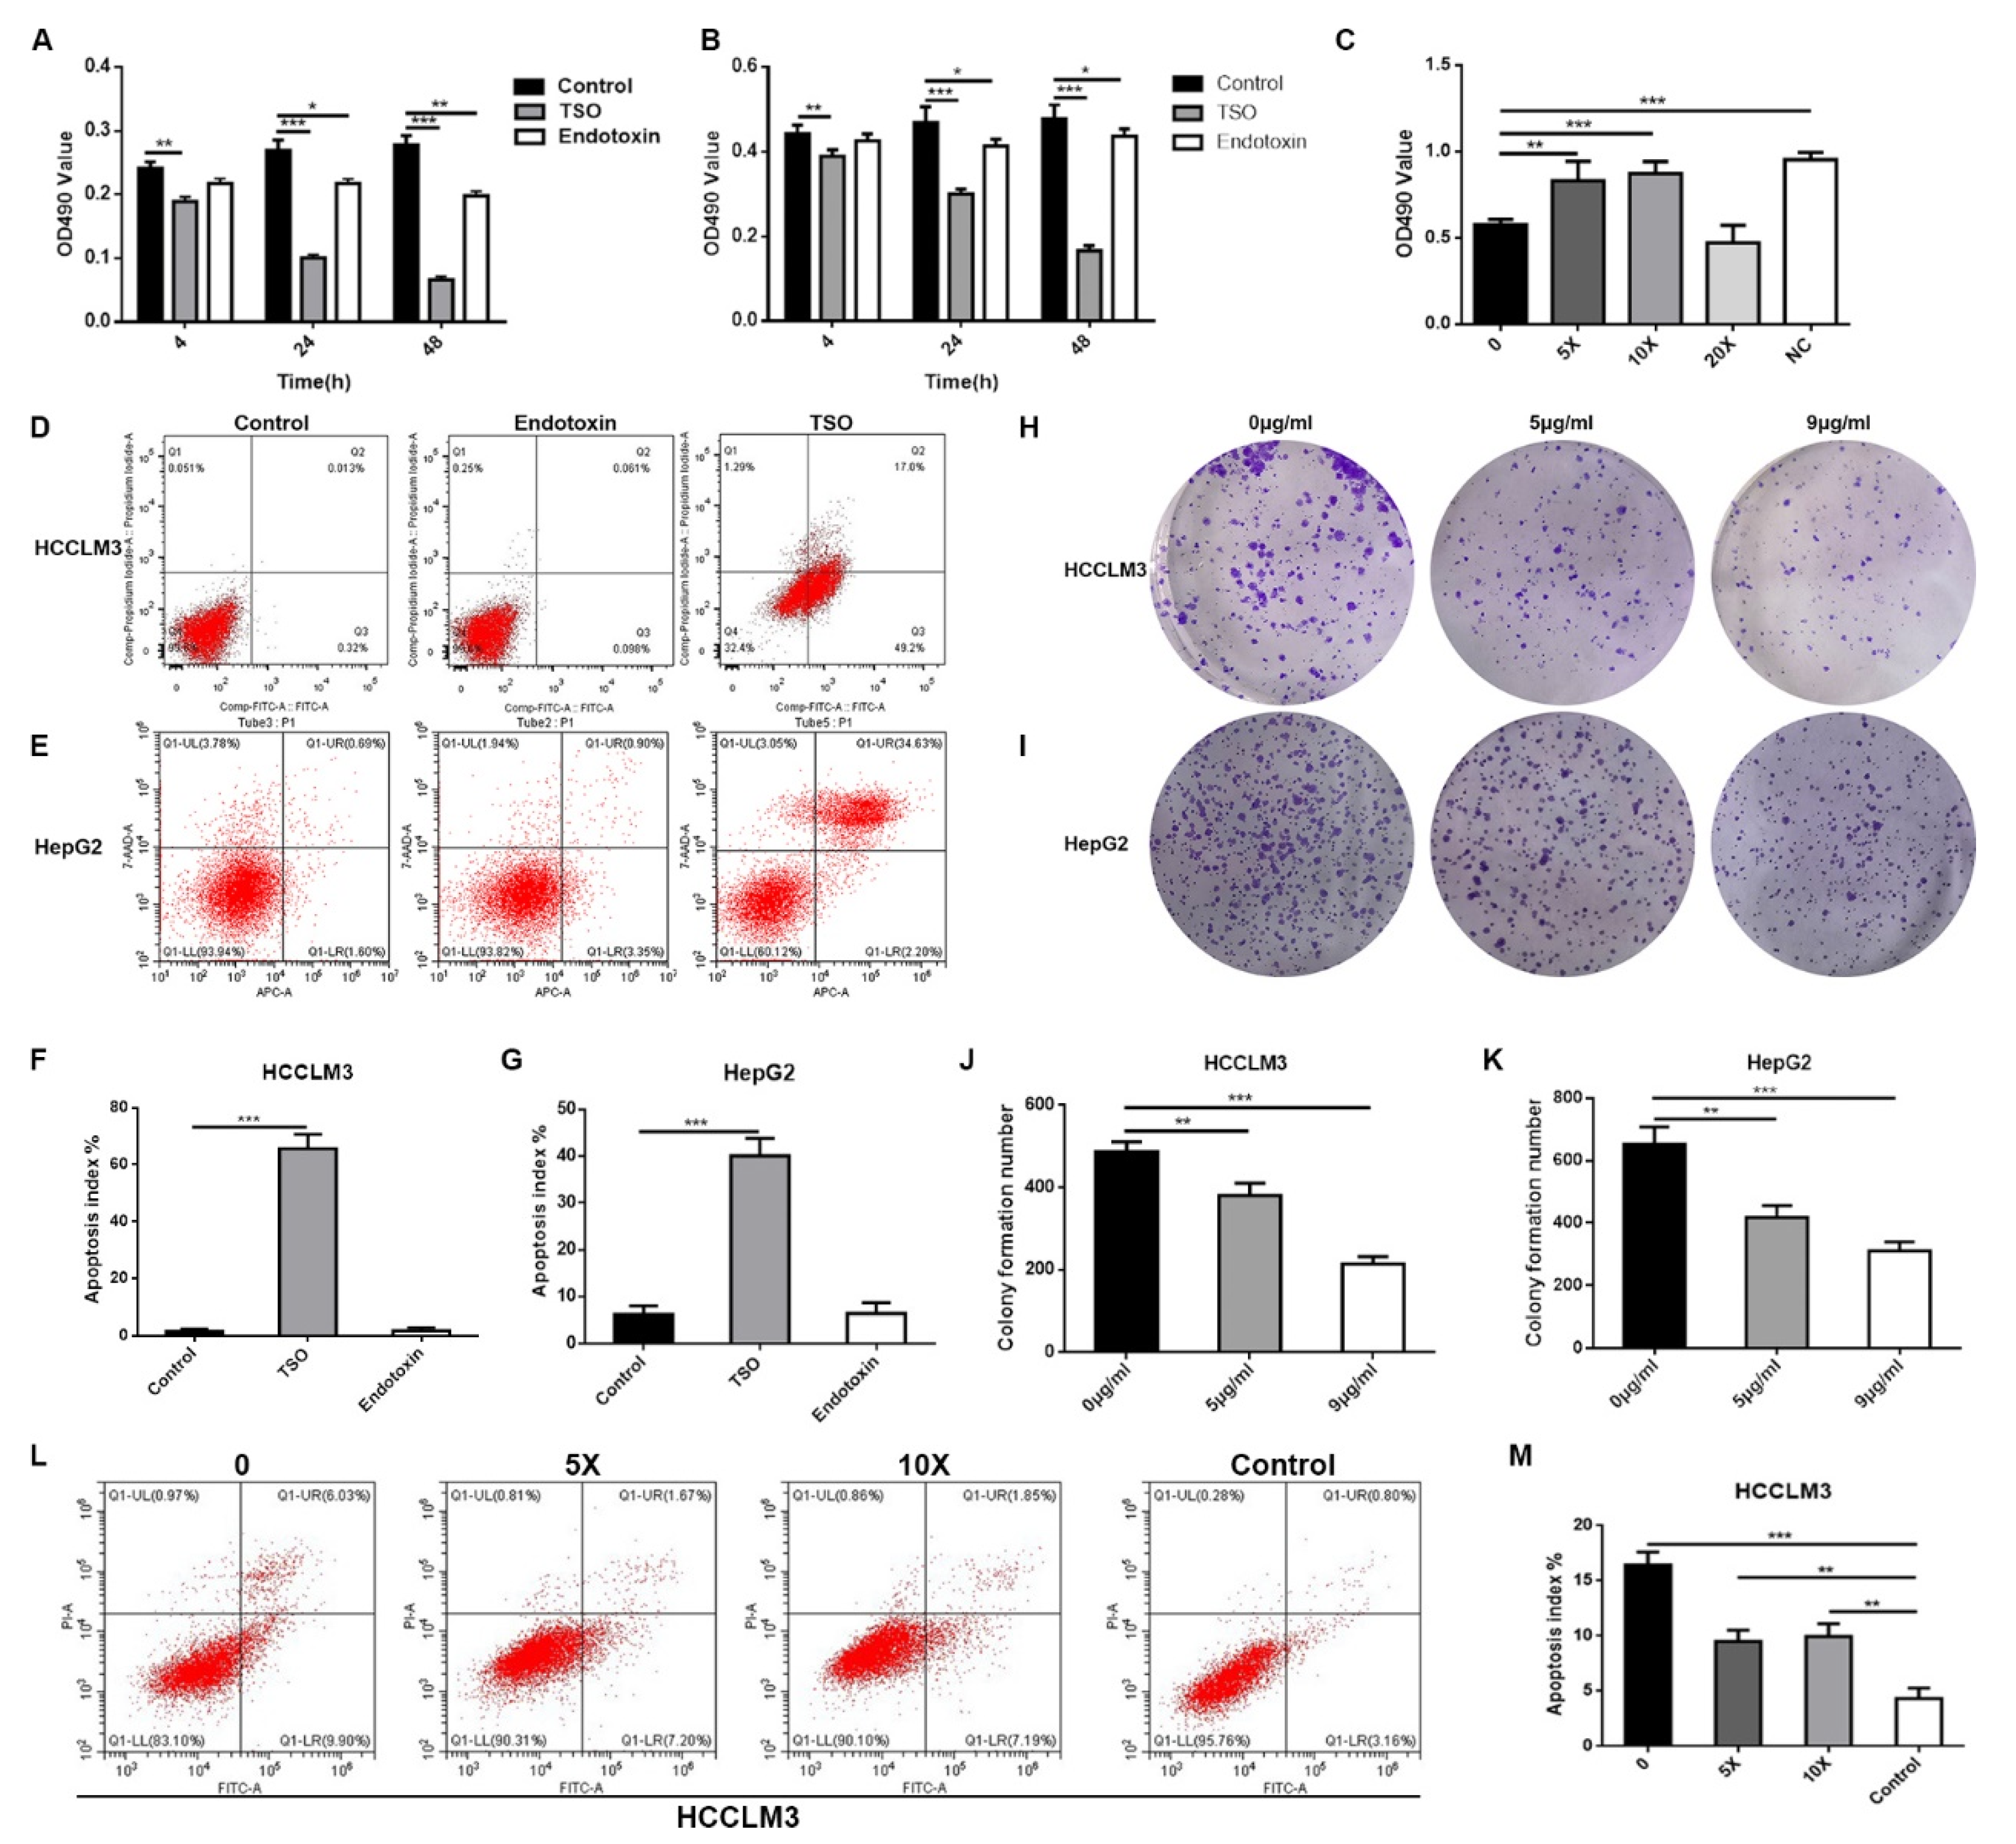
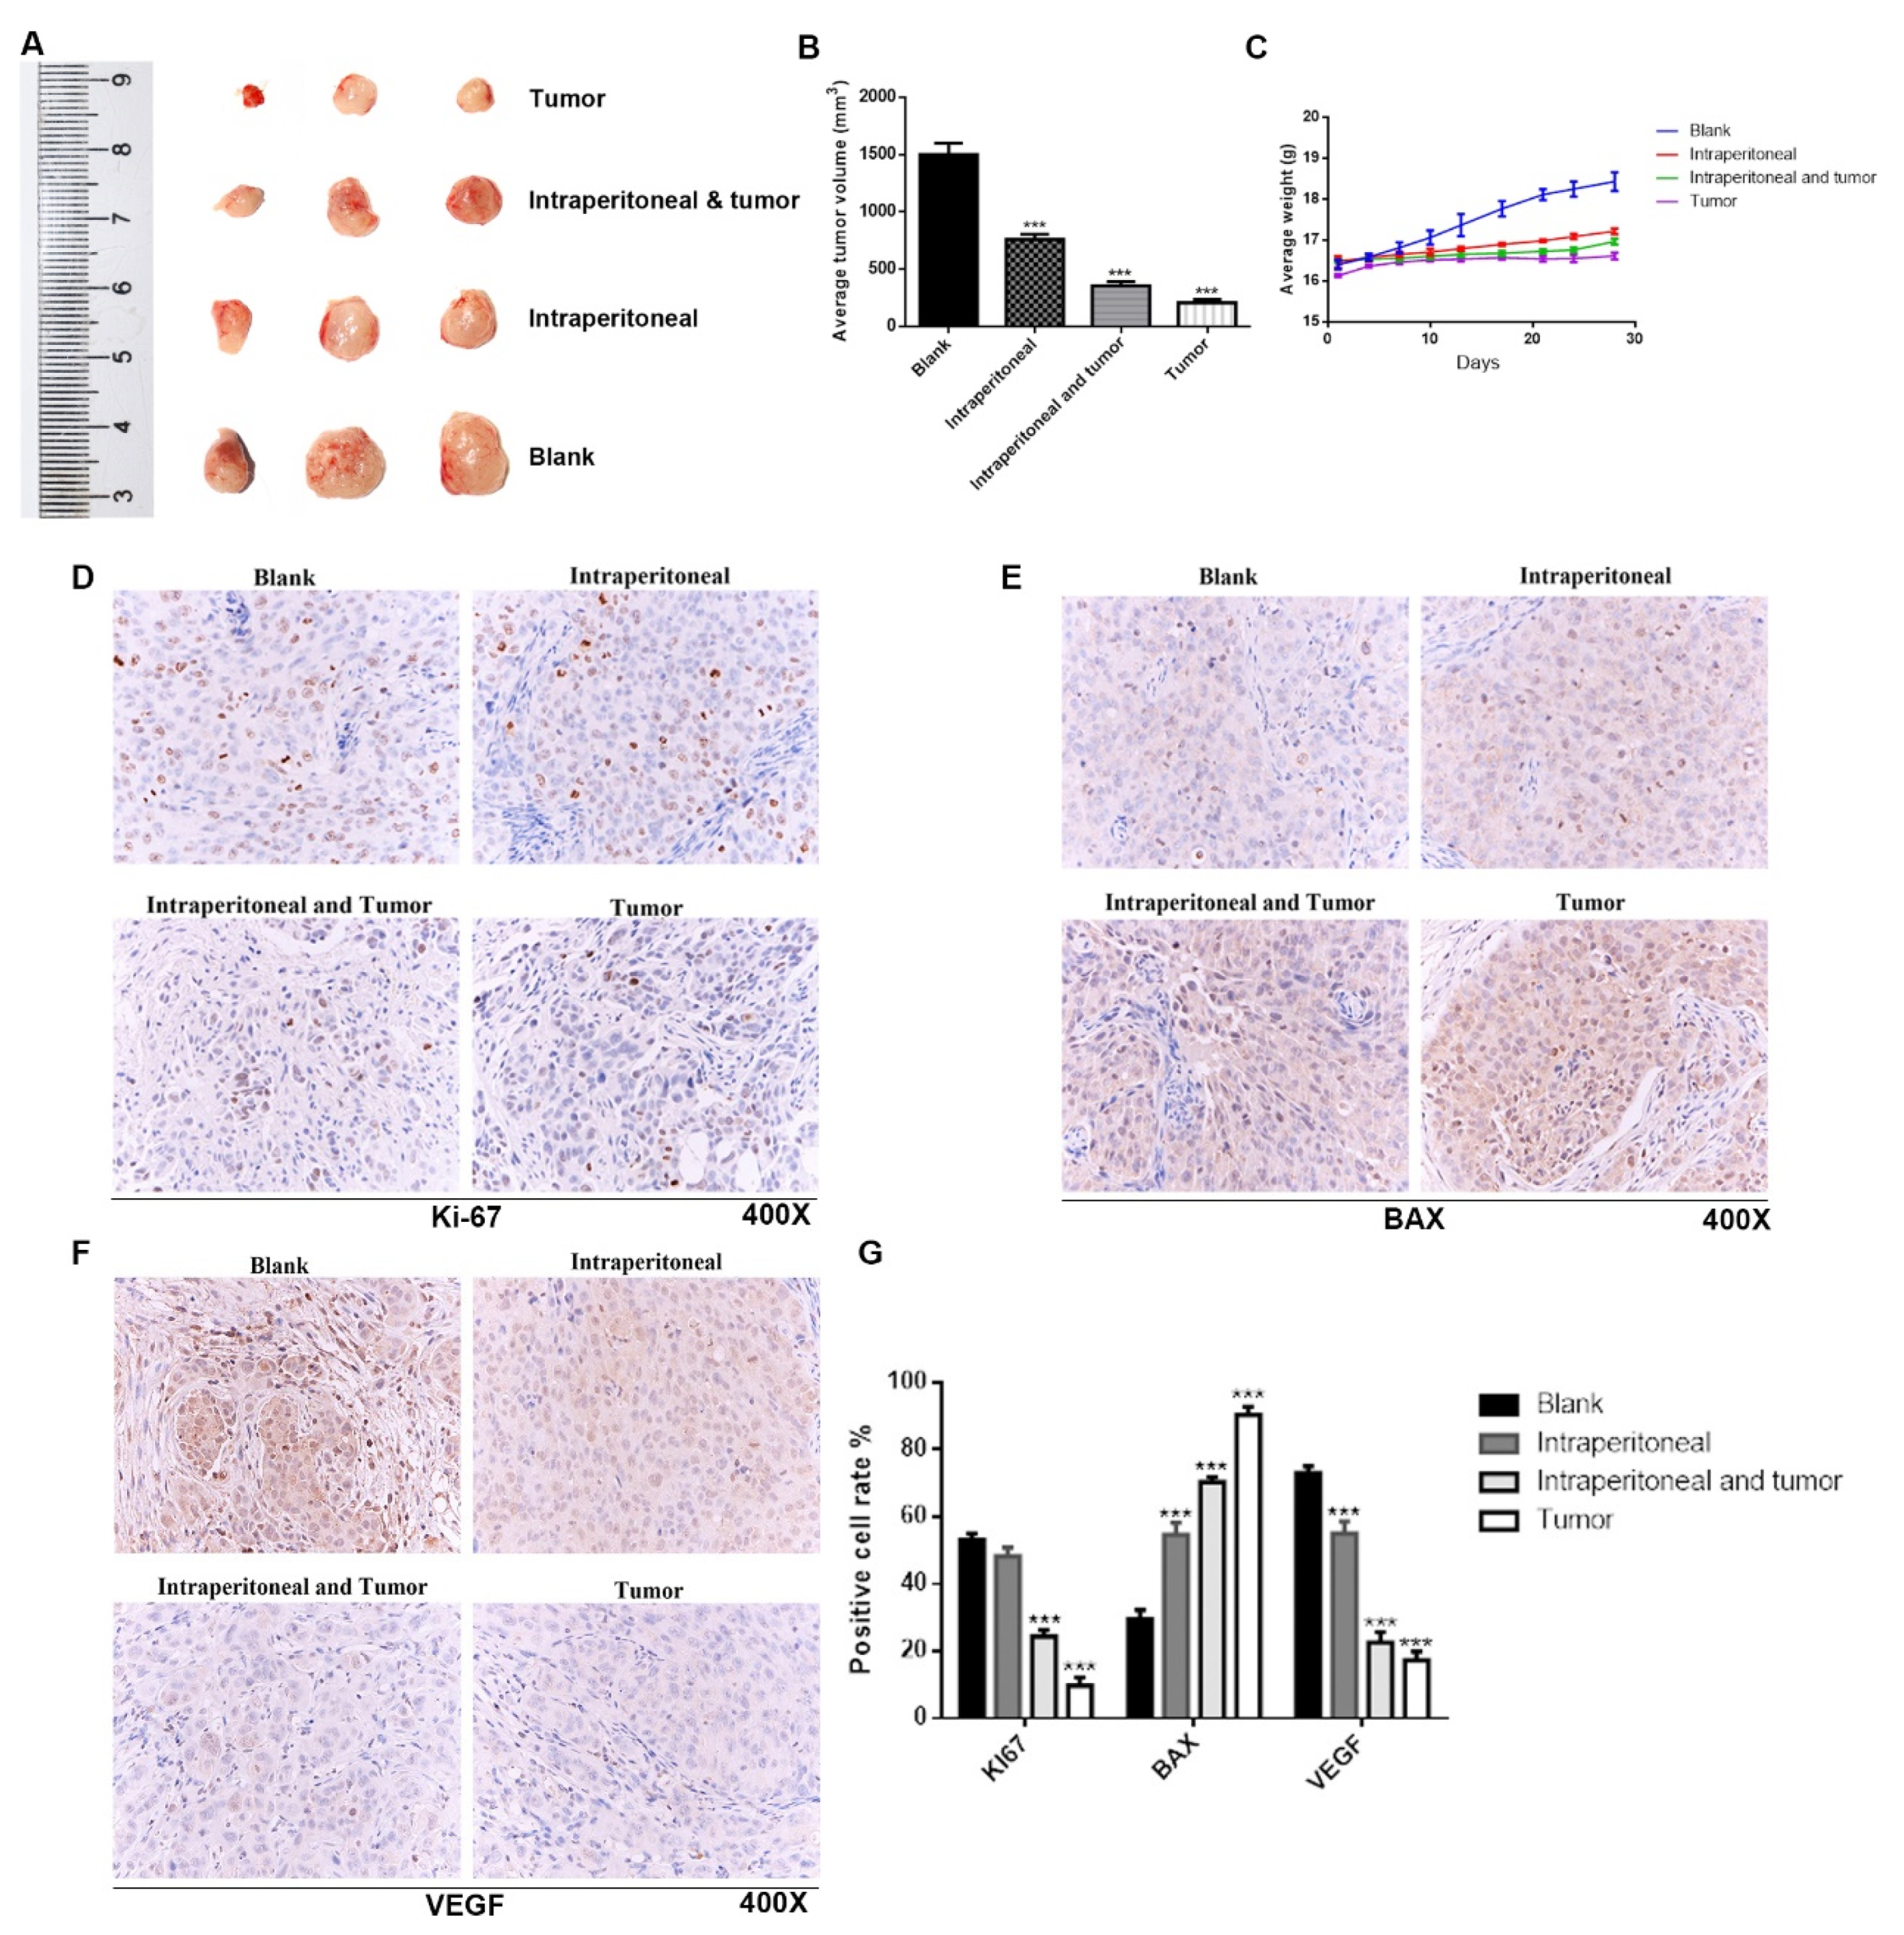
In this study, cytological experiments confirmed that TSO had an inhibitory effect on the proliferation, invasion and migration of HCCLM3 and HepG2 cells, which was indirectly supported by QPCR results. It was also proved that sufficient tryptophan could reverse the inhibitory effect of TSO by changing the medium containing different concentrations of tryptophan after administration. In vivo experiments, we found that the tumor growth of the drug administration group was significantly inhibited compared to that of the blank group, as there was a significant difference in tumor size between these groups. The results of immunohistochemistry also confirmed this finding. We also found that the effect of direct tumor administration was better than that of intraperitoneal injection at the same dose, which may be due to the compensatory effect in the body. As studies of ovarian and prostate cancer have shown, cancer-related fibroblasts (CAFs) can resynthesize glutamine and secrete glutamine to support tumor cell growth in a glutamine-restricted environment [
38]. However, tryptophan is an essential amino acid that cannot be synthesized by itself. Therefore, it is possible that when tryptophan levels drop to a certain level, the body spontaneously stores tryptophan to provide nutrients for survival. Additionally, through qualitative observations, the mice did not appear anxious or depressed, and continued to eat a normal amount of food. Because tryptophan is not only metabolized by TDO2 to kynurenine, but also a small part of it is metabolized to 5-HT, tryptophan will affect the nervous system and thus affect mood [
39]. Hence, this indirectly suggests that a small amount of tryptophan may be stored in the body for maintenance.
There were no tumorigenesis experiments on HepG2 cells because HepG2 cells had been proven to be ineffective in experimental tumor formation. We tried inoculating different sites with different doses of cell suspension, and after 30 days, we did not see any tumor.
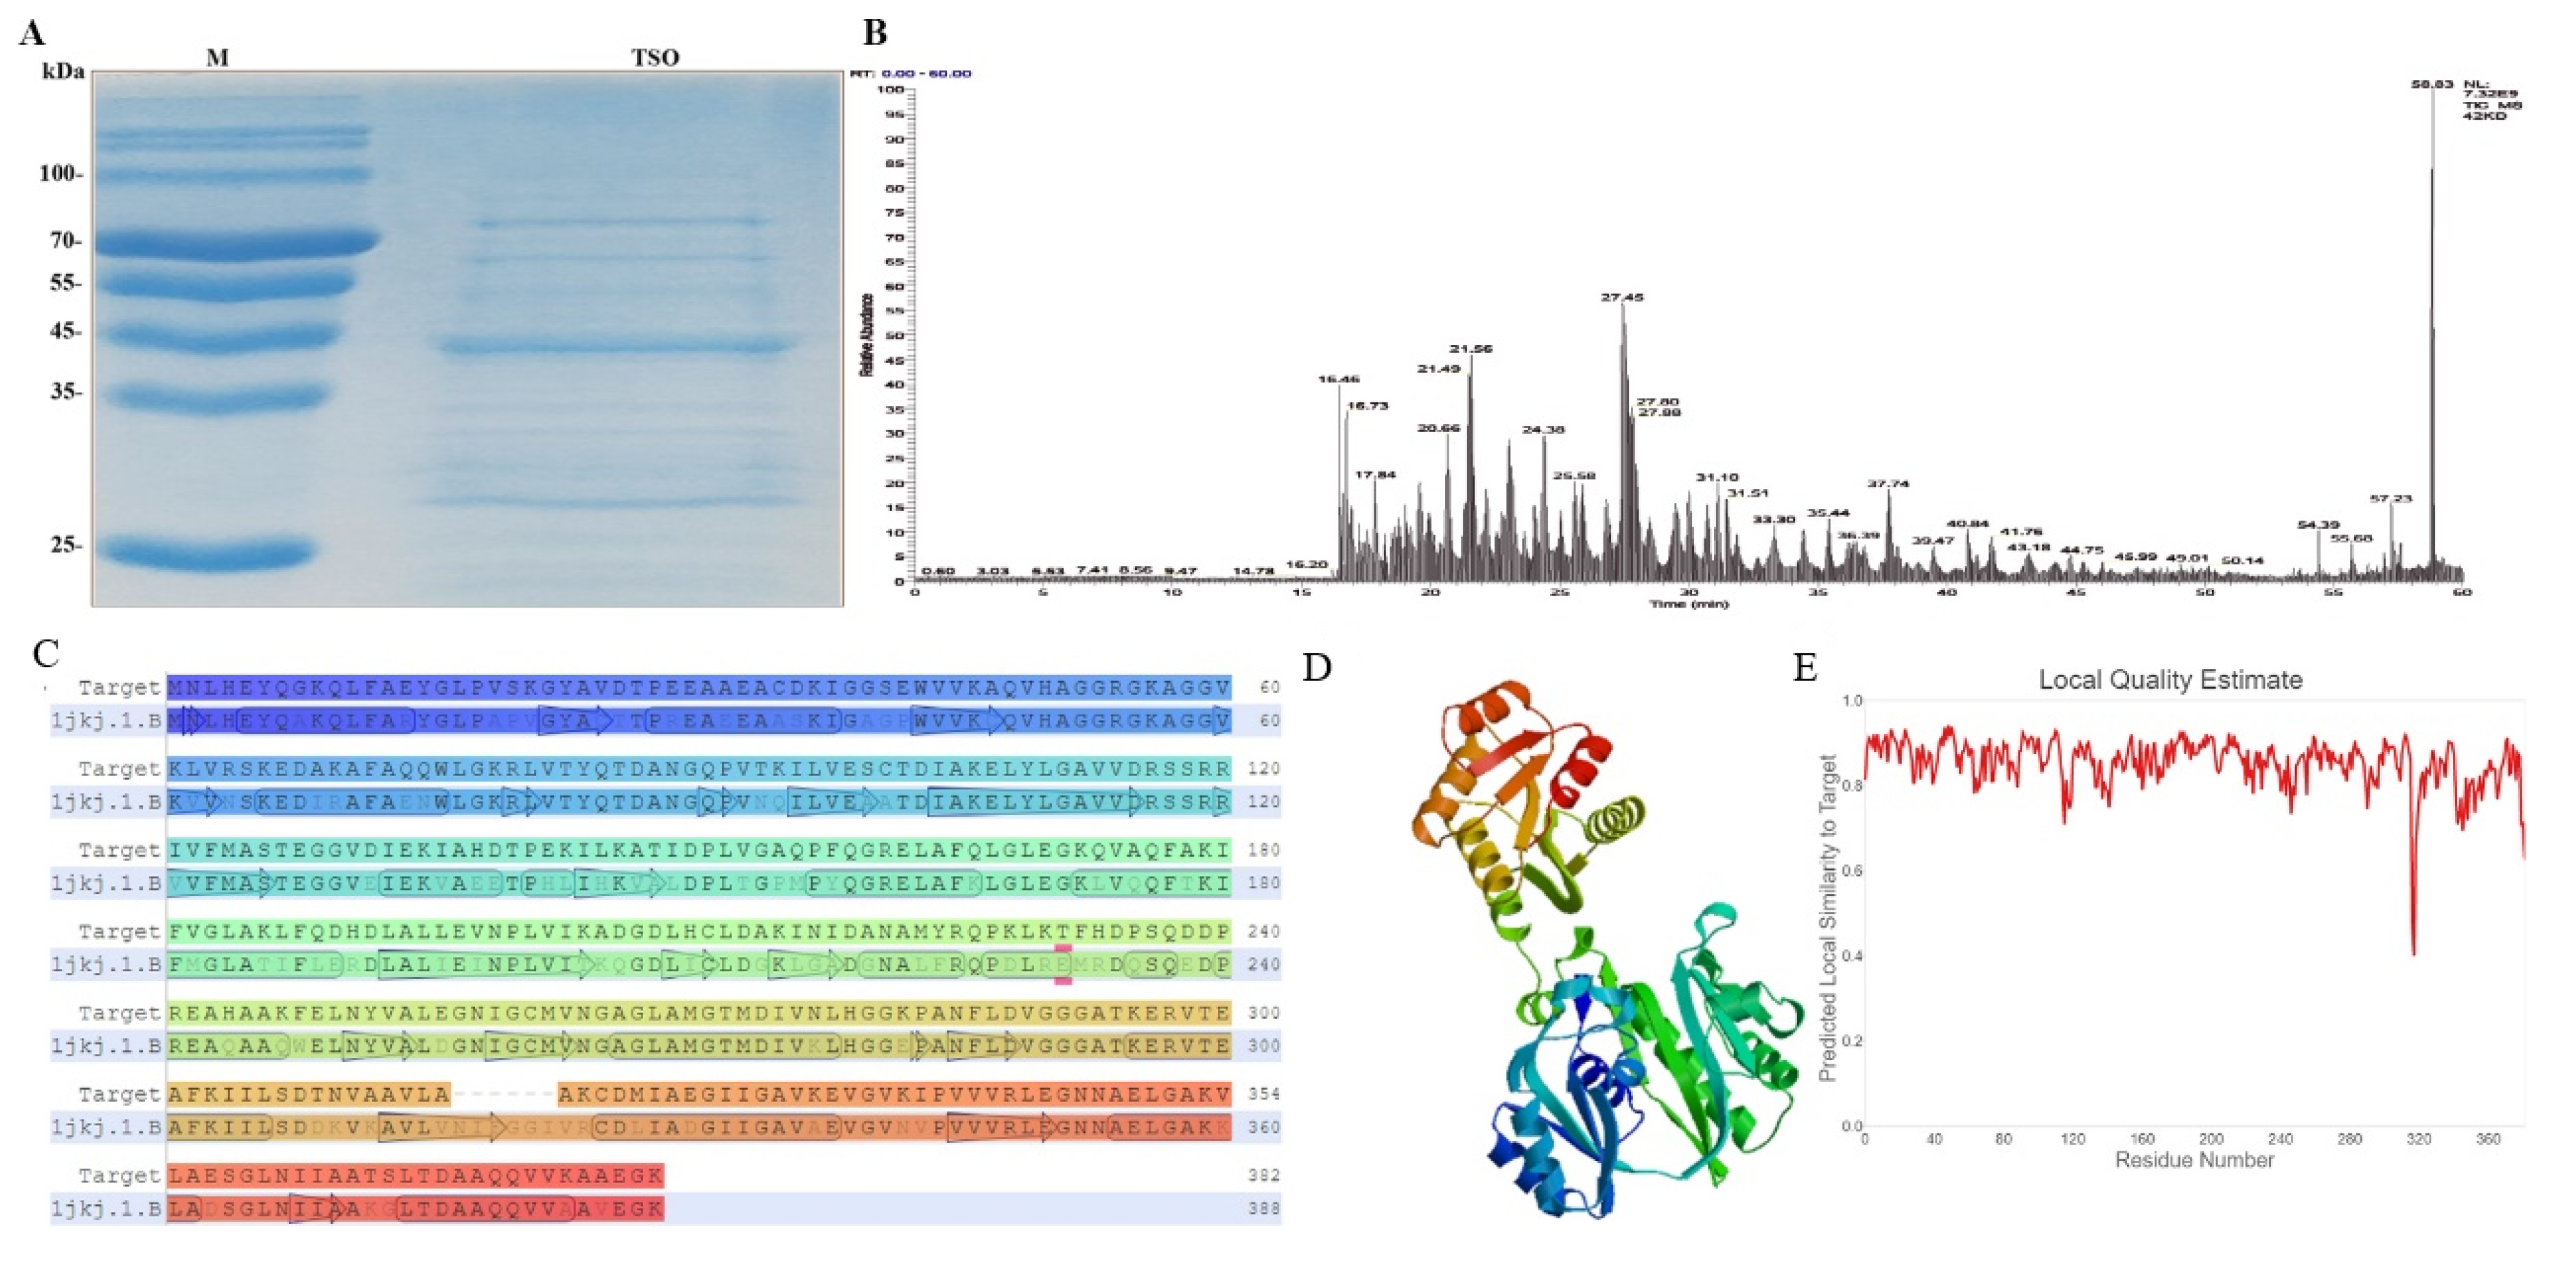
Because we used affinity chromatography to purify TSO protein, there were disadvantages of low efficiency and insufficient purity in the subsequent development of drugs. Hence, we also performed de novo sequencing of amino acids for TSO, laying a foundation for the subsequent discovery of its DNA sequence and the efficient production of TSO enzyme by means of genetic engineering. We used the EMBL-EBI software (
http://www.ebi.ac.uk/Tools/st/, accessed on 5 January 2021) to predict the probable nucleotide sequence based on the amino acid sequence in Pseudomonas. We then used genetic engineering methods to clone and recombine these sequences to find the nucleotide sequences of proteins with tryptophan degradation activity. In addition, we performed a simple 3D structure prediction of TSO to determine its transmembrane domains and physicochemical properties, which laid a foundation for future studies investigating its targets, receptors, and anticancer function.
By suppressing the proliferation of cancer cells with effective metabolic interventions, it is possible to expand the range of anti-cancer immune responses [
40]. For amino acids that are limited, they may be safe to use intermittently for days or weeks, or even for one or two months. Thus, intermittent dietary amino acid restriction may have value and potential as a practical and viable dietary strategy for cancer treatments [
41]. This also lays a foundation for the development of colorless amino-acid food for tumor patients.
At present, the regulation of tryptophan metabolism for anticancer treatment is mainly produced by TDO, IDO, and AHR receptor inhibitors [
19,
42], as well as 5-HT signaling pathways [
42]. TSO can directly degrade tryptophan and competitively inhibit TDO2, such that tryptophan is not metabolized in accordance with the kynurenine pathway, thus inhibiting tumor cells. This provides a novel insight into development of anti-tumor drugs and methods. In the future, we will compare the anti-cancer effects of individual or combined administration of a TDO2 inhibitor and TSO.
4. Materials and Methods
4.1. Cell Cultures, siRNAs, and Transfections
HCCLM3 cells and HepG2 cells were purchased from the National Typical Culture Preservation Center (preservation center of Wuhan University, Wuhan, China). All cell lines were confirmed to be free of mycoplasma contamination, as determined by PCR and culture methods. The species origin of each cell line was confirmed via PCR. The identity of each cell line was authenticated via short tandem repeat (STR) profiling. These cell lines were cultured in DMEM (Hyclone, Logan, UT, USA) containing 10% fetal bovine serum (FBS) (AusgeneX, Queensland, Australia), 100 units/mL penicillin, and 100 μg/mL streptomycin (Hyclone, USA) at 37 °C with 5% CO2 in a humidified atmosphere. The medium was replaced every 2–3 d, and the cells were subcultured when their cell fusion rate reached 80–90%. DNA transfection and RNA interference were performed via Lipofectamine 3000 (Thermo Fisher Scientific, Dover, DE, USA), according to the manufacturer’s instructions. The siRNA sense sequence for TDO2 was 5′-CGUGAUAACUUCAAAGGAGAATT-3′ and was synthesized by Sangon Biotech (Shanghai, China). The PCR product of TDO2 was cloned into pEGFP-C1. The complete plasmid was verified by sequencing.
4.2. Antibodies and Reagents
The following commercially available antibodies were used: anti-BAX (Servicebio, cat: GB11007-1, 1:50 dilution, Wuhan, China), anti-Ki67 (Abcam, cat: Ab16667, 1:200 dilution, Cambridge, MA, USA), anti-VEGF (Servicebio, cat: GB11007-1, 1:100 dilution, Wuhan, China).
The following commercially available reagents were also used: SDS sample buffer (Sinopharm Group Chemical Reagent Co., Ltd., Beijing, China, cat: 30166428), 30% acrylamide (Biosharp, cat: BL513b, Hefei, China), Trise-Base (Biofavor biotech, cat: 1115GR500, Wuhan, China), Glycine (Biofavor biotech, cat: 1275GR500, Wuhan, China), methyl alcohol, NaCl, KCl, Na2HPO4.12H2O, KH2PO4, acetic acid, Tween-20 (Sinopharm Group Chemical Reagent Co., Ltd., Beijing, China), protein markers (Thermo Fisher Scientific, Dover, DE, USA).
4.3. Aminoagarose Affinity Chromatography Columns
In the first step, 4 g of indoleacrylic acid, 12 g of carbonized dimethylamine, and 4 g of N- hydroxysuccinimide were dissolved in 100 mL of anhydrous dimethylamide. The mixture was placed on a shaker for 24–48 h to produce a pale-yellow ester substance. In the second step, 5 mL of amino agarose filler was added with the same amount of phosphate buffer (0.1 M, pH = 8.5). Then, esters obtained in the first step were added to the balanced amino agarose at a ratio of 1:20, and the reaction was oscillated at room temperature for 1 h. Finally, in the third step, the coupled packing was packed into an empty chromatography column and cleaned with a 0.1 M phosphate solution in a 30× column volume (pH = 6.9). Then, the lower outlet of the column was opened to drain the coupling mixture. The amino agarose affinity chromatography column conjugated with 3-indoleacrylic acid was stored at 4 °C with 0.02% sodium azide.
4.4. Thallus Fragmentation Lysates
For thallus fragmentation lysates, 2 mM of EDTA, 100 mM of NaCl, and 0.5% TritonX-100 were dissolved in 50 mM of Tris-HCL (pH = 8.5–9.0). Then, 100 μg/mL of lysozyme and 1 μg/mL of PMSF were added to the lysis buffer before use.
4.5. Preparation of Pseudomonas Fermentation Broth
The frozen Pseudomonas strain (ATCC 29574) was inoculated into a sterilized nutrient broth medium and cultured at 30 °C, at 150 rpm for 24 h. Then, the inoculated bacterial solution was added to sterilized 2% BBL liquid medium at a ratio of 1:20, and the mixture was cultured at 200 rpm for 36 h at 30 °C. After the bacteria completed logarithmic growth and reached the stable growth stage (the bacterial content was approximately 2 × 10¹⁰ cells/mL), the bacteria were centrifuged at 8000 rpm for 1 h at 4 °C, and the storage temperature of the bacterial precipitation obtained by precipitation fermentation was −80 °C. The fermentation conditions of the fermenter were also explored.
4.6. Bacteria Lysates
First, 2 g of wet heavy bacteria was taken, and 10 mL of bacteria lysate was added. On an ice bath, the bacteria were lysed by ultrasonication. Ultrasonic crushing conditions were as follows: 140 W, 10 s, an intermittent 10 s, and the working time was 30–40 min. After ultrasonication, the bacterial suspension became clear and transparent, indicating that the bacteria were sufficiently lysed. Then, the liquid after ultrasonic crushing was centrifuged at and 10,000 rpm for 30 min at 4 °C. The supernatant was then collected. Then, the concentration of the extracted protein mixture was detected by ultra-fine ultraviolet spectrophotometry.
4.7. Desalination
The crude enzyme liquid was placed into an Amicon Ultra centrifugal filter (the ultrafiltration centrifugal filter underwent four washes with ultra-pure water and was pre-cooled before use). The ultrafiltration centrifuge filter was placed into a centrifuge with the membrane panel facing upward, and was centrifuged at 4000 rpm for 40 min at 4 °C. After centrifugation, the lower layer was drained and then acetate buffer (0.002 M, pH = 5.5) was added to the upper tube to fill the 12 mL calibration line. This step was repeated 2–3 times.
4.8. Affinity Chromatography
The enzymatic solution obtained in subsection above was purified by AKTA protein purifier (NGC Chromatography System, Bio-Rad, California, USA). The acetate buffer was balanced with a 30× column volume (0.05 M, pH = 5.5) until the effluent A280 was less than 50 mAU. After equilibrium, the enzymatic solution in the sample ring was added to the affinity chromatography column with 5 mL of acetate buffer (0.2 M pH = 5.5). The loading volume was 1 mL, and the flow rate was 2 mL/min. Then, the eluent was eluted with a 20× column volume of acetic acid buffer (0.05 M, pH = 5.5) and A280 (0.2 M, pH = 5.5) less than 50 mAU, after which the eluent of each gradient concentration of the buffer was collected. Finally, the column was cleaned with a 5× column volume of acetate buffer (0.2 M, pH = 5.5) and ultra-pure water.
4.9. Concentration, Endotoxin Removal, and Detection of Enzymatic Activity
The TSO enzymatic solution obtained by washing different concentrations of acetate buffer solution was added into different Amicon ultra centrifugal filters. According to the final required concentration, the TSO enzymatic solution was obtained by centrifugation at 4000 rpm for 30–40 min.
An endotoxin removal kit (ToxinEraser Endotoxin Removal Kit, Genscript, Beijing, China) was used to remove endotoxins from the TSO enzymatic solution. Then, an endotoxin assay kit (ToxinSensor Chromogenic LAL Endotoxin Assay Kit, Genscript, China) was used to measure endotoxin levels in the TSO enzymatic solution to ensure that this solution would not lead to cellular and/or organismal death.
Next, the national standard method was used to detect the content of tryptophan in the reaction solution of TSO and tryptophan to calculate and analyze the enzymatic activity of the TSO enzymatic solution to degrade tryptophan. After the reaction of tryptophan and TSO, the chromogenic substrate was added to detect the absorption value at 590 nm, and the corresponding tryptophan concentration was calculated according to the regression equation.
4.10. HPLC and HPLC-MS Detection of Tryptophan and Kynurenine Levels
HPLC-MS was used to detect the metabolites of tryptophan standard substance metabolized by TSO to confirm that TSO metabolized tryptophan and did not activate the kynurenine-metabolizing pathway.
HPLC was performed using an HPLC-MS instrument (Shimadzu, Japan, and ABSciex) for detection and quantitation of tryptophan and kynurenine. The mass scan mode was set to positive and negative ions, and the range was set to 70–1000 m/z. This mass spectrometer method was used for the detection of samples eluted from the Shimadzu LC-20 HPLC system. Separation of tryptophan and kynurenine was carried out on an Agilent XDB-C18 column. Standards and samples were eluted using methyl alcohol and ultrapure water (0.1% formic acid). The injection volume was set to 5 μL, with a solvent flow rate of 0.2 mL/min. The column temperature was set to 40 °C. The IDA mode was used for data acquisition.
The contents of tryptophan and kynurenine in cells were determined by HPLC. HCCLM3 cells were divided into the following four groups, with 1 × 10⁶ cells/well that were inoculated into six-well plates: control group, TDO2 group, TSO group, and siRNA combined with TSO group. Then, 2 mL of serum-free medium was added to each well. The culture medium was harvested after 48 h of incubation and was then centrifuged and frozen until HPLC analysis. Standards of known concentrations of kynurenine and tryptophan were used for standardization of assays. Kynurenine and tryptophan reference standards were obtained from Solarbio Life Sciences (Beijing, China). Chromatographic separation conditions are described above.
4.11. LC-MS/MS Sequencing
The crude enzymatic solution after affinity chromatography was further purified by SDS-PAGE and the target protein bands (44 kDa) were separated. Trypsin, chymotrypsin, and pepsin were used to enzymolyze the target band.
The enzymatic peptides were analyzed by capillary HPLC (Ultimate 3000, Thermo Fisher Scientific, USA) and electrospray-combined ion-trap Orbitrap mass spectrometry (Q Exactive Hybrid Quadrupole-Orbitrap Mass Spectrometer, Thermo Fisher Scientific, USA). The separation was carried out with prefabricated columns (300 μm i.d. × 5 mm, packed with Acclaim PepMap RPLC C18, 5 μm, 100 Å) and analytical columns (150 μm i.d. × 150 mm, packed with Acclaim PepMap RPLC C18, 1.9 μm, 100 Å). The samples were eluted with mobile phase A (0.1% formic acid and 2% ACN) and phase B (0.1% formic acid and 80% ACN). The solvent flow rate was set to 600 nl/min, and the analysis time of each component was 60 min.
First-order MS parameters were as follows: resolution, 70,000; AGC target, 3,000,000; maximum IT, 40 ms; and scan range, 300–1400 m/z. Secondary MS parameters were as follows: resolution, 75,000; AGC target, 100,000; maximum IT, 60 ms; Top N, 20; and NCE/stepped NCE, 27.
The raw MS files were analyzed and searched against a protein database based on the species of the samples using Byonic. The parameters were set as follows. The protein modifications were carbamido methylation (C) (fixed), oxidation (M) (variable), and acetylation (Protein N-term, variable). The enzymatic specificity was set to trypsin. The maximum missed cleavages were set to 3. The precursor ion-mass tolerance was set to 20 ppm, and the MS/MS tolerance was set to 0.02 Da. Only high-confidence identified peptides were chosen for downstream protein-identification analysis. The amino acid sequences were manually spliced and verified by the MaxQuant software.
4.12. CCK-8 Assays
First, 9 μg/mL of TSO enzyme and 0.01 unit/mL of endotoxin standard were added to 10% DMEM medium as the administration treatment. This dose has been tested for drug endotoxin toxicity (i.e., at this dose, the endotoxin level is below 0.01 units/mL).
HCCLM3 and HepG2 cells were seeded in 96-well plates (2000 cells/well), with 100 μL of medium per well. After 4, 24, and 48 h of incubation, the medium was discarded, and 100 μL of PBS (phosphate buffer saline) and 10 μL of CCK-8 reagent (Beyotime) were added to each well. The cells were then incubated for an additional 1 h. Absorbance values at 450 nm were recorded to assess cell proliferation.
In order to verify the reversal effect of tryptophan on TSO, we studied the changes in cell proliferation and apoptosis under different concentrations of tryptophan. We designed the medium to be replaced with different concentrations of tryptophan (5, 10, and 20 times) 48 h after administration to explore which concentration was most suitable for cell proliferation.
4.13. Wound Healing Assays
Exponentially growing cells were inoculated into six-well plates with 5 × 10⁵ cells per well and were divided into the drug treatment group and control group. Linear wounds were scratched with a 0.2-mL pipette tip. The dead cells were washed with PBS. Then, 1 mL of DMEM medium containing 9 μg/mL TSO was added, and drug-free medium was added to the control well. Images were acquired at 0 and 48 h after the cells were wounded. ImageJ (V1.8.0) software was used to measure the uncovered area of cells at each time point.
4.14. Detection of Apoptotic Rates via Annexin V-FITC/PI Double Staining
First, for supernatant collection, the culture medium was collected into a flow tube (with a small number of suspended cells). Next, the cells in the six-well plate were washed once with PBS, and 1 mL of 0.25% trypsin was added to digest the cells. When the cells became round and some of the cells were suspended, culture medium was added to stop the digestion. Then, we gently mixed the cells to suspend them. They were collected into a flow tube, centrifuged at 1500 rpm for 5 min, and the supernatant was then discarded. Thereafter, 3 mL of 4 °C pre-cooled PBS was added to resuspend each pellet, which was then centrifuged at 1500 rpm for 5 min. The supernatant was then discarded. The precipitate was resuspended with 300 mL of binding buffer. For fluorescent labeling, 5 Annexin v-fitc and propidium iodide was added and mixed. At room temperature, the reaction was conducted for 5–15 min in the dark. Next, at 1 h after the previous step, Annexin v-FITC green fluorescence was detected by the FITC channel (FL1) and PI red fluorescence was detected by the PI channel (FL2). The parameters for flow cytometry were as follows: excitation wavelength = 488 nm and emission wavelength = 530 nm.
4.15. Transwell Invasion Assays
Transwell invasion assays were used to detect the invasive and migratory abilities of cells. First, 3 × 10⁵ cells were inoculated into a precoated supraventral Matrigel (BD Biosciences, NewYork, USA) and DMEM containing 10% fetal bovine serum was added to the underlying Matrigel. After incubation for 24 h, uninvaded cells were removed with cotton swabs, and the invaded cells were fixed with methanol and stained with crystal violet. We then performed microscopy to count the number of invading cells.
4.16. Colony Formation Assays
After digestion and counting of logarithmic HCCLM3 and HepG2 cells, 200 cells/well were inoculated into 6-well plates. After 12 h, the medium was changed and TSO treatment at a final concentration of either 5 or 9 μg/mL was added for 48 h. The normal control group was assigned to three wells per group. The cells were placed in an incubator at 37 °C and 5% CO2 for two weeks, and the medium was changed every 4 d until visible cell colonies appeared. After formaldehyde was used for fixation, the crystal violet was used for staining and five fields were randomly selected for observation under an inverted microscope. The average cell mass number (greater than 50) was used as the colony count. The experiment was repeated three times.
4.17. RNA Extraction and qRT-PCR
Total RNA from cultured cells was extracted using a Takara MiniBEST Universal RNA Extraction kit (Takara Scientific, Inc., Shiga, Japan) and was quantified using a Nanodrop 2000 (Thermo Fisher Scientific, Inc.). cDNA (Complementary DNA) was synthesized from RNA using PrimeScript RT Reagent (Takara Scientific, Inc., Shiga, Japan). Realtime-PCR was performed via an ABI 7500 system (Thermo Fisher Scientific, Dover, DE, USA) using SYBR Premix Ex Taq II (Takara). The primers used were as follows: PCNA forward, 5′-TAATTTCCTGTGCAAAAGACGG-3′ and reverse, 5′-AAGAAGTTCAGGTACCTCAGTG-3′; MMP-2 forward, 5′-ATTGTATTTGATGGCATC-GCTC-3′, and reverse, 5′-ATTCATTCCCTGCAAAGAACAC-3′; GSK-3β forward, 5′-AGGAGAACCCAATGTTTCGTAT-3′ and reverse, 5′-ATCCCCTGGAAATATTGGTTG-T-3′; BAX forward, 5′-CGAACTGGACAGTAACATGG-AG-3′ and reverse 5′-CAGTTTG-CTGGCAAAGTAGAAA-3′; AKT forward, 5′-TGACCATG-AACGAGTTTGAGTA and reverse, 5′-GAGGATCTTCATGGCGTAGTAG-3’; β-actin forw-ard, 5′-TCAAGATCAT-TGCTCCTCCTG-3′, and reverse, 5′-CTGCTTGCTGATCCACATC-TG-3′. The procedures were as follows: one cycle of 95 °C for 30 s, followed by 40 cycles of 95 °C for 5 s, and 60 °C for 34 s.
4.18. Tumor Xenograft Assays
A mouse xenograft model was established in five-week-old BALB/c-nu mice (Model Animal Research Institute of the Chinese Academy of Medical Sciences, Beijing, China) in accordance with our institutional guidelines. In brief, 5 × 10⁶ HCCLM3 cells suspended in 100 μL of PBS were injected subcutaneously into the left dorsal flanks of mice. When the tumor size reached approximately 50 mm3, 12 mice were equally divided into the following four groups: group A as the blank control, group B as the drug administration group by intraperitoneal injection, group C as the intraperitoneal injection group combined with tumor upper administration, and group D as the tumor administration. Each tumor in group B or D was injected with 50 μL of solution containing 2 mg/mL of TSO. The solution used for intraperitoneal injection and tumor injection in group C contained 50 μL of 1 mg/mL of TSO. We administered the TSO enzyme twice per week for 4 weeks. During treatments, the weight was measured every 3 d. The mice were monitored daily to determine whether they were free to eat, drink, and be active as usual, and whether their body shapes had changed. The behavior and food intake of mice were observed daily. On day 28, the mice were sacrificed, and the tumors were dissected, weighed, and imaged. The tumor volume (V) was calculated using the following equation: V = 0.5 × L × W2. The tumor tissues were fixed in 4% paraformaldehyde for further studies. Dewaxing and hydration were performed successively, and then the morphological and structural changes of tumor tissues were observed via microscopy.
4.19. Immunohistochemistry
The tumor tissues of the mice were fixed, embedded in paraffin, and sliced into consecutive tissue sections. Next, 5 μm-thick tissue sections were deparaffinized, dehydrated, and heated in citrate buffer (pH = 6.0) for 15 min at 95 °C. To block nonspecific binding of the first antibody, we added 1% bovine serum onto the slides for 20 min at room temperature. Paraffin sections of tumor tissues were taken. BAX (reflecting apoptosis), KI-67 (reflecting proliferation) and VEGF (reflecting invasion) were detected by immunohistochemistry according to the instructions of the SP kit. Finally, the sections were visualized with a DAB kit (ZSGB-bio, Beijing, China) and were counterstained with hematoxylin (Beyotime, Jiangsu, China).
4.20. Statistical Analysis
SPSS Statistics 25.0 (Armonk, NY, USA) was used for all data analysis. The data are expressed as the mean ± standard deviation (SD). A p value < 0.05 was considered to be statistically significant. Student’s t-test was used to evaluate the differences in groups.


