
Z-DNA as a Tool for Nuclease-Free DNA Methyltransferase Assay


Abstract
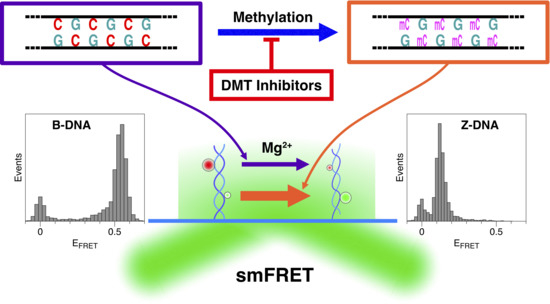
1. Introduction
2. Results and Discussion
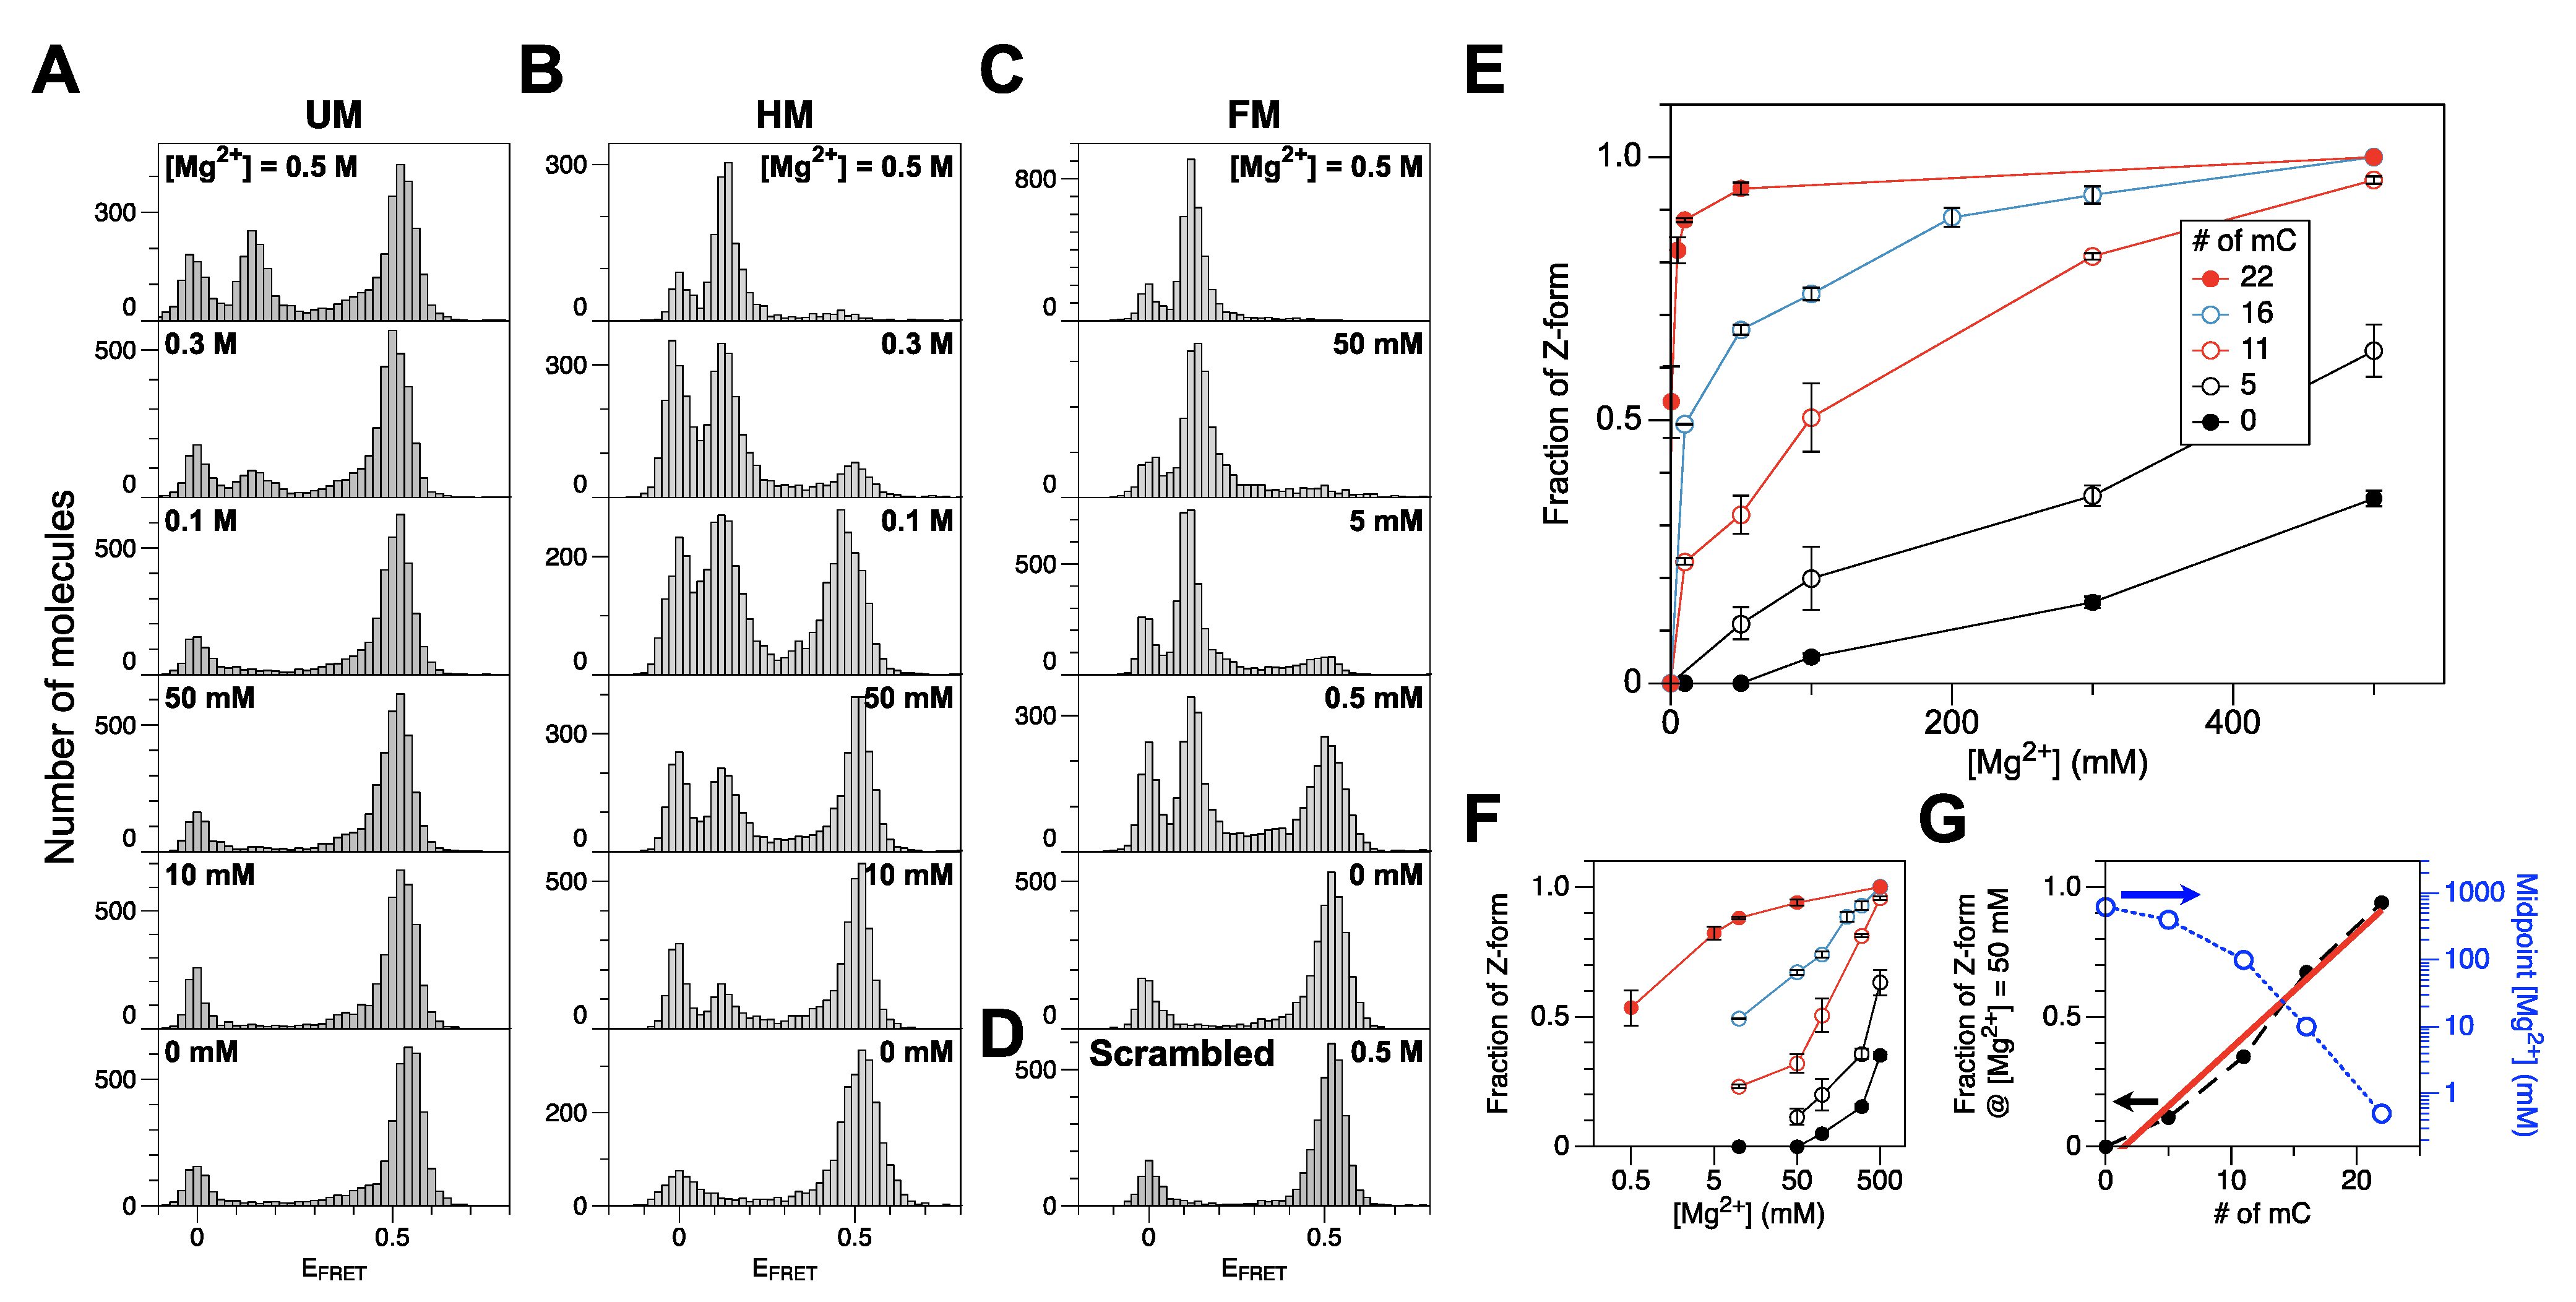
2.1. The Population of the Z-State in CG Repeat Sequences Is Dependent on the Degree of DNA Methylation
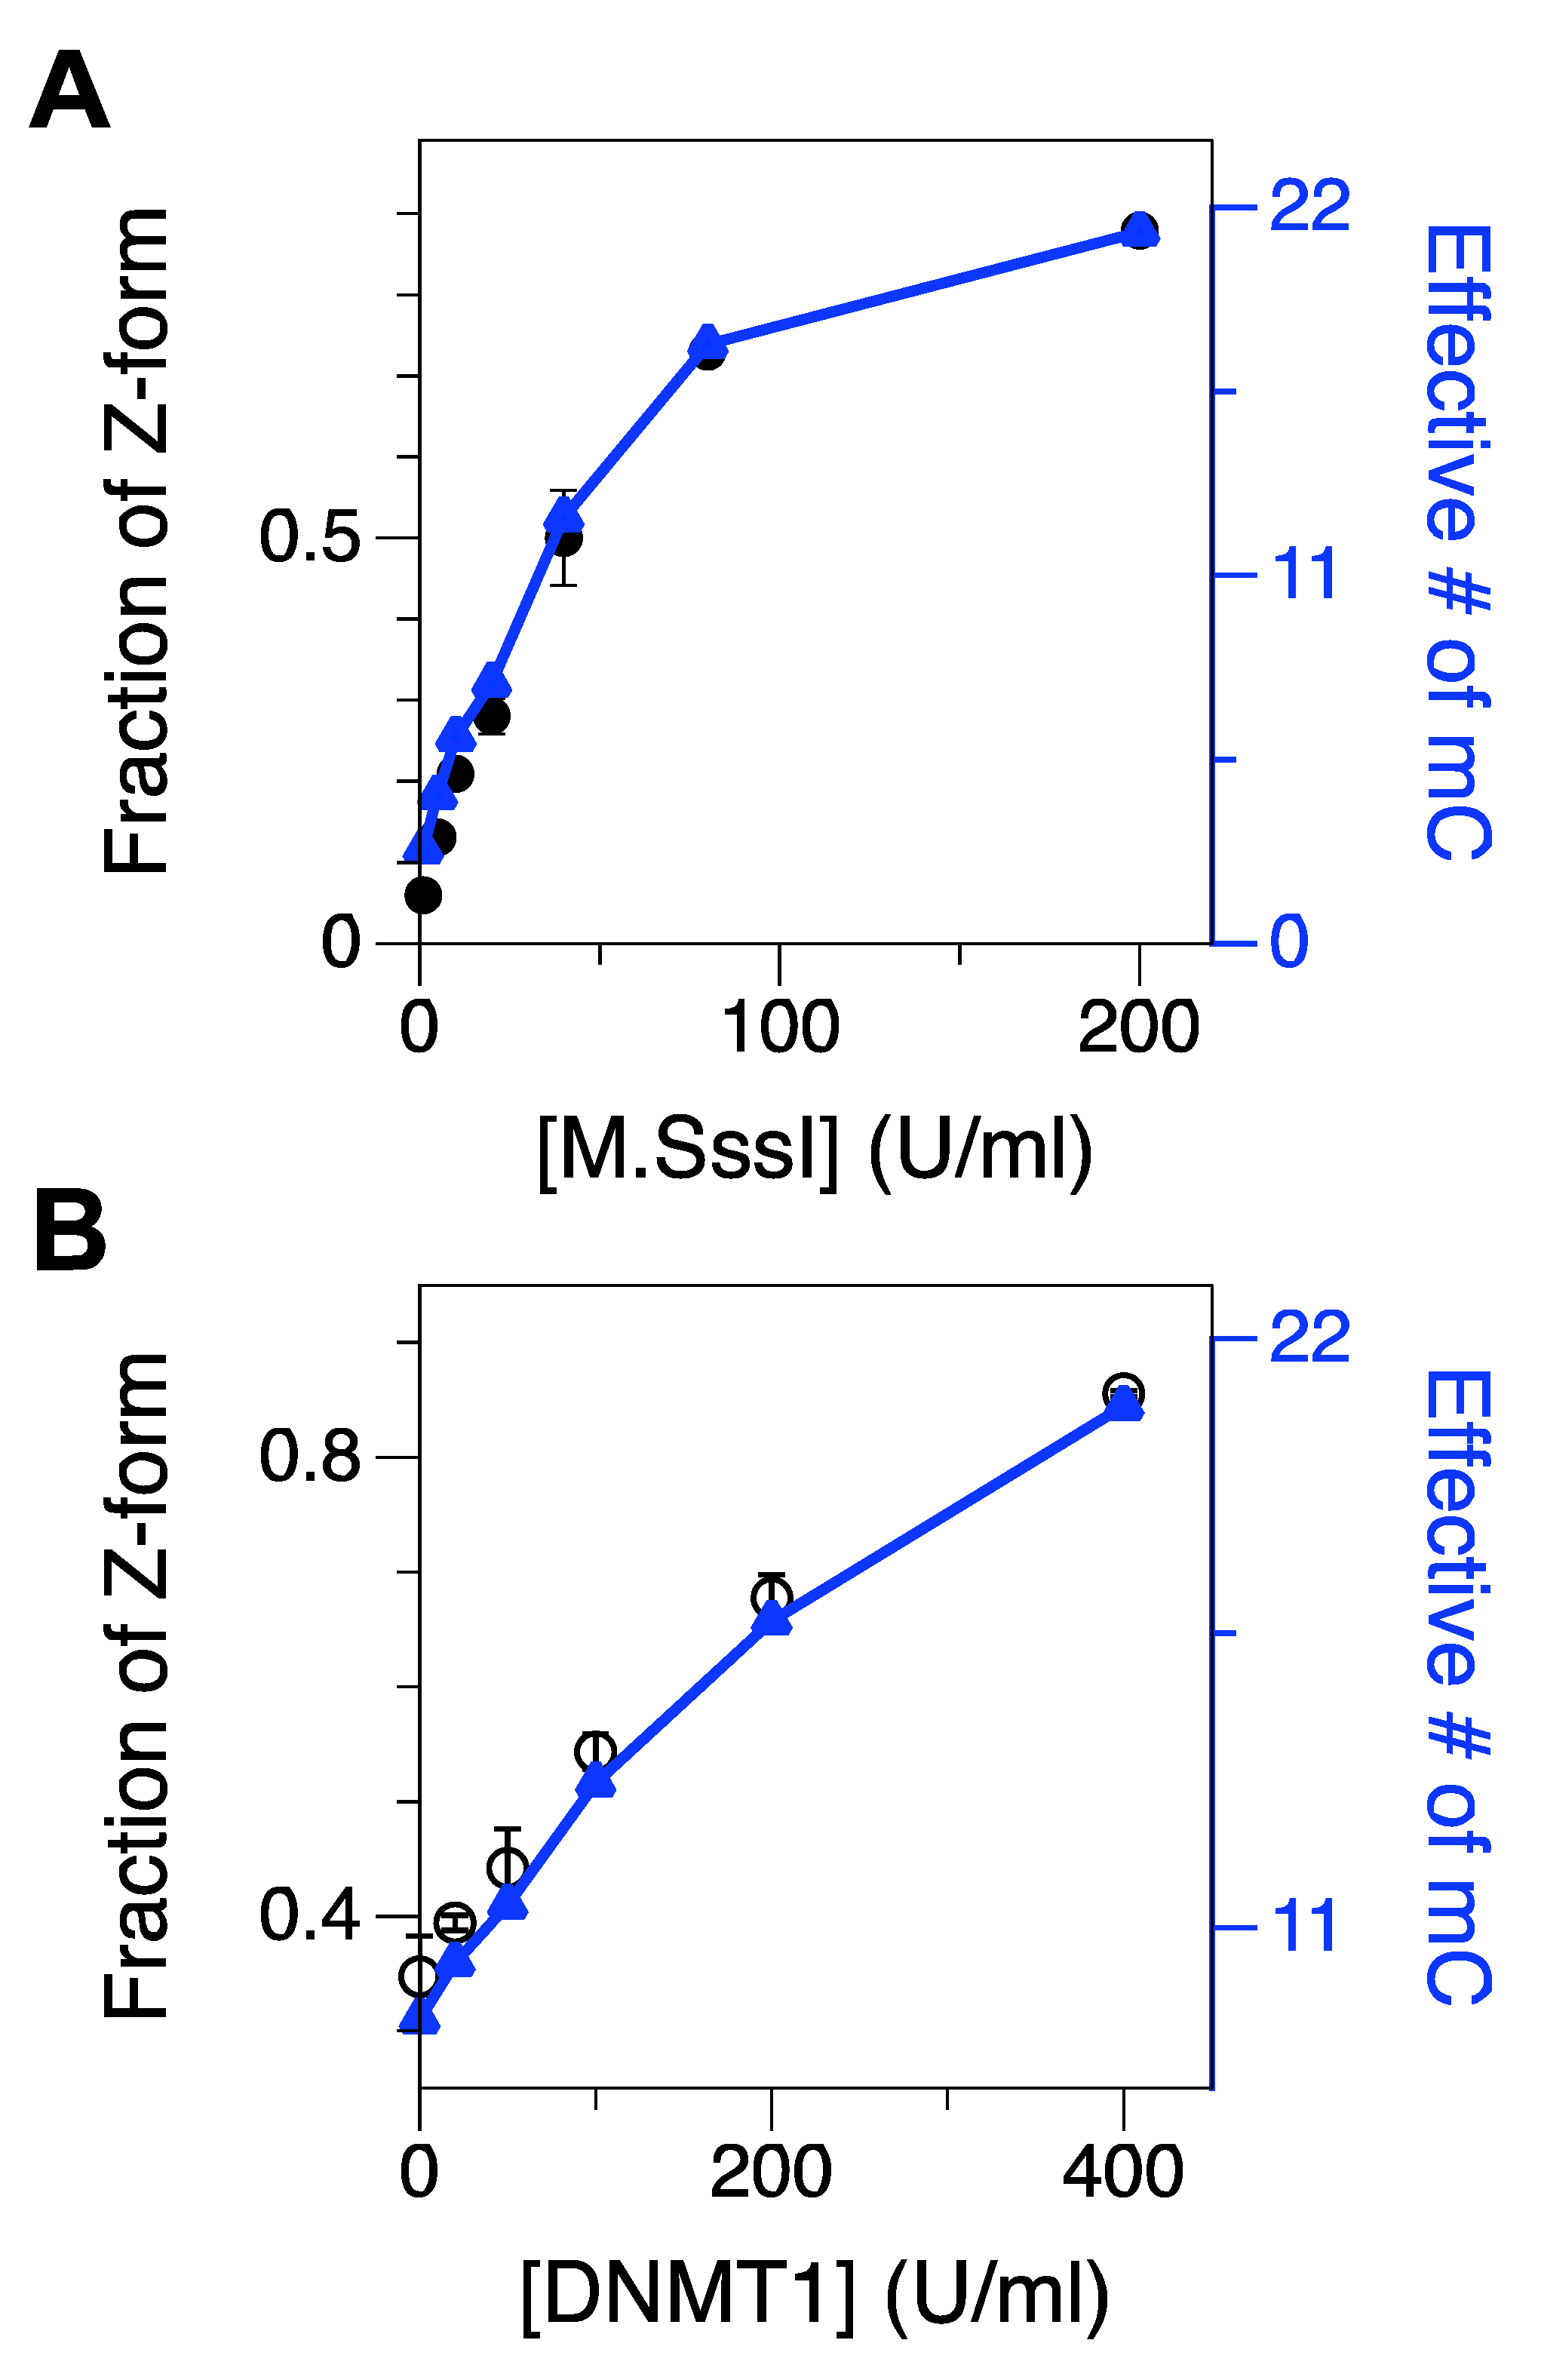
2.2. Methylation of CG Cores with M.SssI and DNMT1
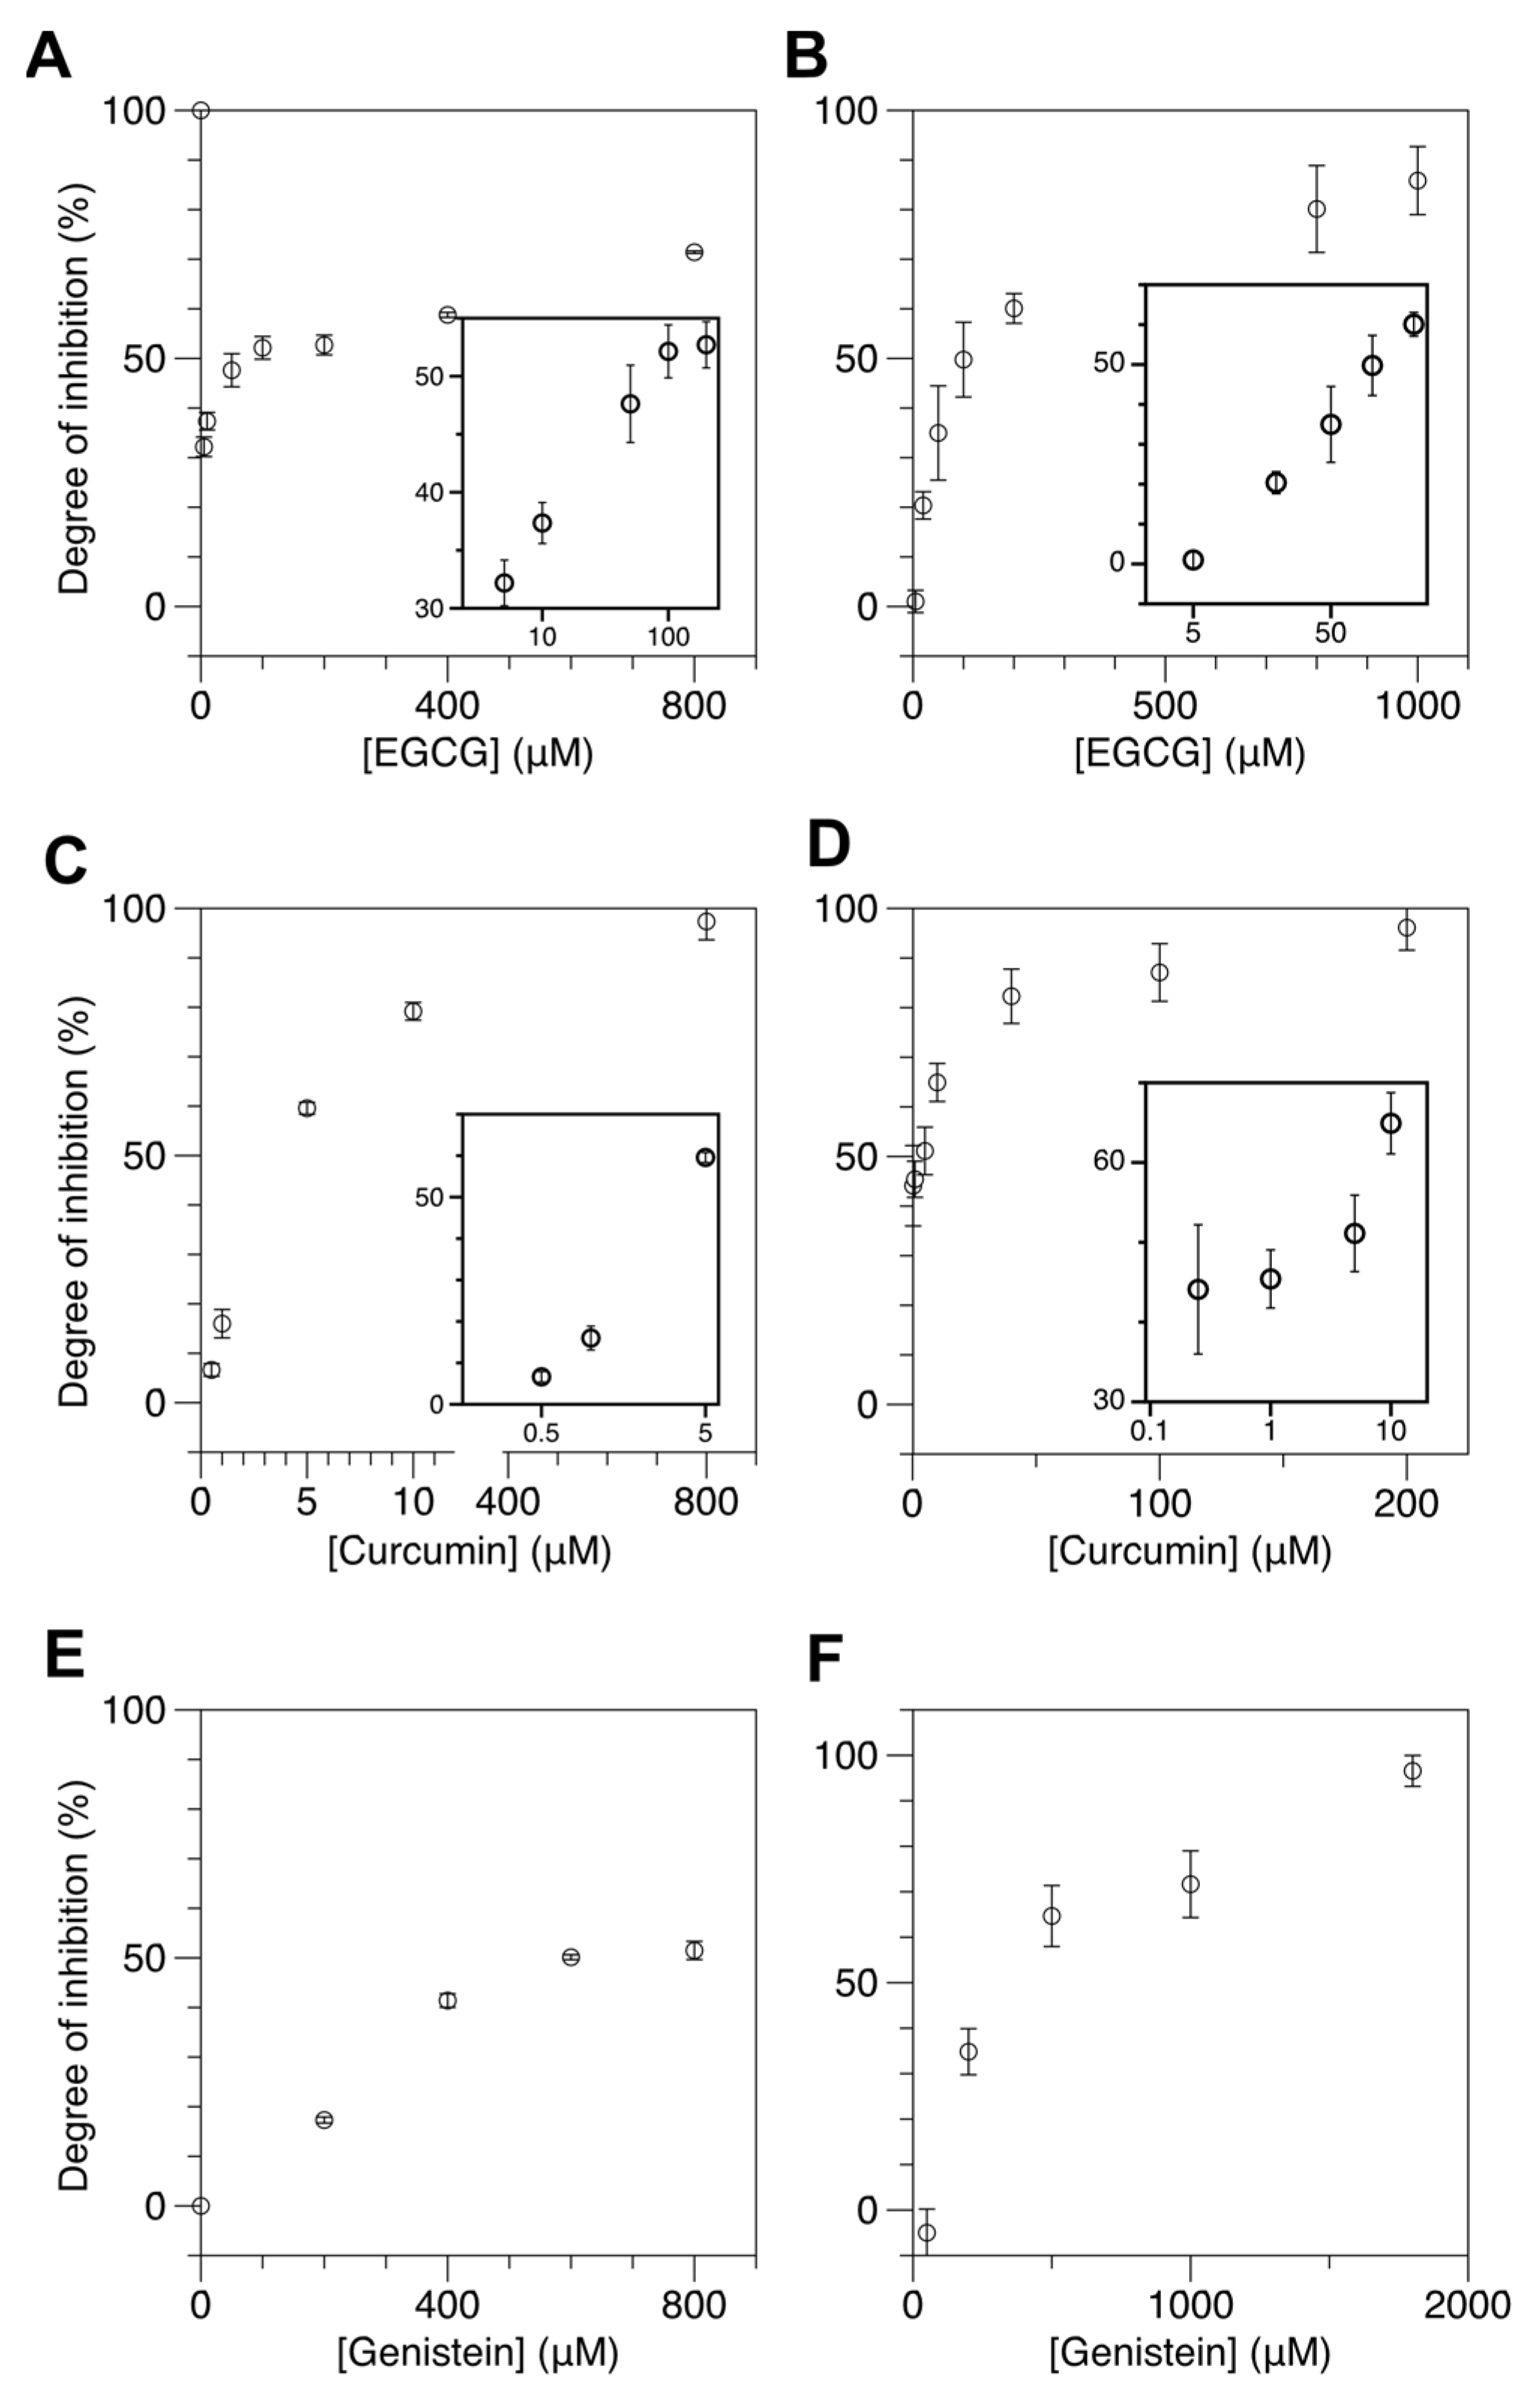
2.3. Natural Dietary Compounds Effectively Suppress the Methylation Activity of Both M.SssI and DNMT1
3. Materials and Methods
3.1. Preparation of DNA Samples, DNA Methyltransferases, and DMT Inhibitors

| DNA Oligonucleotides | DNA Cores | Core Composition |
|---|---|---|
| CG1(Cy5) | UM (0-0) | CG1-CG2 |
| CG2(biotin, Cy3) | QM (5-0) | m5CG1-CG2 |
| m5CG1(Cy5) | HM (11-0) | m11CG1-CG2 |
| m11CG1(Cy5) | TM (5-11) | m5CG1-m11CG2 |
| m11CG2(Cy3) | FM (11-11) | m11CG1-m11CG2 |
3.2. DNA Methylation Reactions
3.3. Single-Molecule FRET-Based DNA Methylation Assay
4. Conclusions
Supplementary Materials
Author Contributions
Funding
Institutional Review Board Statement
Informed Consent Statement
Data Availability Statement
Conflicts of Interest
References
- Jones, P.A.; Takai, D. The Role of DNA Methylation in Mammalian Epigenetics. Science 2001, 293, 1068–1070. [Google Scholar] [CrossRef]
- Bird, A. DNA Methylation Patterns and Epigenetic Memory. Genes Dev. 2002, 16, 6–21. [Google Scholar] [CrossRef]
- Issa, J.-P.J.; Kantarjian, H.M. Targeting DNA Methylation. Clin. Cancer Res. 2009, 15, 3938–3946. [Google Scholar] [CrossRef]
- Bröske, A.-M.; Vockentanz, L.; Kharazi, S.; Huska, M.R.; Mancini, E.; Scheller, M.; Kuhl, C.; Enns, A.; Prinz, M.; Jaenisch, R.; et al. DNA Methylation Protects Hematopoietic Stem Cell Multipotency from Myeloerythroid Restriction. Nat. Genet. 2009, 41, 1207–1215. [Google Scholar] [CrossRef]
- Yang, X.; Lay, F.; Han, H.; Jones, P.A. Targeting DNA Methylation for Epigenetic Therapy. Trends Pharmacol. Sci. 2010, 31, 536–546. [Google Scholar] [CrossRef] [PubMed]
- Bergman, Y.; Cedar, H. DNA Methylation Dynamics in Health and Disease. Nat. Struct. Mol. Biol. 2013, 20, 274–281. [Google Scholar] [CrossRef] [PubMed]
- Schübeler, D. Function and Information Content of DNA Methylation. Nature 2015, 517, 321–326. [Google Scholar] [CrossRef]
- Tycko, B. Epigenetic Gene Silencing in Cancer. J. Clin. Investig. 2000, 105, 401–407. [Google Scholar] [CrossRef] [PubMed][Green Version]
- Laird, P.W. The Power and the Promise of DNA Methylation Markers. Nat. Rev. Cancer 2003, 3, 253–266. [Google Scholar] [CrossRef]
- Feinberg, A.P.; Tycko, B. The History of Cancer Epigenetics. Nat. Rev. Cancer 2004, 4, 143–153. [Google Scholar] [CrossRef]
- Hlady, R.A.; Zhou, D.; Puszyk, W.; Roberts, L.R.; Liu, C.; Robertson, K.D. Initiation of Aberrant DNA Methylation Patterns and Heterogeneity in Precancerous Lesions of Human Hepatocellular Cancer. Epigenetics 2017, 12, 215–225. [Google Scholar] [CrossRef]
- Laird, P.W. Principles and Challenges of Genome-Wide DNA Methylation Analysis. Nat. Rev. Genet. 2010, 11, 191–203. [Google Scholar] [CrossRef] [PubMed]
- Bestor, T.H. The DNA Methyltransferases of Mammals. Hum. Mol. Genet. 2000, 9, 2395–2402. [Google Scholar] [CrossRef]
- Goll, M.G.; Bestor, T.H. Eukaryotic cytosine methyltransferases. Annu. Rev. Biochem. 2005, 74, 481–514. [Google Scholar] [CrossRef]
- Lyko, F. The DNA Methyltransferase Family: A Versatile Toolkit for Epigenetic Regulation. Nat. Rev. Genet. 2018, 19, 81–92. [Google Scholar] [CrossRef] [PubMed]
- Brunner, A.L.; Johnson, D.S.; Kim, S.W.; Valouev, A.; Reddy, T.E.; Neff, N.F.; Anton, E.; Medina, C.; Nguyen, L.; Chiao, E.; et al. Distinct DNA Methylation Patterns Characterize Differentiated Human Embryonic Stem Cells and Developing Human Fetal Liver. Genome Res. 2009, 19, 1044–1056. [Google Scholar] [CrossRef]
- Bock, C.; Beerman, I.; Lien, W.-H.; Smith, Z.D.; Gu, H.; Boyle, P.; Gnirke, A.; Fuchs, E.; Rossi, D.J.; Meissner, A. DNA Methylation Dynamics during In Vivo Differentiation of Blood and Skin Stem Cells. Mol. Cell 2012, 47, 633–647. [Google Scholar] [CrossRef]
- Lyko, F.; Brown, R. DNA Methyltransferase Inhibitors and the Development of Epigenetic Cancer Therapies. J. Natl. Cancer Inst. 2005, 97, 1498–1506. [Google Scholar] [CrossRef]
- Singh, V.; Sharma, P.; Capalash, N. DNA Methyltransferase-1 Inhibitors as Epigenetic Therapy for Cancer. Curr. Cancer Drug Targets 2013, 13, 379–399. [Google Scholar] [CrossRef]
- Svedruzic, Z. Mammalian Cytosine DNA Methyltransferase Dnmt1: Enzymatic Mechanism, Novel Mechanism-Based Inhibitors, and RNA-Directed DNA Methylation. Curr. Med. Chem. 2008, 15, 92–106. [Google Scholar] [CrossRef] [PubMed]
- Ceccaldi, A.; Rajavelu, A.; Champion, C.; Rampon, C.; Jurkowska, R.; Jankevicius, G.; Sénamaud-Beaufort, C.; Ponger, L.; Gagey, N.; Ali, H.D.; et al. C5-DNA Methyltransferase Inhibitors: From Screening to Effects on Zebrafish Embryo Development. Chembiochem 2011, 12, 1337–1345. [Google Scholar] [CrossRef] [PubMed]
- Frommer, M.; McDonald, L.E.; Millar, D.S.; Collis, C.M.; Watt, F.; Grigg, G.W.; Molloy, P.L.; Paul, C.L. A Genomic Sequencing Protocol That Yields a Positive Display of 5-Methylcytosine Residues in Individual DNA Strands. Proc. Natl. Acad. Sci. USA 1992, 89, 1827–1831. [Google Scholar] [CrossRef] [PubMed]
- Herman, J.G.; Graff, J.R.; Myöhänen, S.; Nelkin, B.D.; Baylin, S.B. Methylation-Specific PCR: A Novel PCR Assay for Methylation Status of CpG Islands. Proc. Natl. Acad. Sci. USA 1996, 93, 9821–9826. [Google Scholar] [CrossRef] [PubMed]
- Woo, Y.-H.; Rajagopalan, P.T.R.; Benkovic, S.J. A Nonradioactive DNA Methyltransferase Assay Adaptable to High-Throughput Screening. Anal. Biochem. 2005, 340, 336–340. [Google Scholar] [CrossRef]
- Clark, S.J.; Statham, A.; Stirzaker, C.; Molloy, P.L.; Frommer, M. DNA Methylation: Bisulphite Modification and Analysis. Nat. Protoc. 2006, 1, 2353–2364. [Google Scholar] [CrossRef]
- Li, J.; Yan, H.; Wang, K.; Tan, W.; Zhou, X. Hairpin Fluorescence DNA Probe for Real-Time Monitoring of DNA Methylation. Anal. Chem. 2007, 79, 1050–1056. [Google Scholar] [CrossRef]
- Ye, Y.; Stivers, J.T. Fluorescence-Based High-Throughput Assay for Human DNA (Cytosine-5)-Methyltransferase 1. Anal. Biochem. 2010, 401, 168–172. [Google Scholar] [CrossRef][Green Version]
- Wood, R.J.; McKelvie, J.C.; Maynard-Smith, M.D.; Roach, P.L. A Real-Time Assay for CpG-Specific Cytosine-C5 Methyltransferase Activity. Nucleic Acids Res. 2010, 38, e107. [Google Scholar] [CrossRef]
- Li, W.; Liu, Z.; Lin, H.; Nie, Z.; Chen, J.; Xu, X.; Yao, S. Label-Free Colorimetric Assay for Methyltransferase Activity Based on a Novel Methylation-Responsive DNAzyme Strategy. Anal. Chem. 2010, 82, 1935–1941. [Google Scholar] [CrossRef]
- Patterson, K.; Molloy, L.; Qu, W.; Clark, S. DNA Methylation: Bisulphite Modification and Analysis. J. Vis. Exp. 2011, e3170. [Google Scholar] [CrossRef]
- Wang, M.; Xu, Z.; Chen, L.; Yin, H.; Ai, S. Electrochemical Immunosensing Platform for DNA Methyltransferase Activity Analysis and Inhibitor Screening. Anal. Chem. 2012, 84, 9072–9078. [Google Scholar] [CrossRef]
- Zeng, Y.; Hu, J.; Long, Y.; Zhang, C. Sensitive Detection of DNA Methyltransferase Using Hairpin Probe-Based Primer Generation Rolling Circle Amplification-Induced Chemiluminescence. Anal. Chem. 2013, 85, 6143–6150. [Google Scholar] [CrossRef]
- Bi, S.; Zhao, T.; Luo, B.; Zhu, J.-J. Hybridization Chain Reaction-Based Branched Rolling Circle Amplification for Chemiluminescence Detection of DNA Methylation. Chem. Commun. 2013, 49, 6906–6908. [Google Scholar] [CrossRef]
- Liu, W.; Lai, H.; Huang, R.; Zhao, C.; Wang, Y.; Weng, X.; Zhou, X. DNA Methyltransferase Activity Detection Based on Fluorescent Silver Nanocluster Hairpin-Shaped DNA Probe with 5’-C-Rich/G-Rich-3’ Tails. Biosens. Bioelectron. 2015, 68, 736–740. [Google Scholar] [CrossRef] [PubMed]
- Xia, Y.; Wu, L.; Hu, Y.; He, Y.; Cao, Z.; Zhu, X.; Yi, X.; Wang, J. Sensitive Surface Plasmon Resonance Detection of Methyltransferase Activity and Screening of Its Inhibitors Amplified by p53 Protein Bound to Methylation-Specific ds-DNA Consensus Sites. Biosens. Bioelectron. 2019, 126, 269–274. [Google Scholar] [CrossRef] [PubMed]
- Lu, L.; Patel, H.; Bissler, J.J. Optimizing DpnI Digestion Conditions to Detect Replicated DNA. Biotechniques 2002, 33, 316–318. [Google Scholar] [CrossRef]
- Deng, H.; Yang, X.; Yeo, S.P.X.; Gao, Z. Highly Sensitive Electrochemical Methyltransferase Activity Assay. Anal. Chem. 2014, 86, 2117–2123. [Google Scholar] [CrossRef] [PubMed]
- Zhang, H.; Zhang, K.; Yao, Y.; Liu, Y.; Ji, J.; Huang, X.; Liu, J.; Liu, B. Single-Molecule Fluorescence Imaging for Ultrasensitive DNA Methyltransferase Activity Measurement and Inhibitor Screening. Anal. Chem. 2019, 91, 9500–9507. [Google Scholar] [CrossRef] [PubMed]
- Dorgan, K.M.; Wooderchak, W.L.; Wynn, D.P.; Karschner, E.L.; Alfaro, J.F.; Cui, Y.; Zhou, Z.S.; Hevel, J.M. An Enzyme-Coupled Continuous Spectrophotometric Assay for S-adenosylmethionine-dependent Methyltransferases. Anal. Biochem. 2006, 350, 249–255. [Google Scholar] [CrossRef]
- Poh, W.J.; Wee, C.P.P.; Gao, Z. DNA Methyltransferase Activity Assays: Advances and Challenges. Theranostics 2016, 6, 369–391. [Google Scholar] [CrossRef]
- Syedmoradi, L.; Esmaeili, F.; Norton, M.L. Towards DNA Methylation Detection Using Biosensors. Analyst 2016, 141, 5922–5943. [Google Scholar] [CrossRef] [PubMed]
- Krejcova, L.; Richtera, L.; Hynek, D.; Labuda, J.; Adam, V. Current Trends in Electrochemical Sensing and Biosensing of DNA Methylation. Biosens. Bioelectron. 2017, 97, 384–399. [Google Scholar] [CrossRef]
- Shim, J.; Humphreys, G.I.; Venkatesan, B.M.; Munz, J.M.; Zou, X.; Sathe, C.; Schulten, K.; Kosari, F.; Nardulli, A.M.; Vasmatzis, G.; et al. Detection and Quantification of Methylation in DNA Using Solid-State Nanopores. Sci. Rep. 2013, 3, 1389. [Google Scholar] [CrossRef] [PubMed]
- Shim, J.; Kim, Y.; Humphreys, G.I.; Nardulli, A.M.; Kosari, F.; Vasmatzis, G.; Taylor, W.R.; Ahlquist, D.A.; Myong, S.; Bashir, R. Nanopore-Based Assay for Detection of Methylation in Double-Stranded DNA Fragments. ACS Nano 2015, 9, 290–300. [Google Scholar] [CrossRef] [PubMed]
- Wang, Y.; Zhang, Y.; Guo, Y.; Kang, X. Fast and Precise Detection of DNA Methylation with Tetramethylammonium-Filled Nanopore. Sci. Rep. 2017, 7, 183. [Google Scholar] [CrossRef] [PubMed]
- Behe, M.; Felsenfeld, G. Effects of Methylation on a Synthetic Polynucleotide: The B-Z Transition in Poly(dG-m5dC)∙Poly(dG-m5dC). Proc. Natl. Acad. Sci. USA 1981, 78, 1619–1623. [Google Scholar] [CrossRef]
- Klysik, J.; Stirdivant, S.M.; Singleton, C.K.; Zacharias, W.; Wells, R.D.; Gellert, M. Effects of 5 Cytosine Methylation on the B-Z Transition in DNA Restriction Fragments and Recombinant Plasmids. J. Mol. Biol. 1983, 168, 51–71. [Google Scholar] [CrossRef]
- Rich, A.; Nordheim, A.; Wang, A.H.J. The Chemistry and Biology of Left-Handed Z-DNA. Annu. Rev. Biochem. 1984, 53, 791–846. [Google Scholar] [CrossRef]
- Lee, M.; Kim, S.H.; Hong, S.-C. Minute Negative Superhelicity Is Sufficient to Induce the B-Z Transition in the Presence of Low Tension. Proc. Natl. Acad. Sci. USA 2010, 107, 4985–4990. [Google Scholar] [CrossRef]
- Huang, J.; Ying, L.; Yang, X.; Yang, Y.; Quan, K.; Wang, H.; Xie, N.; Ou, M.; Zhou, Q.; Wang, K. Ratiometric Fluorescent Sensing of pH Values in Living Cells by Dual-Fluorophore-Labeled i-Motif Nanoprobes. Anal. Chem. 2015, 87, 8724–8731. [Google Scholar] [CrossRef]
- Mandal, S.; Selvam, S.; Shrestha, P.; Mao, H. Mechanochemical Sensing of Single and Few Hg(II) Ions Using Polyvalent Principles. Anal. Chem. 2016, 88, 9479–9485. [Google Scholar] [CrossRef] [PubMed]
- Milo, R.; Phillips, R. Cell Biology by the Numbers; Garland Science: New York, NY, USA, 2015. [Google Scholar]
- Renbaum, P.; Abrahamove, D.; Fainsod, A.; Wilson, G.G.; Rottem, S.; Razin, A. Cloning, Characterization, and Expression in Escherichia coli of the Gene Coding for the CpG DNA Methylase from Spiroplasma sp. strain MQ1(M∙Sssl). Nucleic Acids Res. 1990, 18, 1145–1152. [Google Scholar] [CrossRef]
- Koudan, E.V.; Bujnicki, J.M.; Gromova, E.S. Homology Modeling of the CG-specific DNA Methyltransferase SssI and Its Complexes with DNA and AdoHcy. J. Biomol. Struct. Dyn. 2004, 22, 339–345. [Google Scholar] [CrossRef] [PubMed]
- Wojciechowski, M.; Czapinska, H.; Bochtler, M. CpG Underrepresentation and the Bacterial CpG-Specific DNA Methyltransferase M.MpeI. Proc. Natl. Acad. Sci. USA 2013, 110, 105–110. [Google Scholar] [CrossRef]
- Albert, P.; Varga, B.; Zsibrita, N.; Kiss, A. Circularly Permuted Variants of Two CG-Specific Prokaryotic DNA Methyltransferases. PLoS ONE 2018, 13, e0197232. [Google Scholar] [CrossRef] [PubMed]
- Lee, W.J.; Shim, J.-Y.; Zhu, B.T. Mechanisms for the Inhibition of DNA Methyltransferases by Tea Catechins and Bioflavonoids. Mol. Pharmacol. 2005, 68, 1018–1030. [Google Scholar] [CrossRef]
- Parashar, G.; Parashar, N.C.; Capalash, N. Curcumin Causes Promoter Hypomethylation and Increased Expression of FANCF Gene in SiHa Cell Line. Mol. Cell. Biochem. 2012, 365, 29–35. [Google Scholar] [CrossRef]
- Fahy, J.; Jeltsch, A.; Arimondo, P.B. DNA Methyltransferase Inhibitors in Cancer: A Chemical and Therapeutic Patent Overview and Selected Clinical Studies. Expert Opin. Ther. Pat. 2012, 22, 1427–1442. [Google Scholar] [CrossRef] [PubMed]
- Zhao, H.; Wang, L.; Jiang, W. Target-Protected Dumbbell Molecular Probe Mediated Cascade Rolling Circle Amplification Strategy for the Sensitive Assay of DNA Methyltransferase Activity. Chem. Commun. 2016, 52, 2517–2520. [Google Scholar] [CrossRef]
- Gao, F.; Fan, T.; Ou, S.; Wu, J.; Zhang, X.; Luo, J.; Li, N.; Yao, Y.; Mou, Y.; Liao, X.; et al. Highly Efficient Electrochemical Sensing Platform for Sensitive Detection DNA Methylation, and Methyltransferase Activity Based on Ag NPs Decorated Carbon Nanocubes. Biosens. Bioelectron. 2018, 99, 201–208. [Google Scholar] [CrossRef] [PubMed]
- Pradhan, S.; Roberts, R.J.; Bacolla, A.; Wells, R.D. Recombinant Human DNA (Cytosine-5) Methyltransferase I. Expression, purification, and comparison of de novo and maintenance methylation. J. Biol. Chem. 1999, 274, 33002–33010. [Google Scholar] [CrossRef]
- Fang, M.Z.; Wang, Y.; Ai, N.; Hou, Z.; Sun, Y.; Lu, H.; Welsh, W.; Yang, C.S. Tea Polyphenol (-)-Epigallocatechin-3-Gallate Inhibits DNA Methyltransferase and Reactivates Methylation-Silenced Genes in Cancer Cell Lines. Cancer Res 2003, 63, 7563–7570. [Google Scholar] [PubMed]
- Borutinskaitė, V.; Virkšaitė, A.; Gudelytė, G.; Navakauskienė, R. Green Tea Polyphenol EGCG Causes Anti-Cancerous Epigenetic Modulations in Acute Promyelocytic Leukemia Cells. Leuk. Lymphoma 2018, 59, 469–478. [Google Scholar] [CrossRef] [PubMed]
- Pogribny, I.P.; Pogribna, M.; Christman, J.K.; James, S.J. Single-Site Methylation within the p53 Promoter Region Reduces Gene Expression in a Reporter Gene Construct: Possible in Vivo Relevance during Tumorigenesis. Cancer Res. 2000, 60, 588–594. [Google Scholar] [PubMed]
- Roach, H.I.; Yamada, N.; Cheung, K.S.C.; Tilley, S.; Clarke, N.M.P.; Oreffo, R.O.C.; Kokubun, S.; Bronner, F. Association between the Abnormal Expression of Matrix-degrading Enzymes by Human Osteoarthritic Chondrocytes and Demethylation of Specific CpG Sites in the Promoter Regions. Arthritis Rheum. 2005, 52, 3110–3124. [Google Scholar] [CrossRef]
- Steve, P.; Moore, H.R.; Meehan, R.R.; Young, L.E. Nuclear Reprogramming, Methods and Protocols. Methods Mol. Biol. 2006, 325, 239–249. [Google Scholar] [CrossRef]
- Liu, Z.; Xie, Z.; Jones, W.; Pavlovicz, R.E.; Liu, S.; Yu, J.; Li, P.; Lin, J.; Fuchs, J.R.; Marcucci, G.; et al. Curcumin Is a Potent DNA Hypomethylation Agent. Bioorg. Med. Chem. Lett. 2009, 19, 706–709. [Google Scholar] [CrossRef] [PubMed]
- Yu, J.; Peng, Y.; Wu, L.-C.; Xie, Z.; Deng, Y.; Hughes, T.; He, S.; Mo, X.; Chiu, M.; Wang, Q.-E.; et al. Curcumin Down-Regulates DNA Methyltransferase 1 and Plays an Anti-Leukemic Role in Acute Myeloid Leukemia. PLoS ONE 2013, 8, e55934. [Google Scholar] [CrossRef]
- Link, A.; Balaguer, F.; Shen, Y.; Lozano, J.J.; Leung, H.-C.E.; Boland, C.R.; Goel, A. Curcumin Modulates DNA Methylation in Colorectal Cancer Cells. PLoS ONE 2013, 8, e57709. [Google Scholar] [CrossRef] [PubMed]
- Maugeri, A.; Mazzone, M.G.; Giuliano, F.; Vinciguerra, M.; Basile, G.; Barchitta, M.; Agodi, A. Curcumin Modulates DNA Methyltransferase Functions in a Cellular Model of Diabetic Retinopathy. Oxid. Med. Cell. Longev. 2018, 2018, 5407482. [Google Scholar] [CrossRef] [PubMed]
- Li, Y.; Liu, L.; Andrews, L.G.; Tollefsbol, T.O. Genistein Depletes Telomerase Activity through Cross-talk between Genetic and Epigenetic Mechanisms. Int. J. Cancer 2009, 125, 286–296. [Google Scholar] [CrossRef] [PubMed]
- Xie, Q.; Bai, Q.; Zou, L.; Zhang, Q.; Zhou, Y.; Chang, H.; Yi, L.; Zhu, J.; Mi, M. Genistein Inhibits DNA Methylation and Increases Expression of Tumor Suppressor Genes in Human Breast Cancer Cells. Genes Chromosom. Cancer 2014, 53, 422–431. [Google Scholar] [CrossRef]
- Kim, S.H.; Lim, S.-H.; Lee, A.-R.; Kwon, D.H.; Song, H.K.; Lee, J.-H.; Cho, M.; Johner, A.; Lee, N.-K.; Hong, S.-C. Unveiling the Pathway to Z-DNA in the Protein-Induced B–Z Transition. Nucleic Acids Res. 2018, 46, 4129–4137. [Google Scholar] [CrossRef] [PubMed]
- Gros, C.; Chauvigné, L.; Poulet, A.; Menon, Y.; Ausseil, F.; Dufau, I.; Arimondo, P.B. Development of a Universal Radioactive DNA Methyltransferase Inhibition Test for High-Throughput Screening and Mechanistic Studies. Nucleic Acids Res. 2013, 41, e185. [Google Scholar] [CrossRef]
- Ha, T. Single-Molecule Fluorescence Resonance Energy Transfer. Methods 2001, 25, 78–86. [Google Scholar] [CrossRef]
- Roy, R.; Hohng, S.; Ha, T. A Practical Guide to Single-Molecule FRET. Nat. Methods 2008, 5, 507–516. [Google Scholar] [CrossRef] [PubMed]
- Hellenkamp, B.; Schmid, S.; Doroshenko, O.; Opanasyuk, O.; Kühnemuth, R.; Adariani, S.R.; Ambrose, B.; Aznauryan, M.; Barth, A.; Birkedal, V.; et al. Precision and Accuracy of Single-Molecule FRET Measurements—A Multi-Laboratory Benchmark Study. Nat. Methods 2018, 15, 669–676. [Google Scholar] [CrossRef] [PubMed]


Publisher’s Note: MDPI stays neutral with regard to jurisdictional claims in published maps and institutional affiliations. |
© 2021 by the authors. Licensee MDPI, Basel, Switzerland. This article is an open access article distributed under the terms and conditions of the Creative Commons Attribution (CC BY) license (https://creativecommons.org/licenses/by/4.0/).
Share and Cite
Kim, S.H.; Jung, H.J.; Hong, S.-C. Z-DNA as a Tool for Nuclease-Free DNA Methyltransferase Assay. Int. J. Mol. Sci. 2021, 22, 11990. https://doi.org/10.3390/ijms222111990
Kim SH, Jung HJ, Hong S-C. Z-DNA as a Tool for Nuclease-Free DNA Methyltransferase Assay. International Journal of Molecular Sciences. 2021; 22(21):11990. https://doi.org/10.3390/ijms222111990
Chicago/Turabian StyleKim, Sook Ho, Hae Jun Jung, and Seok-Cheol Hong. 2021. "Z-DNA as a Tool for Nuclease-Free DNA Methyltransferase Assay" International Journal of Molecular Sciences 22, no. 21: 11990. https://doi.org/10.3390/ijms222111990
APA StyleKim, S. H., Jung, H. J., & Hong, S.-C. (2021). Z-DNA as a Tool for Nuclease-Free DNA Methyltransferase Assay. International Journal of Molecular Sciences, 22(21), 11990. https://doi.org/10.3390/ijms222111990