Article

Quantitative FRET Microscopy Reveals a Crucial Role of Cytoskeleton in Promoting PI(4,5)P2 Confinement

1
Centro de Química-Física Molecular and Institute of Nanoscience and Nanotechnology, Instituto Superior Técnico, University of Lisbon, 1049-001 Lisbon, Portugal
2
IBB-Institute for Bioengineering and Biosciences, Instituto Superior Técnico, University of Lisbon, 1049-001 Lisbon, Portugal
3
Associate Laboratory i4HB—Institute for Health and Bioeconomy at Instituto Superior Técnico, Universidade de Lisboa, Av. Rovisco Pais, 1049-001 Lisbon, Portugal
4
Departamento de Química e Bioquímica, Faculty of Sciences, University of Lisbon, 1749-016 Lisbon, Portugal
5
Department of Bioengineering, Instituto Superior Técnico, University of Lisbon, 1049-001 Lisbon, Portugal
*
Authors to whom correspondence should be addressed.
Current address: Instituto de Medicina Molecular, Faculty of Medicine, University of Lisbon, Av. Prof. Egas Moniz, 1649-028 Lisbon, Portugal.
Int. J. Mol. Sci. 2021, 22(21), 11727; https://doi.org/10.3390/ijms222111727
Submission received: 1 September 2021 / Revised: 24 October 2021 / Accepted: 26 October 2021 / Published: 29 October 2021
(This article belongs to the Special Issue Raft Microdomains and Cell Signaling)

Abstract

:
Phosphatidylinositol 4,5-bisphosphate (PI(4,5)P2) is an essential plasma membrane component involved in several cellular functions, including membrane trafficking and cytoskeleton organization. This function multiplicity is partially achieved through a dynamic spatiotemporal organization of PI(4,5)P2 within the membrane. Here, we use a Förster resonance energy transfer (FRET) approach to quantitatively assess the extent of PI(4,5)P2 confinement within the plasma membrane. This methodology relies on the rigorous evaluation of the dependence of absolute FRET efficiencies between pleckstrin homology domains (PHPLCδ) fused with fluorescent proteins and their average fluorescence intensity at the membrane. PI(4,5)P2 is found to be significantly compartmentalized at the plasma membrane of HeLa cells, and these clusters are not cholesterol-dependent, suggesting that membrane rafts are not involved in the formation of these nanodomains. On the other hand, upon inhibition of actin polymerization, compartmentalization of PI(4,5)P2 is almost entirely eliminated, showing that the cytoskeleton network is the critical component responsible for the formation of nanoscale PI(4,5)P2 domains in HeLa cells.

1. Introduction

PI(4,5)P2 is the most abundant polyphosphoinositide in the inner leaflet of the plasma membrane of mammalian cells (~1 mol%) [1], and is crucial to a multitude of cellular processes, including membrane trafficking, signal transduction, ion channel function, and cytoskeleton dynamics [2]. Protein-induced clustering of PI(4,5)P2 has been shown to occur even in membrane model systems [3,4]. Similarly, divalent cations, such as Mg2+ and Ca2+, were also shown to induce clustering of PI(4,5)P2 in liposomes [5,6,7,8,9].
Enrichment of PI(4,5)P2 within large (μm-sized) plasma membrane patches was already observed through confocal microscopy of PI(4,5)P2-binding domains and antibodies [10,11]. These patches colocalized with regions of increased exocytic activity, suggesting that these μm-sized PI(4,5)P2 clusters are associated with specialized endocytic/exocytic structures [10,11]. PI(4,5)P2-enriched plasma membrane patches (PRMPs) of similar dimensions were also observed in focal adhesion points and sites of extensive membrane ruffling [12,13,14].
PI(4,5)P2 confinement in the plasma membrane has been confirmed through different methods, including super-resolution fluorescence imaging of pleckstrin homology domains fused with fluorescent proteins (PHPLCδ-FP) [15], anti-PI(4,5)P2 antibodies [16], and PI(4,5)P2 fluorescent analogues [17,18]. Sphingomyelin-dependent nanoscale clustering of PI(4,5)P2 was also proposed in HeLa cells, suggesting association to membrane rafts in the outer leaflet of the plasma membrane [19]. Recently, compartmentalization of PI(4,5)P2 metabolism into plasma membrane/liquid ordered/raft domains was suggested [20]. Additionally, pools of clustered PI(4,5)P2 were detected by electron microscopy (EM), associated with caveolae and the clathrin-coated pit in human fibroblasts and mouse smooth muscle cells [21].
Nevertheless, in undifferentiated areas of the membrane and at the nanoscale, the presence of PI(4,5)P2 clusters or domains is not universally observed. In a recent study, single-molecule super-resolution imaging of live insulin-secreting INS-1 cells detected no significant nanoscale PI(4,5)P2 clustering and only 200–500 nm sparse patches of moderately increased PI(4,5)P2 concentration were observed [22]. Another EM study also proposed a homogeneous distribution of PI(4,5)P2 in HEK293 cells [23].
The observation of PI(4,5)P2 clusters through standard optical imaging techniques is challenging and some of the reported structures of this type are likely the result of artefacts, as described elsewhere [23,24,25]. In this context, FRET is particularly powerful for the characterization of the nanoscale organization of biomembranes [26] and its application to live cell imaging is relatively straightforward and free of the artefacts noted above. FRET imaging with PHPLCδ-FPs has in fact been used to monitor changes in PI(4,5)P2 content at the plasma membrane [23,27]. The lateral diffusion of PHPLCδ-FPs is comparable to that of PI(4,5)P2 [28,29], and their distribution mirrors that of fluorescently labelled PI(4,5)P2 [14]. Hence, PHPLCδ-FPs are well suited to monitor PI(4,5)P2 dynamics in live cells. FRET studies using PHPLCδ-FP domains focused on recovering qualitative information regarding kinetic changes of PI(4,5)P2 levels within the plasma membrane, reflecting variations in the activity of the enzymes associated with the metabolism of this phospholipid [30,31,32]. The main challenge associated to this method is the difficulty in interpreting FRET efficiency (EFRET) values. In fact, since FRET takes place between non-interacting proteins (so-called “bystander FRET”), it is directly dependent on acceptor expression levels [33,34], and no quantitative information on PI(4,5)P2 organization is recovered from these measurements. Here, we make use of a FRET imaging methodology based on the analysis of the dependence of EFRET with acceptor PHPLCδ-EYFP fluorescence intensity (IF (PH-EYFP)) in the plasma membrane of different cell types.
Previous studies have showed that the FRET efficiencies between non-interacting proteins in membranes are well described by available theoretical models for FRET in two dimensions [35,36]. The analysis of EFRET vs. IF (PH-EYFP) profiles, in the context of existing analytical solutions for the problem of FRET in a plane, is expected to allow for the estimation of average confinement of PHPLCδ domains in the plasma membrane. The robustness of the method is confirmed through the analysis of PH confinement using two different FRET pairs. This strategy was used to address the impact of raft-like membrane patches and the actin cytoskeleton on the organization of PI(4,5)P2 confinement in flat undifferentiated regions of the plasma membrane of HeLa cells.

2. Results

2.1. 2D FRET between Non-Compartmentalized Proteins Shows a Linear Dependence with Acceptor Concentration in the Low FRET Range

While measurements of FRET between PHPLCδ-FP domains have been successfully employed to monitor fluctuations of PI(4,5)P2 levels in the plasma membrane [23], these measurements fail in quantifying the extent of PI(4,5)P2 compartmentalization. In fact, FRET between non-interacting partners, such as observed for PHPLCδ-FP domains within the plasma membrane, is heavily dependent on the concentration of acceptors in the vicinity of donors [36]. As a result, in a FRET experiment employing PHPLCδ-FP domains, results are intrinsically associated to expression levels of the PHPLCδ-FP acceptor and no quantitative information regarding the distribution of PI(4,5)P2 can be recovered from the measurement of an isolated EFRET value. On the other hand, donor concentrations have no impact on FRET efficiencies, and levels of PHPLCδ-FP donor do not need to be controlled.
For this work, the donor–acceptor FRET pairs chosen were CFP/YFP, and mTurquoise/YFP. Both of these fluorescence protein pairs demonstrate considerable spectral overlap between donor emission and acceptor absorbance (Figures S1 and S2 of the Supplementary Materials), a necessary condition for FRET.
From analytical models of FRET efficiency between donors and acceptors distributed homogeneously within a two-dimensional plane [37,38], it can be inferred that EFRET displays a fully linear relationship with acceptor densities up to a concentration of 8000 molecules/μm2 (Figure S3a,b of the Supplementary Materials). This is true for any FRET pair and Förster radius ( R 0 ) value. Since the average surface density of basal PI(4,5)P2 in the inner leaflet of the plasma membrane of an eukaryotic cell was estimated at approximately 4000–5000 molecules/µm2 [27,39], we can be confident that FRET efficiency values between PHPLCδ-FP domains in the plasma membrane must show a linear dependence on the acceptor fluorescence intensity in case of no compartmentalization.
FRET efficiencies obtained from the analytical model were in full agreement with the Monte Carlo (MC) simulations for FRET in the same systems (Figure S3c). Due to the peptide linker, fluorescent proteins within the PHPLCδ-FP bound to the plasma membrane are expected to fluctuate around an average position. MC simulations were then used to estimate the impact that considerable fluctuations in the position of the acceptor EYFP (±15 Å) around an average position would have on EFRET. The results confirm that the impact of PHPLCδ-FP fluctuations around an average position is negligible for this system (Figure S3d), since R 0 values are considerably greater than the maximum displacement. This validates the two-dimensional approximation for FRET between PH domains in case the plasma membrane exhibits moderate curvature in the measured areas. Modeling of FRET between non-interacting PH domains, both the analytical model and the MC simulations, is described in detail in the Section 1 of the Supplementary Materials.
In order to confirm that FRET within the plasma membrane of the cells to be used in this study can be approximated by the 2D model, we evaluated their nanoscale ruffling. While at the microscale, it is evident that both HEK293T and HeLa cells exhibit large sections of flat undifferentiated plasma membrane, it is impossible to judge from optical data alone if there is any nanoscale ruffling. Linear dichroism (LD) measurements of the membrane probe DiOC18(3) were previously shown to be highly useful for the characterization of the extent of plasma membrane curvature or ruffling [40,41]. LD describes for a given molecule how the transmittance of linearly polarized light depends on the orientation of polarization and can be used as a tool to detect the presence of nanoscale membrane ruffling. The lipid probe DiOC18(3) binds to cell membranes with the transition dipole oriented parallel to the membrane surface [40] (Figure 1a). Thus, for non-ruffled membranes, the LDr value of DiOC18(3) should be defined by the angle between the membrane normal and the experiment axis. However, in the presence of plasma membrane ruffles or intracellular vesicles in the vicinity of the plasma membrane, insertion of DiOC18(3) within these structures leads to the randomization of DiOC18(3) orientations. Consequently, LDr values approach 0 and become independent of the membrane normal angle (Figure 1b). In this way, LDr values at the plasma membrane are expected to be heavily dependent on the membrane orientation only if little or no ruffling, as well as neighboring intracellular vesicles, are present. For normalization, LD values can be divided by the isotropic absorbance, yielding the reduced linear dichroism (LDr, see Section 2 of the Supplementary Materials for details).
We measured LDr values for DiOC18(3) in both HEK293T and HeLa cells at several regions of interest (ROIs) of the plasma membrane within the equatorial optical section of the cell (Figure 1c). Selected ROIs corresponded to apparently flat undifferentiated areas of the plasma membrane. LDr values are plotted as a function of the plasma membrane orientation relative to excitation polarization (Figure 1d,e), as determined by visual inspection of confocal images of total DiOC18(3) fluorescence (Figure 1c). Results for the flat undifferentiated sections of the plasma membrane of both HEK293T and HeLa cells are clearly indicative of moderate or absent nanoscale ruffling (Figure 1d,e), as LDr values of DiOC18(3) are shown to be highly dependent on membrane orientation. In these conditions, we can expect that FRET within the plasma membrane of both HEK293T and HeLa cells to be well described by a 2D approximation.

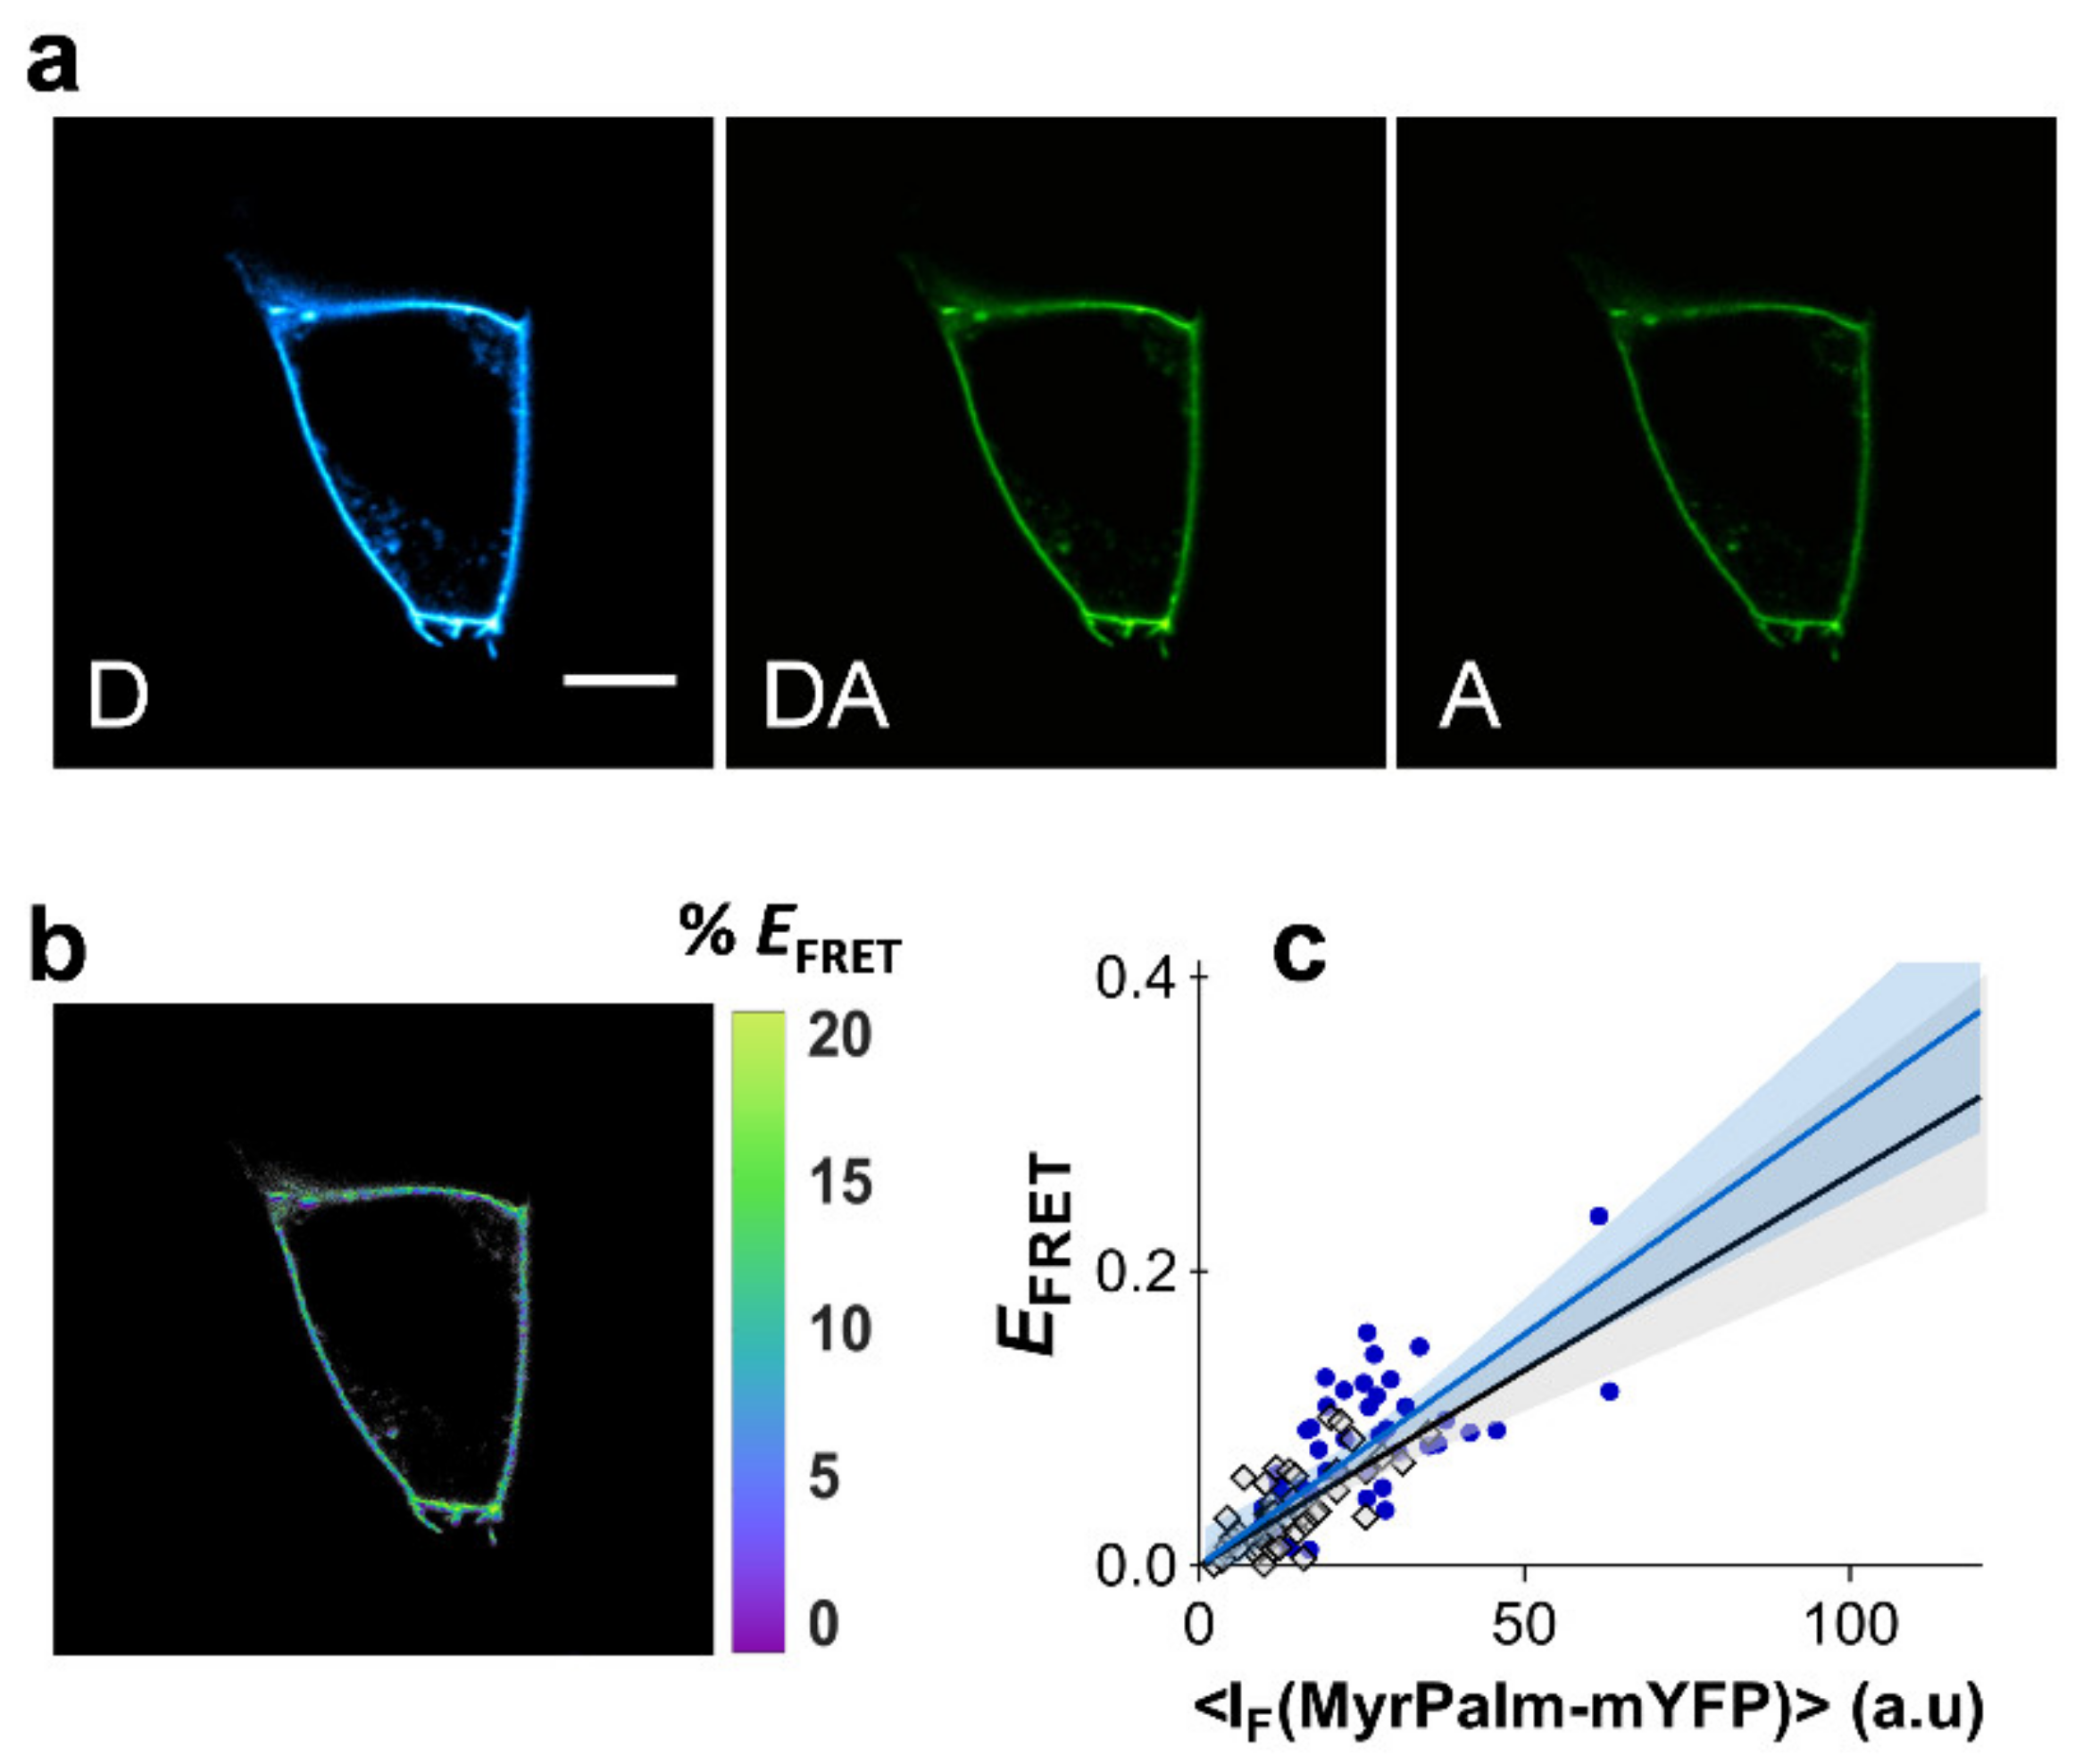
2.2. Bystander FRET in the Absence of Compartmentalization

While the simulations presented in Figure S3 provide a model for the change of FRET efficiency with acceptor density, they cannot be directly compared to experimental data to determine if a given protein FRET pair is clustering. In fact, there is considerable uncertainty regarding several of the simulation parameters, such as the acceptor exclusion radius around the donor, which will have a significant impact on final FRET efficiencies, and is expected to be heavily dictated, not only by steric hindrance, but also by protein dynamics. Additionally, to directly compare the results of theoretical simulations and experimental data obtained in living cells, extensive calibration of both acceptor signal and confocal imaging conditions must be carried out, which can be a significant source of uncertainty for the quantification of compartmentalization.
On the other hand, since acceptor fluorescence intensity values (IF(Acceptor)) are directly proportional to the concentrations of that specie, representation of FRET efficiency relative to acceptor fluorescence intensities are also expected to show linearity. In the case of a homogeneous distribution of donors and acceptors, the slope of this relationship ( k N C , Equation (1)) defines the FRET signature of non-interacting and non-compartmentalized proteins in the plasma membrane and deviations from this value would reflect compartmentalization.
E FRET N C = k N C · I F A c c e p t o r
In order to evaluate the FRET dependence with acceptor fluorescence intensity in the absence of compartmentalization, experiments were first carried out with acylated CFP and YFP. Fusion constructs based on the fluorescent proteins and an acylation substrate sequence from the 13 NH2-terminal residues of the kinase Lyn were used [42]. The constructs myrpalm-mCFP and myrpalm-mYFP partition readily to the plasma membrane, showing a non-linear dependence of FRET with acceptor density upon clustering of the constructs within Madin-Darby canine kidney (MDCK) cells [42]. In that study, clustering was disrupted by cholesterol extraction, giving rise to a clear linear dependence of FRET efficiency with acceptor density [42].
It is therefore possible to employ the acylated fluorescent proteins to quantify dependence of FRET efficiency with acceptor intensity. In order to achieve this, myrpalm-mCFP and myrpalm-mYFP were co-expressed in both HEK293T and HeLa cells and FRET was measured using the three-filter cube FRET microscopy approach (Figure 2a,b, see Section 4 for details) [43]. The areas of the plasma membrane selected for FRET analysis were only flat undifferentiated regions, where no heterogeneities were visible in the confocal microscope. EFRET values were determined as a function of myrpalm-mYFP fluorescence intensity (Figure 2c). Each datum point corresponds to the FRET efficiency at a segment of the plasma membrane of an individual cell (at equatorial optical sections), and each cell is only measured once in a representative area. The recovered FRET efficiencies show a markedly linear dependence with myrpalm-mYFP fluorescence intensity, for both cell types (Figure 2c). Typically, unconstrained linear regression of the data recovered very small intercept values (Section 3 of the Supplementary Materials). A linear regression model without intercept was chosen and fitted to the data as this represents a more realistic model and avoids overparameterization of the fitting procedure, which could obscure the interpretation of results. Additionally, both cell types exhibit almost identical slopes for the relationship between EFRET and myrpalm-mYFP intensity. The slope is also not affected by cholesterol extraction with methyl-β-cyclodextrin (MβCD, Figure S5; Section 5 of the Supplementary Materials). These results confirm a non-clustered distribution of the fluorescent proteins, and the resulting average slope for these experiments was taken to represent k N C ( k N C = 2.04 × 10⁻⁴ ± 3.22 × 10⁻⁵), as described in Equation (1).
The k N C for another FRET pair can be estimated considering the differences in Förster radiuses. The R 0 for CFP/YFP is 49 Å, while that of mturquoise/YFP is 56 Å. The difference in the slope of the FRET relationship with acceptor fluorescence intensity is, hence, 61%, according to the analytical models for FRET efficiency [37,38], and the k N C value for mturquoise/YFP, calculated from the k N C value obtained above, is 3.64 × 10⁻⁴. Deviations from these values will then be proof of compartmentalization and the results will be described by
E FRET = R C · k N C · I F A c c e p t o r
where R C is the compartmentalization ratio, and it reflects the average nanoscale concentration increase of acceptor constructs around donors.

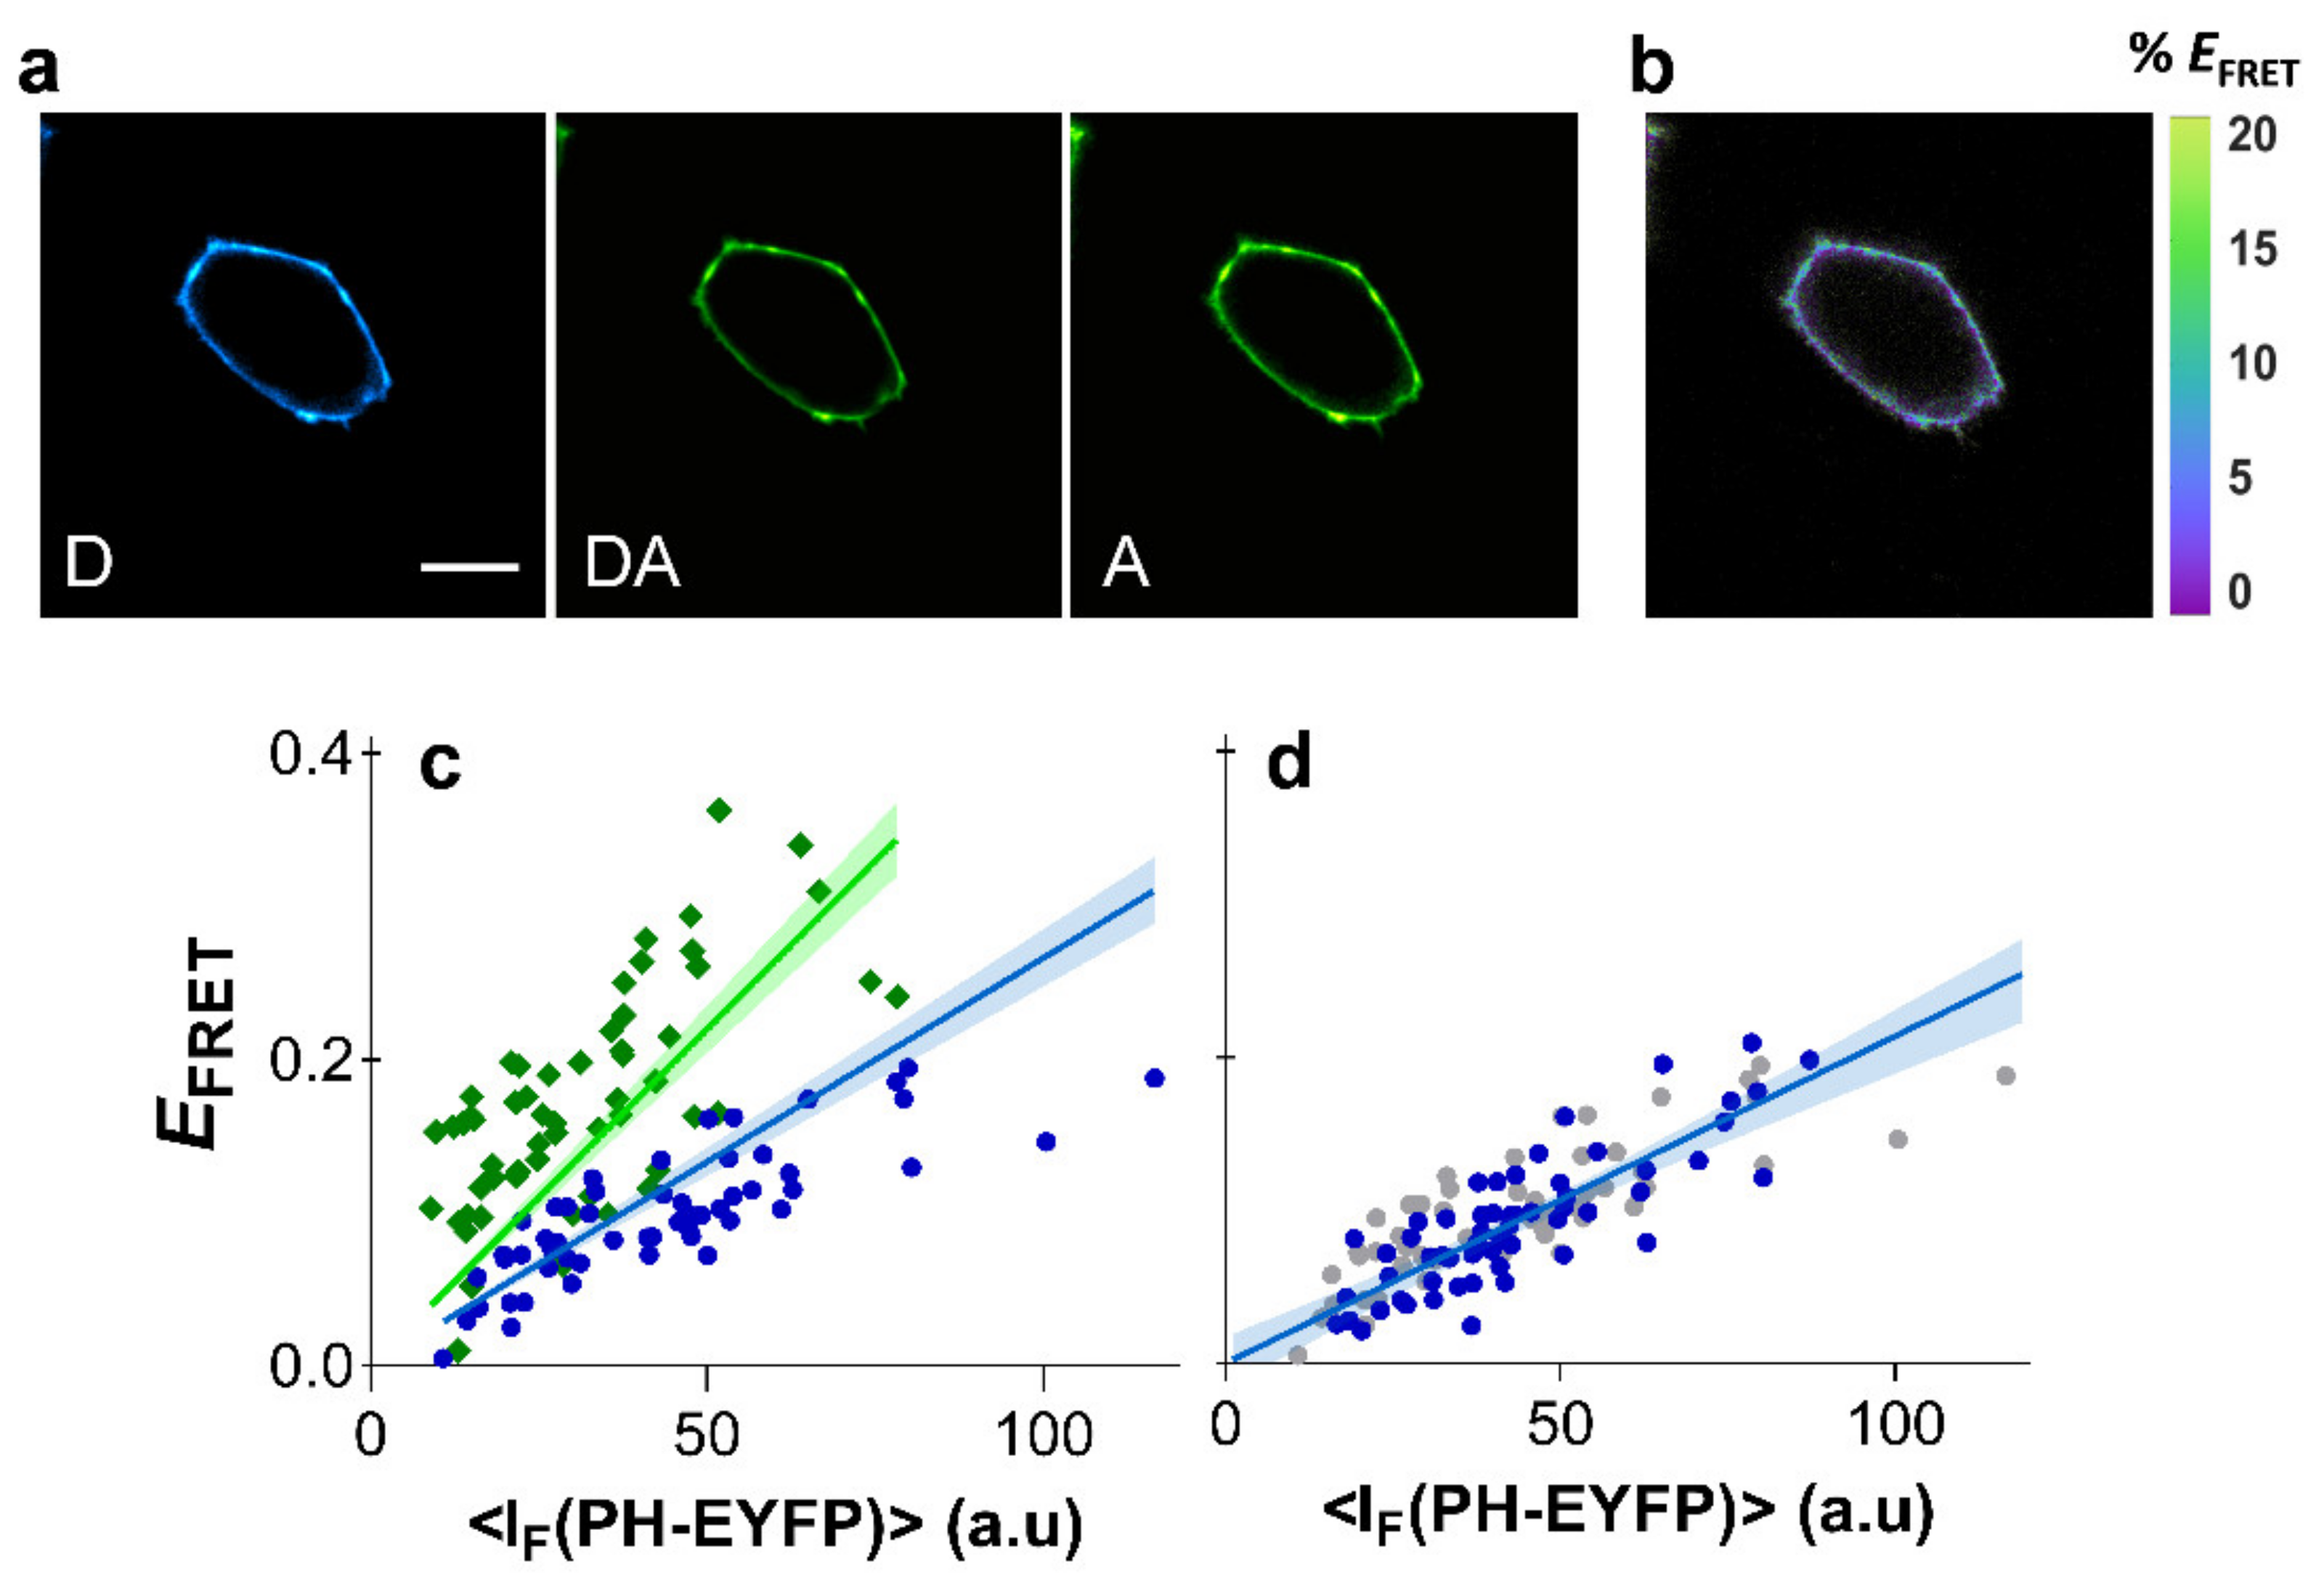
2.3. Clustering of PI(4,5)P2 in HEK293T Cells

PHPLCδ-ECFP (or PHPLCδ-mTurquoise) and PHPLCδ-EYFP were co-expressed in HEK293T cells and FRET was measured in cells exhibiting fluorescence from both constructs. The spectroscopic properties of ECFP and EYFP are almost identical to the mCFP and mYFP, respectively, so that the Förster radii for both pairs are also the same and FRET efficiencies can be readily compared. Expression levels of PHPLCδ domains were minimized to avoid inhibition of PI(4,5)P2-mediated cellular functions resulting from considerable competition of PHPLCδ domains with endogenous effectors for PI(4,5)P2 binding [44,45,46,47,48]. Expression of PHPLCδ domains at low or moderate levels were previously shown to not drastically impair signaling properties [49]. Under low levels of PH-EYFP expression, recovered FRET efficiencies were naturally moderate, and were found to be <25% for PHPLCδ-ECFP (Figure 3).
Results for both FRET pairs were globally fitted with Equation (2), using the previously obtained values for k N C for each FRET pair. Global analysis of FRET data from PHPLCδ-ECFP/PHPLCδ-EYFP and PHPLCδ-mTurquoise/PHPLCδ-EYFP was carried out with a shared R C parameter. The robustness and validity of the method shown here is confirmed as data from both FRET pairs were well fitted with a R C value of 0.844 ± 0.33 (Figure 3c), reflecting a general absence of PI(4,5)P2 clustering in HEK293T cells.
A previous study using the PHPLCδ-ECFP/PHPLCδ-EYFP constructs had already shown that FRET efficiency was insensitive to cholesterol extraction in HEK293T cells [23]. Here, efficient plasma membrane depletion of cholesterol in HEK293T cells was confirmed by measurements with the membrane probe Laurdan, whose fluorescence spectrum is sensitive to changes in membrane order (see Section 6 of the Supplementary Materials for details). Significant shifts of Laurdan emission spectrum were identified through generalized polarization (GP) measurements after cholesterol extraction with MβCD (Figure S6a). We confirmed that cholesterol extraction from the plasma membrane of HEK293T cells results in identical EFRET profiles (Figure 3d). These results confirm that cholesterol is not a modulator of PI(4,5)P2 organization in HEK293T cells, and that PI(4,5)P2 is not clustered or enriched within plasma membrane raft-like patches of these cells.

2.4. Clustering of PI(4,5)P2 in HeLa Cells

While for HEK293T cells, no evidence existed in the literature for PI(4,5)P2 nanoscale compartmentalization, in HeLa cells, nanoscale PI(4,5)P2 clustering, or domain enrichment has been reported [19]. FRET imaging data for HeLa cells expressing PHPLCδ-ECFP and PHPLCδ-EYFP is shown on Figure 4. Expression levels of PHPLCδ-EYFP in HeLa cells were considerably lower than in HEK293T cells. However, the FRET efficiency profile obtained for HeLa cells shows that PHPLCδ domains in these cells are considerably more clustered than in HEK293T cells, with a recovered R C = 1.79 ± 0.17 (Figure 4c,d).

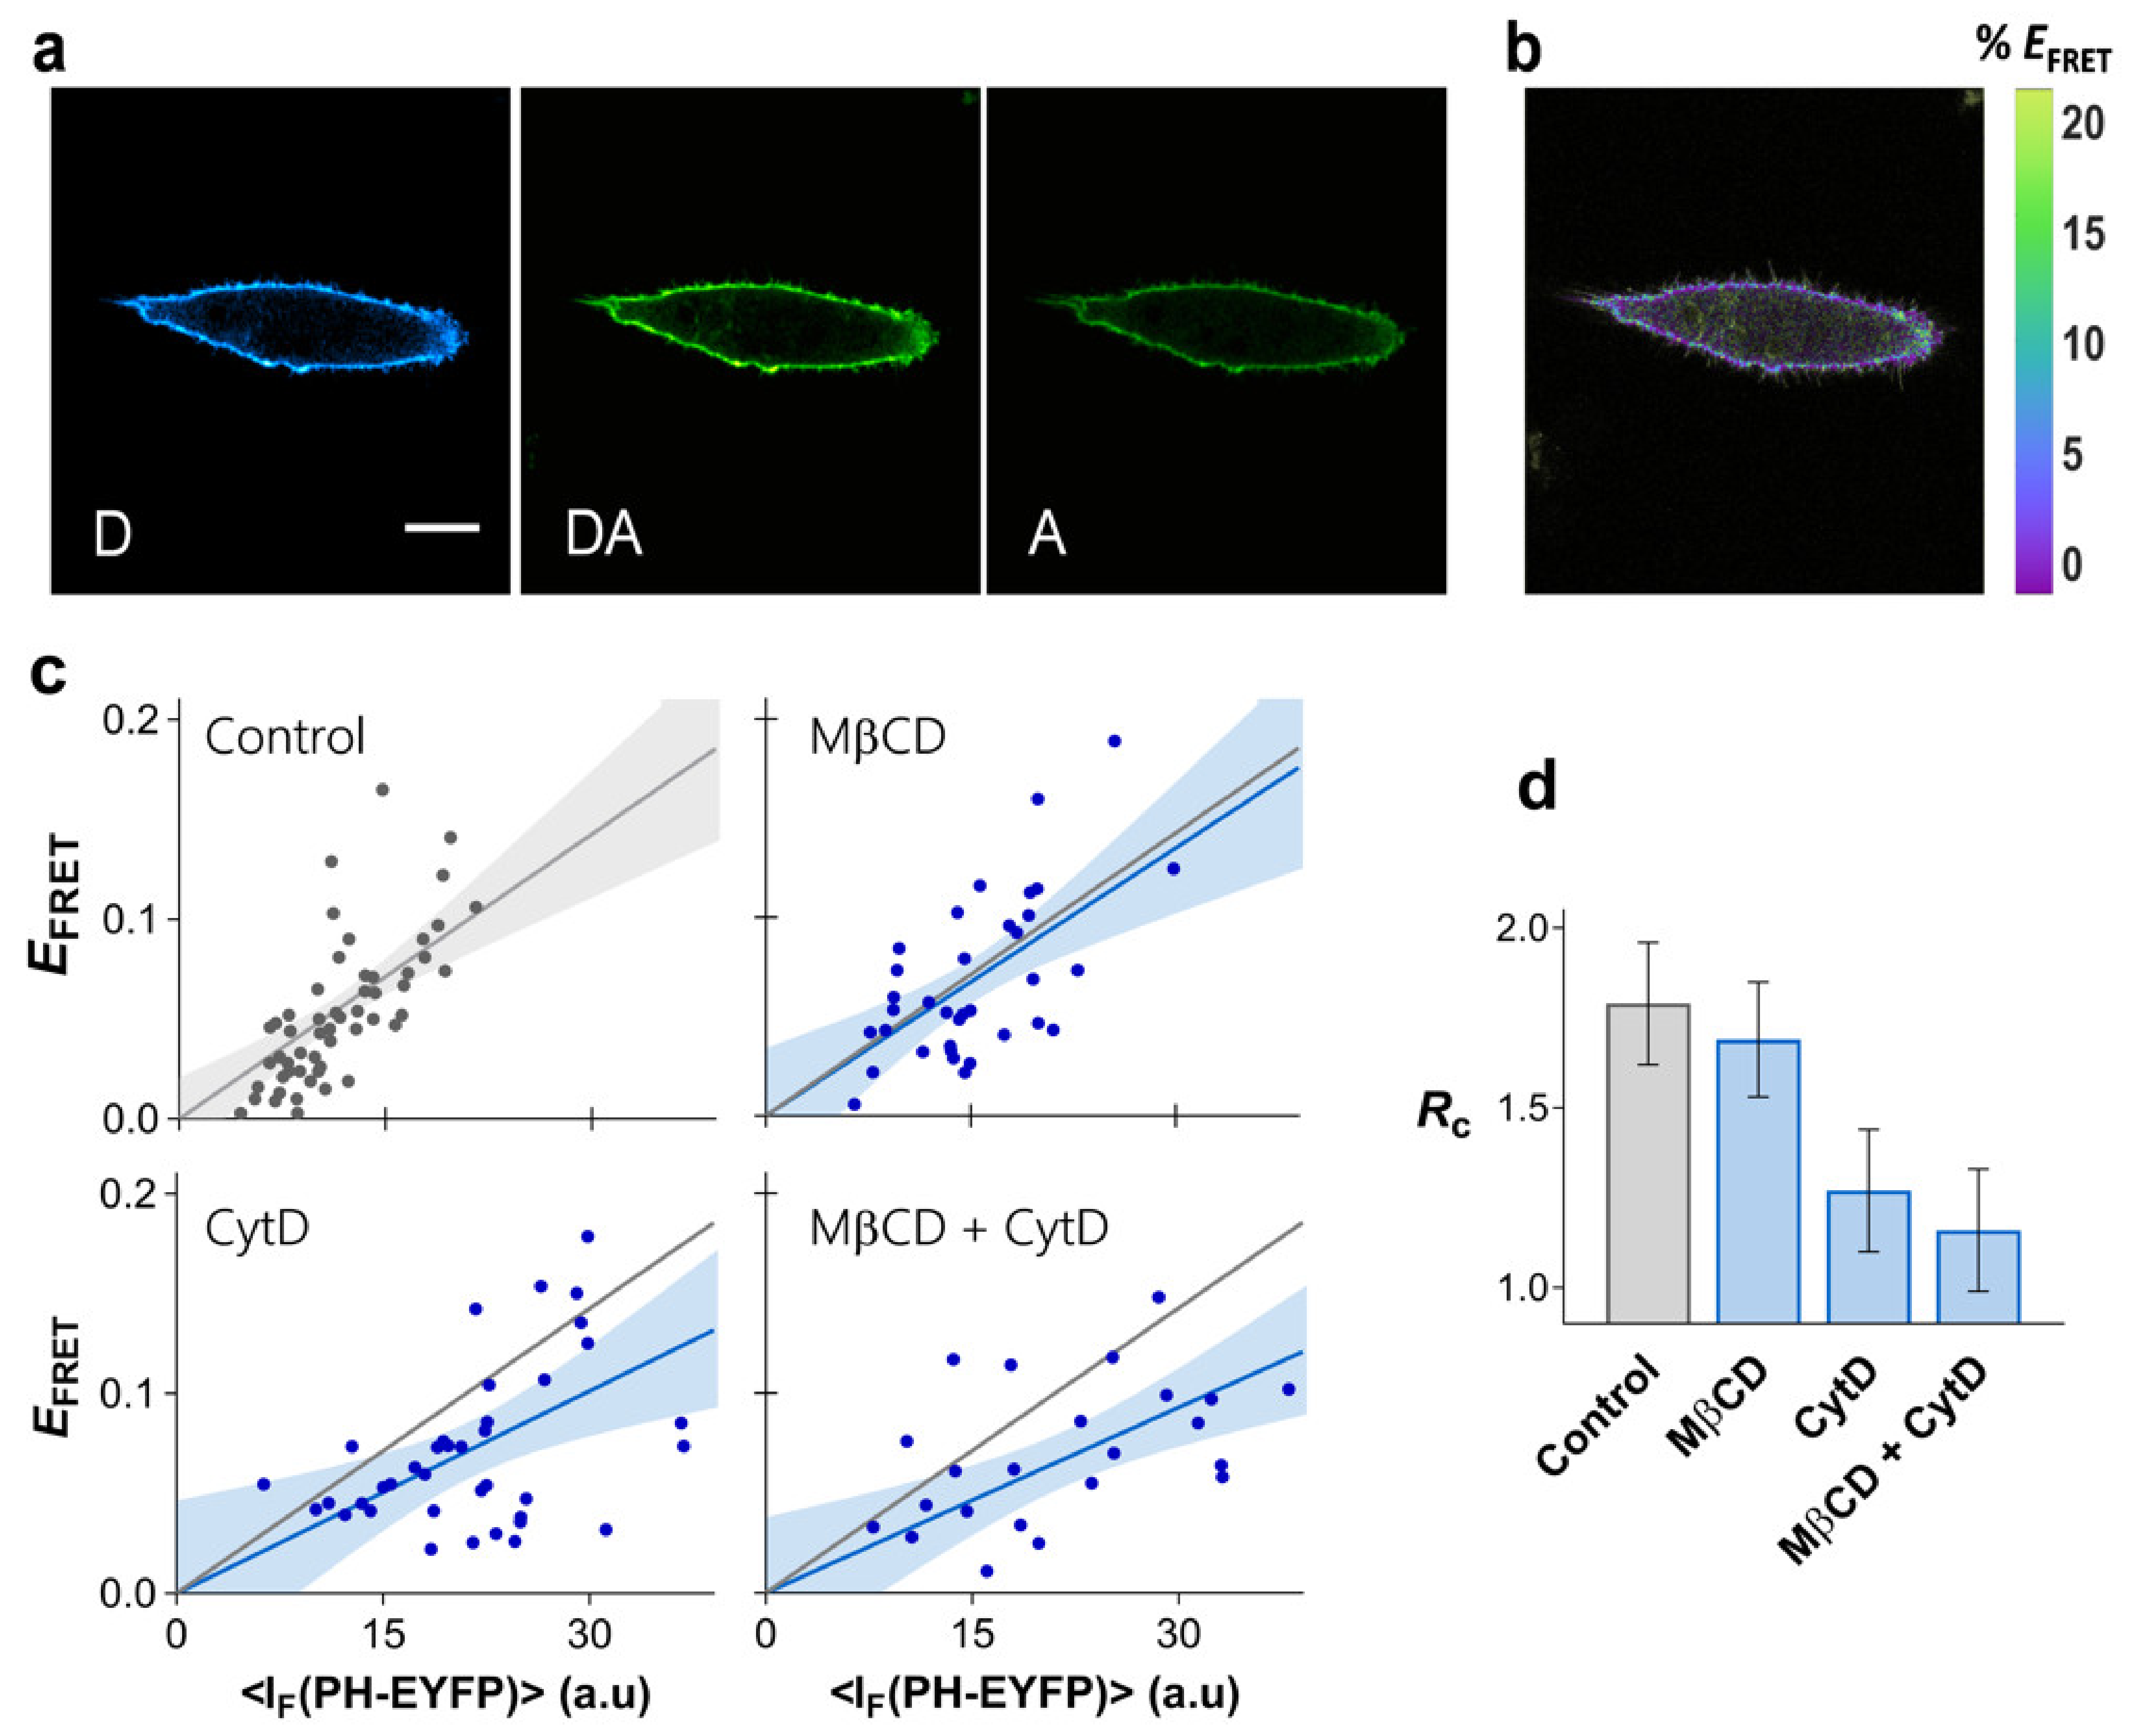
2.5. Determinants of PI-(4,5)P2 Clustering in HeLa Cells

PI(4,5)P2 clustering has been associated with many cellular components and functions. Particularly, the possible presence of membrane rafts enriched in cholesterol and sphingomyelin at the plasma membrane of eukaryotic cells, as well as the interaction with the cortical cytoskeleton, have been often suggested to promote PI(4,5)P2 compartmentalization [11,12,13,19,21,50,51,52,53,54].
In order to evaluate the importance of the cortical cytoskeleton for PI(4,5)P2 nanoscale lateral organization, actin polymerization in HeLa cells was inhibited with cytochalasin D (CytD) (Figure S7, see Section 7 of the Supplementary Materials for details). The resulting EFRET profile is presented in Figure 4c, together with the recovered R C (1.16 ± 0.18, Figure 4d). Disruption of the actin cytoskeleton has a dramatic impact in the FRET profile, with the PHPLCδ domains being significantly less compartmentalized after treatment. These results confirm the crucial role of the cortical cytoskeleton in defining PI(4,5)P2 organization in the plasma membrane.
While the contribution of raft-like membranes for PI(4,5)P2 organization in the plasma membrane of HEK293T cells was ruled out, reports have suggested that sphingomyelin-rich domains are critical for compartmentalization of PI(4,5)P2 in HeLa cells [19]. The FRET profile for PHPLCδ-ECFP/PHPLCδ-EYFP was measured in HeLa cells after cholesterol extraction with MβCD in order to evaluate the role of plasma membrane raft-like domains in the organization of PI(4,5)P2 in these cells (Figure 4c). Efficient cholesterol removal was confirmed through Laurdan GP measurements (Figure S5b). As observed before for HEK293T, cholesterol levels have no significant impact on the confinement of PHPLCδ domains in HeLa cells ( R C = 1.55 ± 0.17, Figure 4c,d). Combined cholesterol removal and CytD treatment induced no further disruption of PI(4,5)P2 clustering than CytD treatment alone ( R C = 1.07 ± 0.19, Figure 4c,d). Thus, compartmentalization of PI(4,5)P2 in HeLa cells is not associated with outer leaflet raft-like domains or any other structure dependent on cholesterol levels.

3. Discussion

Here, we demonstrate that it is possible to use FRET microscopy to quantify nanoscale confinement of pleckstrin homology domains. The robustness of the methodology is confirmed through global analysis of FRET data using two different donor–acceptor pairs, with considerably different Förster radii. The almost fully linear relationship between FRET efficiencies and PHPLCδ-EYFP fluorescence intensities suggest that overexpression of PHPLCδ domains in this concentration range does not perturb PI(4,5)P2 clustering significantly. In fact, in case the levels of PHPLCδ domains employed here were sufficient to alter PI(4,5)P2 organization to a significant extent, a change in the EFRET vs. PHPLCδ-EYFP profile would be expected.
It should be noted that the results obtained for PI(4,5)P2 compartmentalization refer to PI(4,5)P2 molecules bound to PHPLCδ domains, and not free phosphoinositides. In this way, the high levels of compartmentalization determined suggest that PHPLCδ domains are not highly effective in sequestering PI(4,5)P2 out from enriched domains. A significant fraction (~2/3) of PI(4,5)P2 in the plasma membrane is expected to be bound to membrane proteins [28]. A pool of these PI(4,5)P2 molecules is expected to be very tightly bound to protein partners, and not fully available for interaction with PHPLCδ domains. This pool of PI(4,5)P2 is not probed by this methodology, which is only sensitive to the available PI(4,5)P2 population.
Acylated fluorescent proteins were previously shown to cluster in MDCK cells, and that clustering was disrupted through cholesterol extraction [42]. In both cell types employed here (HEK293T and HeLa), the FRET profiles of myrpalm-mCFP/myrpalm-YFP were identical and were insensitive to cholesterol extraction. These results are strongly supportive of a homogeneous distribution of these constructs in the plasma membrane of these cells, and the corresponding slope was taken as corresponding to the FRET signature of non-interacting and non-compartmentalized proteins in the plasma membrane ( k N C ). When using PHPLCδ-FP domains, increases in the slope describing the relationship between FRET efficiency and acceptor intensity were then associated to a compartmentalization ratio ( R C ), reflecting the average increase of acceptors around donors.
For HEK293T cells, our results show that PHPLCδ domains exhibit a close to homogeneous distribution, reflecting an absence of clustering of PI(4,5)P2. PHPLCδ-ECFP and PHPLCδ-EYFP were tagged with fluorescent proteins lacking the A206K mutation, which prevents dimerization at high concentrations [42]. The presence of dimerization in the plasma membrane would add great complexity to the analysis presented here. However, the FRET profiles obtained with these proteins was identical to that obtained with the monomeric acylated fluorescent proteins, showing that no significant oligomerization occurs at these expression levels. This observation is also supported by the fact that the FRET profiles of PHPLCδ-ECFP/PHPLCδ-EYFP and PHPLCδ-mTurquoise/PHPLCδ-EYFP can be fitted with similar compartmentalization ratios (Figure 3c), as mTurquoise is monomeric.
Our results show that for HeLa cells, the intensity of PHPLCδ-EYFP domains in the nanoscale vicinity of PH-donor molecules was 1.79 higher than that observed for acylated proteins, confirming that nanodomains enriched in PI(4,5)P2 are present in these cells.
Interestingly, cholesterol concentration has no impact on FRET profiles, proving that the observed nanodomains are not associated with raft-like membrane patches, unlike what was observed for other systems [21,52]. In fact, the enrichment of the polyunsaturated PI(4,5)P2 within highly ordered domains is puzzling, since this lipid has been shown to prefer inclusion within disordered phases [7], and membrane rafts are believed to occur only at the outer leaflet of the plasma membrane, while PI(4,5)P2 is in the inner leaflet. One possible explanation for this phenomenon would be that although PI(4,5)P2 is not incorporated within lipid rafts, its microdomains are aligned with them. Our results demonstrate clearly that for the cell lines studied here, there is in fact no association between PI(4,5)P2 microdomains and membrane rafts.
On the other hand, the cytoskeleton is shown to be critical for the formation of PI(4,5)P2 enriched compartments in HeLa cells, as disruption of actin polymerization results in a distribution of PI(4,5)P2 close to homogeneity. Several proteins (e.g., ERM proteins, vinculin, and talin) responsible for anchoring actin filaments to the membrane interact directly with PI(4,5)P2 [55], and this lipid is critical for actin polymerization and cytoskeleton adhesion to the plasma membrane [56].
The results shown here confirm that not only PI(4,5)P2 is important for cytoskeleton assembly and organization, but that the cytoskeleton actively contributes to the formation of PI(4,5)P2-rich nanodomains in the plasma membrane. This is in agreement with the cluster feedback model [57] where the relation between PI(4,5)P2, actin-binding proteins, and actin is bidirectional. While the presence of PI(4,5)P2 and other membrane components is crucial for signaling the formation of the cortical cytoskeleton, local remodeling of actin filaments is then able to sequester and limit the diffusion of PI(4,5)P2 [58], creating PI(4,5)P2-rich nanoscale domains, similarly to actin-dependent clustering of other plasma membrane components [57,59,60,61,62,63].
The relatively moderate values recovered for average increase in local concentration of PI(4,5)P2 suggest that the enrichment of PI(4,5)P2 into functional domains is energetically economic, as marginal increases in PI(4,5)P2 concentration guarantees function, as suggested before [22]. The recruitment of kinases to membrane domains of restricted diffusion, due to the presence of actin-based fences, could be sufficient to maintain these structures.

4. Materials and Methods

4.1. Cell Culture and Transfection

HEK239T (RRID:CVCL_0063) and HeLa (RRID:CVCL_0030) cells were purchased from ATCC (Manassas, VA, USA). Cells were maintained at 37 °C with 5% CO2 in DMEM supplemented with 10% fetal bovine serum (FBS) and 1% penicillin/streptomycin. Cells were passaged every 3–4 days. The day before transfection, cells were seeded in 8-well µ-slides (Ibidi, Munich, Germany) coated with poly-L-lysine, at a density of 1 × 10⁵ cells/well. Transfection with plasmid DNA (0.5–1.0 µg pDNA/well) was carried out using Lipofectamine2000 (Thermo Fisher Scientific, Waltham, MA, USA) according to the manufacturer’s instructions.

4.2. pDNA Constructs

The pcDNA3 plasmids coding for the phospholipase Cδ1 pleckstrin homology (PHPLCδ) domain fused to ECFP (PH-ECFP), EYFP (PH-EYFP) [30], and mTurquoise (PH-mTurquoise) [64] were kindly provided by Dr. K. Jalink (The Netherlands Cancer Institute, Amsterdam, The Netherlands) [30]. PH-EYFP-pET28a was obtained from PH-EYFP-pcDNA3. Briefly, the PH-EYFP sequence flanked by BamHI and NotI restriction sites was inserted into a pET28a vector.
Myrpalm-mCFP and myrpalm-mYFP in pcDNA3 plasmids, coding for lipid-modified fluorescent proteins [42], were a kind gift of Dr. R. Tsien (Howard Hughes Medical Institute, University of California, San Diego, CA, USA). The plasmid coding for the EYFP–ECFP tandem construct (linked by a sequence of 17 amino acids, YFP-17aa-CFP) was a kind gift of Dr. M.C. Montoya (Centro Nacional de Investigaciones Oncológicas, Madrid, Spain) [65].
To create the EYFP-mTurquoise tandem construct, EYFP was first amplified from PH-EYFP using the primers 5′-ATTAT AAGCT TATGG TACCG AGCTC GGATCC-3′ and 5′-TTATT GCGGC CGCCG GGAAT TCGGC TTGTA CAGC-3′. The EYFP PCR product and PH-mTurquoise were cut with HindIII and NotI, and ligated, resulting in the EYFP-mTurquoise encoding plasmid.
All constructs were checked by sequencing analysis.

4.3. Fluorescence Linear Dichroism Imaging

The day before imaging, HEK239 or HeLa cells were seeded in 8-well µ-slides (Ibidi, Munich, Germany) coated with poly-L-lysine. Shortly before imaging, cells were incubated with 10 µM 3,3′-dioctadecyloxacarbocyanine perchlorate (DiOC18 (3)) for 30 min at 37 °C. After incubation, cells were washed twice with PBS and imaged immediately on a Leica TCS SP5 (Leica Microsystems CMS GmbH, Mannheim, Germany) inverted confocal microscope (DMI6000). A 63× apochromatic water immersion objective with a NA of 1.2 (Zeiss, Jena, Germany) was used for all experiments, and a Ti:sapphire laser with a pulse frequency of 80 MHz was used for excitation of DiOC18 (3). Fluorescence was recorded using a PMC-100-4 cooled high-speed PMT detection head (Becker & Hickl GmbH, Berlin, Germany) and images were acquired using a Becker & Hickl SPC 830 module.
For fluorescence linear dichroism imaging, cells were focused at the mid-way axial position and images were collected under all combinations (vertical, horizontal) of excitation and detection polarization. Background fluorescence calculated from non-labelled cells was subtracted to all measured combinations of polarizations. LDr was determined in a MATLAB (The MathWorks, Natick, MA, USA) environment. All additional details can be found in the Section 2 of the Supplementary Materials.

4.4. Three-Filter Cube FRET Microscopy

All measurements were performed on a Leica TCS SP5 (Leica Microsystems CMS GmbH, Mannheim, Germany) inverted confocal microscope (DMI6000). A 63× apochromatic water immersion objective with a NA of 1.2 (Zeiss, Jena, Germany) was used for all experiments as well as an Argon laser for excitation purposes.
The imaging setup and all the theoretical basis regarding the implementation of filter-cube FRET microscopy is thoroughly described elsewhere [43]. Briefly, all cells containing both donor and acceptor have to be sequentially measured in three different channels: (a) the donor channel, where the donor (ECFP/mTurquoise) is directly excited (λex = 458 nm) and emission acquisition is performed in the donor emission range (λem = 465–500 nm); (b) the FRET channel, which comprises the excitation of the donor (λex = 458 nm) and the collection of acceptor’s (YFP) emission (λem = 505–600 nm); and (c) the acceptor channel, where the acceptors are directly excited (λex = 496 nm) and the emission is collected in the acceptor emission wavelength range (λem = 505–600 nm). Cells expressing only donor and only acceptor were imaged for the determination of the spectral bleed through parameters [43,66], while cells expressing a donor–acceptor tandem construct were imaged for determination of the proportionality constant G. These control samples were measured daily to account for any minor variations within the imaging setup.
The methodology relies on the determination of the aforementioned G factor because it converts the measured sensitized acceptor emission ( F c ) to FRET-quenched donor fluorescence [43], thus allowing the recovery of accurate real EFRET values. This G factor is constant for a particular fluorophore pair and imaging setup [43] and can be determined using tandem constructs composed of both donor and acceptor connected by a linker. Here, HEK293T cells expressing EYFP–ECFP or EYFP-mTurquoise were used, since the protein expression levels were higher than in HeLa cells. First, FRET imaging was performed, and sensitized emission was obtained as described above [43]. Sequentially, the lifetime of the donor in the absence and presence of acceptor was determined by fluorescence lifetime imaging (see Section 8 of the Supplementary Materials for details), allowing the calculation of the real FRET efficiency of each donor–acceptor tandem construct. The relationship between sensitized emission F c and the FRET efficiency is given by:
E FRET = F c / G I d d + F c / G
where F c / G is the quenched donor emission and I d d + F c / G is the donor emission in the absence of FRET. The G factor was then calibrated as the value for which the FRET efficiency obtained from the three-filter cube FRET method was equal to real EFRET recovered from FRET-FLIM.
For all FRET microscopy experiments, cells were used for experiments one day after transfection with PHPLCδ-FP encoding plasmids. Prior to imaging, the culture medium was replaced with FBS- and penicillin/streptomycin-free DMEM. All images were acquired at a line-scan speed of 100 Hz and a size of 512 × 512 pixels. For each condition, 20–40 cells were measured in multiple days, to ensure reproducibility. Green fluorescent beads (PS-SpeckTM Microscope Point Source Kit from Thermo Fisher Scientific, Waltham, MA, USA) were also imaged in the acceptor channel to allow the day-to-day calibration of YFP intensity.
All data analyses were carried out using custom-written software developed in a MATLAB environment (MathWorks, Natick, MA). Background fluorescence calculated from non-transfected cells was subtracted to all measured channels. A ROI at the plasma membrane was chosen in each individual cell, to avoid any major contributions from the cytosolic fraction of the fluorescent proteins. Only flat non-differentiated regions of the plasma membrane, with highly homogenous fluorescence intensity, were selected to avoid measuring FRET efficiencies on areas with some degree of membrane wrinkling [67] or extensive presence of endocytic structures. FRET efficiency was then determined for each pixel within the selected ROI. The resulting values were converted to EFRET histograms, which were well fitted by a normal distribution without constraints, of which the mean value was used for subsequent analysis. This procedure is effective in moderating the outliner pixel values with low probabilities.
Further details on the simulations and data analysis, including the determination of the 95% confidence intervals, can be found in Sections 1, 3 and 4 of the Supplementary Materials.

Supplementary Materials

The following are available online at https://www.mdpi.com/article/10.3390/ijms222111727/s1.

Author Contributions

F.F., M.J.S., A.C. and M.P. designed research. M.J.S., L.B.-A., S.N.P., N.B. and J.C.R. prepared samples and performed experiments. F.F. and L.B.-A. wrote the software. F.F., M.J.S. and L.B.-A. analyzed the results and all authors discussed them. F.F. and M.J.S. wrote the manuscript with the input from all other authors. All authors have read and agreed to the published version of the manuscript.

Funding

This work was financed by national funds from FCT—Fundação para a Ciência e a Tecnologia, I.P., in the scope of the project UIDB/04565/2020 and UIDP/04565/2020 of the Research Unit Institute for Bioengineering and Biosciences—iBB, and project LA/P/0140/2020 of the Associate Laboratory Institute for Health and Bioeconomy—i4HB. The authors also acknowledge funding from the Portuguese Platform of Bioimaging (PPBI-POCI-01-0145-FEDER-022122) by the European Regional Development Fund (FEDER), through the Regional Operational Programme of Lisbon (PORLISBOA 2020), and the Competitiveness and Internationalisation Operational Programme (COMPETE 2020) of the Portugal 2020 framework (LISBOA-01-0145-FEDER-031057). MJS acknowledges support by the FCT Scientific Employment Stimulus program (CEECIND/00098/2018).

Institutional Review Board Statement

Not applicable.

Informed Consent Statement

Not applicable.

Data Availability Statement

Not applicable.

Conflicts of Interest

The authors declare no conflict of interest. The funders had no role in the design of the study; in the collection, analyses, or interpretation of data; in the writing of the manuscript, or in the decision to publish the results.

References

  1. Ferrell, J.E.; Huestis, W.H. Phosphoinositide metabolism and the morphology of human erythrocytes. J. Cell Biol. 1984, 98, 1992–1998. [Google Scholar] [CrossRef] [PubMed]
  2. Sun, Y.; Thapa, N.; Hedman, A.C.; Anderson, R.A. Phosphatidylinositol 4,5-bisphosphate: Targeted production and signaling. Bioessays 2013, 35, 513–522. [Google Scholar] [CrossRef] [Green Version]
  3. Moens, P.D.J.; Bagatolli, L.A. Profilin binding to sub-micellar concentrations of phosphatidylinositol (4,5) bisphosphate and phosphatidylinositol (3,4,5) trisphosphate. Biochim. Biophys. Acta 2007, 1768, 439–449. [Google Scholar] [CrossRef] [Green Version]
  4. Gambhir, A.; Hangyás-Mihályné, G.; Zaitseva, I.; Cafiso, D.S.; Wang, J.; Murray, D.; Pentyala, S.N.; Smith, S.O.; McLaughlin, S. Electrostatic sequestration of PIP2 on phospholipid membranes by basic/aromatic regions of proteins. Biophys. J. 2004, 86, 2188–2207. [Google Scholar] [CrossRef] [Green Version]
  5. Wang, Y.-H.; Collins, A.; Guo, L.; Smith-Dupont, K.B.; Gai, F.; Svitkina, T.; Janmey, P.A. Divalent cation-induced cluster formation by polyphosphoinositides in model membranes. J. Am. Chem. Soc. 2012, 134, 3387–3395. [Google Scholar] [CrossRef] [PubMed] [Green Version]
  6. Sarmento, M.J.; Coutinho, A.; Fedorov, A.; Prieto, M.; Fernandes, F. Membrane order is a key regulator of divalent cation-induced clustering of PI(3,5)P2 and PI(4,5)P2. Langmuir 2017, 33, 12463–12477. [Google Scholar] [CrossRef]
  7. Sarmento, M.J.; Coutinho, A.; Fedorov, A.; Prieto, M.; Fernandes, F. Ca2+ induces PI(4,5)P2 clusters on lipid bilayers at physiological PI(4,5)P2 and Ca2+ concentrations. Biochim. Biophys. Acta Biomembr. 2014, 1838, 822–830. [Google Scholar] [CrossRef] [PubMed] [Green Version]
  8. Wen, Y.; Vogt, V.M.; Feigenson, G.W. Multivalent Cation-Bridged PI(4,5)P2 Clusters Form at Very Low Concentrations. Biophys. J. 2018, 114, 2630–2639. [Google Scholar] [CrossRef] [Green Version]
  9. Borges-Araújo, L.; Fernandes, F. Structure and lateral organization of phosphatidylinositol 4,5-bisphosphate. Molecules 2020, 25, 3885. [Google Scholar] [CrossRef] [PubMed]
  10. Milosevic, I.; Sørensen, J.B.; Lang, T.; Krauss, M.; Nagy, G.; Haucke, V.; Jahn, R.; Neher, E. Plasmalemmal phosphatidylinositol-4,5-bisphosphate level regulates the releasable vesicle pool size in chromaffin cells. J. Neurosci. 2005, 25, 2557–2565. [Google Scholar] [CrossRef] [PubMed]
  11. Aoyagi, K.; Sugaya, T.; Umeda, M.; Yamamoto, S.; Terakawa, S.; Takahashi, M. The activation of exocytotic sites by the formation of phosphatidylinositol 4,5-bisphosphate microdomains at syntaxin clusters. J. Biol. Chem. 2005, 280, 17346–17352. [Google Scholar] [CrossRef] [Green Version]
  12. Huang, S.; Lifshitz, L.; Patki-Kamath, V.; Tuft, R.; Fogarty, K.; Czech, M.P. Phosphatidylinositol-4,5-bisphosphate-rich plasma membrane patches organize active zones of endocytosis and ruffling in cultured adipocytes. Mol. Cell. Biol. 2004, 24, 9102–9123. [Google Scholar] [CrossRef] [Green Version]
  13. Laux, T.; Fukami, K.; Thelen, M.; Golub, T.; Frey, D.; Caroni, P. GAP43, MARCKS, and CAP23 modulate PI(4,5)P(2) at plasmalemmal rafts, and regulate cell cortex actin dynamics through a common mechanism. J. Cell Biol. 2000, 149, 1455–1472. [Google Scholar] [CrossRef] [PubMed] [Green Version]
  14. Chierico, L.; Joseph, A.S.; Lewis, A.L.; Battaglia, G. Live cell imaging of membrane/cytoskeleton interactions and membrane topology. Sci. Rep. 2015, 4, 6056. [Google Scholar] [CrossRef] [PubMed] [Green Version]
  15. Van den Bogaart, G.; Meyenberg, K.; Risselada, H.J.; Amin, H.; Willig, K.I.; Hubrich, B.E.; Dier, M.; Hell, S.W.; Grubmüller, H.; Diederichsen, U.; et al. Membrane protein sequestering by ionic protein-lipid interactions. Nature 2011, 479, 552–555. [Google Scholar] [CrossRef]
  16. Wang, J.; Richards, D.A. Segregation of PIP2 and PIP3 into distinct nanoscale regions within the plasma membrane. Biol. Open 2012, 1, 857–862. [Google Scholar] [CrossRef] [PubMed] [Green Version]
  17. Honigmann, A.; van den Bogaart, G.; Iraheta, E.; Risselada, H.J.; Milovanovic, D.; Mueller, V.; Müllar, S.; Diederichsen, U.; Fasshauer, D.; Grubmüller, H.; et al. Phosphatidylinositol 4,5-bisphosphate clusters act as molecular beacons for vesicle recruitment. Nat. Struct. Mol. Biol. 2013, 20, 679–686. [Google Scholar] [CrossRef] [Green Version]
  18. Favard, C.; Chojnacki, J.; Merida, P.; Yandrapalli, N.; Mak, J.; Eggeling, C.; Muriaux, D. HIV-1 Gag specifically restricts PI(4,5)P2 and cholesterol mobility in living cells creating a nanodomain platform for virus assembly. Sci. Adv. 2019, 5, eaaw8651. [Google Scholar] [CrossRef] [Green Version]
  19. Abe, M.; Makino, A.; Hullin-Matsuda, F.; Kamijo, K.; Ohno-Iwashita, Y.; Hanada, K.; Mizuno, H.; Miyawaki, A.; Kobayashi, T. A role for sphingomyelin-rich lipid domains in the accumulation of phosphatidylinositol-4,5-bisphosphate to the cleavage furrow during cytokinesis. Mol. Cell. Biol. 2012, 32, 1396–1407. [Google Scholar] [CrossRef] [Green Version]
  20. Myeong, J.; Park, C.G.; Suh, B.C.; Hille, B. Compartmentalization of phosphatidylinositol 4,5-bisphosphate metabolism into plasma membrane liquid-ordered/raft domains. Proc. Natl. Acad. Sci. USA 2021, 118, e2025343118. [Google Scholar] [CrossRef]
  21. Cheng, J.; Takenawa, T.; Tauchi-Sato, K.; Fujimoto, T.; Fujita, A. A distinct pool of phosphatidylinositol 4,5-bisphosphate in caveolae revealed by a nanoscale labeling technique. Proc. Natl. Acad. Sci. USA 2009, 106, 9256–9261. [Google Scholar]
  22. Ji, C.; Zhang, Y.; Xu, P.; Xu, T.; Lou, X. Nanoscale landscape of phosphoinositides revealed by specific pleckstrin homology (PH) domains using single-molecule superresolution imaging in the plasma membrane. J. Biol. Chem. 2015, 290, 26978–26993. [Google Scholar] [CrossRef] [PubMed] [Green Version]
  23. Van Rheenen, J.; Achame, E.M.; Janssen, H.; Calafat, J.; Jalink, K. PIP2 signaling in lipid domains: A critical re-evaluation. EMBO J. 2005, 24, 1664–1673. [Google Scholar] [CrossRef] [PubMed] [Green Version]
  24. Van Rheenen, J.; Jalink, K. Agonist-induced PIP2 hydrolysis inhibits cortical actin dynamics: Regulation at a global but not at a micrometer scale. Mol. Biol. Cell 2002, 13, 3257–3267. [Google Scholar] [CrossRef] [PubMed] [Green Version]
  25. Wen, Y.; Vogt, V.M.; Feigenson, G.W. PI(4,5)P2 clustering and its impact on biological functions. Annu. Rev. Biochem. 2021, 90, 681–707. [Google Scholar] [CrossRef]
  26. Loura, L.M.S.; Fernandes, F.; Prieto, M. Membrane microheterogeneity: Förster resonance energy transfer characterization of lateral membrane domains. Eur. Biophys. J. 2010, 39, 589–607. [Google Scholar] [CrossRef]
  27. Falkenburger, B.H.; Jensen, J.B.; Hille, B. Kinetics of M1 muscarinic receptor and G protein signaling to phospholipase C in living cells. J. Gen. Physiol. 2010, 135, 81–97. [Google Scholar] [CrossRef] [Green Version]
  28. Golebiewska, U.; Nyako, M.; Woturski, W.; Zaitseva, I.; McLaughlin, S. Diffusion coefficient of fluorescent phosphatidylinositol 4,5-bisphosphate in the plasma membrane of cells. Mol. Biol. Cell 2008, 19, 1663–1669. [Google Scholar] [CrossRef] [Green Version]
  29. Hammond, G.R.V.; Sim, Y.; Lagnado, L.; Irvine, R.F. Reversible binding and rapid diffusion of proteins in complex with inositol lipids serves to coordinate free movement with spatial information. J. Cell Biol. 2009, 184, 297–308. [Google Scholar] [CrossRef] [PubMed] [Green Version]
  30. Van der Wal, J.; Habets, R.; Várnai, P.; Balla, T.; Jalink, K. Monitoring agonist-induced phospholipase C activation in live cells by fluorescence resonance energy transfer. J. Biol. Chem. 2001, 276, 15337–15344. [Google Scholar] [CrossRef] [PubMed] [Green Version]
  31. Varnai, P.; Thyagarajan, B.; Rohacs, T.; Balla, T. Rapidly inducible changes in phosphatidylinositol 4,5-bisphosphate levels influence multiple regulatory functions of the lipid in intact living cells. J. Cell Biol. 2006, 175, 377–382. [Google Scholar] [CrossRef]
  32. Várnai, P.; Lin, X.; Lee, S.B.; Tuymetova, G.; Bondeva, T.; Spät, A.; Rhee, S.G.; Hajnóczky, G.; Balla, T. Inositol lipid binding and membrane localization of isolated Pleckstrin Homology (PH) domains. J. Biol. Chem. 2002, 277, 27412–27422. [Google Scholar] [CrossRef] [PubMed] [Green Version]
  33. Kenworthy, A.K.; Edidin, M. Distribution of a glycosylphosphatidylinositol-anchored protein at the apical surface of MDCK cells examined at a resolution of <100 A using imaging fluorescence resonance energy transfer. J. Cell Biol. 1998, 142, 69–84. [Google Scholar] [PubMed]
  34. Kenworthy, A.K.; Petranova, N.; Edidin, M. High-Resolution FRET Microscopy of Cholera Toxin B-Subunit and GPI-anchored Proteins in Cell Plasma Membranes. Mol. Biol. Cell 2000, 11, 1645–1655. [Google Scholar] [CrossRef] [Green Version]
  35. King, C.; Raicu, V.; Hristova, K. Understanding the FRET signatures of interacting membrane proteins. J. Biol. Chem. 2017, 292, 5291–5310. [Google Scholar] [CrossRef] [Green Version]
  36. King, C.; Sarabipour, S.; Byrne, P.; Leahy, D.J.; Hristova, K. The FRET signatures of noninteracting proteins in membranes: Simulations and experiments. Biophys. J. 2014, 106, 1309–1317. [Google Scholar] [CrossRef] [Green Version]
  37. Fung, B.K.K.; Stryer, L. Surface density determination in membranes by fluorescence energy transfer. Biochemistry 1978, 17, 5241–5248. [Google Scholar] [CrossRef]
  38. Wolber, P.K.; Hudson, B.S. An analytic solution to the Förster energy transfer problem in two dimensions. Biophys. J. 1979, 28, 197–210. [Google Scholar] [CrossRef] [Green Version]
  39. Xu, C.; Watras, J.; Loew, L.M. Kinetic analysis of receptor-activated phosphoinositide turnover. J. Cell Biol. 2003, 161, 779–791. [Google Scholar] [CrossRef] [PubMed]
  40. Benninger, R.K.P.; Önfelt, B.; Neil, M.A.A.; Davis, D.M.; French, P.M.W. Fluorescence imaging of two-photon linear dichroism: Cholesterol depletion disrupts molecular orientation in cell membranes. Biophys. J. 2005, 88, 609–622. [Google Scholar] [CrossRef]
  41. Benninger, R.K.P. Fluorescence linear dichroism imaging for quantifying membrane order. In Methods in Membrane Lipids; Methods in Molecular BiologyTM; Dopico, A.M., Ed.; Springer: New York, NY, USA, 2015; Volume 400, pp. 161–179. ISBN 9781493917525. [Google Scholar]
  42. Zacharias, D.A.; Violin, J.D.; Newton, A.C.; Tsien, R.Y. Partitioning of lipid-modified monomeric GFPs into membrane microdomains of live cells. Science 2002, 296, 913–916. [Google Scholar] [CrossRef] [Green Version]
  43. Chen, H.; Puhl, H.L.; Koushik, S.V.; Vogel, S.S.; Ikeda, S.R. Measurement of FRET efficiency and ratio of donor to acceptor concentration in living cells. Biophys. J. 2006, 91, 39–41. [Google Scholar] [CrossRef] [PubMed] [Green Version]
  44. Raucher, D.; Stauffer, T.; Chen, W.; Shen, K.; Guo, S.; York, J.D.; Sheetz, M.P.; Meyer, T. Phosphatidylinositol 4,5-bisphosphate functions as a second messenger that regulates cytoskeleton–plasma membrane adhesion. Cell 2000, 100, 221–228. [Google Scholar] [CrossRef] [Green Version]
  45. Várnai, P.; Bondeva, T.; Tamás, P.; Tóth, B.; Buday, L.; Hunyady, L.; Balla, T. Selective cellular effects of overexpressed pleckstrin-homology domains that recognize PtdIns(3,4,5)P3 suggest their interaction with protein binding partners. J. Cell Sci. 2005, 118, 4879–4888. [Google Scholar] [CrossRef] [PubMed] [Green Version]
  46. Holz, R.W.; Hlubek, M.D.; Sorensen, S.D.; Fisher, S.K.; Balla, T.; Ozaki, S.; Prestwich, G.D.; Stuenkel, E.L.; Bittner, M.A. A pleckstrin homology domain specific for phosphatidylinositol 4, 5-bisphosphate (PtdIns-4,5-P2) and fused to green fluorescent protein identifies plasma membrane PtdIns-4,5-P2 as being important in exocytosis. J. Biol. Chem. 2000, 275, 17878–17885. [Google Scholar] [CrossRef] [PubMed] [Green Version]
  47. Szentpetery, Z.; Balla, A.; Kim, Y.; Lemmon, M.A.; Balla, T. Live cell imaging with protein domains capable of recognizing phosphatidylinositol 4,5-bisphosphate; a comparative study. BMC Cell Biol. 2009, 10, 67. [Google Scholar] [CrossRef] [Green Version]
  48. Falkenburger, B.H.; Jensen, J.B.; Hille, B. Kinetics of PIP2 metabolism and KCNQ2/3 channel regulation studied with a voltage-sensitive phosphatase in living cells. J. Gen. Physiol. 2010, 135, 99–114. [Google Scholar] [CrossRef] [PubMed] [Green Version]
  49. Várnai, P.; Balla, T. Live cell imaging of phosphoinositide dynamics with fluorescent protein domains. Biochim. Biophys. Acta 2006, 1761, 957–967. [Google Scholar] [CrossRef]
  50. Dinic, J.; Ashrafzadeh, P.; Parmryd, I. Actin filaments attachment at the plasma membrane in live cells cause the formation of ordered lipid domains. Biochim. Biophys. Acta Biomembr. 2013, 1828, 1102–1111. [Google Scholar] [CrossRef] [Green Version]
  51. Golub, T.; Caroni, P. PI(4,5)P2-dependent microdomain assemblies capture microtubules to promote and control leading edge motility. J. Cell Biol. 2005, 169, 151–165. [Google Scholar] [CrossRef]
  52. Pike, L.J.; Miller, J.M. Cholesterol depletion delocalizes phosphatidylinositol bisphosphate and inhibits hormone-stimulated phosphatidylinositol turnover. J. Biol. Chem. 1998, 273, 22298–22304. [Google Scholar] [CrossRef] [Green Version]
  53. Cai, Z.; Li, F.; Gong, W.; Liu, W.; Duan, Q.; Chen, C.; Ni, L.; Xia, Y.; Cianflone, K.; Dong, N.; et al. Endoplasmic reticulum stress participates in aortic valve calcification in hypercholesterolemic animals. Arterioscler. Thromb. Vasc. Biol. 2013, 33, 2345–2354. [Google Scholar] [CrossRef] [Green Version]
  54. Scholze, M.J.; Barbieux, K.S.; De Simone, A.; Boumasmoud, M.; Süess, C.C.N.; Wang, R.; Gönczy, P. PI(4,5)P2 forms dynamic cortical structures and directs actin distribution as well as polarity in Caenorhabditis elegans embryos. Development 2018, 145, dev169144. [Google Scholar] [CrossRef] [Green Version]
  55. Logan, M.R.; Mandato, C.A. Regulation of the actin cytoskeleton by PIP2 in cytokinesis. Biol. Cell 2006, 98, 377–388. [Google Scholar] [CrossRef]
  56. Bezanilla, M.; Gladfelter, A.S.; Kovar, D.R.; Lee, W.-L. Cytoskeletal dynamics: A view from the membrane. J. Cell Biol. 2015, 209, 329–337. [Google Scholar] [CrossRef] [Green Version]
  57. Curthoys, N.M.; Parent, M.; Mlodzianoski, M.; Nelson, A.J.; Lilieholm, J.; Butler, M.B.; Valles, M.; Hess, S.T. Dances with membranes: Breakthroughs from super-resolution imaging. Curr. Top. Membr. 2015, 75, 59–123. [Google Scholar]
  58. Golebiewska, U.; Kay, J.G.; Masters, T.; Grinstein, S.; Im, W.; Pastor, R.W.; Scarlata, S.; McLaughlin, S. Evidence for a fence that impedes the diffusion of phosphatidylinositol 4,5-bisphosphate out of the forming phagosomes of macrophages. Mol. Biol. Cell 2011, 22, 3498–3507. [Google Scholar] [CrossRef]
  59. Chichili, G.R.; Rodgers, W. Cytoskeleton-membrane interactions in membrane raft structure. Cell. Mol. Life Sci. 2009, 66, 2319–2328. [Google Scholar] [CrossRef] [Green Version]
  60. Gowrishankar, K.; Ghosh, S.; Saha, S.; Rumamol, C.; Mayor, S.; Rao, M. Active remodeling of cortical actin regulates spatiotemporal organization of cell surface molecules. Cell 2012, 149, 1353–1367. [Google Scholar] [CrossRef] [Green Version]
  61. Gudheti, M.V.; Curthoys, N.M.; Gould, T.J.; Kim, D.; Gunewardene, M.S.; Gabor, K.A.; Gosse, J.A.; Kim, C.H.; Zimmerberg, J.; Hess, S.T. Actin mediates the nanoscale membrane organization of the clustered membrane protein influenza hemagglutinin. Biophys. J. 2013, 104, 2182–2192. [Google Scholar] [CrossRef] [Green Version]
  62. Jaumouillé, V.; Farkash, Y.; Jaqaman, K.; Das, R.; Lowell, C.A.; Grinstein, S. Actin cytoskeleton reorganization by syk regulates fcγ receptor responsiveness by increasing its lateral mobility and clustering. Dev. Cell 2014, 29, 534–546. [Google Scholar] [CrossRef] [PubMed] [Green Version]
  63. Viola, A.; Gupta, N. Tether and trap: Regulation of membrane-raft dynamics by actin-binding proteins. Nat. Rev. Immunol. 2007, 7, 889–896. [Google Scholar] [CrossRef]
  64. Klarenbeek, J.B.; Goedhart, J.; Hink, M.A.; Gadella, T.W.J.; Jalink, K. A mTurquoise-based cAMP sensor for both FLIM and ratiometric read-out has improved dynamic range. PLoS ONE 2011, 6, e19170. [Google Scholar] [CrossRef]
  65. Megías, D.; Marrero, R.; Martínez Del Peso, B.; García, M.A.; Bravo-Cordero, J.-J.; García-Grande, A.; Santos, A.; Montoya, M.C. Novel lambda FRET spectral confocal microscopy imaging method. Microsc. Res. Tech. 2009, 72, 1–11. [Google Scholar] [CrossRef]
  66. Gordon, G.W.; Berry, G.; Liang, X.H.; Levine, B.; Herman, B. Quantitative fluorescence resonance energy transfer measurements using fluorescence microscopy. Biophys. J. 1998, 74, 2702–2713. [Google Scholar] [CrossRef] [Green Version]
  67. Kress, A.; Wang, X.; Ranchon, H.; Savatier, J.; Rigneault, H.; Ferrand, P.; Brasselet, S. Mapping the local organization of cell membranes using excitation-polarization-resolved confocal fluorescence microscopy. Biophys. J. 2013, 105, 127–136. [Google Scholar] [CrossRef] [Green Version]
Figure 1. Evaluation of nanoscale ruffling of the plasma membrane. Reduced linear dichroism (LDr) values of the DiOC18(3) membrane probe in HEK293T and HeLa cells. (a) Structure of DiOC18(3). The orientation of the fluorophore’s absorption dipole is shown in red. (b) Schematic representation of the impact of different membrane topologies on the recovered LDr values of DiOC18(3) when using a polarized excitation source. A planar membrane (top) implies the presence of heavily aligned fluorophores, such that the probability of excitation depends heavily on membrane orientation. In the case of non-flat membranes or in the presence of intracellular vesicles in the immediate vicinity of the plasma membrane (bottom), the orientation of the absorption dipoles of DiOC18(3) is no longer homogeneous and no dependence of LDr on macroscopic membrane orientation is expected. Red arrows indicate the orientation of the transition dipole of DiOC18(3). (c) LDr imaging of DiOC18(3) in a HEK293T cell (false color scale). LDr values relative to membrane orientation are shown for HEK293T (d) and HeLa (e) cells. LDr values were determined as described in Section 2 of the Supplementary Materials. Each data point corresponds to ROI in the plasma membrane of a given cell.
Ijms 22 11727 g001
Figure 2. Dependence of FRET efficiency with acceptor intensity. FRET microscopy of HEK293T and HeLa cells co-transfected with myrpalm-mCFP and myrpalm-mYFP. (a) Example of confocal data acquired according to the three-filter cube method in HEK293T cells: D—donor channel, DA—FRET channel, A—acceptor channel. Scale bar = 5 μm. (b) FRET efficiency image. (c) Dependence of EFRET with myrpalm-mYFP fluorescence intensity for HEK293T (blue circles) and HeLa cells (gray diamonds). Each data point corresponds to the FRET signal at a segment of the plasma membrane of an individual cell (at equatorial optical sections). Lines represent the global least-squares fit of Equation (1) to both data sets, and the corresponding 95% confidence intervals are shown as shaded areas (see Section 4 of the Supplementary Materials).
Ijms 22 11727 g002
Figure 3. Clustering of PI(4,5)P2 in HEK293T cells. FRET microscopy of HEK293T cells co-transfected with PHPLCδ-ECFP (or PHPLCδ-mTurquoise) and PHPLCδ-EYFP. (a) Example of confocal data acquired according to the three-filter cube method: D—donor channel, DA—FRET channel, A—acceptor channel. Scale bar = 5 μm. (b) FRET efficiency image. (c) Dependence of EFRET with PHPLCδ-EYFP fluorescence intensity using PHPLCδ-ECFP (blue) or PHPLCδ-mTurquoise (green) as the donor. Each data point corresponds to the FRET signal at a segment of the plasma membrane of an individual cell (at equatorial optical sections). Lines represent the global least-squares fit of Equation (2) to both data sets, and the corresponding 95% confidence intervals are shown as shaded areas. An R C value of 0.844 ± 0.33 was recovered from the global analysis. (d) FRET data obtained from cells expressing PHPLCδ-ECFP and PHPLCδ-EYFP after cholesterol extraction with MβCD (blue) was identical to control cells (grey). Lines represent the least-squares fit of Equation (2) to both data sets, and the corresponding 95% confidence intervals are shown as shaded areas.
Ijms 22 11727 g003
Figure 4. Clustering of PI(4,5)P2 in HeLa. FRET microscopy of HeLa cells co-transfected with PHPLCδ-ECFP and PHPLCδ-EYFP. (a) Example of confocal data acquired according to the three-filter cube method: D—donor channel, DA—FRET channel, A—acceptor channel. Scale bar = 5 μm. (b) FRET efficiency image. (c) Dependence of EFRET on PHPLCδ-EYFP fluorescence intensity. Each data point corresponds to the FRET signal at a segment of the plasma membrane of an individual cell (at equatorial optical sections). The lines represent the least-squares fit of Equation (2) to the data sets and the corresponding 95% confidence intervals are shown as the shaded areas. FRET was measured on unperturbed cells (control), and on cells exposed to MβCD for cholesterol extraction, or to CytD for disruption of the cytoskeleton. A combined MβCD + CytD treatment was also carried out. The grey line is the fit to the FRET data in the absence of cytoskeleton disruption and is shown for comparison. (d) R C values obtained for PHPLCδ-ECFP/PHPLCδ-EYFP (±SE).
Ijms 22 11727 g004
Publisher’s Note: MDPI stays neutral with regard to jurisdictional claims in published maps and institutional affiliations.

