
Revealing the Molecular Mechanisms of Alzheimer’s Disease Based on Network Analysis

 , , , ,
  ,
,  ,
,
Abstract
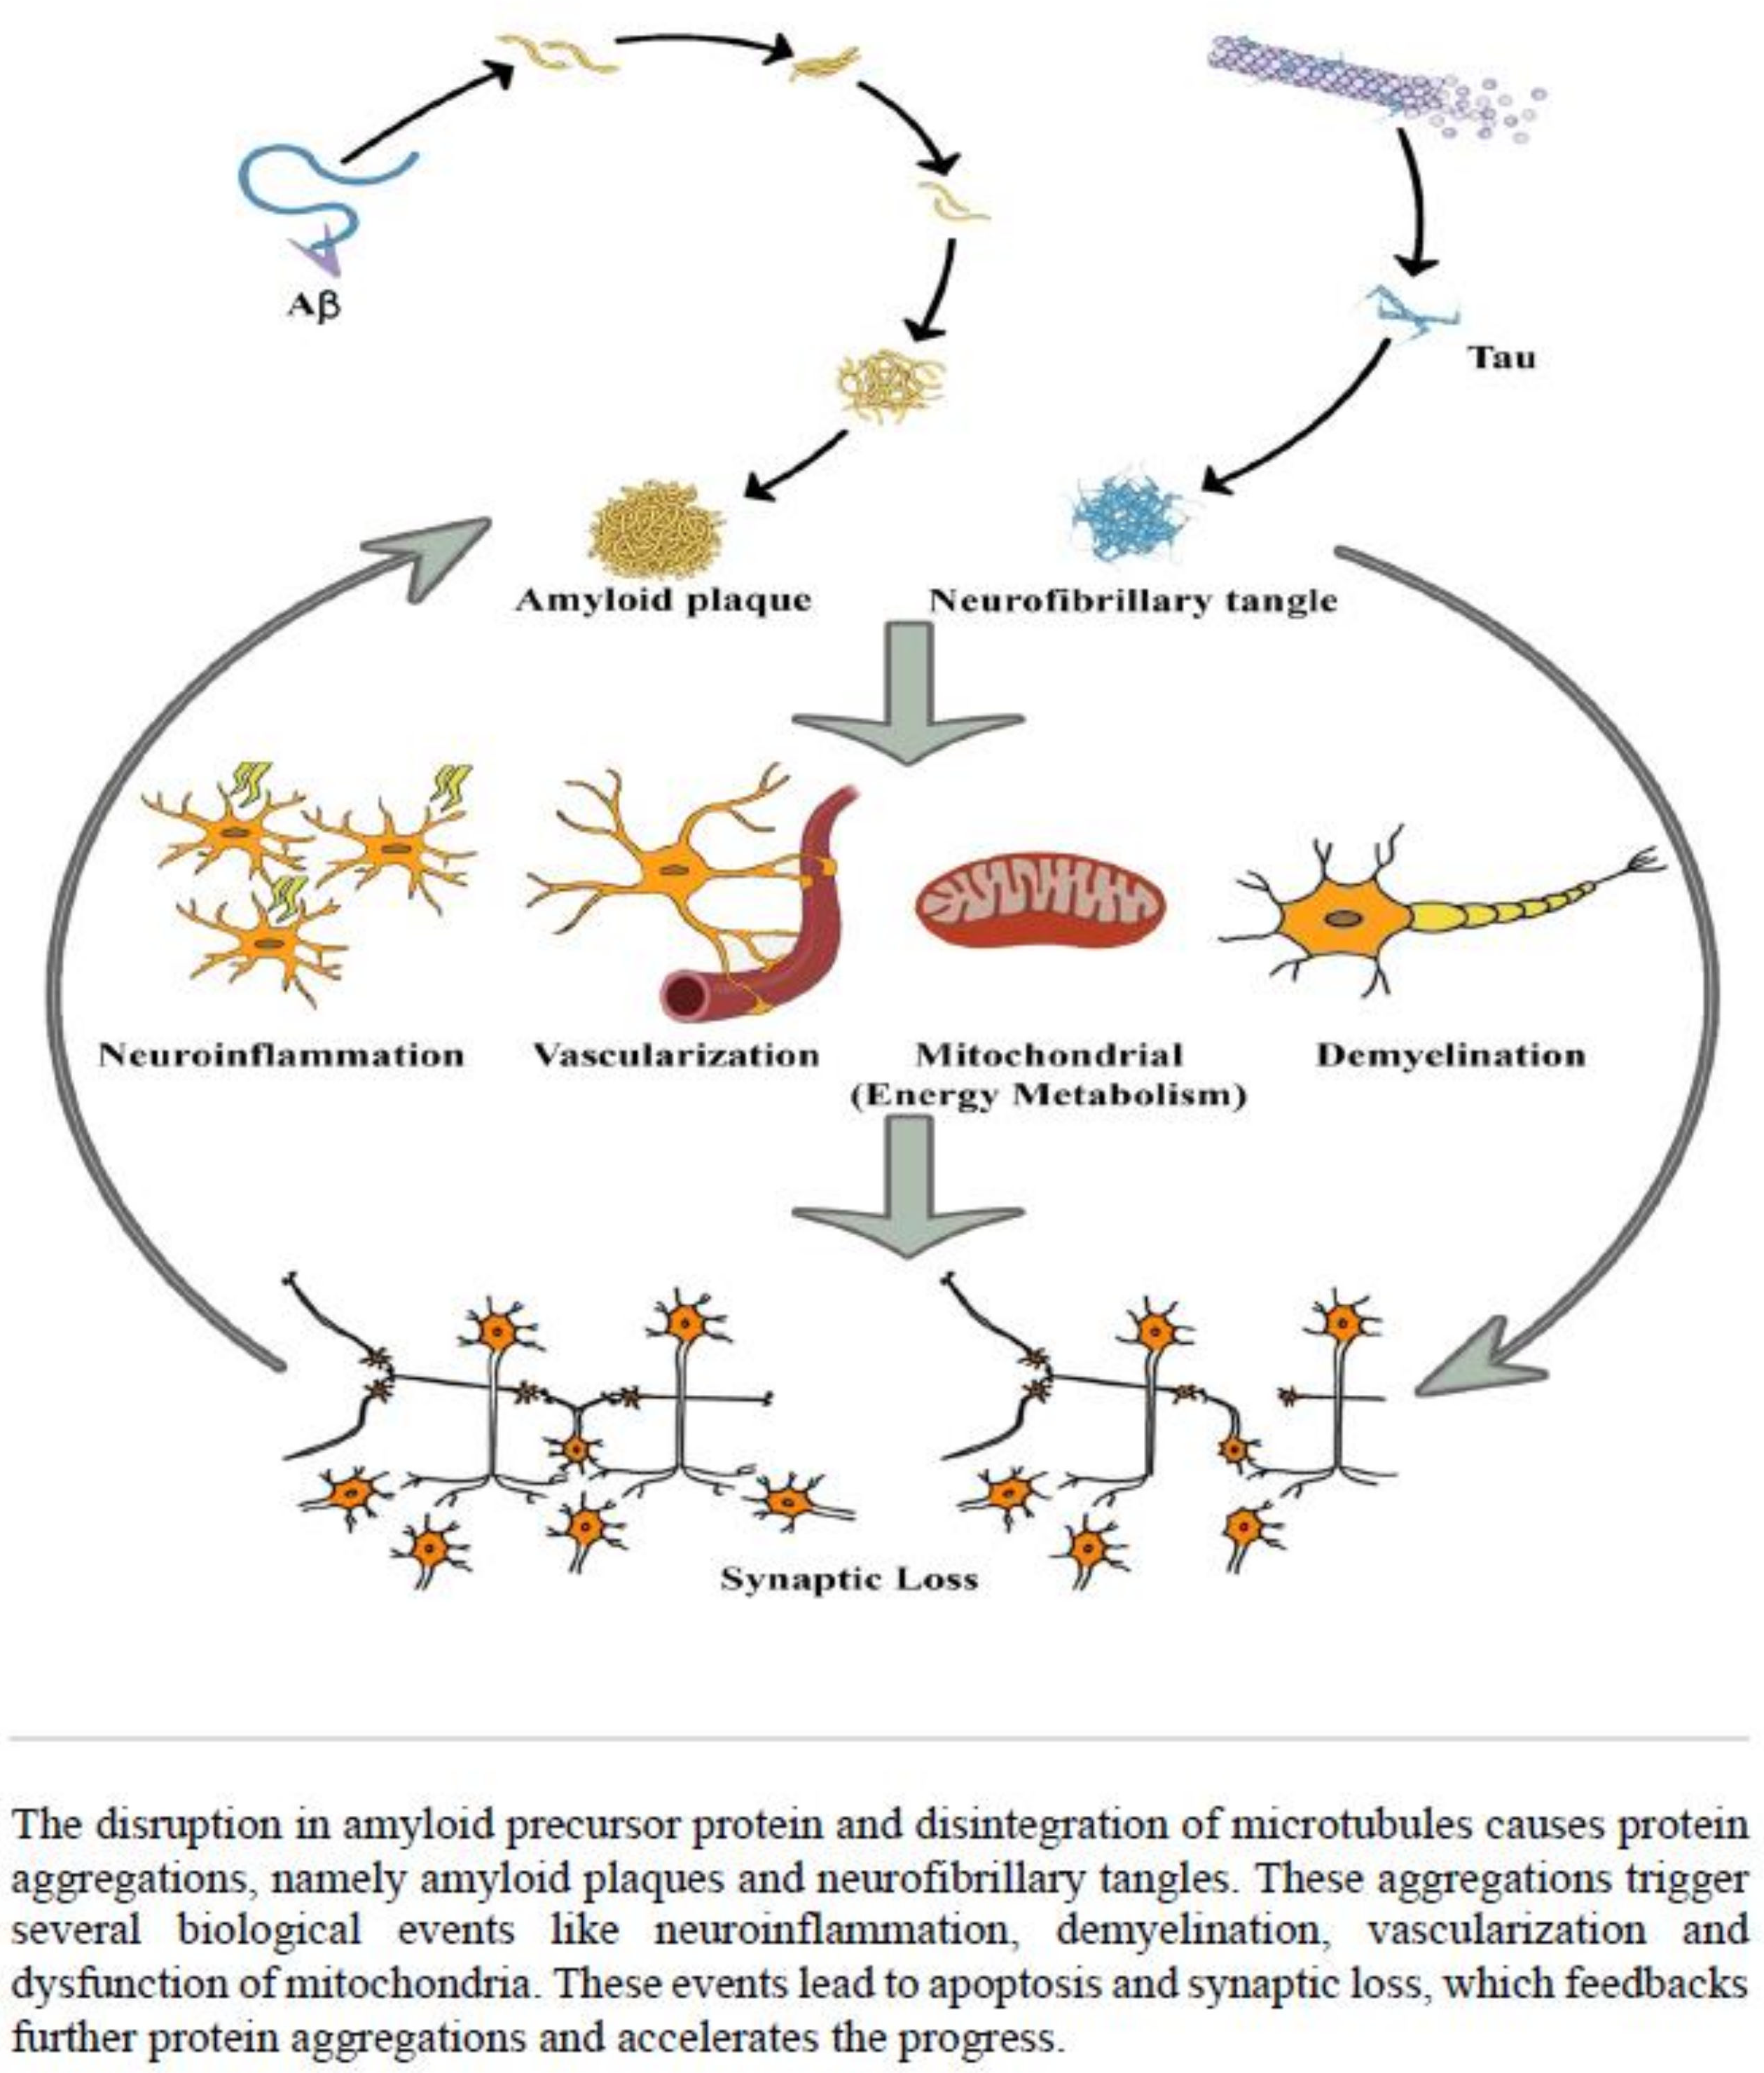
:1. Introduction
2. Results
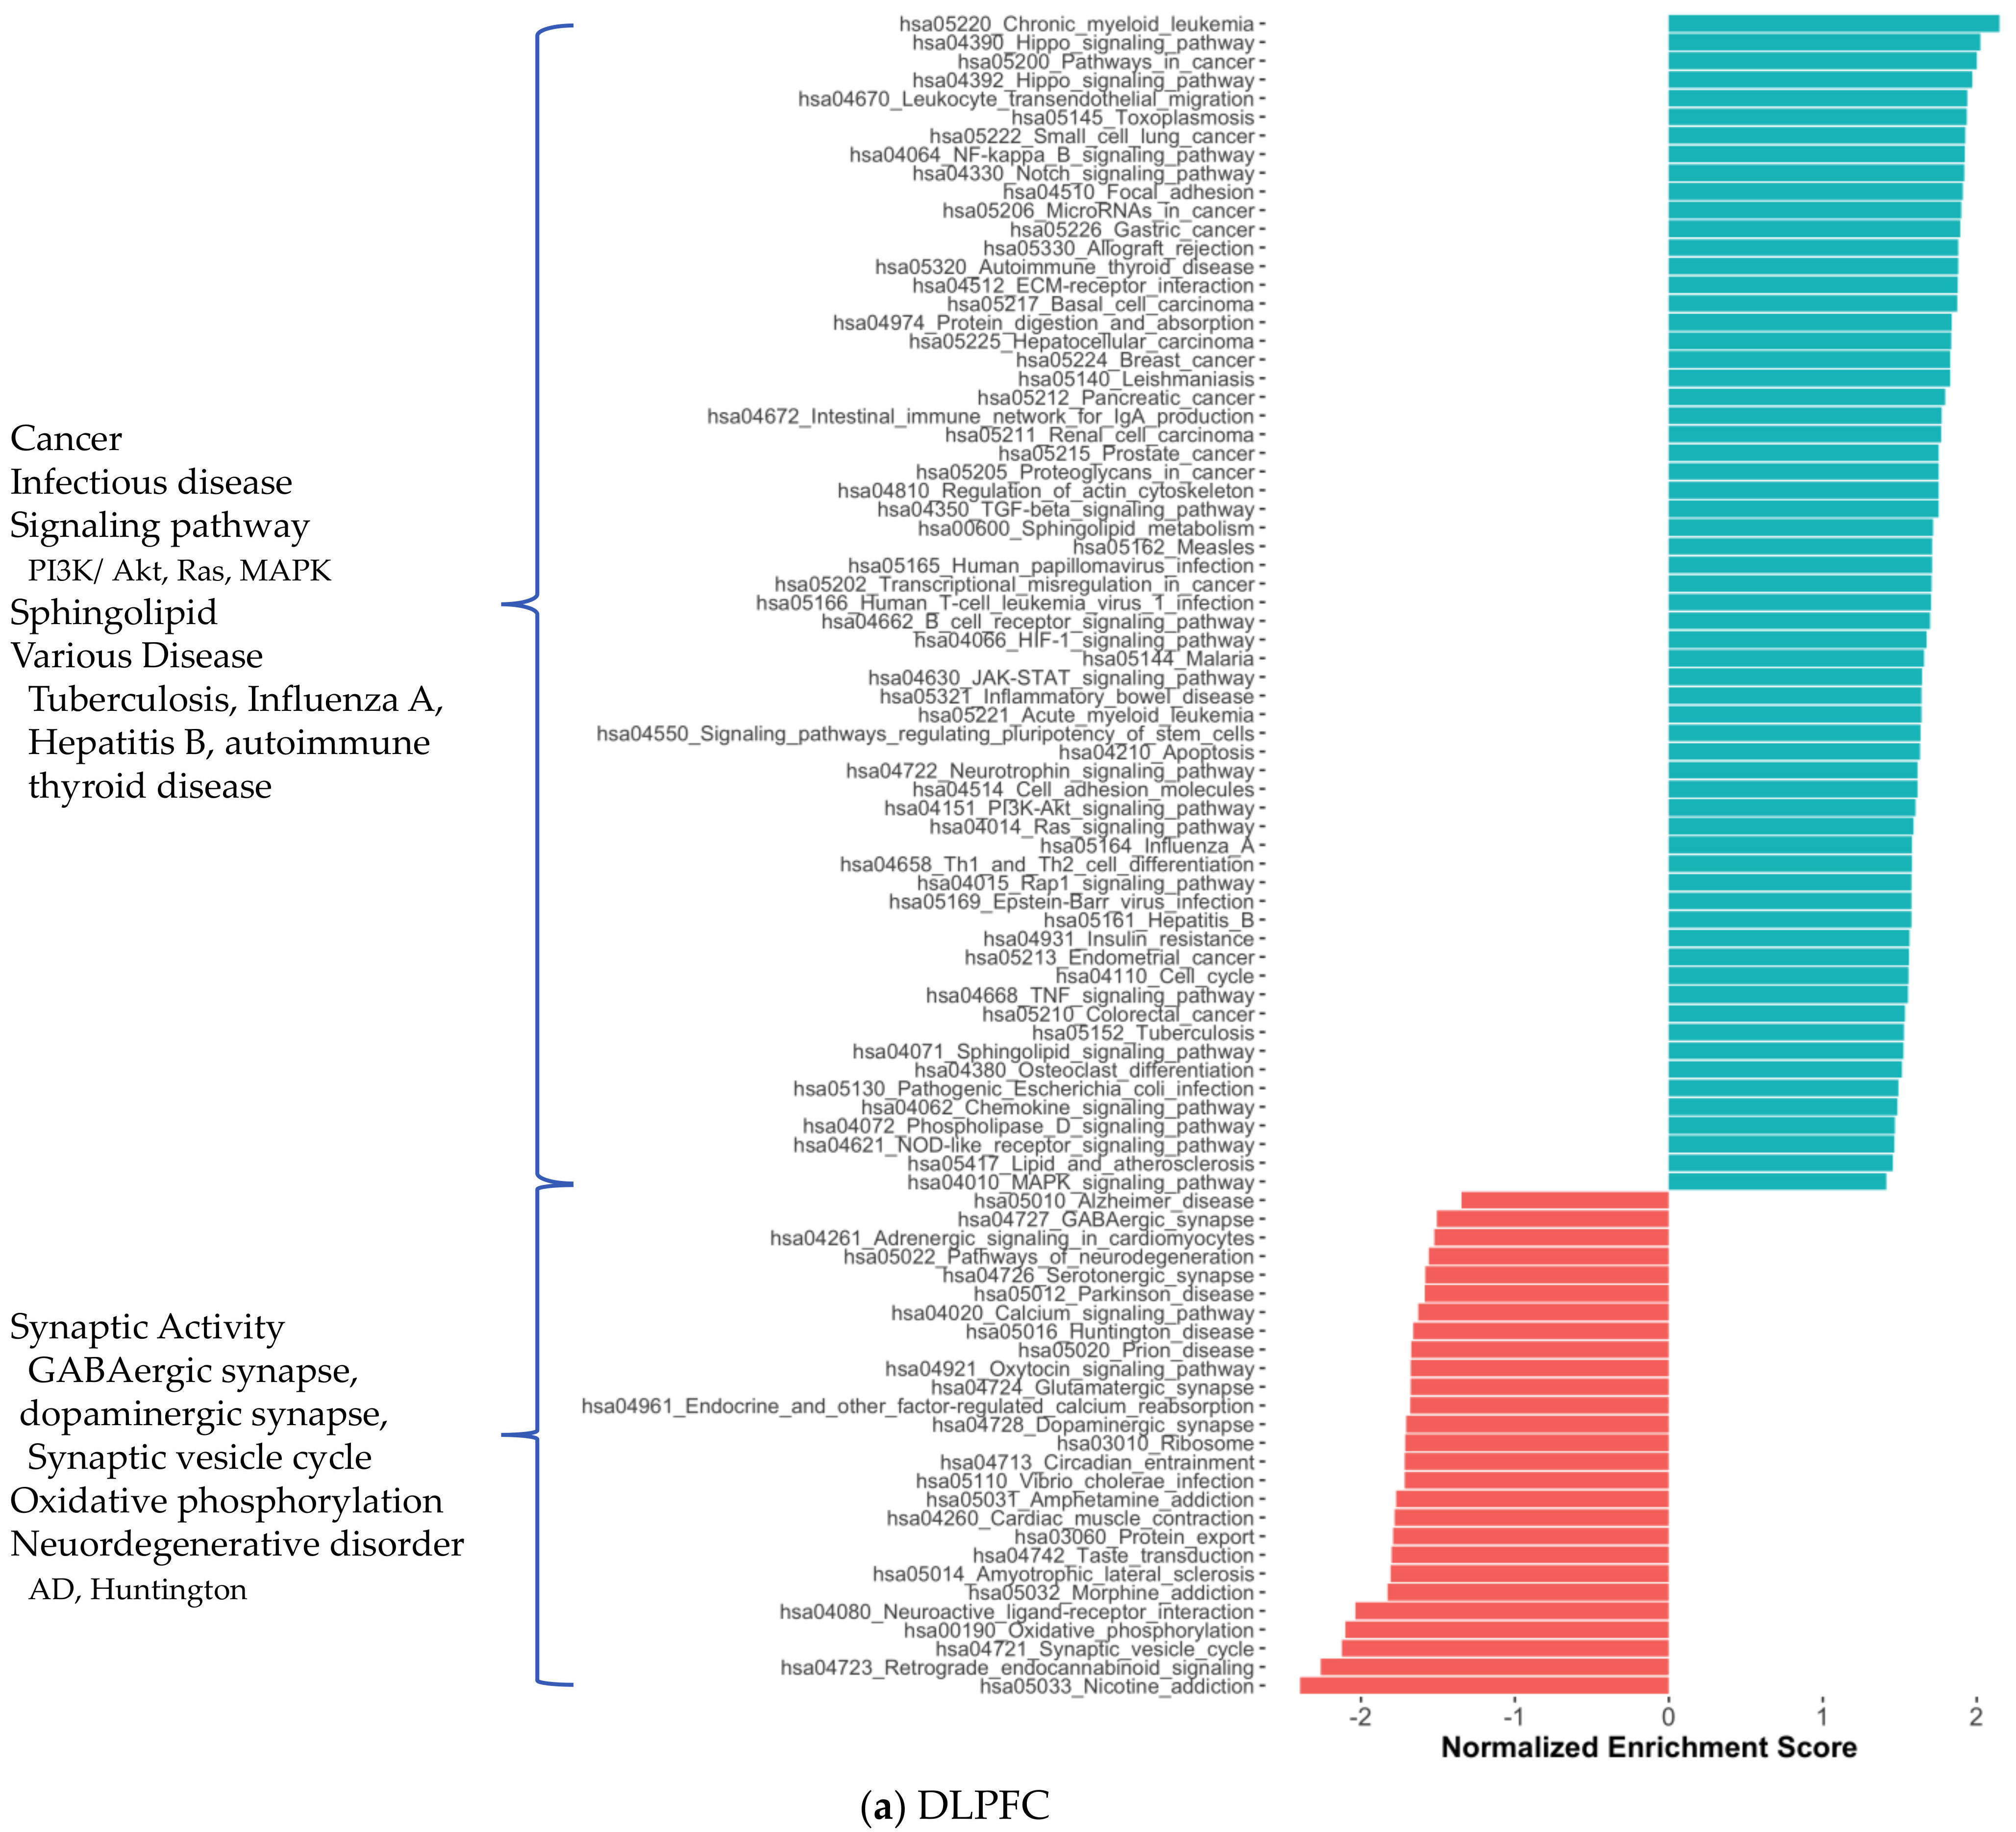
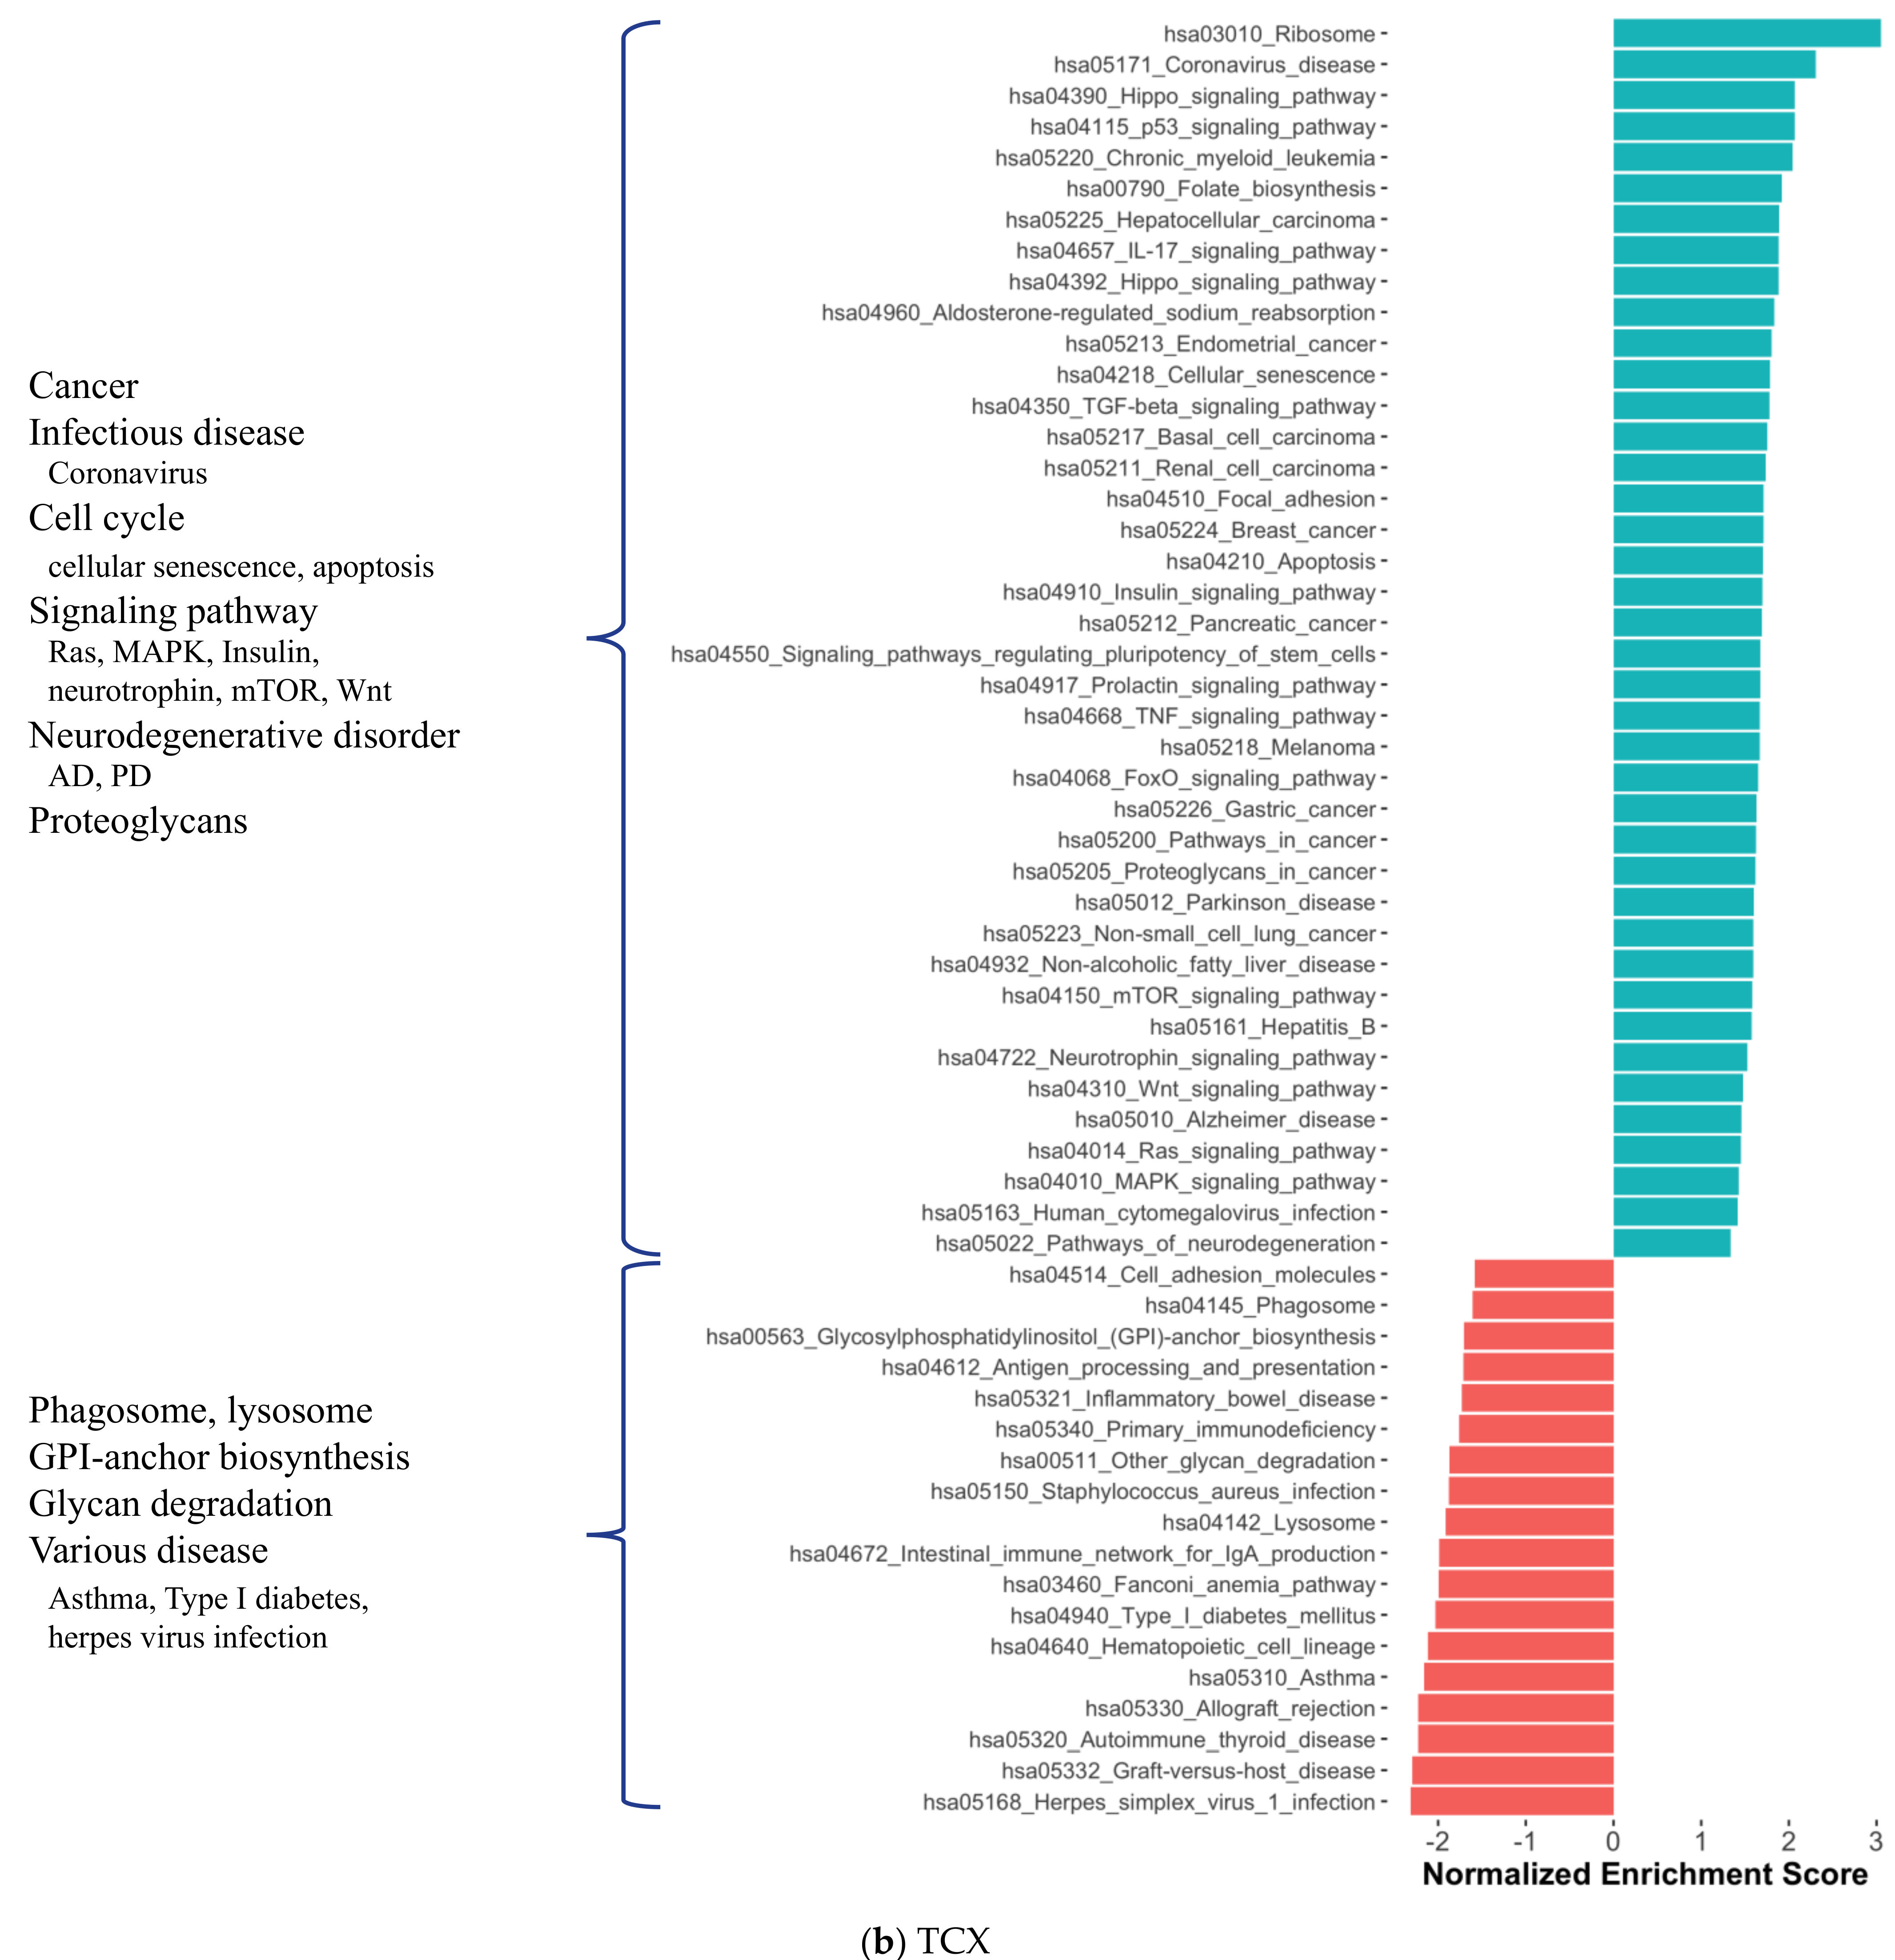
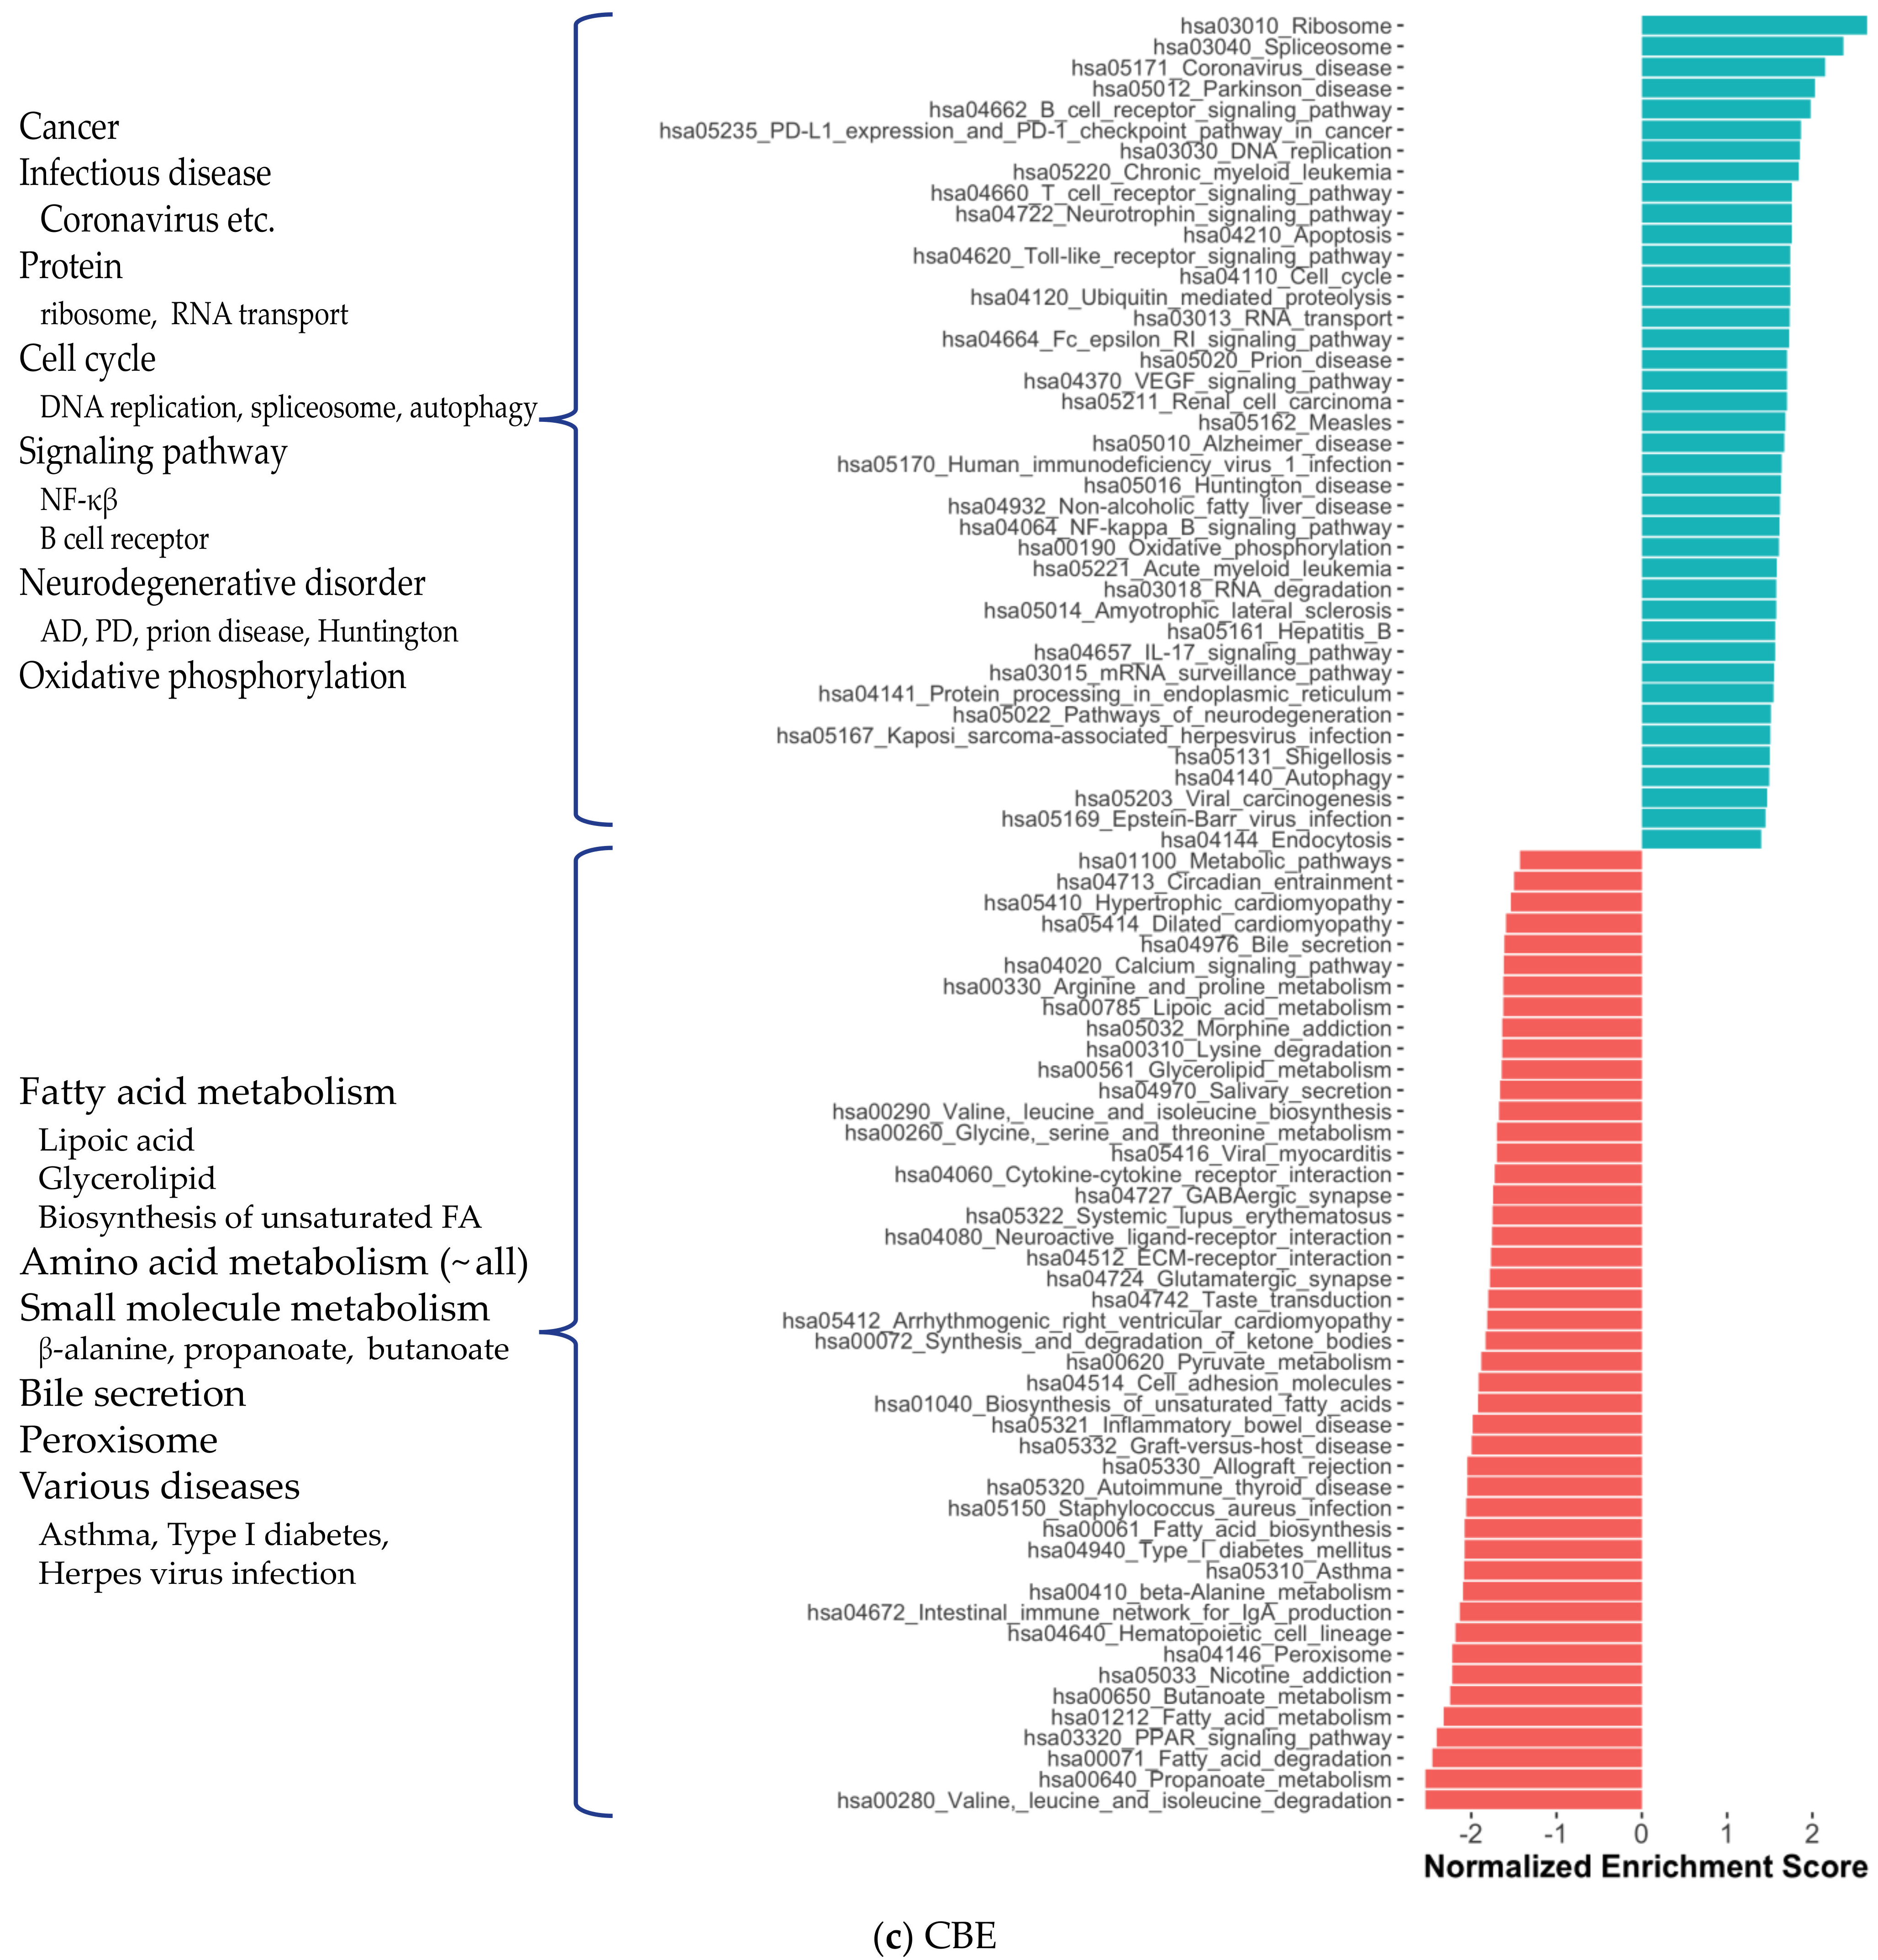
2.1. Distinct Gene Expression and Functional Profiles in Different Brain Regions of AD
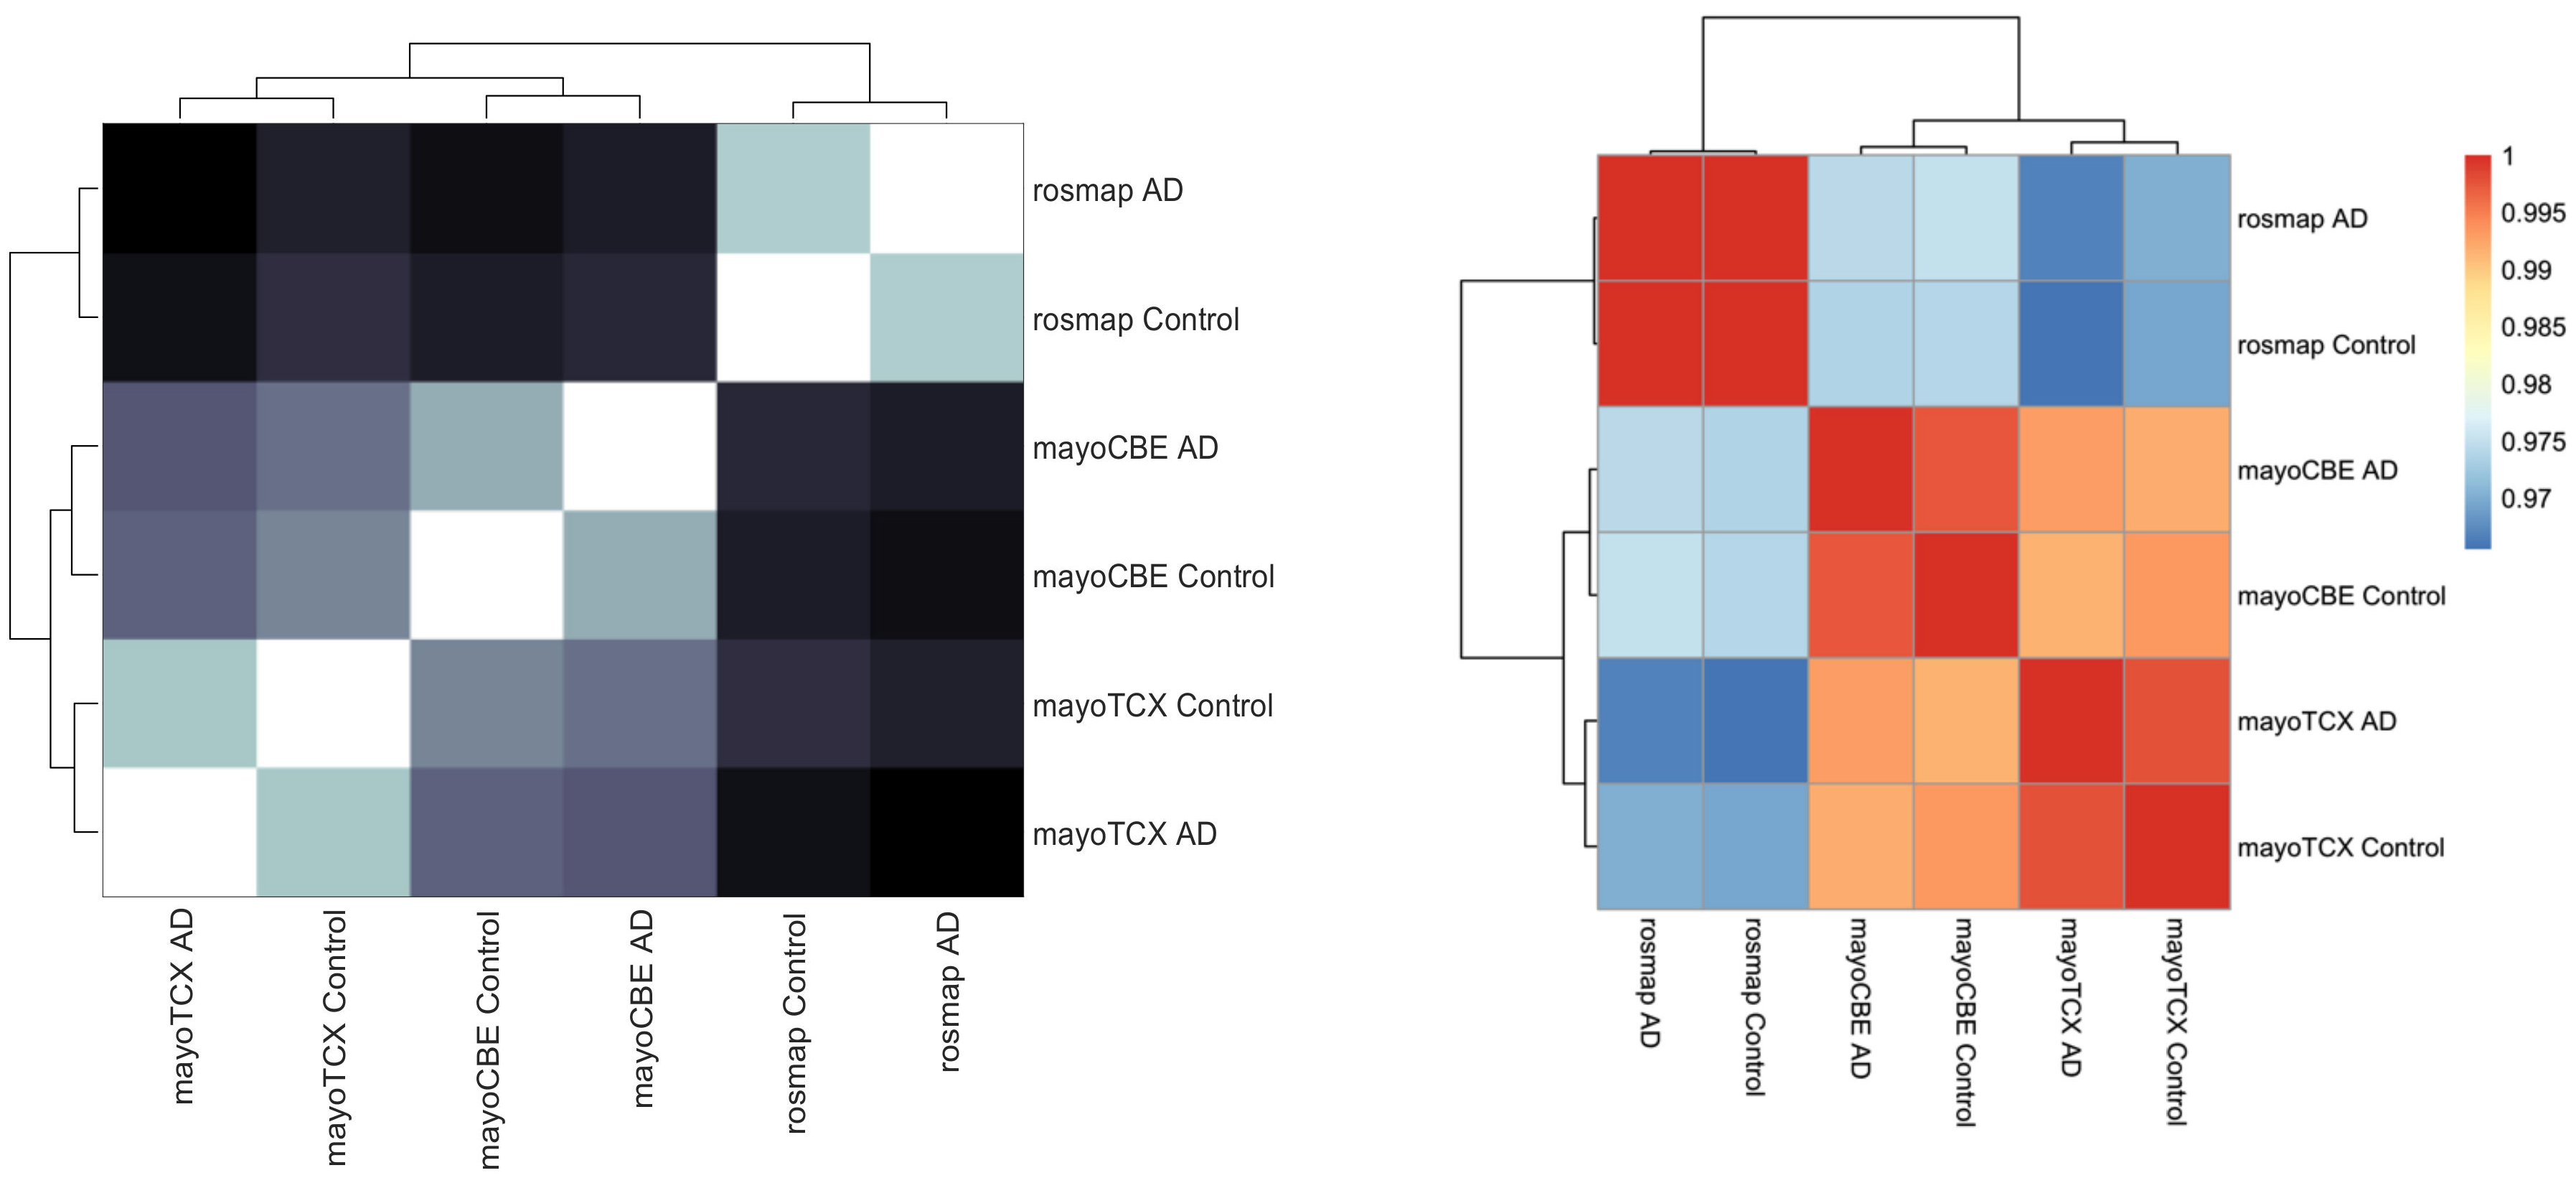
2.2. Co-Expression Network Analysis in Different Brain Regions of AD
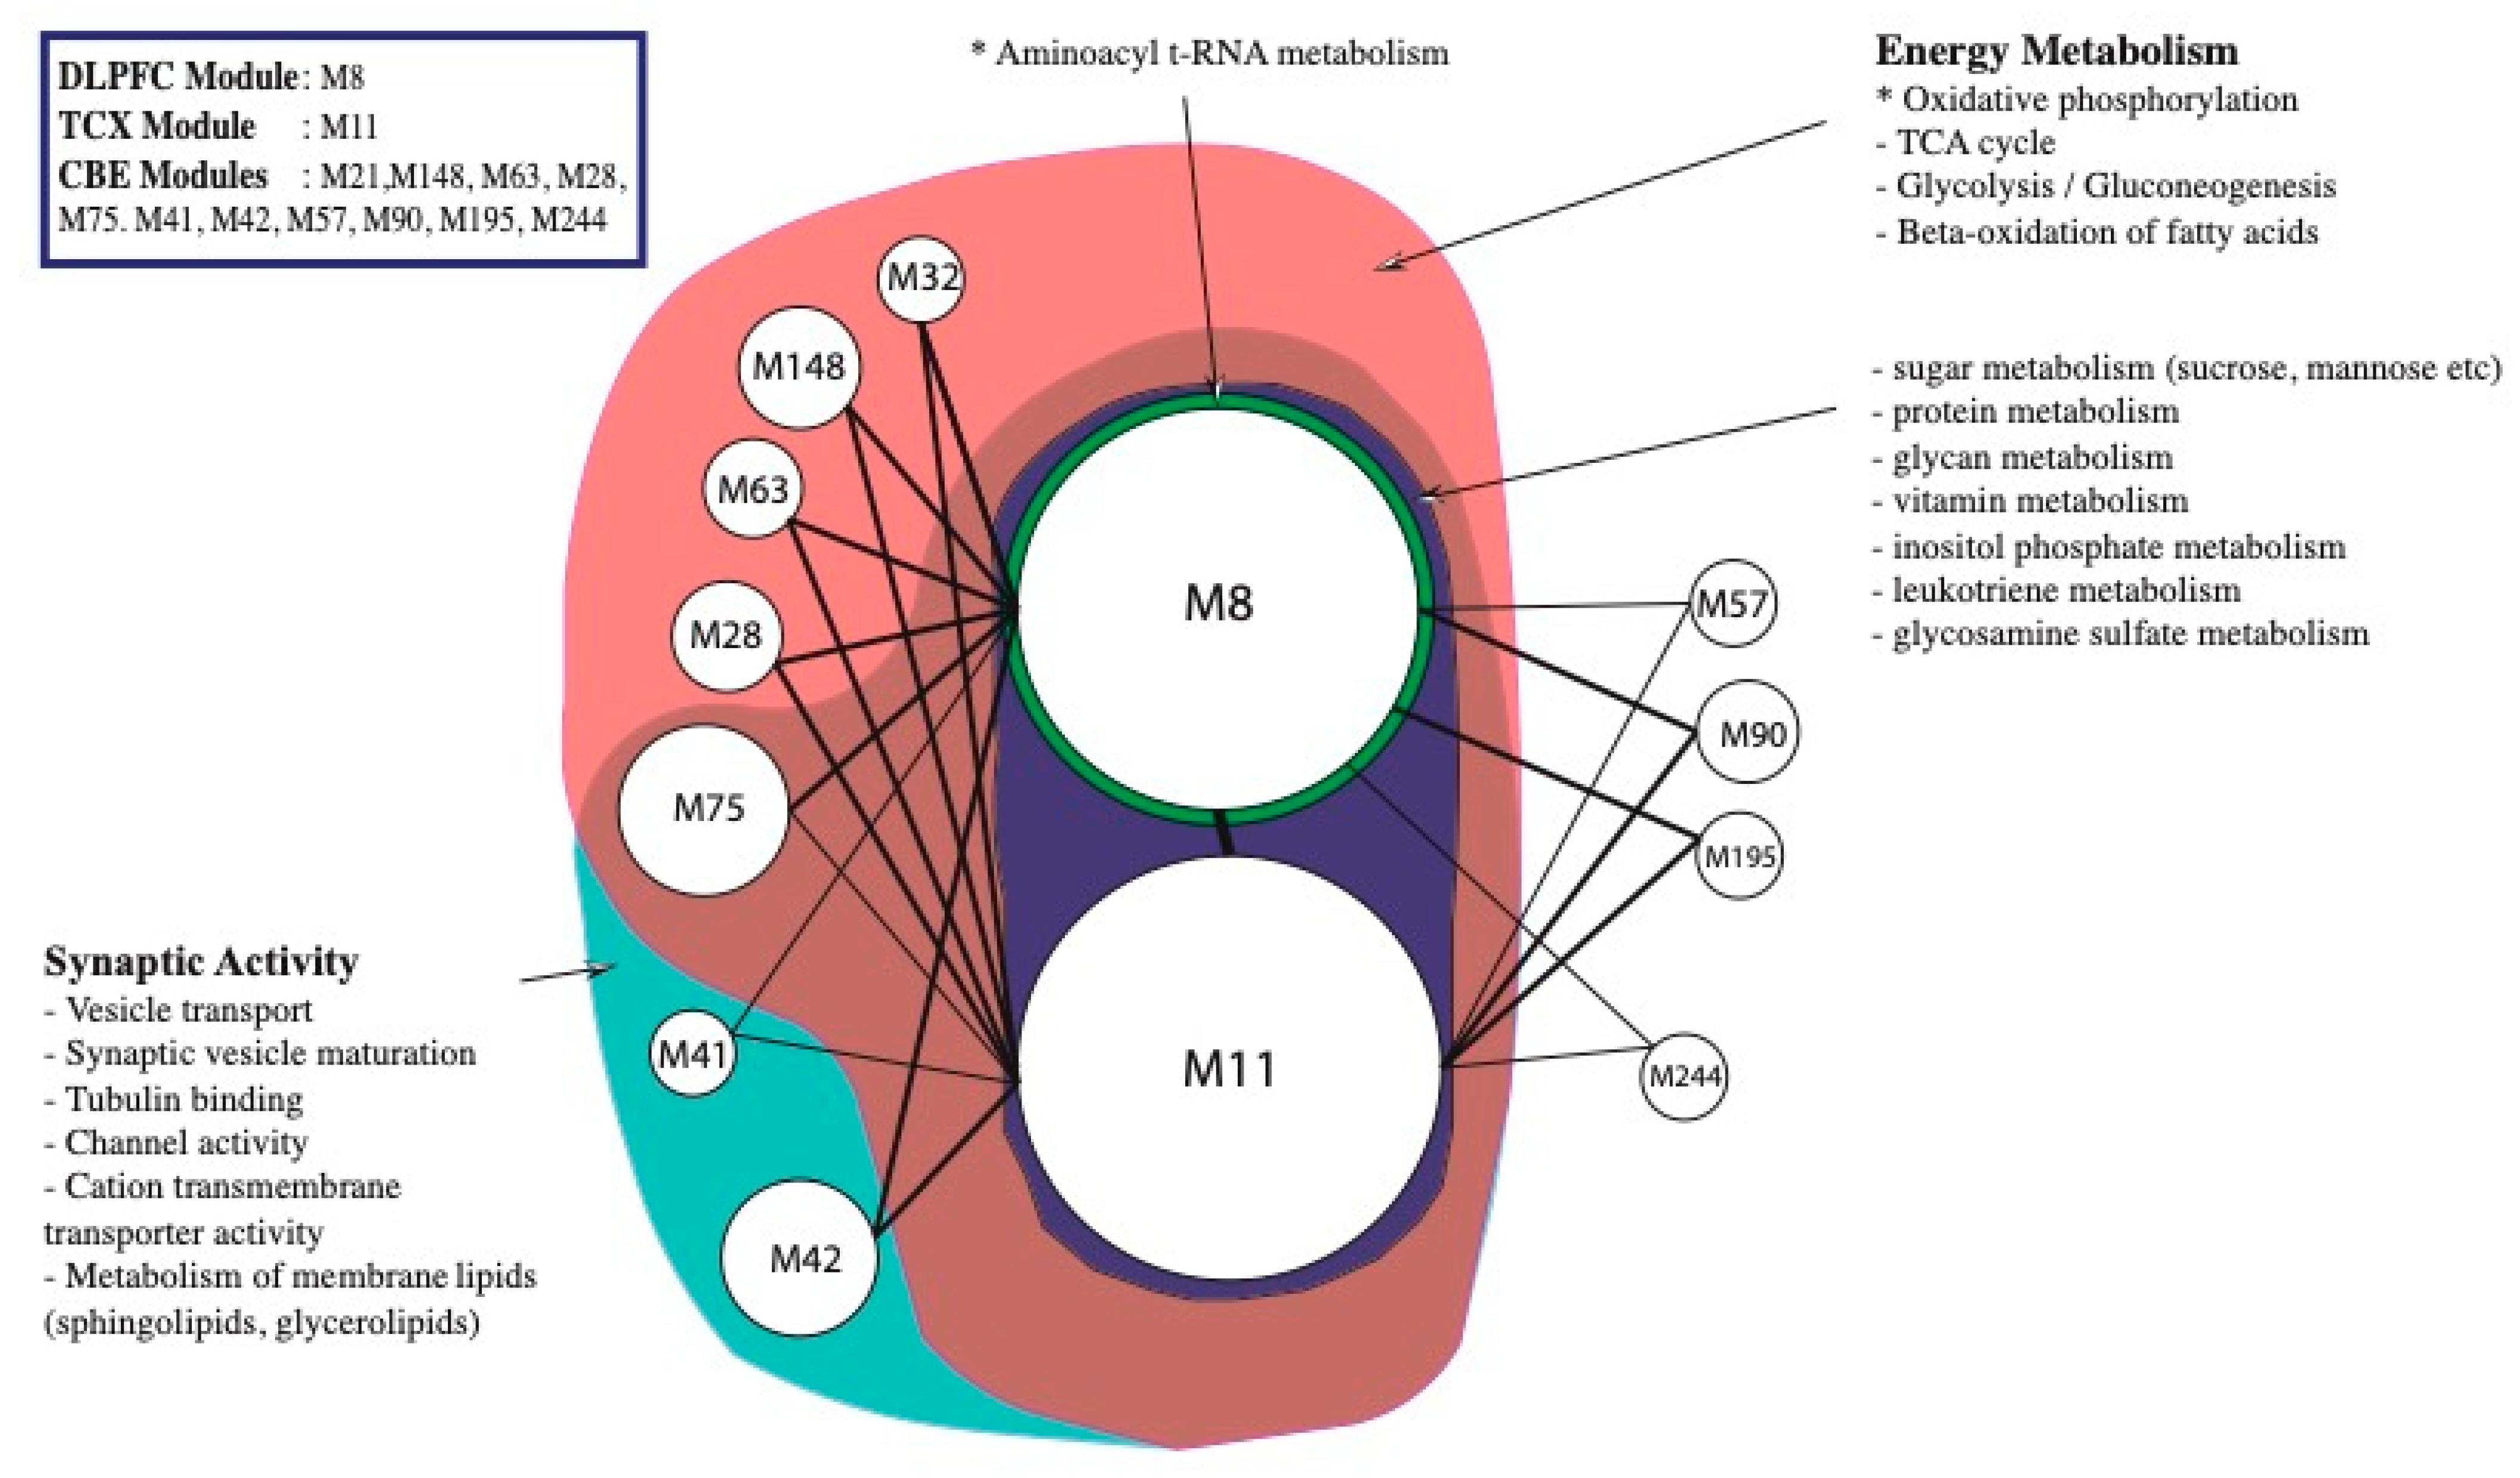
2.3. Alterations in Energy Metabolism, Chaperones and Synaptic Activity
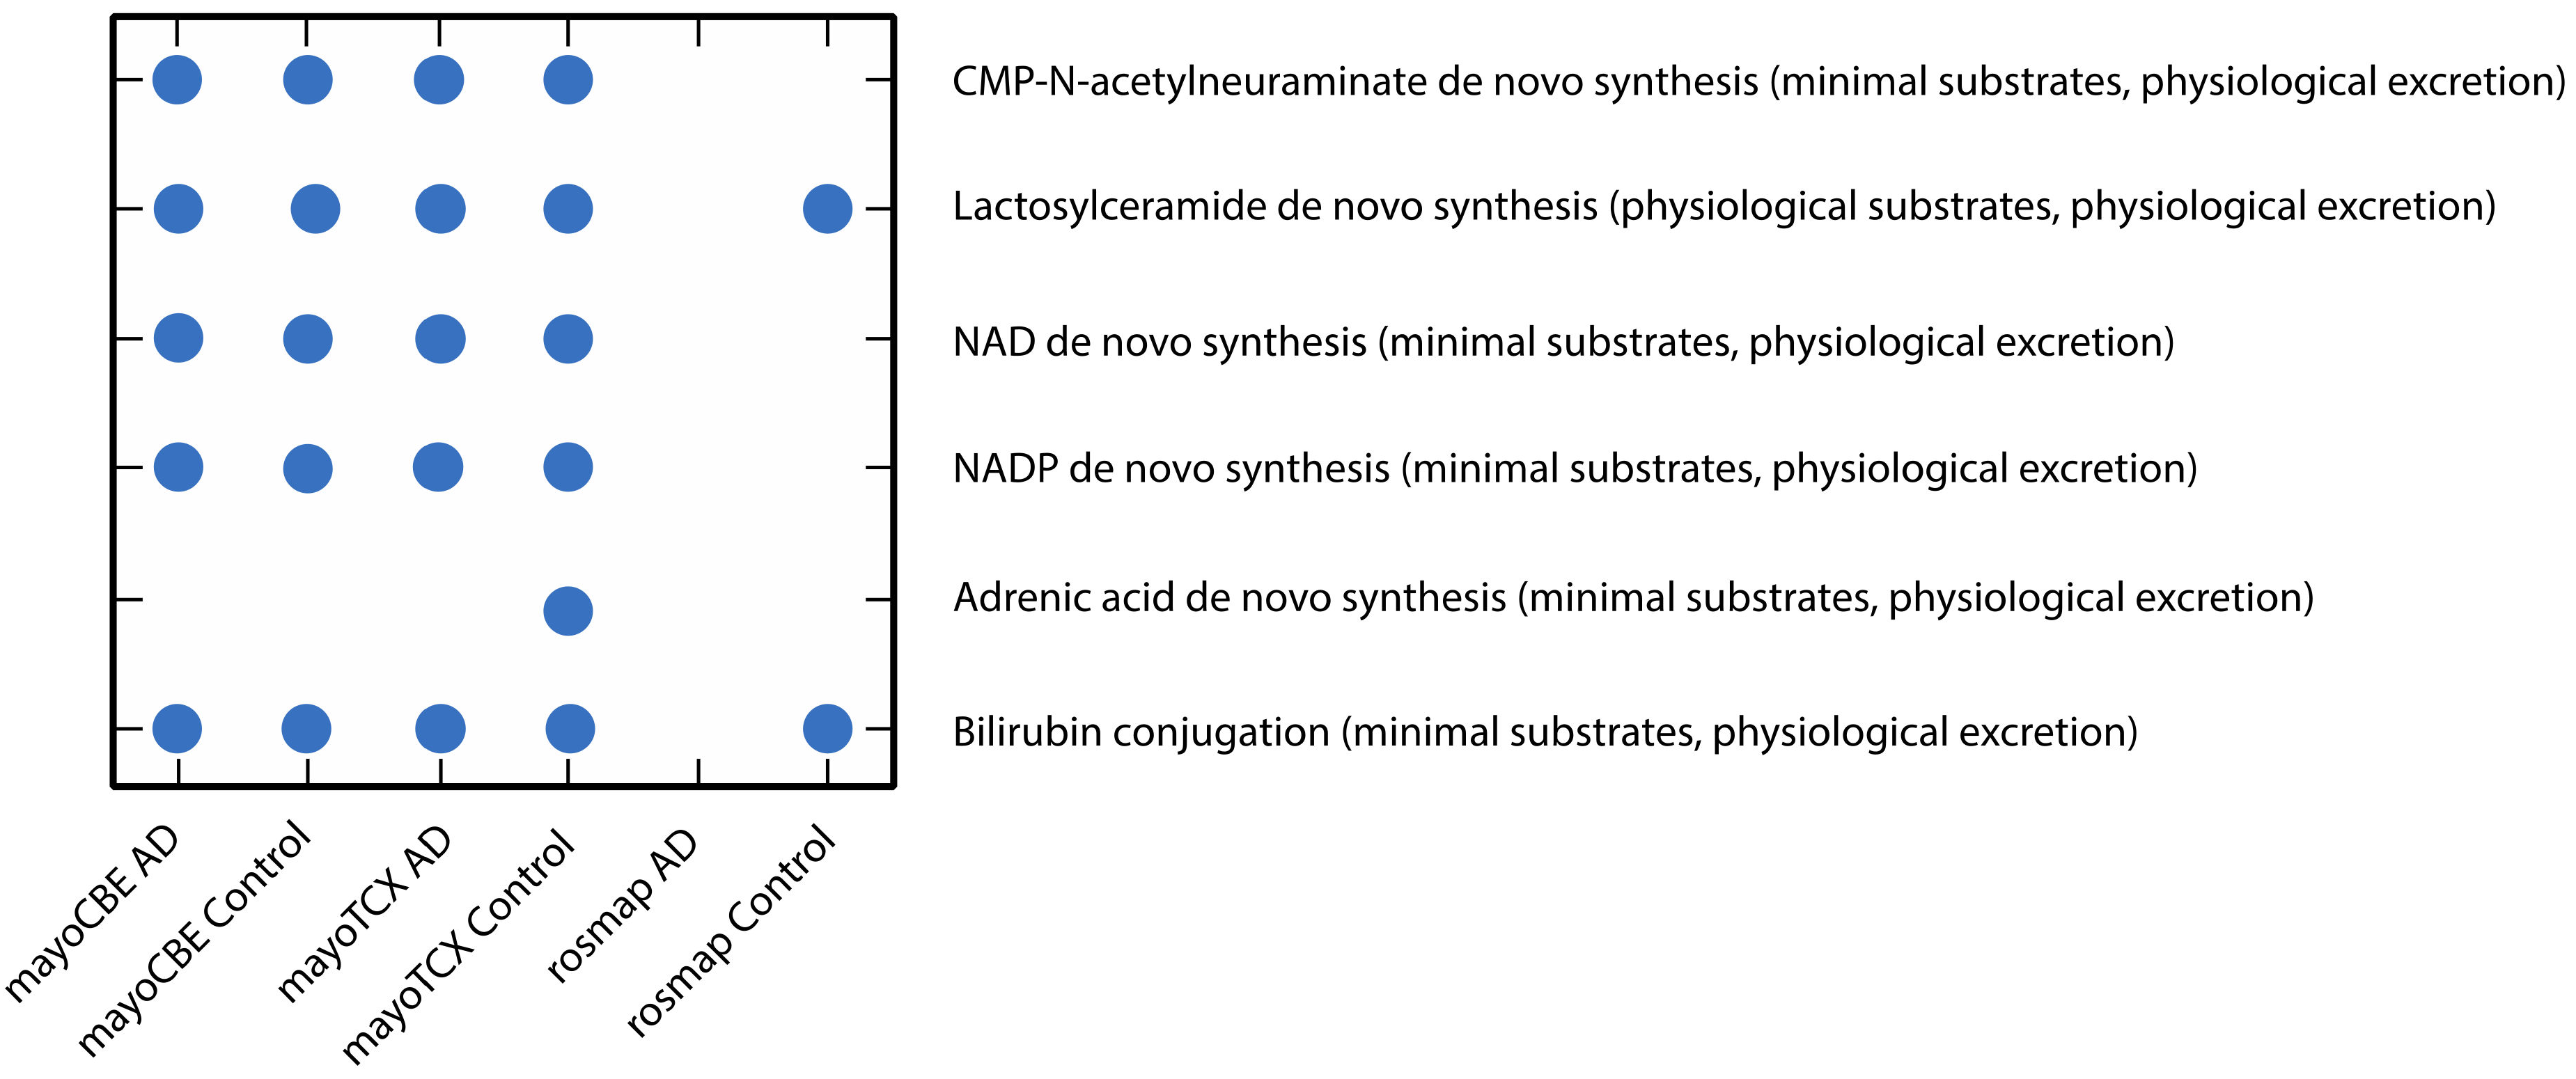
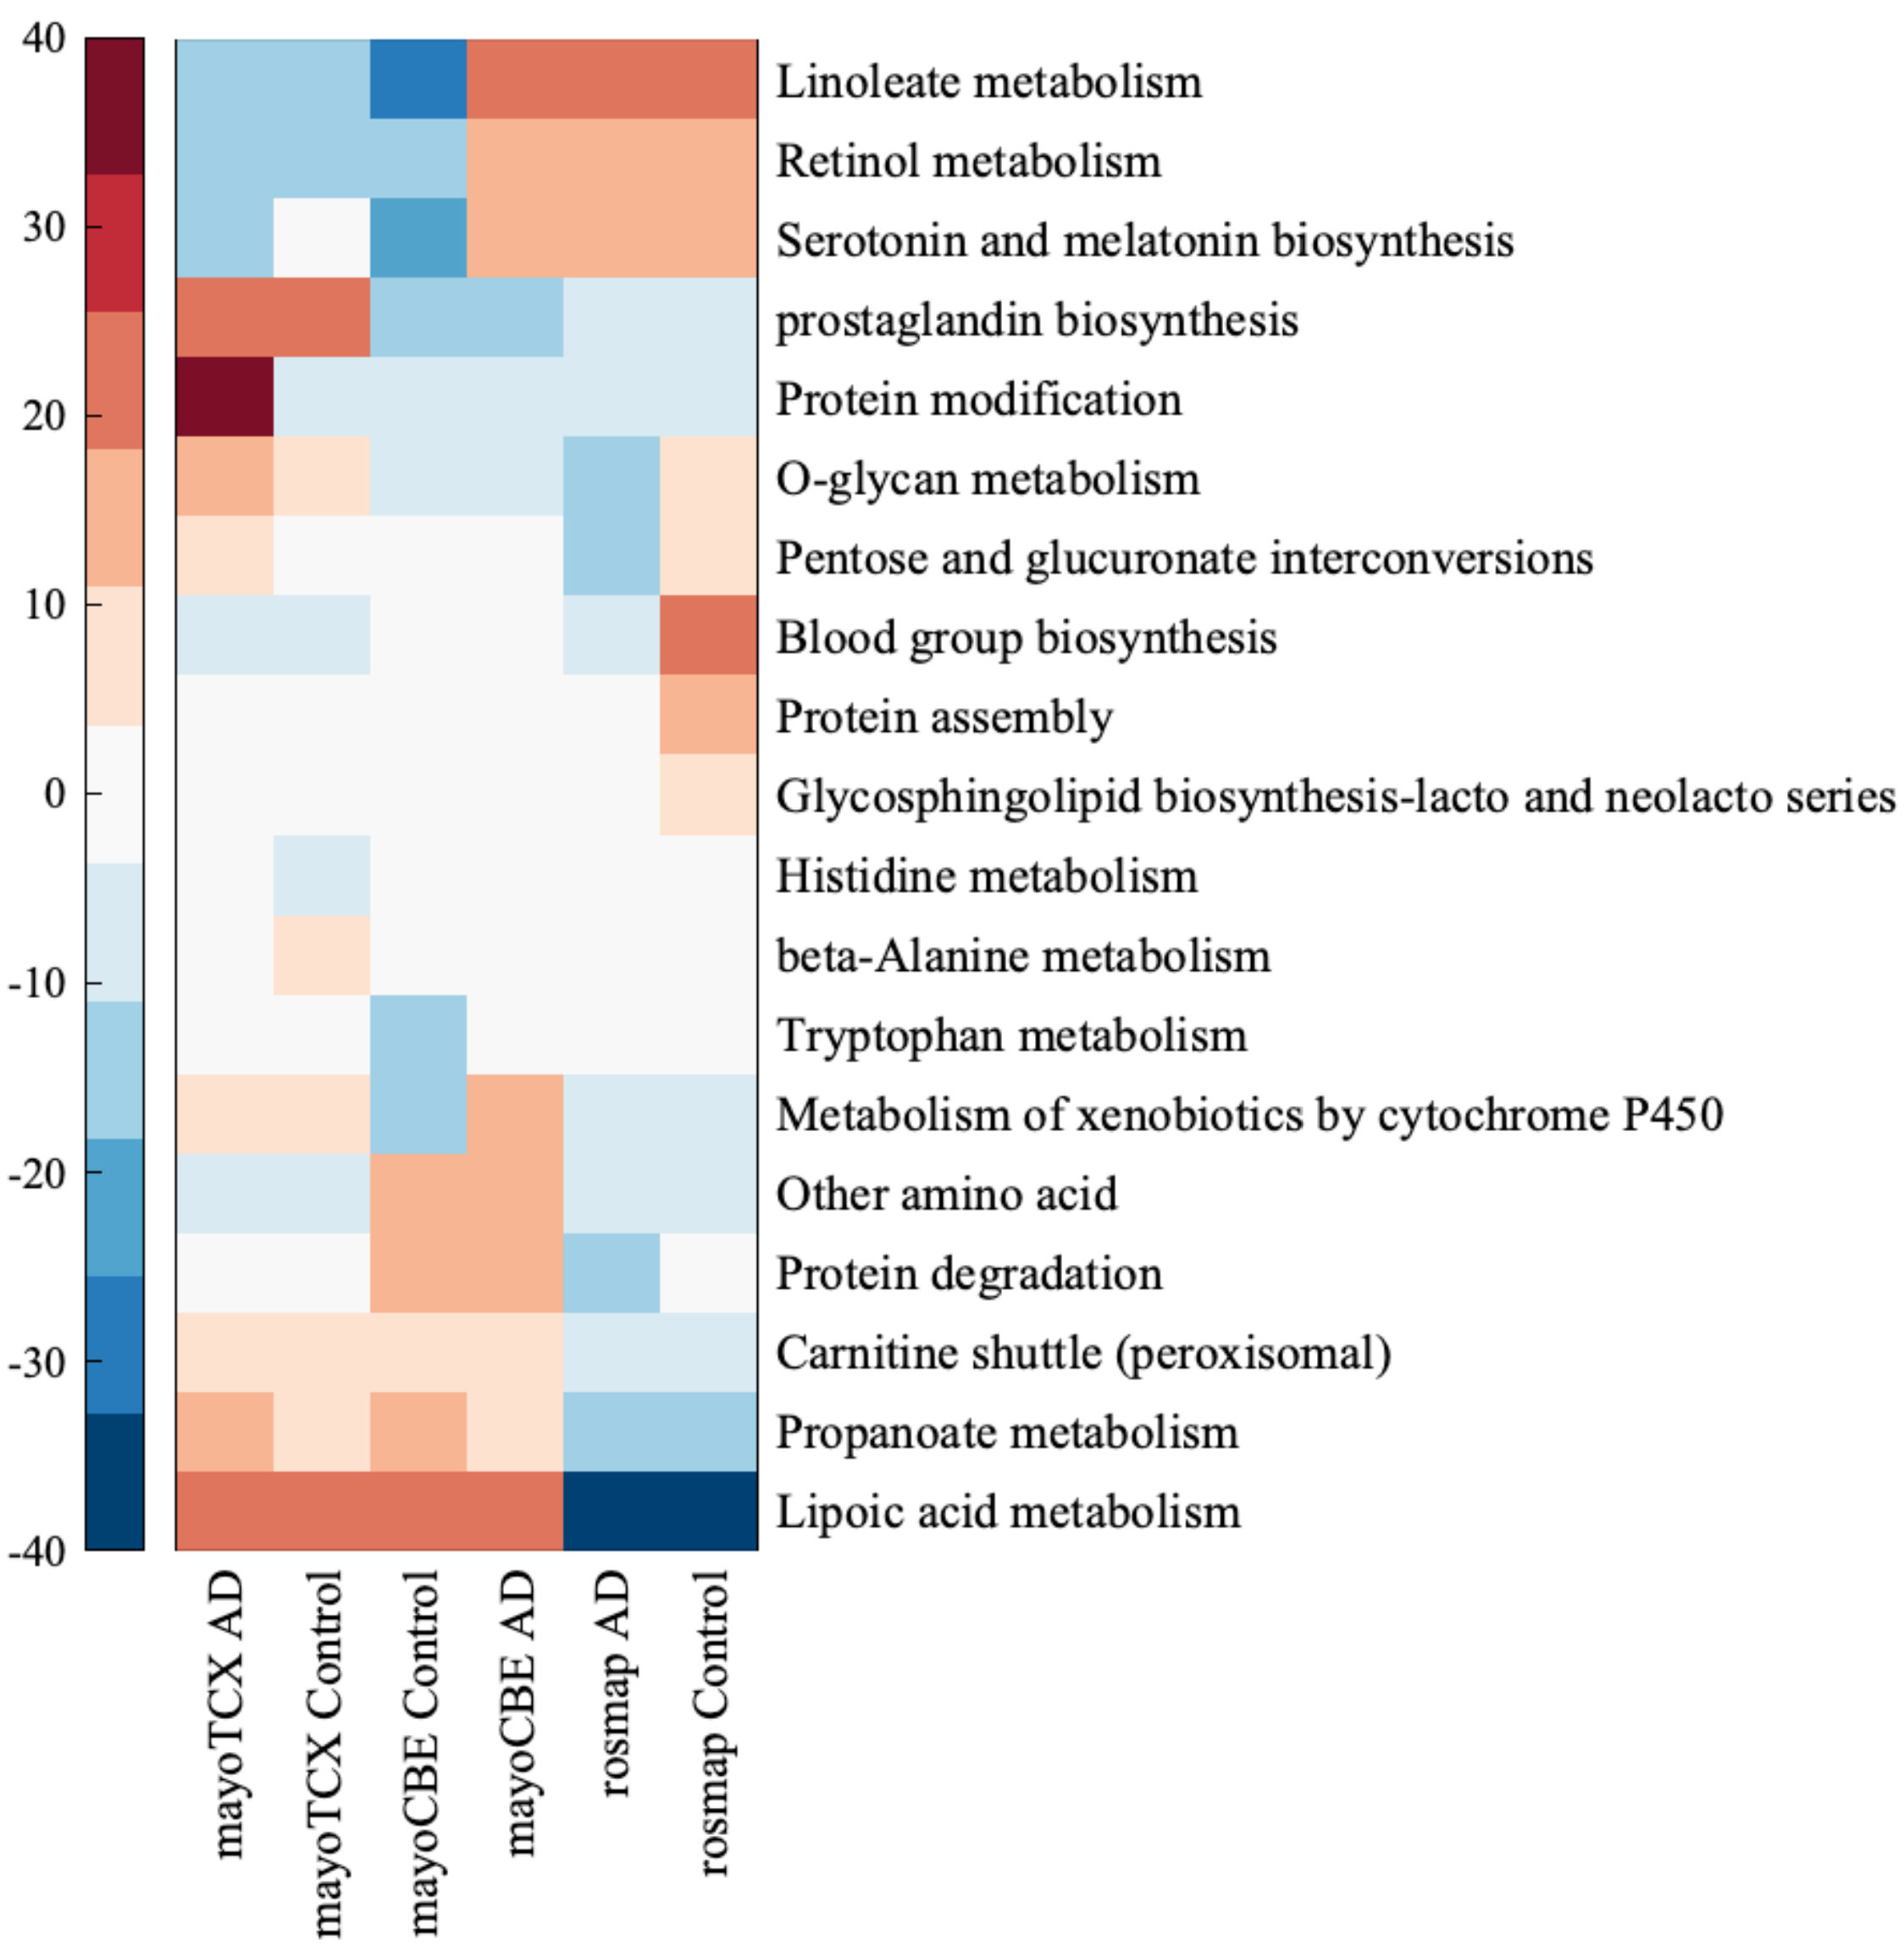
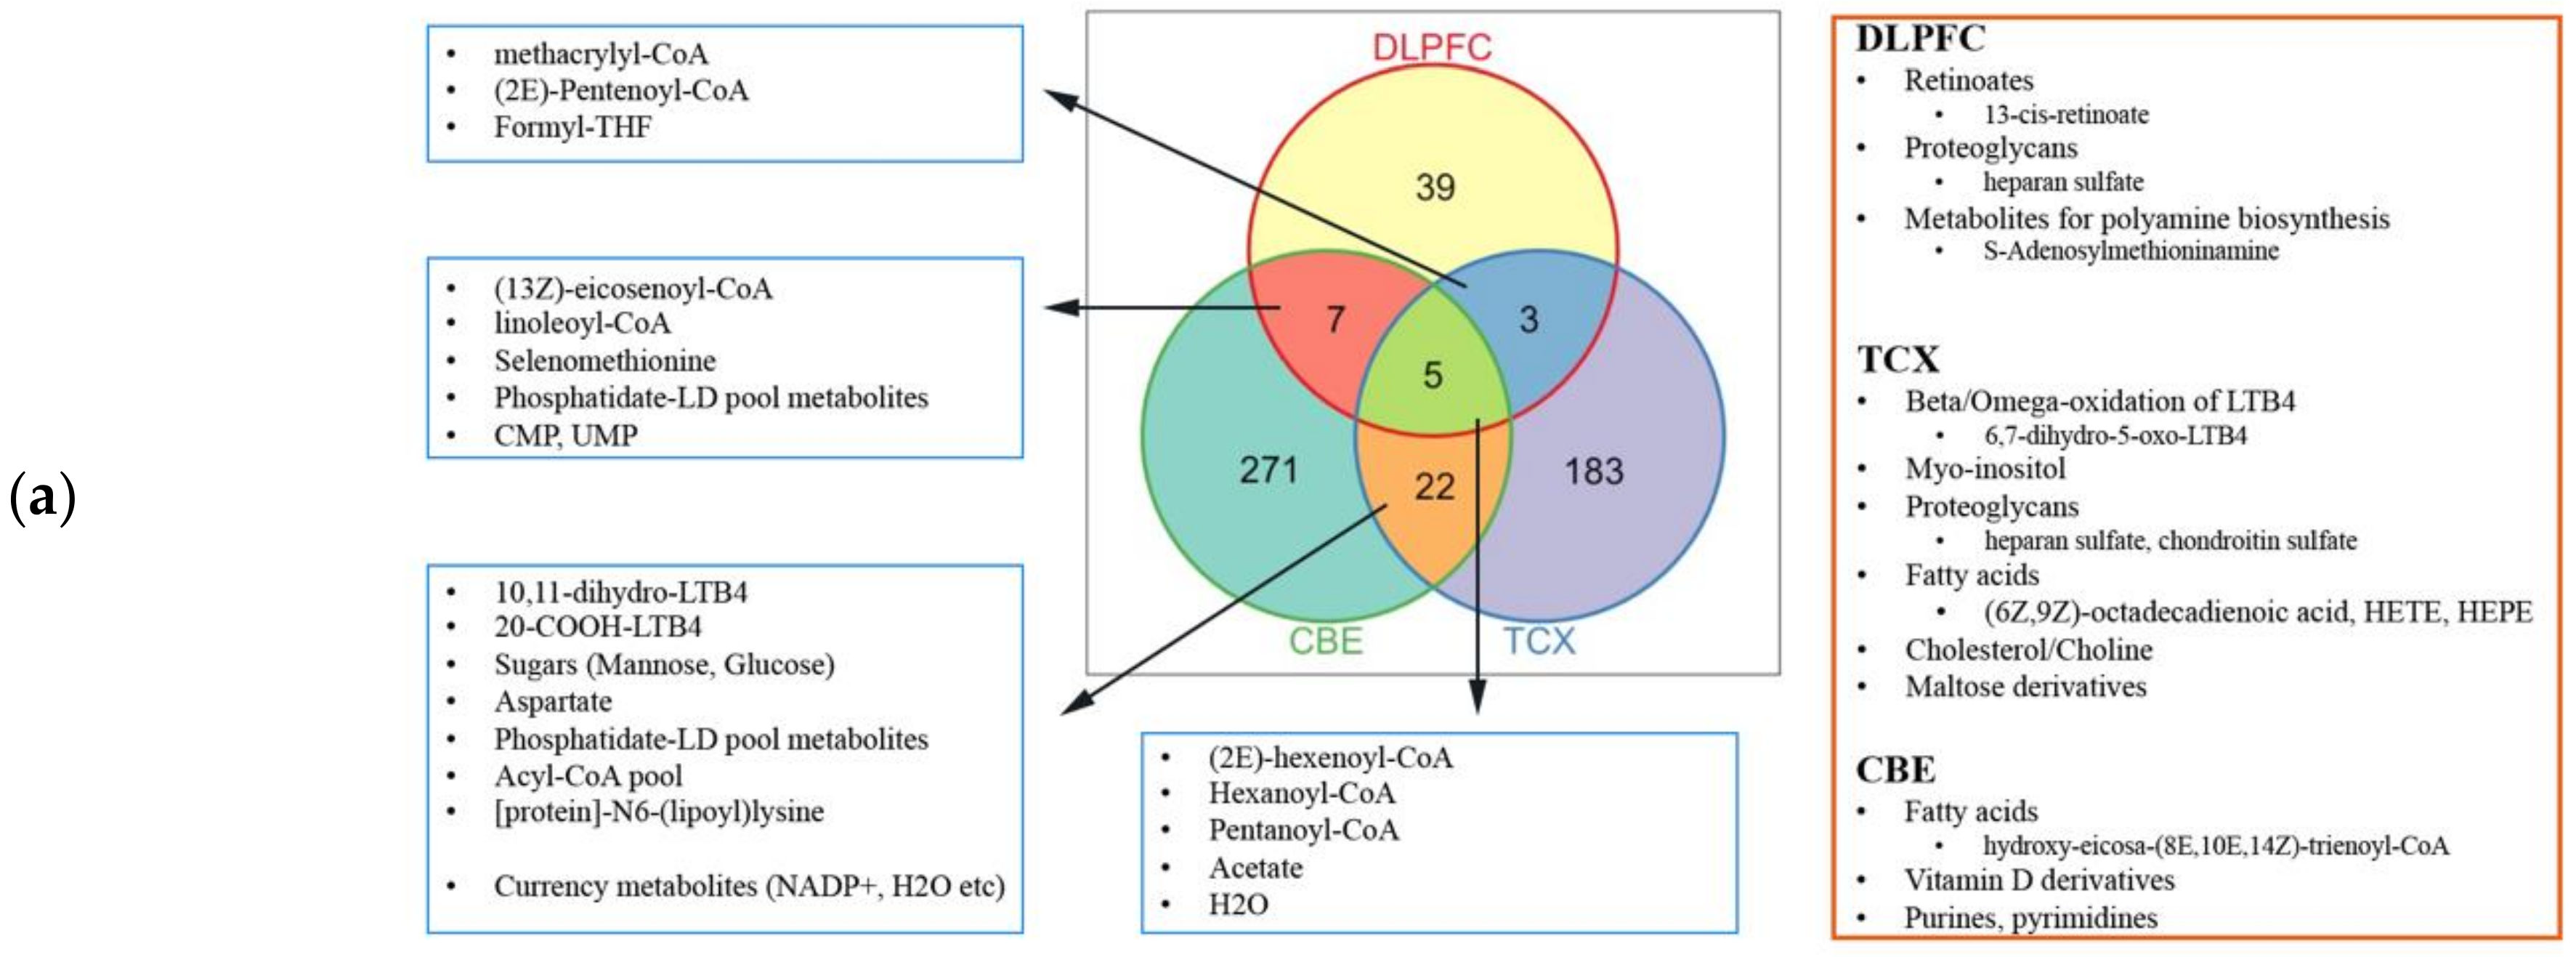
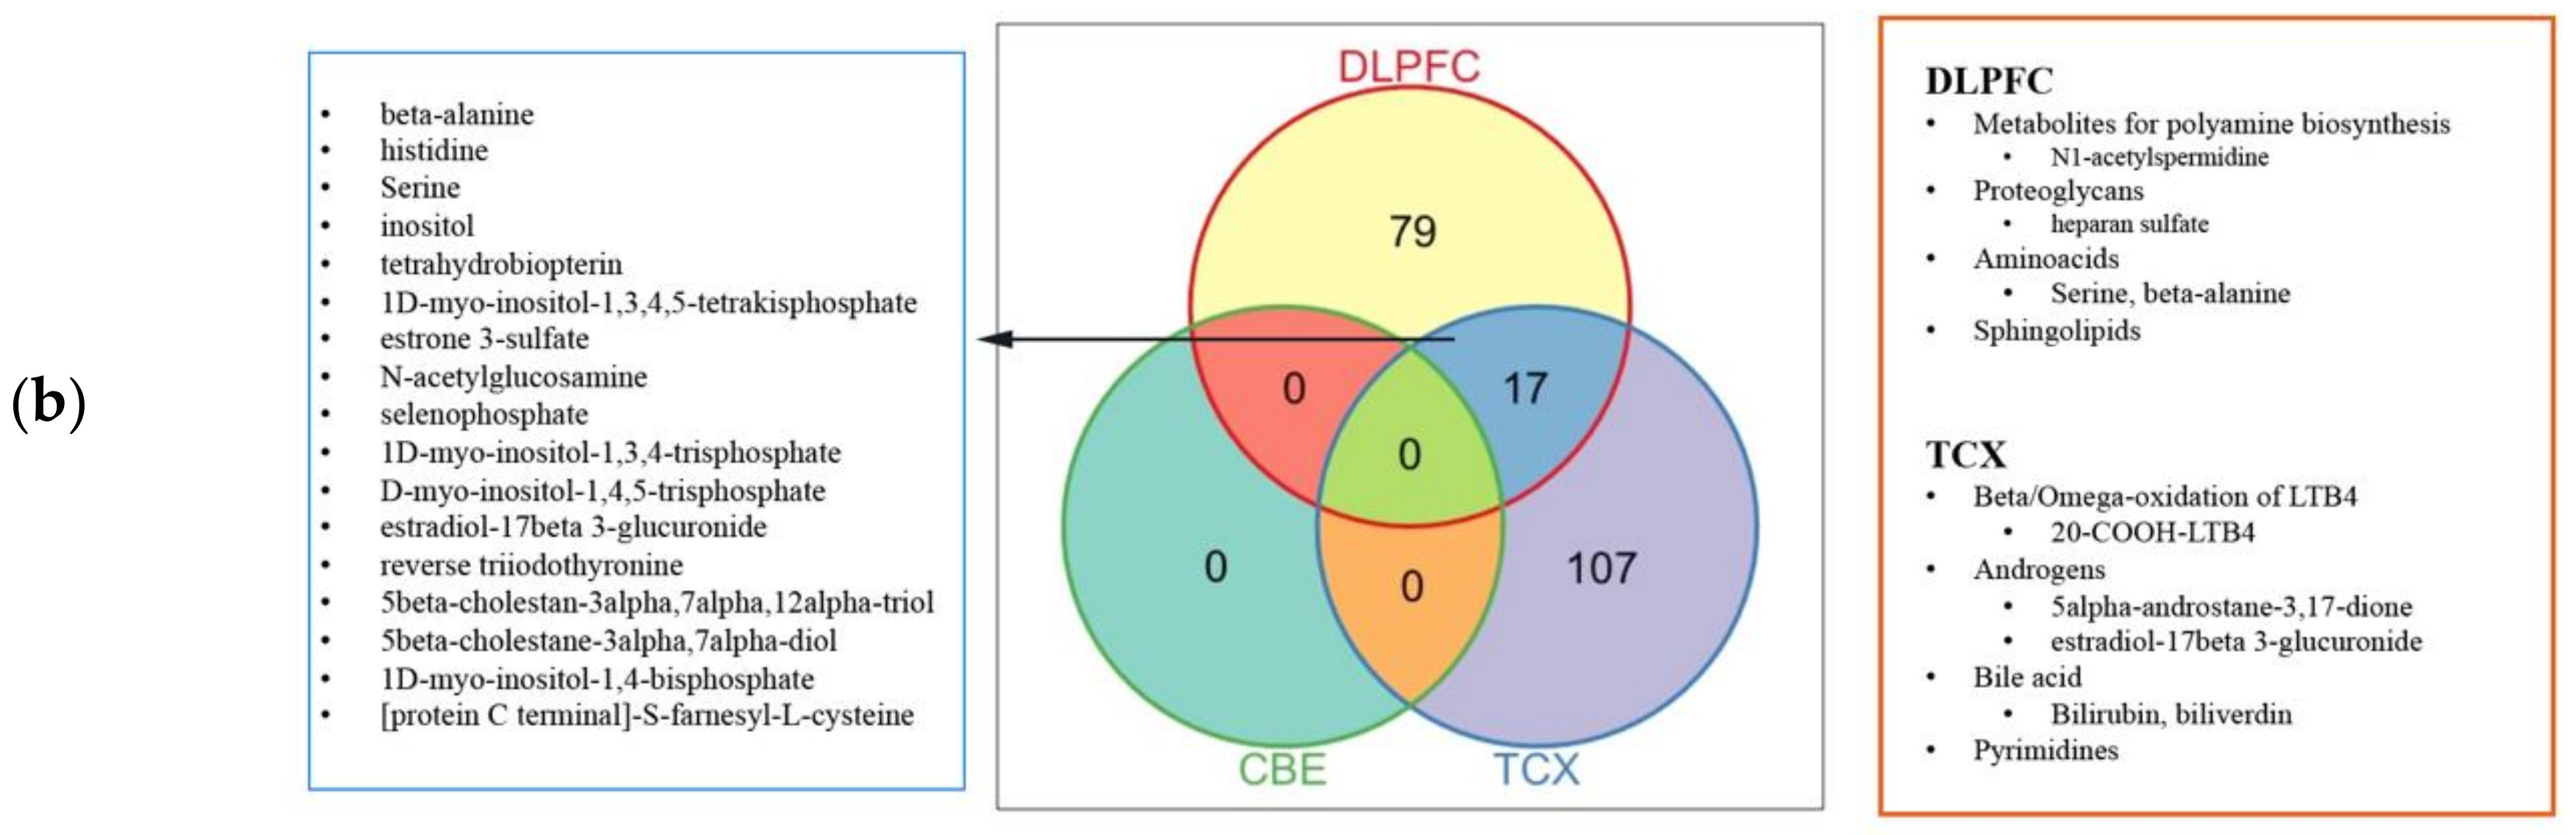
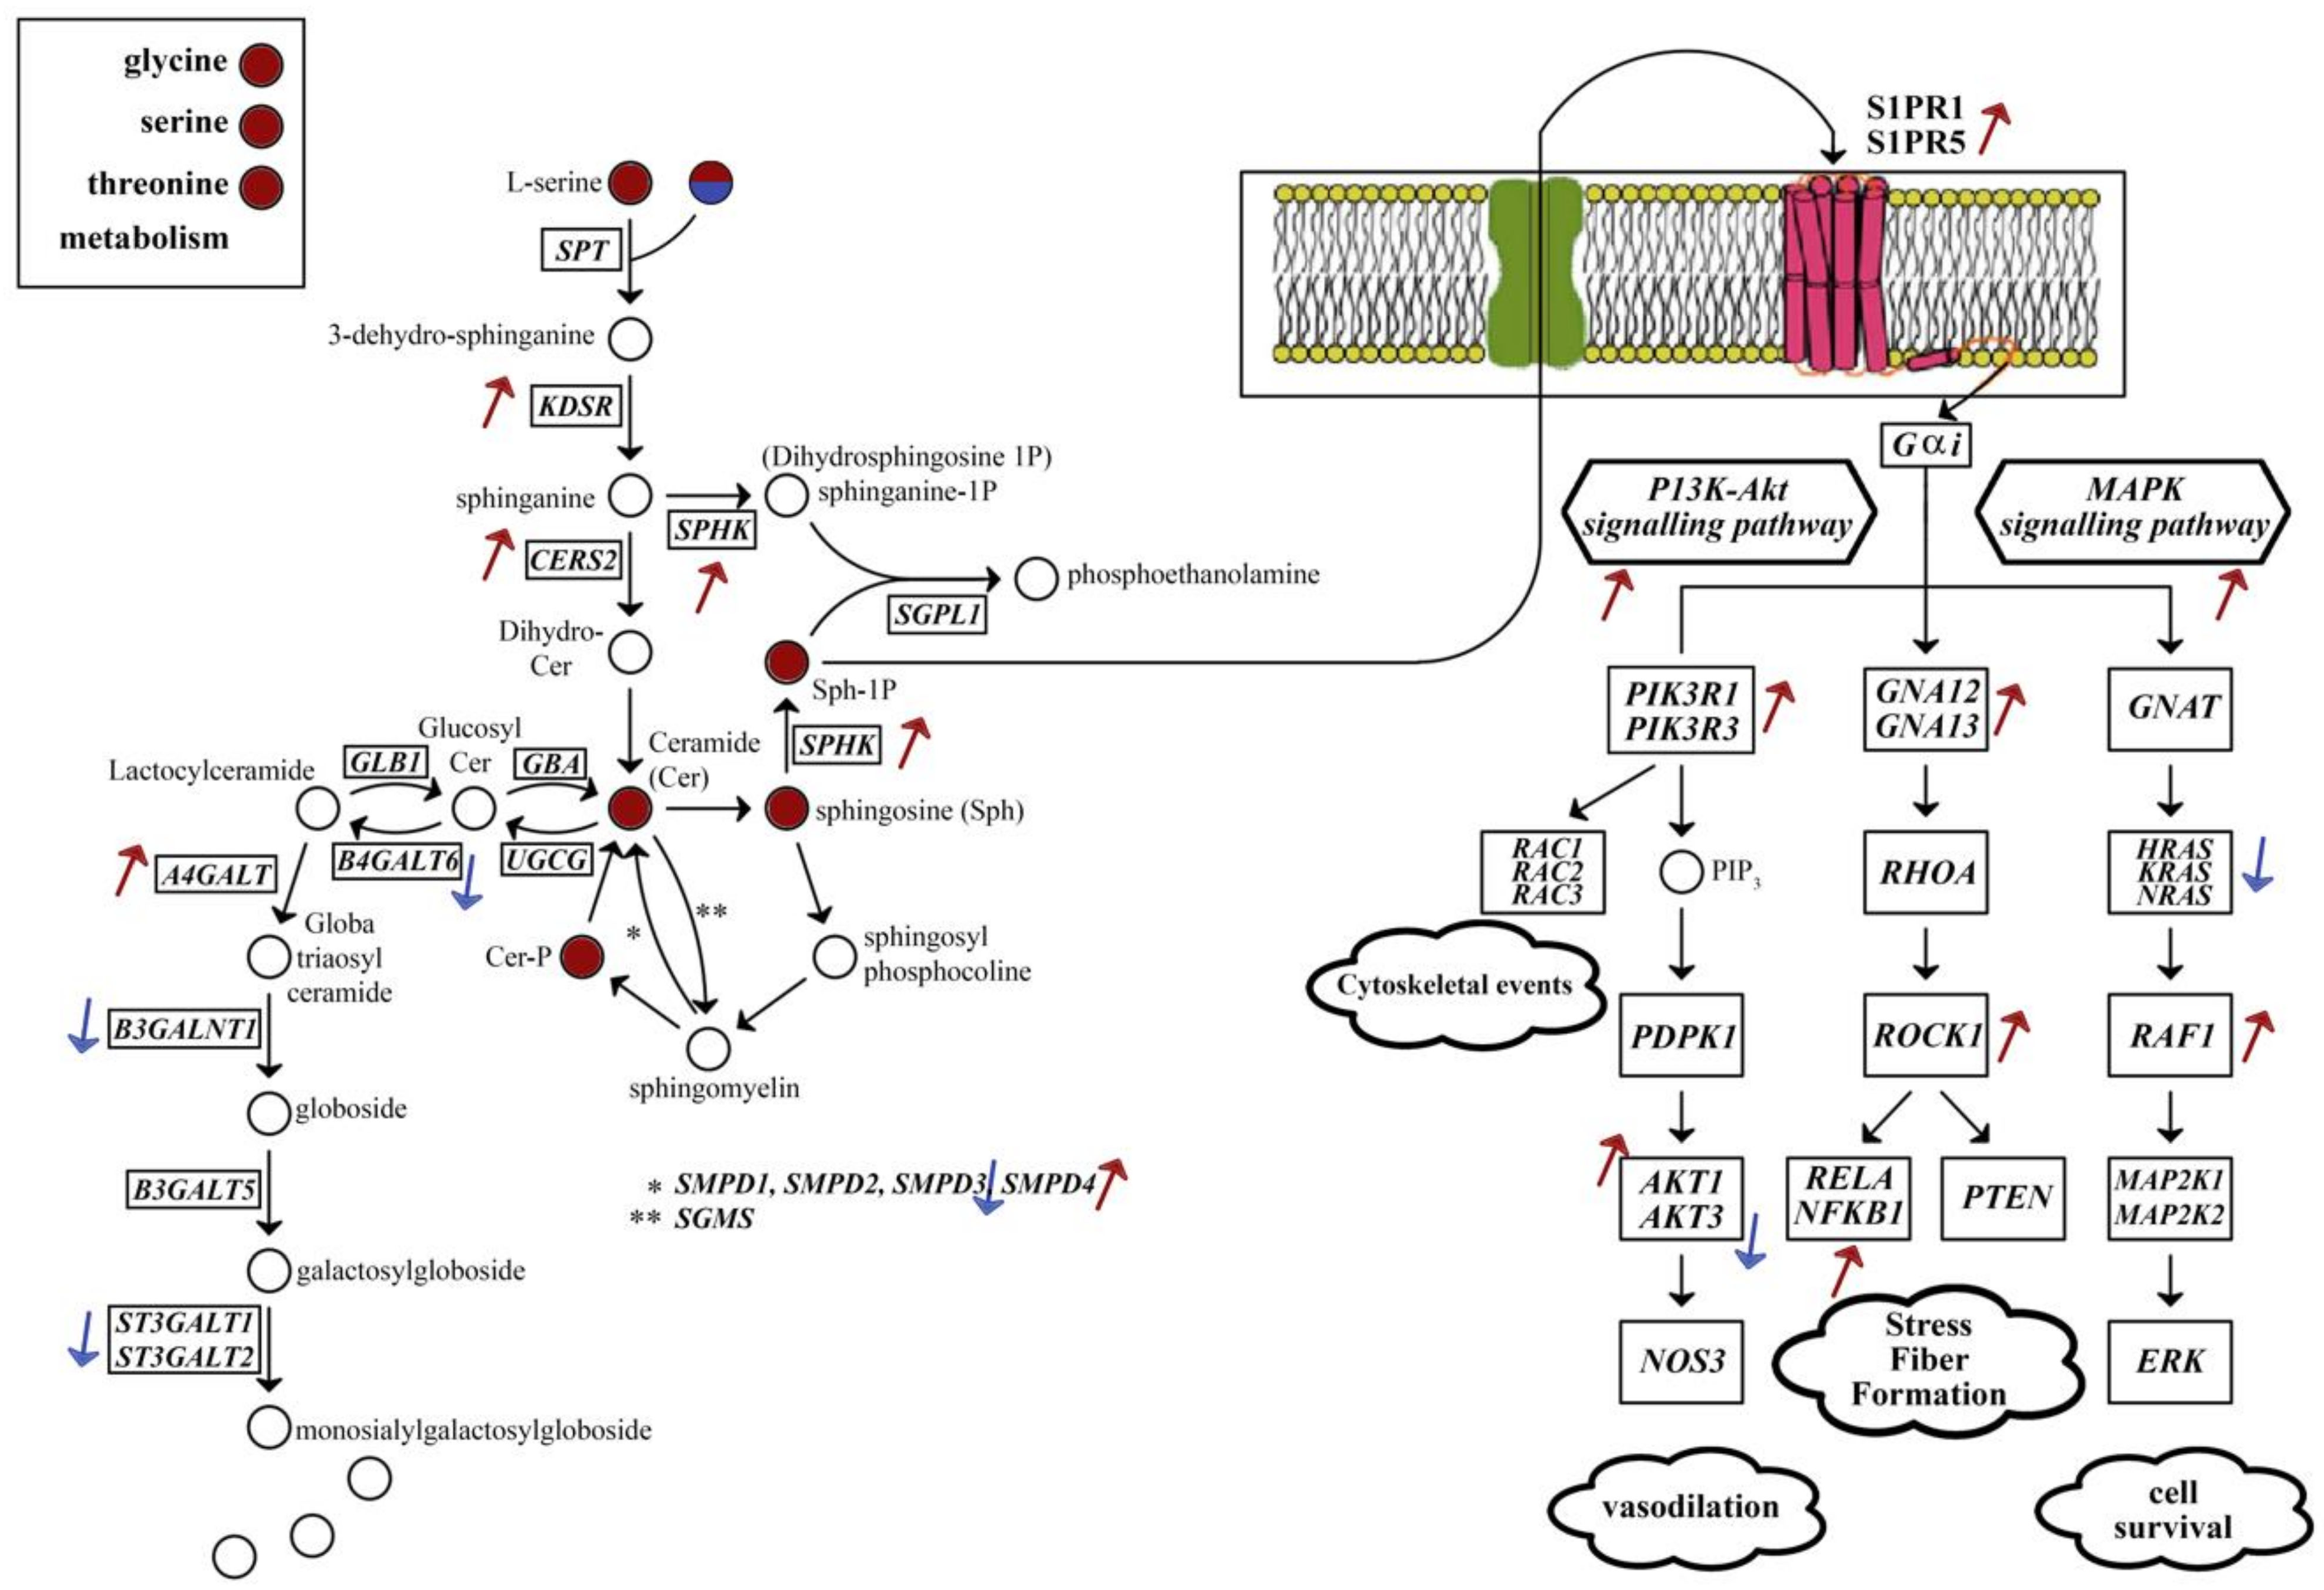
2.4. Metabolic Alterations in Different Brain Regions of AD
3. Discussion
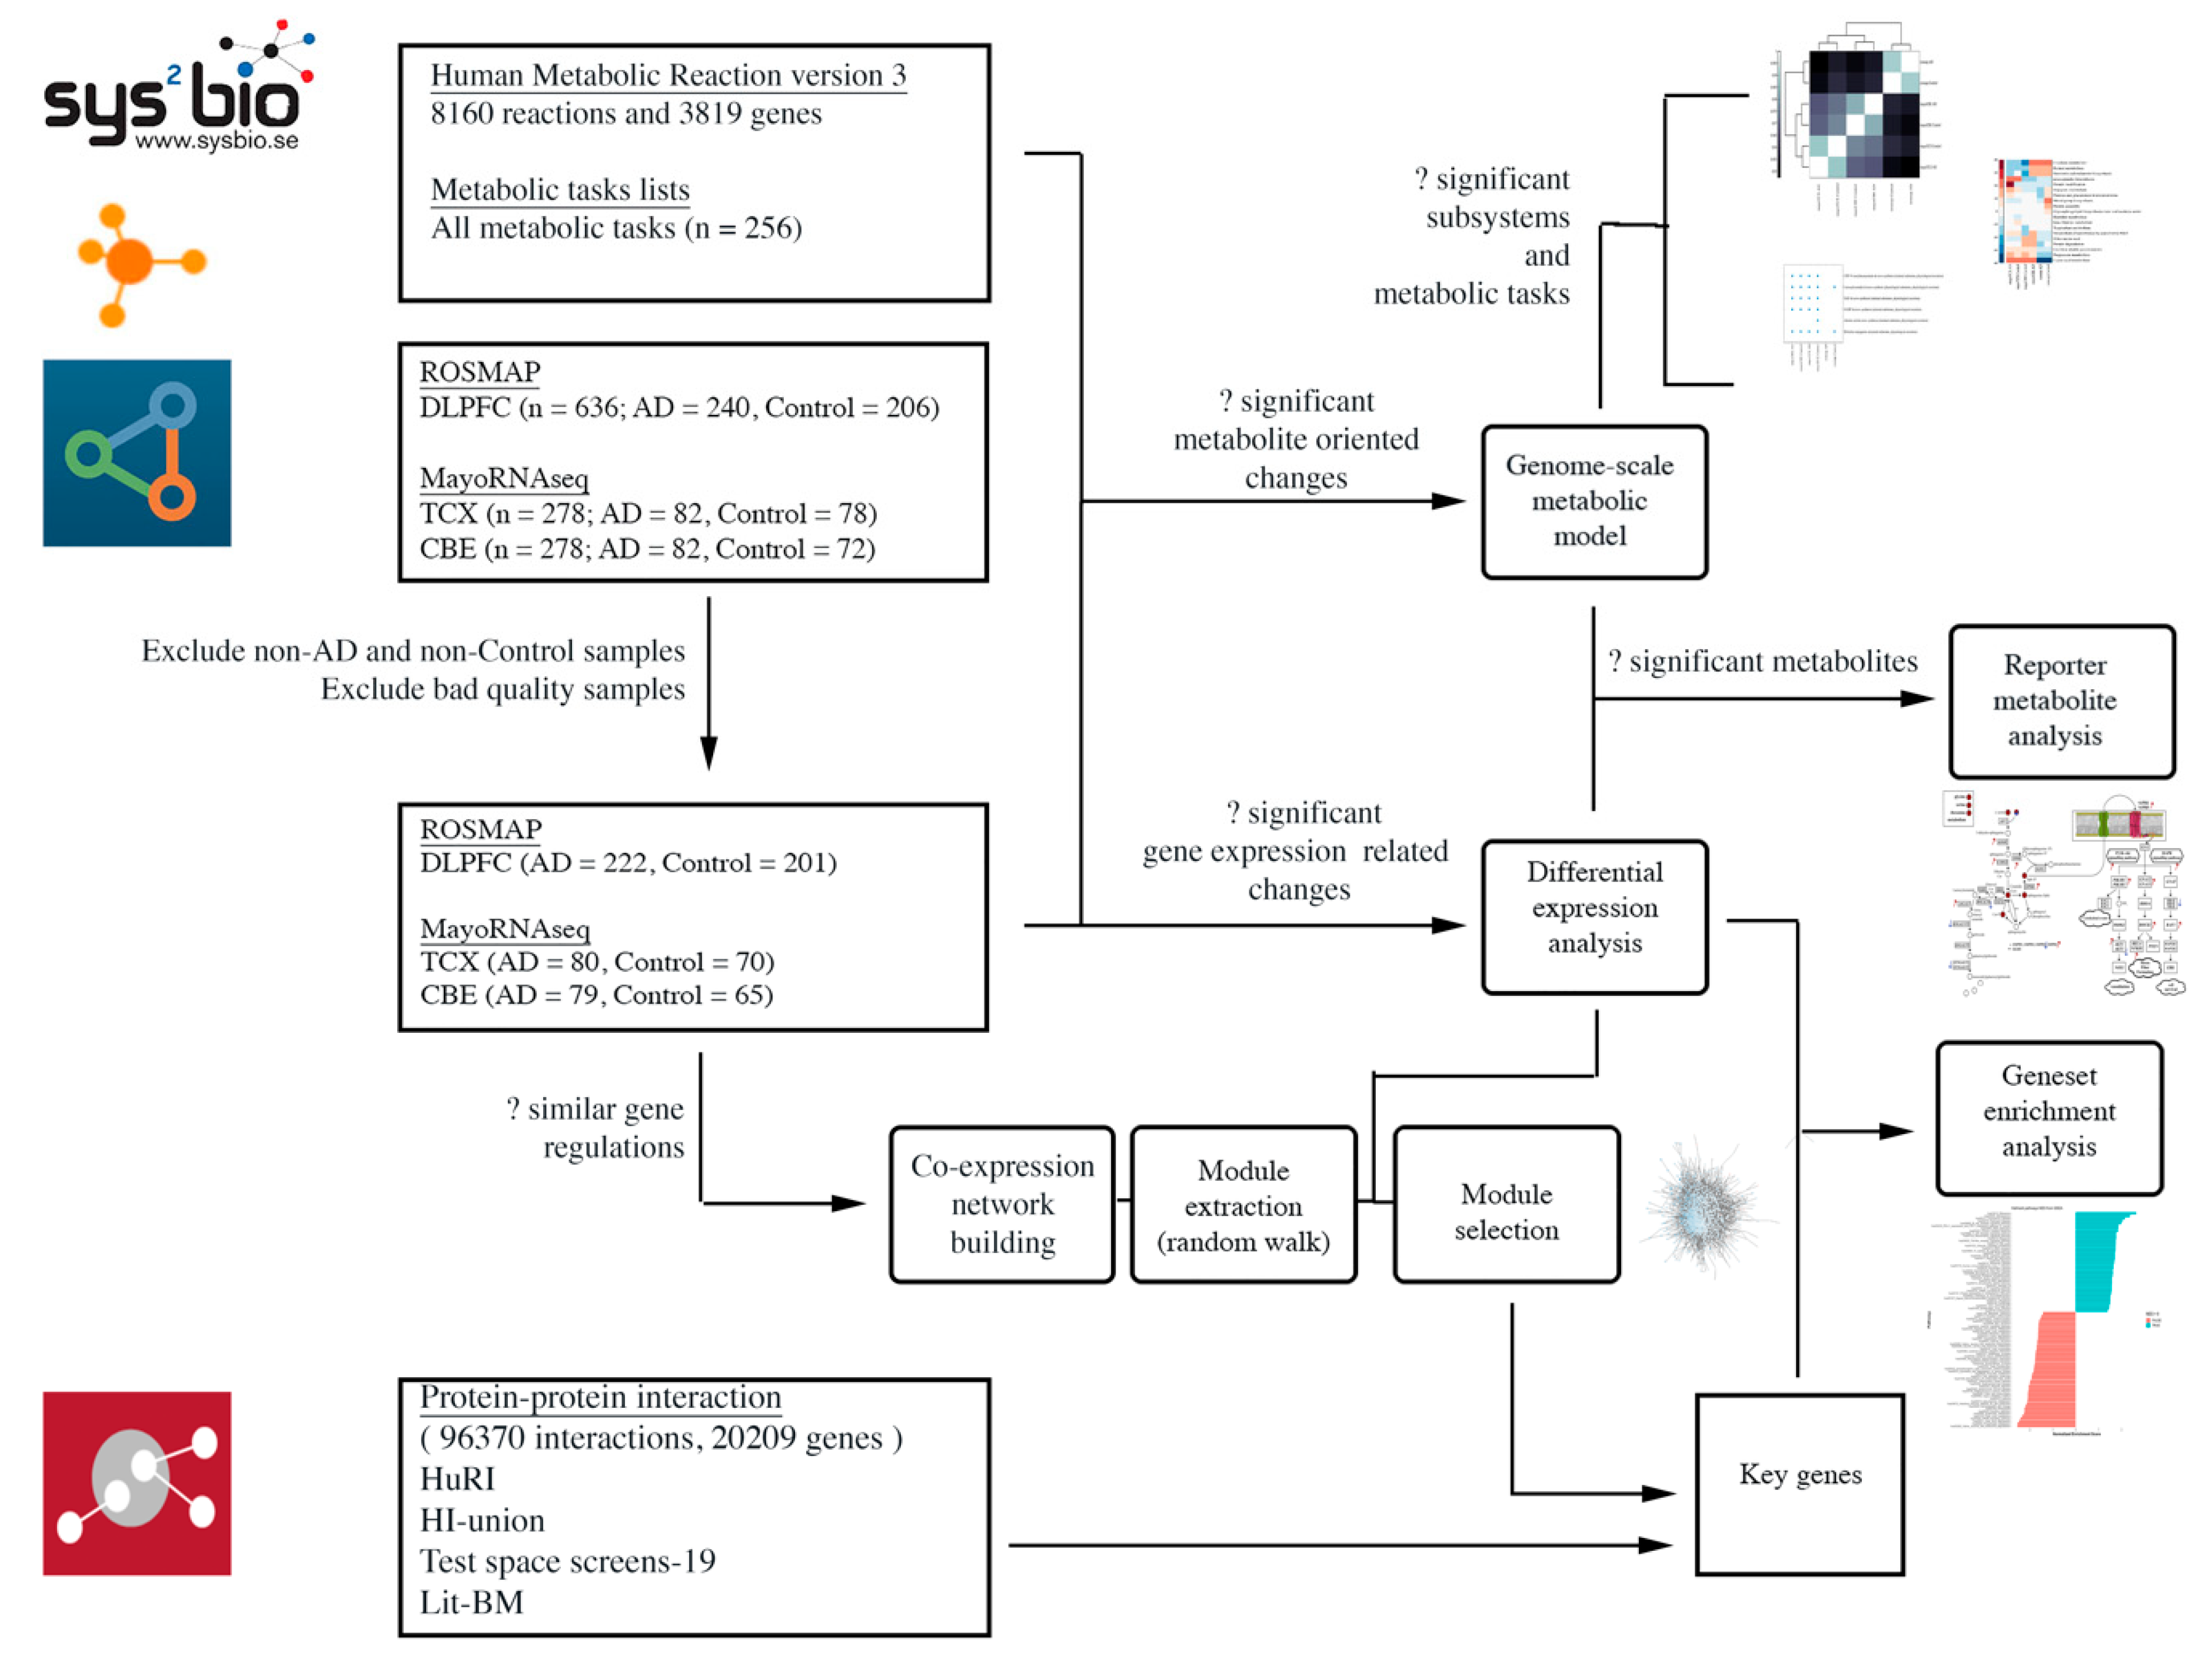
4. Materials and Methods
4.1. Data Sources and Sample Selection
4.2. Differential Expression Analysis and Gene Set Enrichment Analysis
4.3. Co-Expression Network Analysis
4.4. Genome-Scale Metabolic Modelling and Reporter Metabolite Analysis
Supplementary Materials
Author Contributions
Funding
Data Availability Statement
Conflicts of Interest
References
- Alzheimer’s Association. 2021 Alzheimer’s disease facts and figures. Alzheimer’s Dement. 2021, 17, 327–406. [Google Scholar] [CrossRef]
- Kametani, F.; Hasegawa, M. Reconsideration of Amyloid Hypothesis and Tau Hypothesis in Alzheimer’s Disease. Front. Neurosci. 2018, 12, 25. [Google Scholar] [CrossRef] [Green Version]
- Tanzi, R.E. The genetics of Alzheimer disease. Cold Spring Harb. Perspect. Med. 2012, 2, a006296. [Google Scholar] [CrossRef]
- Evans, D.A.; Bennett, D.A.; Wilson, R.S.; Bienias, J.L.; Morris, M.C.; Scherr, P.A.; Hebert, L.E.; Aggarwal, N.; Beckett, L.A.; Joglekar, R.; et al. Incidence of Alzheimer disease in a biracial urban community: Relation to apolipoprotein E allele status. Arch. Neurol. 2003, 60, 185–189. [Google Scholar] [CrossRef] [PubMed] [Green Version]
- Barker, W.; Harwood, D.; Duara, R.; Mullan, M.; Fallin, D.; Hyslop, P.S.; Rogaeva, E.; Song, Y. The APOE-epsilon4 allele and Alzheimer disease among African Americans, Hispanics, and whites. JAMA 1998, 280, 1661–1662. [Google Scholar] [CrossRef] [PubMed]
- Long, J.M.; Holtzman, D.M. Alzheimer Disease: An Update on Pathobiology and Treatment Strategies. Cell 2019, 179, 312–339. [Google Scholar] [CrossRef] [PubMed]
- Livingston, G.; Huntley, J.; Sommerlad, A.; Ames, D.; Ballard, C.; Banerjee, S.; Brayne, C.; Burns, A.; Cohen-Mansfield, J.; Cooper, C.; et al. Dementia prevention, intervention, and care: 2020 report of the Lancet Commission. Lancet 2020, 396, 413–446. [Google Scholar] [CrossRef]
- Mardinoglu, A.; Boren, J.; Smith, U.; Uhlen, M.; Nielsen, J. Systems biology in hepatology: Approaches and applications. Nat. Rev. Gastroenterol. Hepatol. 2018, 15, 365–377. [Google Scholar] [CrossRef]
- Altay, O.; Nielsen, J.; Uhlen, M.; Boren, J.; Mardinoglu, A. Systems biology perspective for studying the gut microbiota in human physiology and liver diseases. EBioMedicine 2019, 49, 364–373. [Google Scholar] [CrossRef] [PubMed] [Green Version]
- Agren, R.; Bordel, S.; Mardinoglu, A.; Pornputtapong, N.; Nookaew, I.; Nielsen, J. Reconstruction of genome-scale active metabolic networks for 69 human cell types and 16 cancer types using INIT. PLoS Comput. Biol. 2012, 8, e1002518. [Google Scholar] [CrossRef]
- Arif, M.; Zhang, C.; Li, X.; Güngör, C.; Çakmak, B.; Arslantürk, M.; Tebani, A.; Özcan, B.; Subaş, O.; Zhou, W.; et al. iNetModels 2.0: An interactive visualization and database of multi-omics data. Nucleic Acids Res. 2021, 49, W271–W276. [Google Scholar] [CrossRef] [PubMed]
- Bidkhori, G.; Benfeitas, R.; Elmas, E.; Kararoudi, M.N.; Arif, M.; Uhlen, M.; Nielsen, J.; Mardinoglu, A. Metabolic Network-Based Identification and Prioritization of Anticancer Targets Based on Expression Data in Hepatocellular Carcinoma. Front. Physiol. 2018, 9, 916. [Google Scholar] [CrossRef]
- Bhagwat, A.S.; Vakoc, C.R. Targeting Transcription Factors in Cancer. Trends Cancer 2015, 1, 53–65. [Google Scholar] [CrossRef] [Green Version]
- Mardinoglu, A.; Agren, R.; Kampf, C.; Asplund, A.; Uhlen, M.; Nielsen, J. Genome-scale metabolic modelling of hepatocytes reveals serine deficiency in patients with non-alcoholic fatty liver disease. Nat. Commun. 2014, 5, 3083. [Google Scholar] [CrossRef] [PubMed] [Green Version]
- Altay, O.; Zhang, C.; Turkez, H.; Nielsen, J.; Uhlén, M.; Mardinoglu, A. Revealing the Metabolic Alterations during Biofilm Development of Burkholderia cenocepacia Based on Genome-Scale Metabolic Modeling. Metabolites 2021, 11, 221. [Google Scholar] [CrossRef] [PubMed]
- Levine, A.J.; Miller, J.A.; Shapshak, P.; Gelman, B.; Singer, E.J.; Hinkin, C.H.; Commins, D.; Morgello, S.; Grant, I.; Horvath, S. Systems analysis of human brain gene expression: Mechanisms for HIV-associated neurocognitive impairment and common pathways with Alzheimer’s disease. BMC Med. Genom. 2013, 6, 4. [Google Scholar] [CrossRef]
- Borjabad, A.; Volsky, D.J. Common transcriptional signatures in brain tissue from patients with HIV-associated neurocognitive disorders, Alzheimer’s disease, and Multiple Sclerosis. J. Neuroimmune Pharmacol. 2012, 7, 914–926. [Google Scholar] [CrossRef] [Green Version]
- Mastroeni, D.; Nolz, J.; Sekar, S.; Delvaux, E.; Serrano, G.; Cuyugan, L.; Liang, W.S.; Beach, T.G.; Rogers, J.; Coleman, P.D. Laser-captured microglia in the Alzheimer’s and Parkinson’s brain reveal unique regional expression profiles and suggest a potential role for hepatitis B in the Alzheimer’s brain. Neurobiol. Aging 2018, 63, 12–21. [Google Scholar] [CrossRef]
- Cardoso, S.M.; Oliveira, C.R. Inhibition of NF-kB renders cells more vulnerable to apoptosis induced by amyloid beta peptides. Free Radic. Res. 2003, 37, 967–973. [Google Scholar] [CrossRef]
- Zhao, Y.; Bhattacharjee, S.; Jones, B.M.; Hill, J.; Dua, P.; Lukiw, W.J. Regulation of neurotropic signaling by the inducible, NF-kB-sensitive miRNA-125b in Alzheimer’s disease (AD) and in primary human neuronal-glial (HNG) cells. Mol. Neurobiol. 2014, 50, 97–106. [Google Scholar] [CrossRef] [Green Version]
- Religa, P.; Cao, R.; Religa, D.; Xue, Y.; Bogdanovic, N.; Westaway, D.; Marti, H.H.; Winblad, B.; Cao, Y. VEGF significantly restores impaired memory behavior in Alzheimer’s mice by improvement of vascular survival. Sci. Rep. 2013, 3, 2053. [Google Scholar] [CrossRef] [PubMed] [Green Version]
- Gambuzza, M.E.; Sofo, V.; Salmeri, F.M.; Soraci, L.; Marino, S.; Bramanti, P. Toll-like receptors in Alzheimer’s disease: A therapeutic perspective. CNS Neurol. Disord. Drug Targets 2014, 13, 1542–1558. [Google Scholar] [CrossRef] [PubMed]
- Kou, J.; Kovacs, G.G.; Höftberger, R.; Kulik, W.; Brodde, A.; Forss-Petter, S.; Hönigschnabl, S.; Gleiss, A.; Brügger, B.; Wanders, R.; et al. Peroxisomal alterations in Alzheimer’s disease. Acta Neuropathol. 2011, 122, 271–283. [Google Scholar] [CrossRef] [Green Version]
- Jiang, Q.; Heneka, M.; Landreth, G.E. The role of peroxisome proliferator-activated receptor-gamma (PPARgamma) in Alzheimer’s disease: Therapeutic implications. CNS Drugs 2008, 22, 1–14. [Google Scholar] [CrossRef] [PubMed]
- Gawel, K.; Labuz, K.; Jenda, M.; Silberring, J.; Kotlinska, J.H. Influence of cholinesterase inhibitors, donepezil and rivastigmine on the acquisition, expression, and reinstatement of morphine-induced conditioned place preference in rats. Behav. Brain Res. 2014, 268, 169–176. [Google Scholar] [CrossRef] [PubMed]
- Klionsky, D.J.; Abdelmohsen, K.; Abe, A.; Abedin, M.J.; Abeliovich, H.; Arozena, A.A.; Adachi, H.; Adams, C.M.; Adams, P.D.; Adeli, K.; et al. Guidelines for the use and interpretation of assays for monitoring autophagy (3rd edition). Autophagy 2016, 12, 1–222. [Google Scholar] [CrossRef] [PubMed] [Green Version]
- Feigin, V.L.; Nichols, E.; Alam, T.; Bannick, M.S.; Beghi, E.; Blake, N.; Culpepper, W.J.; Dorsey, E.R.; Elbaz, A.; Ellenbogen, R.G.; et al. Global, regional, and national burden of neurological disorders, 1990–2016: A systematic analysis for the Global Burden of Disease Study 2016. Lancet Neurol. 2019, 18, 459–480. [Google Scholar] [CrossRef] [Green Version]
- Manavalan, A.; Mishra, M.; Sze, S.K.; Heese, K. Brain-site-specific proteome changes induced by neuronal P60TRP expression. Neurosignals 2013, 21, 129–149. [Google Scholar] [CrossRef]
- Dagley, L.F.; Croft, N.P.; Isserlin, R.; Olsen, J.B.; Fong, V.; Emili, A.; Purcell, A.W. Discovery of novel disease-specific and membrane-associated candidate markers in a mouse model of multiple sclerosis. Mol. Cell. Proteom. 2014, 13, 679–700. [Google Scholar] [CrossRef] [Green Version]
- Lee, K.W.; Bogenhagen, D.F. Assignment of 2’-O-methyltransferases to modification sites on the mammalian mitochondrial large subunit 16 S ribosomal RNA (rRNA). J. Biol. Chem. 2014, 289, 24936–24942. [Google Scholar] [CrossRef] [Green Version]
- Lu, J.P.; Wang, Y.; Sliter, D.A.; Pearce, M.M.P.; Wojcikiewicz, R.J.H. RNF170 Protein, an Endoplasmic Reticulum Membrane Ubiquitin Ligase, Mediates Inositol 1,4,5-Trisphosphate Receptor Ubiquitination and Degradation *. J. Biol. Chem. 2011, 286, 24426–24433. [Google Scholar] [CrossRef] [Green Version]
- Striessnig, J.; Pinggera, A.; Kaur, G.; Bock, G.; Tuluc, P. L-type Ca2+ channels in heart and brain. Wiley Interdiscip. Rev. Membr. Transp. Signal. 2014, 3, 15–38. [Google Scholar] [CrossRef]
- Wren, L.M.; Jiménez-Jáimez, J.; Al-Ghamdi, S.; Al-Aama, J.Y.; Bdeir, A.; Al-Hassnan, Z.N.; Kuan, J.L.; Foo, R.Y.; Potet, F.; Johnson, C.N.; et al. Genetic Mosaicism in Calmodulinopathy. Circ. Genom. Precis. Med. 2019, 12, 375–385. [Google Scholar] [CrossRef] [PubMed] [Green Version]
- Sosanya, N.M.; Cacheaux, L.P.; Workman, E.R.; Niere, F.; Perrone-Bizzozero, N.I.; Raab-Graham, K.F. Mammalian Target of Rapamycin (mTOR) Tagging Promotes Dendritic Branch Variability through the Capture of Ca2+/Calmodulin-dependent Protein Kinase II α (CaMKIIα) mRNAs by the RNA-binding Protein HuD. J. Biol. Chem. 2015, 290, 16357–16371. [Google Scholar] [CrossRef] [Green Version]
- Paoletti, P.; Bellone, C.; Zhou, Q. NMDA receptor subunit diversity: Impact on receptor properties, synaptic plasticity and disease. Nat. Rev. Neurosci. 2013, 14, 383–400. [Google Scholar] [CrossRef] [PubMed]
- Pamplona, R.; Borras, C.; Jové, M.; Pradas, I.; Ferrer, I.; Viña, J. Redox lipidomics to better understand brain aging and function. Free Radic. Biol. Med. 2019, 144, 310–321. [Google Scholar] [CrossRef] [PubMed]
- Mattson, M.P.; Moehl, K.; Ghena, N.; Schmaedick, M.; Cheng, A. Intermittent metabolic switching, neuroplasticity and brain health. Nat. Rev. Neurosci. 2018, 19, 81–94. [Google Scholar] [CrossRef]
- Papuć, E.; Rejdak, K. The role of myelin damage in Alzheimer’s disease pathology. Arch. Med. Sci. 2018, 16, 345–351. [Google Scholar] [CrossRef] [PubMed]
- Alessenko, A.V.; Albi, E. Exploring Sphingolipid Implications in Neurodegeneration. Front. Neurol. 2020, 11, 437. [Google Scholar] [CrossRef]
- Jazvinšćak Jembrek, M.; Hof, P.R.; Šimić, G. Ceramides in Alzheimer’s Disease: Key Mediators of Neuronal Apoptosis Induced by Oxidative Stress and Aβ Accumulation. Oxidative Med. Cell. Longev. 2015, 2015, 346783. [Google Scholar] [CrossRef] [PubMed] [Green Version]
- Hassan-Smith, G. A Study of Classical and Novel Markers of Disease in Multiple Sclerosis. Ph.D. Thesis, University of Birmingham, Birmingham, UK, 2015. [Google Scholar]
- Giorgi, C.; Baldassari, F.; Bononi, A.; Bonora, M.; De Marchi, E.; Marchi, S.; Missiroli, S.; Patergnani, S.; Rimessi, A.; Suski, J.M.; et al. Mitochondrial Ca2+ and apoptosis. Cell Calcium 2012, 52, 36–43. [Google Scholar] [CrossRef] [Green Version]
- Jarosz-Griffiths, H.H.; Noble, E.; Rushworth, J.V.; Hooper, N.M. Amyloid-β Receptors: The Good, the Bad, and the Prion Protein. J. Biol. Chem. 2016, 291, 3174–3183. [Google Scholar] [CrossRef] [Green Version]
- Aunan, J.R.; Cho, W.C.; Søreide, K. The Biology of Aging and Cancer: A Brief Overview of Shared and Divergent Molecular Hallmarks. Aging Dis. 2017, 8, 628–642. [Google Scholar] [CrossRef] [Green Version]
- Irizar, P.A.; Schäuble, S.; Esser, D.; Groth, M.; Frahm, C.; Priebe, S.; Baumgart, M.; Hartmann, N.; Marthandan, S.; Menzel, U.; et al. Transcriptomic alterations during ageing reflect the shift from cancer to degenerative diseases in the elderly. Nat. Commun. 2018, 9, 327. [Google Scholar] [CrossRef] [PubMed] [Green Version]
- Frain, L.; Swanson, D.; Cho, K.; Gagnon, D.; Lu, K.P.; Betensky, R.A.; Driver, J. Association of cancer and Alzheimer’s disease risk in a national cohort of veterans. Alzheimer’s Dement. 2017, 13, 1364–1370. [Google Scholar] [CrossRef]
- Driver, J.A.; Beiser, A.; Au, R.; Kreger, B.E.; Splansky, G.L.; Kurth, T.; Kiel, D.P.; Lu, K.P.; Seshadri, S.; Wolf, P.A. Inverse association between cancer and Alzheimer’s disease: Results from the Framingham Heart Study. BMJ 2012, 344, e1442. [Google Scholar] [CrossRef] [Green Version]
- Chen, J.; Fujii, K.; Zhang, L.; Roberts, T.; Fu, H. Raf-1 promotes cell survival by antagonizing apoptosis signal-regulating kinase 1 through a MEK–ERK independent mechanism. Proc. Natl. Acad. Sci. USA 2001, 98, 7783. [Google Scholar] [CrossRef] [PubMed] [Green Version]
- Kim, M.S.; Jin, W. TrkB-Induced Inhibition of R-SMAD/SMAD4 Activation is Essential for TGF-β-Mediated Tumor Suppressor Activity. Cancers 2020, 12, 1048. [Google Scholar] [CrossRef] [PubMed]
- Krieglstein, K.; Zheng, F.; Unsicker, K.; Alzheimer, C. More than being protective: Functional roles for TGF-β/activin signaling pathways at central synapses. Trends Neurosci. 2011, 34, 421–429. [Google Scholar] [CrossRef]
- Wu, Z.; Owens, C.; Chandra, N.; Popovic, K.; Conaway, M.; Theodorescu, D. RalBP1 is necessary for metastasis of human cancer cell lines. Neoplasia 2010, 12, 1003–1012. [Google Scholar] [CrossRef] [Green Version]
- Awasthi, S.; Hindle, A.; Sawant, N.A.; George, M.; Vijayan, M.; Kshirsagar, S.; Morton, H.; Bunquin, L.E.; Palade, P.T.; Lawrence, J.J.; et al. Role of RALBP1 in Oxidative Stress and Mitochondrial Dysfunction in Alzheimer’s Disease. bioRxiv 2021. [Google Scholar] [CrossRef]
- Kanai, T.; Jenks, J.; Nadeau, K.C. The STAT5b Pathway Defect and Autoimmunity. Front. Immunol. 2012, 3, 234. [Google Scholar] [CrossRef] [Green Version]
- Yaku, K.; Okabe, K.; Hikosaka, K.; Nakagawa, T. NAD Metabolism in Cancer Therapeutics. Front. Oncol. 2018, 8. [Google Scholar] [CrossRef]
- Joshi, Y.B.; Di Meco, A.; Praticó, D. Modulation of amyloid-β production by leukotriene B4 via the γ-secretase pathway. J. Alzheimer’s Dis. 2014, 38, 503–506. [Google Scholar] [CrossRef]
- Brouwers, H.; Jónasdóttir, H.S.; Kuipers, M.E.; Kwekkeboom, J.C.; Auger, J.L.; Gonzalez-Torres, M.; López-Vicario, C.; Clària, J.; Freysdottir, J.; Hardardottir, I.; et al. Anti-Inflammatory and Proresolving Effects of the Omega-6 Polyunsaturated Fatty Acid Adrenic Acid. J. Immunol. 2020, 205, 2840–2849. [Google Scholar] [CrossRef]
- Zakharov, S.; Kotikova, K.; Nurieva, O.; Hlusicka, J.; Kacer, P.; Urban, P.; Vaneckova, M.; Seidl, Z.; Diblik, P.; Kuthan, P.; et al. Leukotriene-mediated neuroinflammation, toxic brain damage, and neurodegeneration in acute methanol poisoning. Clin. Toxicol. 2017, 55, 249–259. [Google Scholar] [CrossRef] [PubMed] [Green Version]
- Li, P.; Oh, D.Y.; Bandyopadhyay, G.; Lagakos, W.S.; Talukdar, S.; Osborn, O.; Johnson, A.; Chung, H.; Maris, M.; Ofrecio, J.M.; et al. LTB4 promotes insulin resistance in obese mice by acting on macrophages, hepatocytes and myocytes. Nat. Med. 2015, 21, 239–247. [Google Scholar] [CrossRef] [Green Version]
- Sodhi, R.K.; Singh, N. Retinoids as potential targets for Alzheimer’s disease. Pharmacol. Biochem. Behav. 2014, 120, 117–123. [Google Scholar] [CrossRef]
- Stempler, S.; Yizhak, K.; Ruppin, E. Integrating Transcriptomics with Metabolic Modeling Predicts Biomarkers and Drug Targets for Alzheimer’s Disease. PLoS ONE 2014, 9, e105383. [Google Scholar] [CrossRef] [Green Version]
- Fenech, M. Vitamins Associated with Brain Aging, Mild Cognitive Impairment, and Alzheimer Disease: Biomarkers, Epidemiological and Experimental Evidence, Plausible Mechanisms, and Knowledge Gaps. Adv. Nutr. 2017, 8, 958–970. [Google Scholar] [CrossRef] [PubMed] [Green Version]
- Moretti, R.; Peinkhofer, C. B Vitamins and Fatty Acids: What Do They Share with Small Vessel Disease-Related Dementia? Int. J. Mol. Sci. 2019, 20, 5797. [Google Scholar] [CrossRef] [PubMed] [Green Version]
- Eyles, D.W.; Burne, T.H.; McGrath, J.J. Vitamin D, effects on brain development, adult brain function and the links between low levels of vitamin D and neuropsychiatric disease. Front. Neuroendocr. 2013, 34, 47–64. [Google Scholar] [CrossRef]
- Killingsworth, J.; Sawmiller, D.; Shytle, R.D. Propionate and Alzheimer’s Disease. Front. Aging Neurosci. 2021, 12. [Google Scholar] [CrossRef]
- Barber, S.C.; Shaw, P.J. Oxidative stress in ALS: Key role in motor neuron injury and therapeutic target. Free Radic. Biol. Med. 2010, 48, 629–641. [Google Scholar] [CrossRef]
- Baloni, P.; Funk, C.C.; Yan, J.; Yurkovich, J.T.; Kueider-Paisley, A.; Nho, K.; Heinken, A.; Jia, W.; Mahmoudiandehkordi, S.; Louie, G.; et al. Identifying differences in bile acid pathways for cholesterol clearance in Alzheimer’s disease using metabolic networks of human brain regions. bioRxiv 2019, 782987. [Google Scholar] [CrossRef]
- Currais, A.; Huang, L.; Goldberg, J.; Petrascheck, M.; Ates, G.; Pinto-Duarte, A.; Shokhirev, M.N.; Schubert, D.; Maher, P. Elevating acetyl-CoA levels reduces aspects of brain aging. Elife 2019, 8, e47866. [Google Scholar] [CrossRef]
- Lam, S.; Hartmann, N.; Benfeitas, R.; Zhang, C.; Arif, M.; Turkez, H.; Uhlén, M.; Englert, C.; Knight, R.; Mardinoglu, A. Systems Analysis Reveals Ageing-Related Perturbations in Retinoids and Sex Hormones in Alzheimer’s and Parkinson’s Diseases. Biomedicines 2021, 9, 1310. [Google Scholar] [CrossRef] [PubMed]
- Yulug, B.; Altay, O.; Li, X.; Hanoglu, L.; Cankaya, S.; Lam, S.; Yang, H.; Coskun, E.; İdil, E.; Nogaylar, R.; et al. Combined Metabolic Activators Improves Cognitive Functions in Alzheimer’s Disease. medRxiv 2021. [Google Scholar] [CrossRef]
- Costa-Silva, J.; Domingues, D.; Lopes, F.M. RNA-Seq differential expression analysis: An extended review and a software tool. PLoS ONE 2017, 12, e0190152. [Google Scholar] [CrossRef] [Green Version]
- McInnes, L.; Healy, J. UMAP: Uniform Manifold Approximation and Projection for Dimension Reduction. arXiv 2018, arXiv:1802.03426. [Google Scholar]
- Love, M.I.; Huber, W.; Anders, S. Moderated estimation of fold change and dispersion for RNA-seq data with DESeq2. Genome Biol. 2014, 15, 550. [Google Scholar] [CrossRef] [PubMed] [Green Version]
- Stathias, V.; Pastori, C.; Griffin, T.Z.; Komotar, R.; Clarke, J.; Zhang, M.; Ayad, N.G. Identifying Glioblastoma Gene Networks Based on Hypergeometric Test Analysis. PLoS ONE 2015, 9, e115842. [Google Scholar] [CrossRef] [Green Version]
- Mi, H.; Muruganujan, A.; Ebert, D.; Huang, X.; Thomas, P.D. PANTHER version 14: More genomes, a new PANTHER GO-slim and improvements in enrichment analysis tools. Nucleic Acids Res. 2019, 47, D419–D426. [Google Scholar] [CrossRef]
- Kanehisa, M.; Goto, S. KEGG: Kyoto Encyclopedia of Genes and Genomes. Nucleic Acids Res. 2000, 28, 27–30. [Google Scholar] [CrossRef] [PubMed]
- Wu, C.H.; Apweiler, R.; Bairoch, A.; Natale, D.A.; Barker, W.C.; Boeckmann, B.; Ferro, S.; Gasteiger, E.; Huang, H.; Lopez, R.; et al. The Universal Protein Resource (UniProt): An expanding universe of protein information. Nucleic Acids Res. 2006, 34, D187–D191. [Google Scholar] [CrossRef]
- Yu, G.; Wang, L.G.; Han, Y.; He, Q.Y. clusterProfiler: An R package for comparing biological themes among gene clusters. Omics 2012, 16, 284–287. [Google Scholar] [CrossRef] [PubMed]
- Korotkevich, G.; Sukhov, V.; Budin, N.; Shpak, B.; Artyomov, M.N.; Sergushichev, A. Fast gene set enrichment analysis. bioRxiv 2021, 060012. [Google Scholar] [CrossRef] [Green Version]
- Gustavsen, J.A.; Pai, S.; Isserlin, R.; Demchak, B.; Pico, A.R. RCy3: Network biology using Cytoscape from within R. F1000Research 2019, 8, 1774. [Google Scholar] [CrossRef] [PubMed]
- Luck, K.; Kim, D.-K.; Lambourne, L.; Spirohn, K.; Begg, B.E.; Bian, W.; Brignall, R.; Cafarelli, T.; Campos-Laborie, F.J.; Charloteaux, B.; et al. A reference map of the human binary protein interactome. Nature 2020, 580, 402–408. [Google Scholar] [CrossRef] [PubMed]
- Uhlén, M.; Fagerberg, L.; Hallström, B.M.; Lindskog, C.; Oksvold, P.; Mardinoglu, A.; Sivertsson, Å.; Kampf, C.; Sjöstedt, E.; Asplund, A.; et al. Proteomics. Tissue-based map of the human proteome. Science 2015, 347, 1260419. [Google Scholar] [CrossRef] [PubMed]
- Wang, H.; Marcišauskas, S.; Sánchez, B.J.; Domenzain, I.; Hermansson, D.; Agren, R.; Nielsen, J.; Kerkhoven, E.J. RAVEN 2.0: A versatile toolbox for metabolic network reconstruction and a case study on Streptomyces coelicolor. PLoS Comput. Biol. 2018, 14, e1006541. [Google Scholar] [CrossRef] [PubMed] [Green Version]
- Patil, K.R.; Nielsen, J. Uncovering transcriptional regulation of metabolism by using metabolic network topology. Proc. Natl. Acad. Sci. USA 2005, 102, 2685. [Google Scholar] [CrossRef] [PubMed] [Green Version]


| VS | p-Val (Hyper) | Overlap | Region_1 DEG Size | Region_2 DEG Size | Both CodingGene Size |
|---|---|---|---|---|---|
| RO-MT | 0.00054 | 128 | 2885 | 477 | 14,001 |
| MC-RO | 0.00516 | 347 | 2885 | 1515 | 14,186 |
| MT-MC | 9.20599 × 10⁻¹¹ | 98 | 477 | 1515 | 14,186 |
| Gene Symbol | Associated Protein Name (UNIPROT) | Most Associated KEGG Pathways |
|---|---|---|
| ADAMTS2 ¥ | A disintegrin and metalloproteinase with thrombospondin motifs 2 | - |
| ATP1B3 # | Sodium/potassium-transporting ATPase subunit beta-3 | Secretion (insulin, salivary, bile, gastric acid, pancreatic, aldosterone) has04961_Endocrine_and_other_factor-regulated_calcium_reabsorption has04973_Carbohydrate_digestion_and_absorption has04260_Cardiac_muscle_contraction has04978_Mineral_absorption |
| BTG # | B-cell translocation gene 1 protein | has03018_RNA_degradation |
| DAXX # | Death domain-associated protein 6 | has04010_MAPK_signaling_pathway, has04210_Apoptosis, has05012_Parkinson_disease, has05014_Amyotrophic_lateral_sclerosis, has05022_Pathways_of_neurodegeneration, has05168_Herpes_simplex_virus_1_infection |
| DYNC2LI1 * | Cytoplasmic dynein 2 light intermediate chain 1 | has04962_Vasopressin-regulated_water_reabsorption, has05132_Salmonella_infection |
| FAM129B # | Protein Niban 2 | - |
| FAM167B # | Protein FAM167B | - |
| FAM90A1 * | Protein FAM90A1 | - |
| FBXO2 # | F-box only protein 2 | has04068_FoxO_signaling_pathway, has04120_Ubiquitin_mediated_proteolysis, has04141_Protein_processing_in_endoplasmic_reticulum, has05132_Salmonella_infection |
| GARNL3 # | GTPase-activating Rap/Ran-GAP domain-like protein 3 | - |
| GIT1 # | ARF GTPase-activating protein GIT1 | has04144_Endocytosis, has04810_Regulation_of_actin_cytoskeleton, has05120_Epithelial_cell_signaling_in_Helicobacter_pylori_infection |
| H2AFV # | Histone H2A.V | - |
| HEBP2 # | Heme-binding protein 2 | - |
| ID3 # | DNA-binding protein inhibitor ID-3 | has04350_TGF-beta_signaling_pathway |
| NHEJ1 # | Non-homologous end-joining factor 1 | has03450_Non-homologous_end-joining |
| NT5DC2 # | 5’-nucleotidase domain-containing protein 2 | - |
| PAFAH1B3 # | Platelet-activating factor acetylhydrolase IB subunit alpha1 | has00565_Ether_lipid_metabolism |
| PLAGL1 * | Zinc finger protein PLAGL1 | - |
| RAF1 # | RAF proto-oncogene serine/threonine protein kinase | CENTRAL Signaling (JAK/STAT, TNF, VEGF, Insulin, Apelin, cAMP, mTOR etc.) Cancer (colorectal, pancreatic, breast, glioma, melanoma etc.) Infection (Hepatitis, Influenza, Tuberculosis, Salmonella etc.) has04210_Apoptosis, has04218_Cellular_senescence, has04510_Focal_adhesion, has04540_Gap_junction, has04935_Growth_hormone_synthesis, secretion_and_action has04726_Serotonergic_synapse, has04510_Focal_adhesion |
| RALBP1 # | RalBP1-associated Eps domain-containing protein 2 | has04014_Ras_signaling_pathway, has05212_Pancreatic_cancer |
| S100A4 # | Calvasculin/Metastasin | - |
| S100A6 # | Calcyclin/Growth factor-inducible protein 2A9 | - |
| SEPT9 # | Septin-9 | - |
| SMAD4 # | Mothers against decapentaplegic homolog 4 | Signalling (Fox0, Wnt, apelin etc.), Cancer (colorectal etc.) has04110_Cell_cycle, has04520_Adherens_junction |
| STARD10 # | START domain-containing protein 10 | - |
| STAT5B # | Signal transducer and activator of transcription 5B | Signalling (AGE-RAGE, JAK/STAT etc.), Myeloid leukemia has04217_Necroptosis, has04659_Th17_cell_differentiation |
| TRIM45 * | Tripartite motif-containing protein 45 | - |
| TRIM66 * | Tripartite motif-containing protein 66 | - |
| TRIP10 # | Cdc42-interacting protein 4 | has04910_Insulin_signaling_pathway |
| TTC14 * | Tetratricopeptide repeat protein 14 | - |
| UBAP1 # | Ubiquitin-associated protein 1 | - |
| UBXN8 * | UBX domain-containing protein 8 | has04141_Protein_processing_in_endoplasmic_reticulum |
| ZNF334 * | Zinc finger protein 334 | has05168_Herpes_simplex_virus_1_infection |
| ZNF639 # | Zinc finger protein 636 | - |
| Pathway | Shared DEGs in the Pathway | |||
|---|---|---|---|---|
| hsa03450_Non-homologous_end-joining | NHEJ1 | |||
| hsa04010_MAPK_signaling_pathway | DAXX | RAF1 | ||
| hsa04012_ErbB_signaling_pathway | RAF1 | STAT5B | ||
| hsa04014_Ras_signaling_pathway | RAF1 | RALBP1 | ||
| hsa04015_Rap1_signaling_pathway | RAF1 | |||
| hsa04022_cGMP-PKG_signaling_pathway | ATP1B3 | RAF1 | ||
| hsa04024_cAMP_signaling_pathway | ATP1B3 | RAF1 | ||
| hsa04062_Chemokine_signaling_pathway | RAF1 | STAT5B | ||
| hsa04068_FoxO_signaling_pathway | RAF1 | SMAD4 | ||
| hsa04071_Sphingolipid_signaling_pathway | RAF1 | |||
| hsa04072_Phospholipase_D_signaling_pathway | RAF1 | |||
| hsa04150_mTOR_signaling_pathway | RAF1 | |||
| hsa04151_PI3K-Akt_signaling_pathway | RAF1 | |||
| hsa04261_Adrenergic_signaling_in_cardiomyocytes | ATP1B3 | |||
| hsa04210_Apoptosis | DAXX | RAF1 | ||
| hsa04310_Wnt_signaling_pathway | SMAD4 | |||
| hsa04350_TGF-beta_signaling_pathway | ID3 | SMAD4 | ||
| hsa04370_VEGF_signaling_pathway | RAF1 | |||
| hsa04371_Apelin_signaling_pathway | RAF1 | SMAD4 | ||
| hsa04390_Hippo_signaling_pathway | SMAD4 | |||
| hsa04550_Signaling_pathways_regulating_pluripotency_of_stem_cells | RAF1 | ID3 | SMAD4 | |
| hsa04625_C-type_lectin_receptor_signaling_pathway | RAF1 | |||
| hsa04630_JAK-STAT_signaling_pathway | RAF1 | STAT5B | ||
| hsa04659_Th17_cell_differentiation | SMAD4 | STAT5B | ||
| hsa04660_T_cell_receptor_signaling_pathway | RAF1 | |||
| hsa04662_B_cell_receptor_signaling_pathway | RAF1 | |||
| hsa04664_Fc_epsilon_RI_signaling_pathway | RAF1 | |||
| hsa04722_Neurotrophin_signaling_pathway | RAF1 | |||
| hsa04910_Insulin_signaling_pathway | RAF1 | TRIP10 | ||
| hsa04912_GnRH_signaling_pathway | RAF1 | |||
| hsa04915_Estrogen_signaling_pathway | RAF1 | |||
| hsa04917_Prolactin_signaling_pathway | RAF1 | STAT5B | ||
| hsa04919_Thyroid_hormone_signaling_pathway | RAF1 | ATP1B3 | ||
| hsa04921_Oxytocin_signaling_pathway | RAF1 | |||
| hsa04926_Relaxin_signaling_pathway | RAF1 | |||
| hsa04933_AGE-RAGE_signaling_pathway_in_diabetic_complications | SMAD4 | STAT5B | ||
| hsa04935_Growth_hormone_synthesis,_secretion_and_action | RAF1 | STAT5B | ||
| hsa05120_Epithelial_cell_signaling_in_Helicobacter_pylori_infection | GIT1 | |||
| hsa05161_Hepatitis_B | RAF1 | SMAD4 | STAT5B | |
| hsa05200_Pathways_in_cancer | RAF1 | RALBP1 | SMAD4 | STAT5B |
| hsa05210_Colorectal_cancer | RAF1 | SMAD4 | ||
| hsa05212_Pancreatic_cancer | RAF1 | RALBP1 | SMAD4 | |
| hsa05213_Endometrial_cancer | RAF1 | |||
| hsa05215_Prostate_cancer | RAF1 | |||
| hsa05219_Bladder_cancer | RAF1 | |||
| hsa05220_Chronic_myeloid_leukemia | RAF1 | SMAD4 | STAT5B | |
| hsa05221_Acute_myeloid_leukemia | RAF1 | STAT5B | ||
| hsa05223_Non-small_cell_lung_cancer | RAF1 | STAT5B | ||
| hsa05224_Breast_cancer | RAF1 | |||
| hsa05226_Gastric_cancer | RAF1 | SMAD4 | ||
| Tissues | Hub Genes (Top 10%) |
|---|---|
| DLPFC, TCX, CBE | AMIGO1, GPRASP2 |
| DLPFC, TCX | Cytoskeleton and its organisation ACTR3B, GABARAPL1, MARK1, NDEL1 Synaptic activity/plasticity AP2M1, ARHGEF9, CALM3, DLG3, GABRB3, L1CAM, NPTN Intra Golgi and retrograde Golgi-to-ER traffic AP3M2, ARF3, CFAP36, KIFAP3, KLC1, NAPB, NSF, RAB6B Ubiquitin/Proteasome System DNAJC5, HSPA12A Glucose Metabolism/Oxidative phosphorylation ATP6V1A, ATP6V1B2, HK1, SEH1L, SLC25A14, SLC25A4, SLC9A6 Other ATL1, B4GAT1, BTRC, C1orf216, CDK14, CDK5R1CHN1, CISD1, CLSTN3, CNTNAP1, EID2, FAM234B, FAM49A, GLS, GOT1, GPI, GUCY1B3, INPP4A, JAZF1, MAGEE1, MAPK9, MLTT11, MOAP1, MYCBP2, NDFIBP1, NDRG3, NELL2, NMNAT2, OPCML, PCMT1, PFN2, PHACTR1, PNMA2, PNMAL1, PPPIR7, PPP3CB, PPP3R1, PREP, PREPL, PRKCE, RBFOX2, REEP1, REEP5, RTN3, SEPT6, SMAP2, SNAP91, SV2B, SYT13, TMEM246, TSPYL1, UBE2O, UBFD1, VDAC1, VDAC3, WDR7, YWHAG, YWHAZ |
| TCX, CBE | Cytoskeleton and its organisation PAK1 |
| DLPFC, CBE | Glucose Metabolism/Oxidative phosphorylation ATP6V1E1 Cytoskeleton and its organisation CDC42, DCTN2 Other ERLEC1, MPP1 |
| DLPFC-AD | DLPFC-Control | TCX-AD | TCX-Control | CBE-AD | CBE-Control | |
|---|---|---|---|---|---|---|
| Number of Reactions | 5727 | 5773 | 5895 | 5845 | 5898 | 5826 |
| Number of Metabolites | 4529 | 4593 | 4588 | 4541 | 4603 | 4542 |
| Number of Genes | 2494 | 2516 | 2632 | 2615 | 2585 | 2592 |
Publisher’s Note: MDPI stays neutral with regard to jurisdictional claims in published maps and institutional affiliations. |
© 2021 by the authors. Licensee MDPI, Basel, Switzerland. This article is an open access article distributed under the terms and conditions of the Creative Commons Attribution (CC BY) license (https://creativecommons.org/licenses/by/4.0/).
Share and Cite
Bayraktar, A.; Lam, S.; Altay, O.; Li, X.; Yuan, M.; Zhang, C.; Arif, M.; Turkez, H.; Uhlén, M.; Shoaie, S.; et al. Revealing the Molecular Mechanisms of Alzheimer’s Disease Based on Network Analysis. Int. J. Mol. Sci. 2021, 22, 11556. https://doi.org/10.3390/ijms222111556
Bayraktar A, Lam S, Altay O, Li X, Yuan M, Zhang C, Arif M, Turkez H, Uhlén M, Shoaie S, et al. Revealing the Molecular Mechanisms of Alzheimer’s Disease Based on Network Analysis. International Journal of Molecular Sciences. 2021; 22(21):11556. https://doi.org/10.3390/ijms222111556
Chicago/Turabian StyleBayraktar, Abdulahad, Simon Lam, Ozlem Altay, Xiangyu Li, Meng Yuan, Cheng Zhang, Muhammad Arif, Hasan Turkez, Mathias Uhlén, Saeed Shoaie, and et al. 2021. "Revealing the Molecular Mechanisms of Alzheimer’s Disease Based on Network Analysis" International Journal of Molecular Sciences 22, no. 21: 11556. https://doi.org/10.3390/ijms222111556
APA StyleBayraktar, A., Lam, S., Altay, O., Li, X., Yuan, M., Zhang, C., Arif, M., Turkez, H., Uhlén, M., Shoaie, S., & Mardinoglu, A. (2021). Revealing the Molecular Mechanisms of Alzheimer’s Disease Based on Network Analysis. International Journal of Molecular Sciences, 22(21), 11556. https://doi.org/10.3390/ijms222111556