Oxygen Is an Ambivalent Factor for the Differentiation of Human Pluripotent Stem Cells in Cardiac 2D Monolayer and 3D Cardiac Spheroids


 , , , , ,
  , and
, and 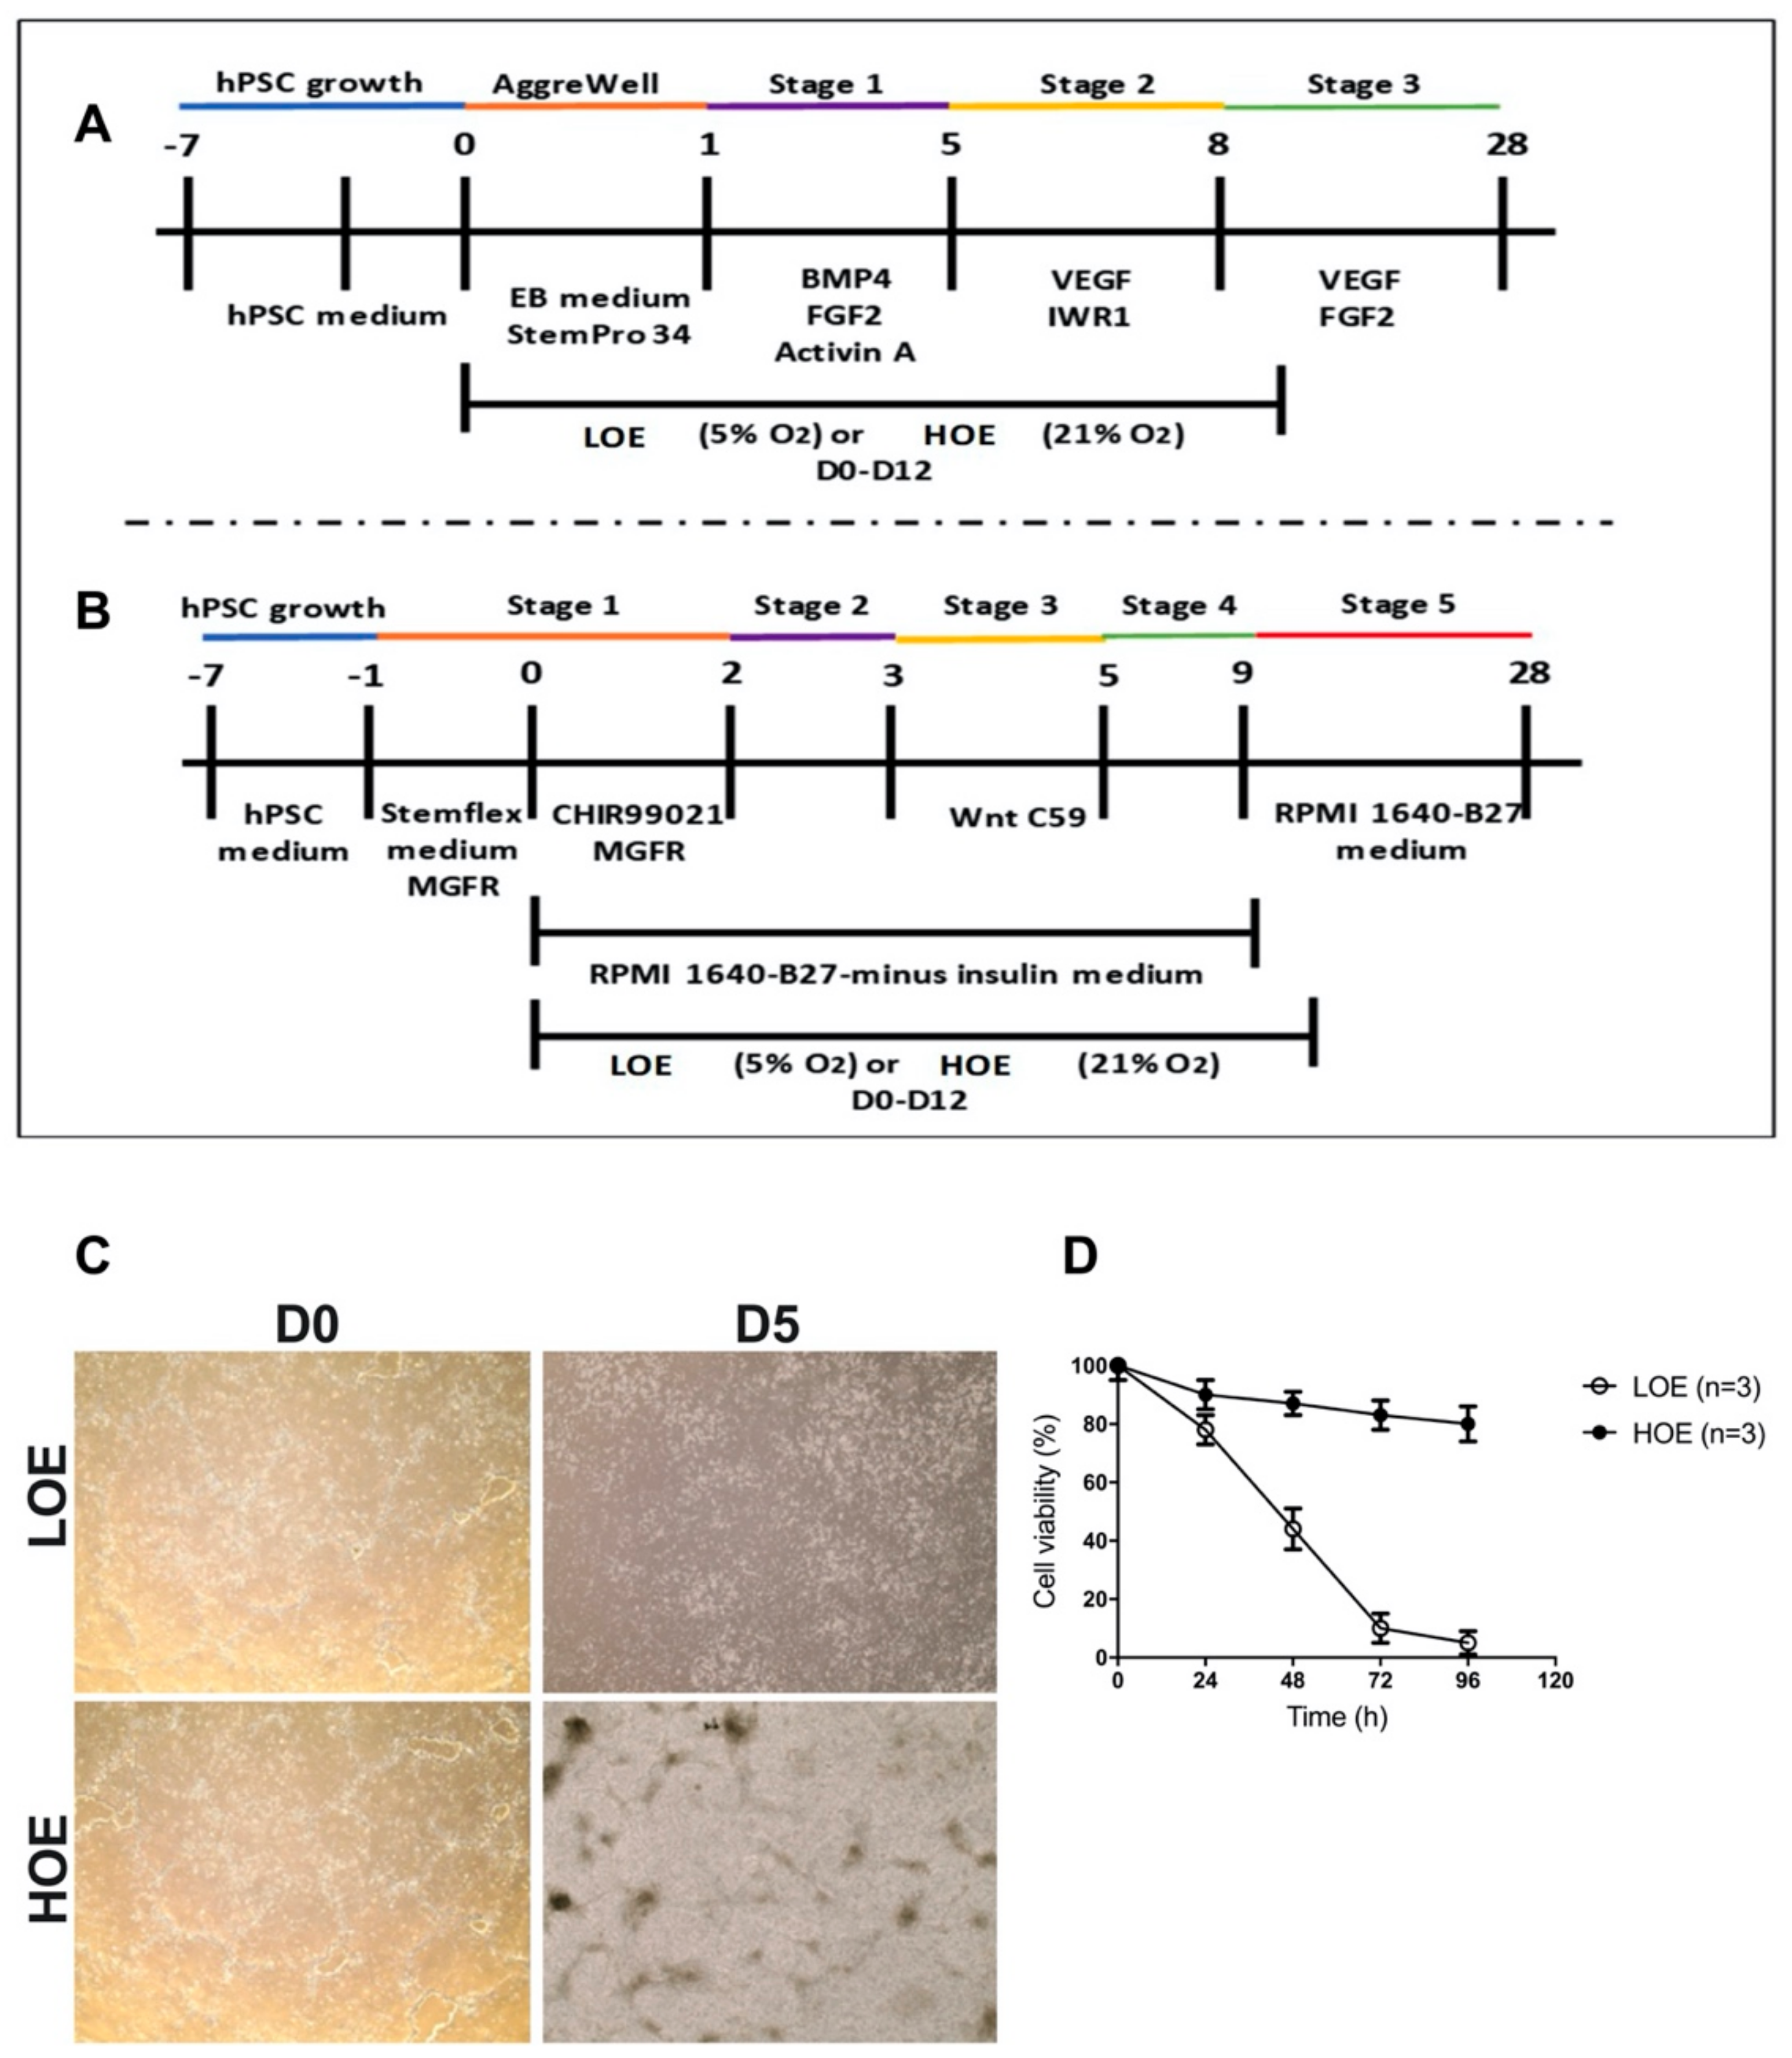
Abstract
1. Introduction
2. Results
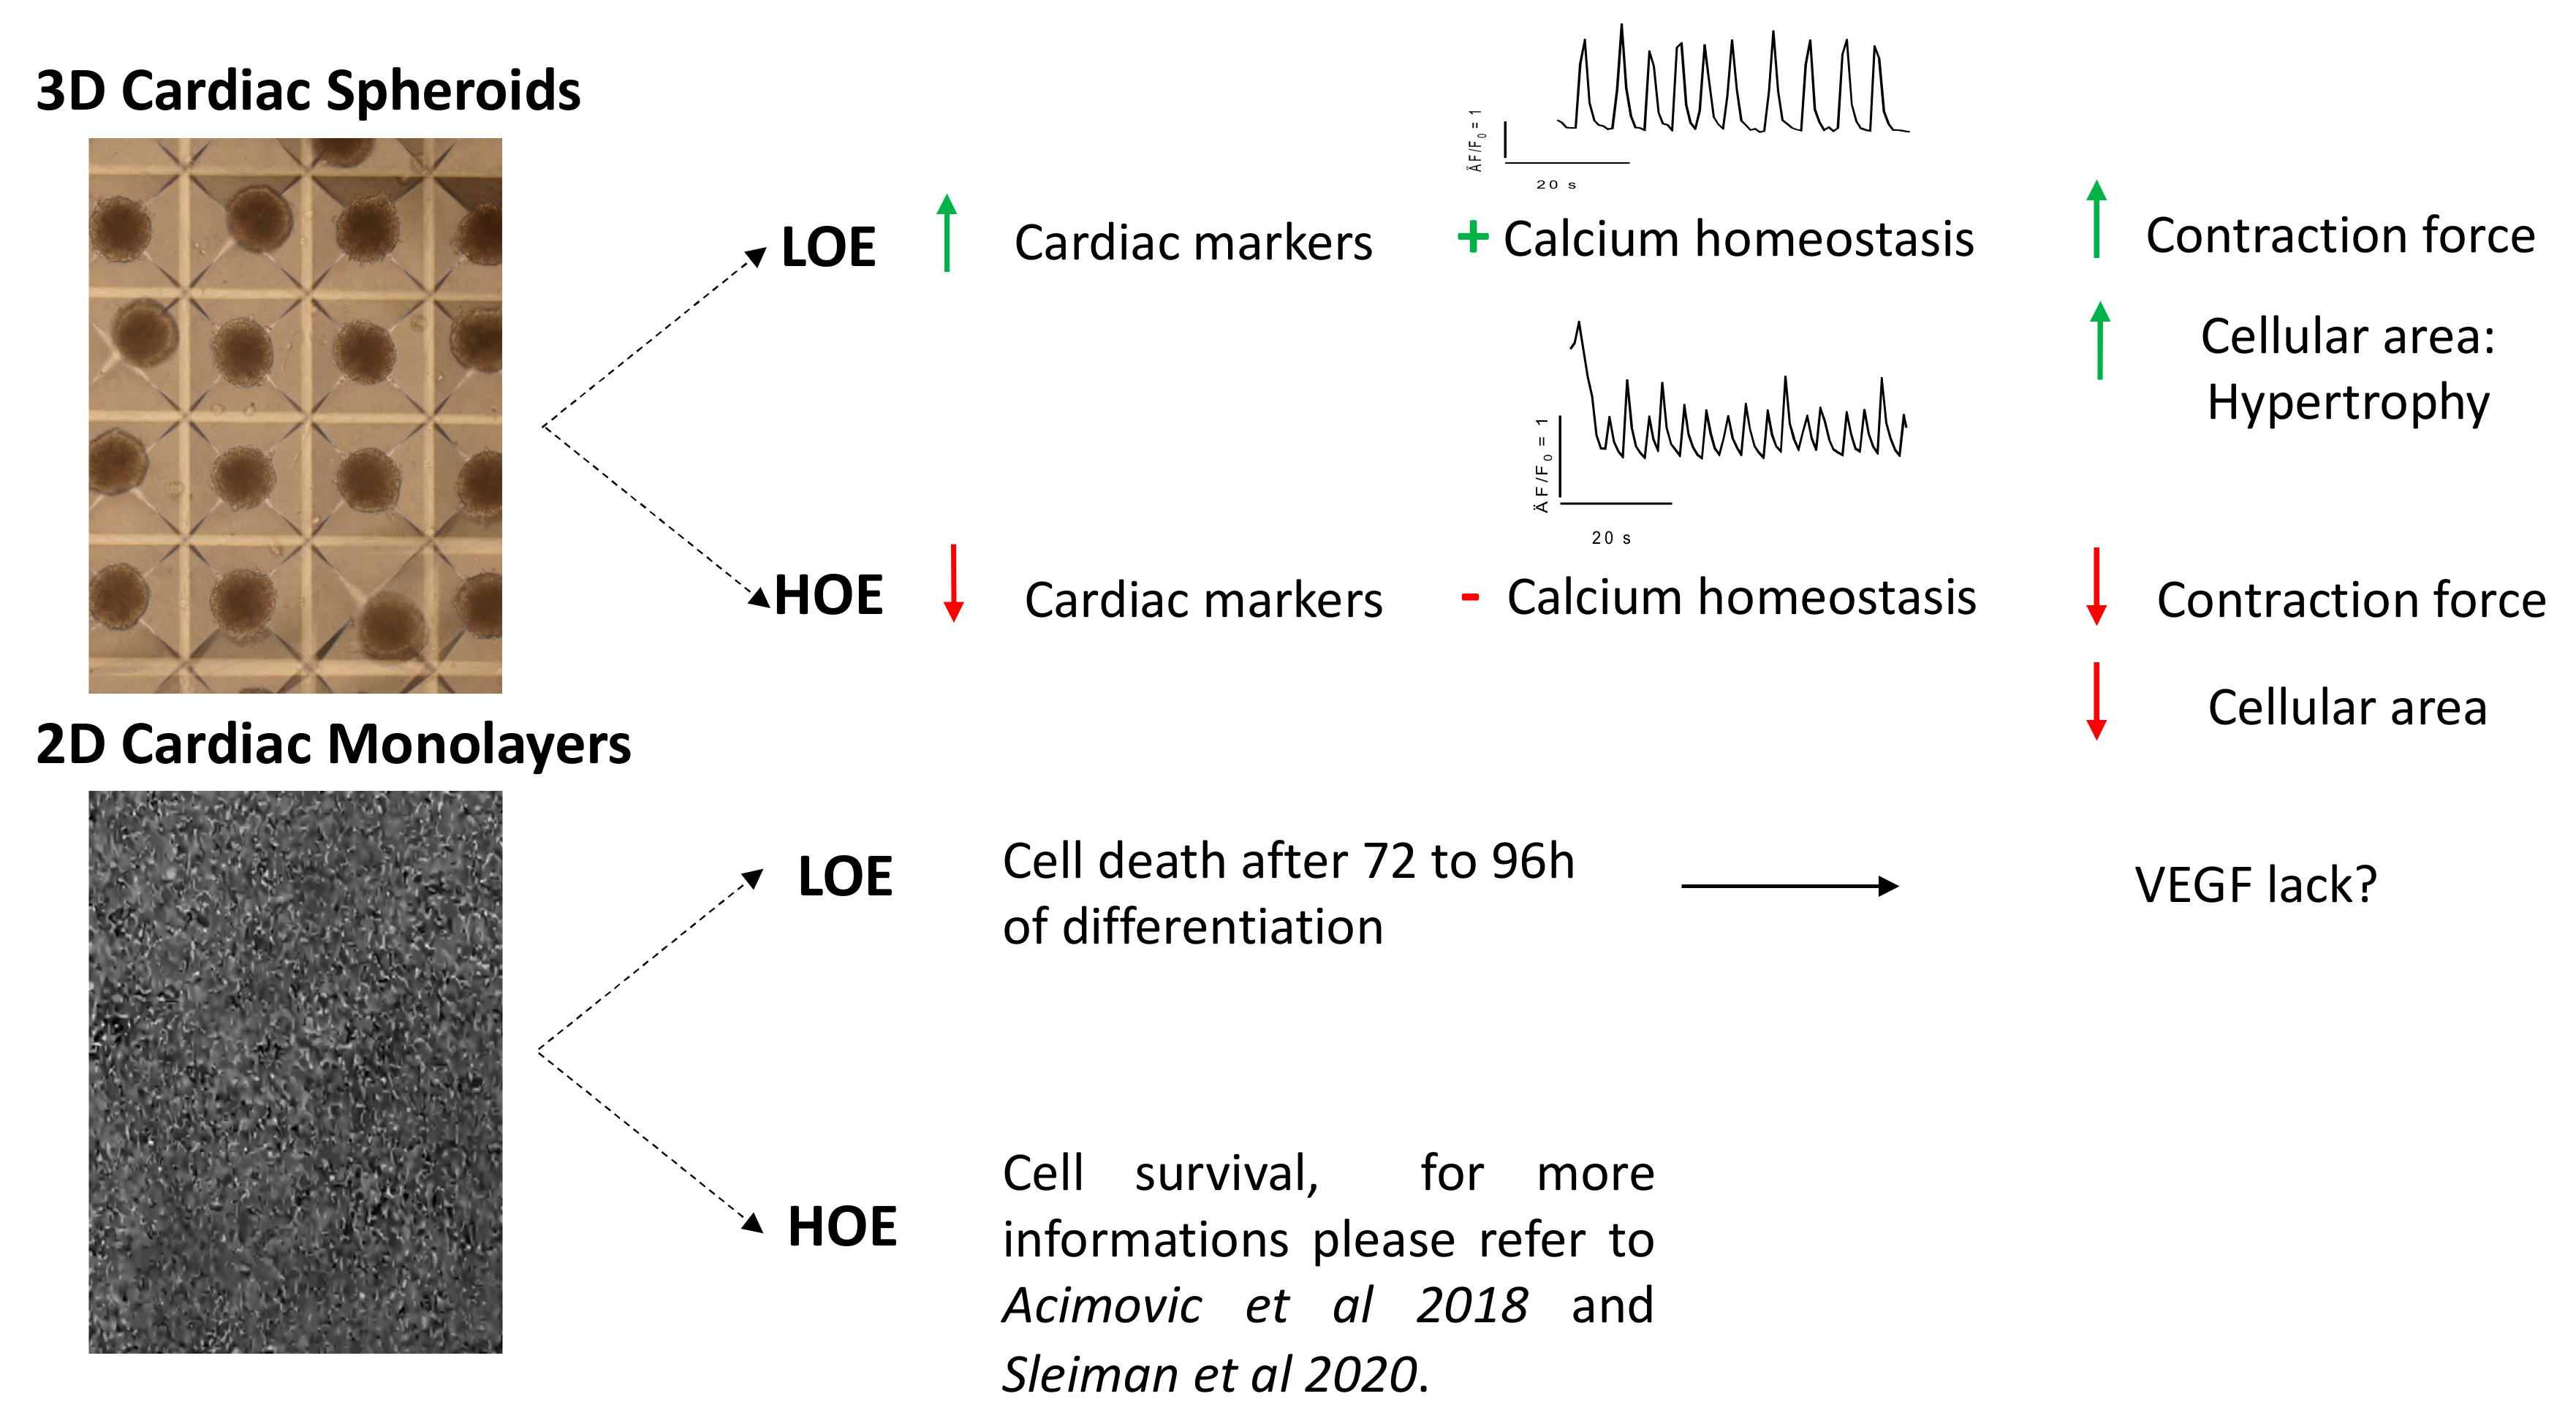
2.1. LOE Abolishes the Differentiation of hPSC in 2D Cardiac Monolayers But Not in 3D Cardiac Spheroids
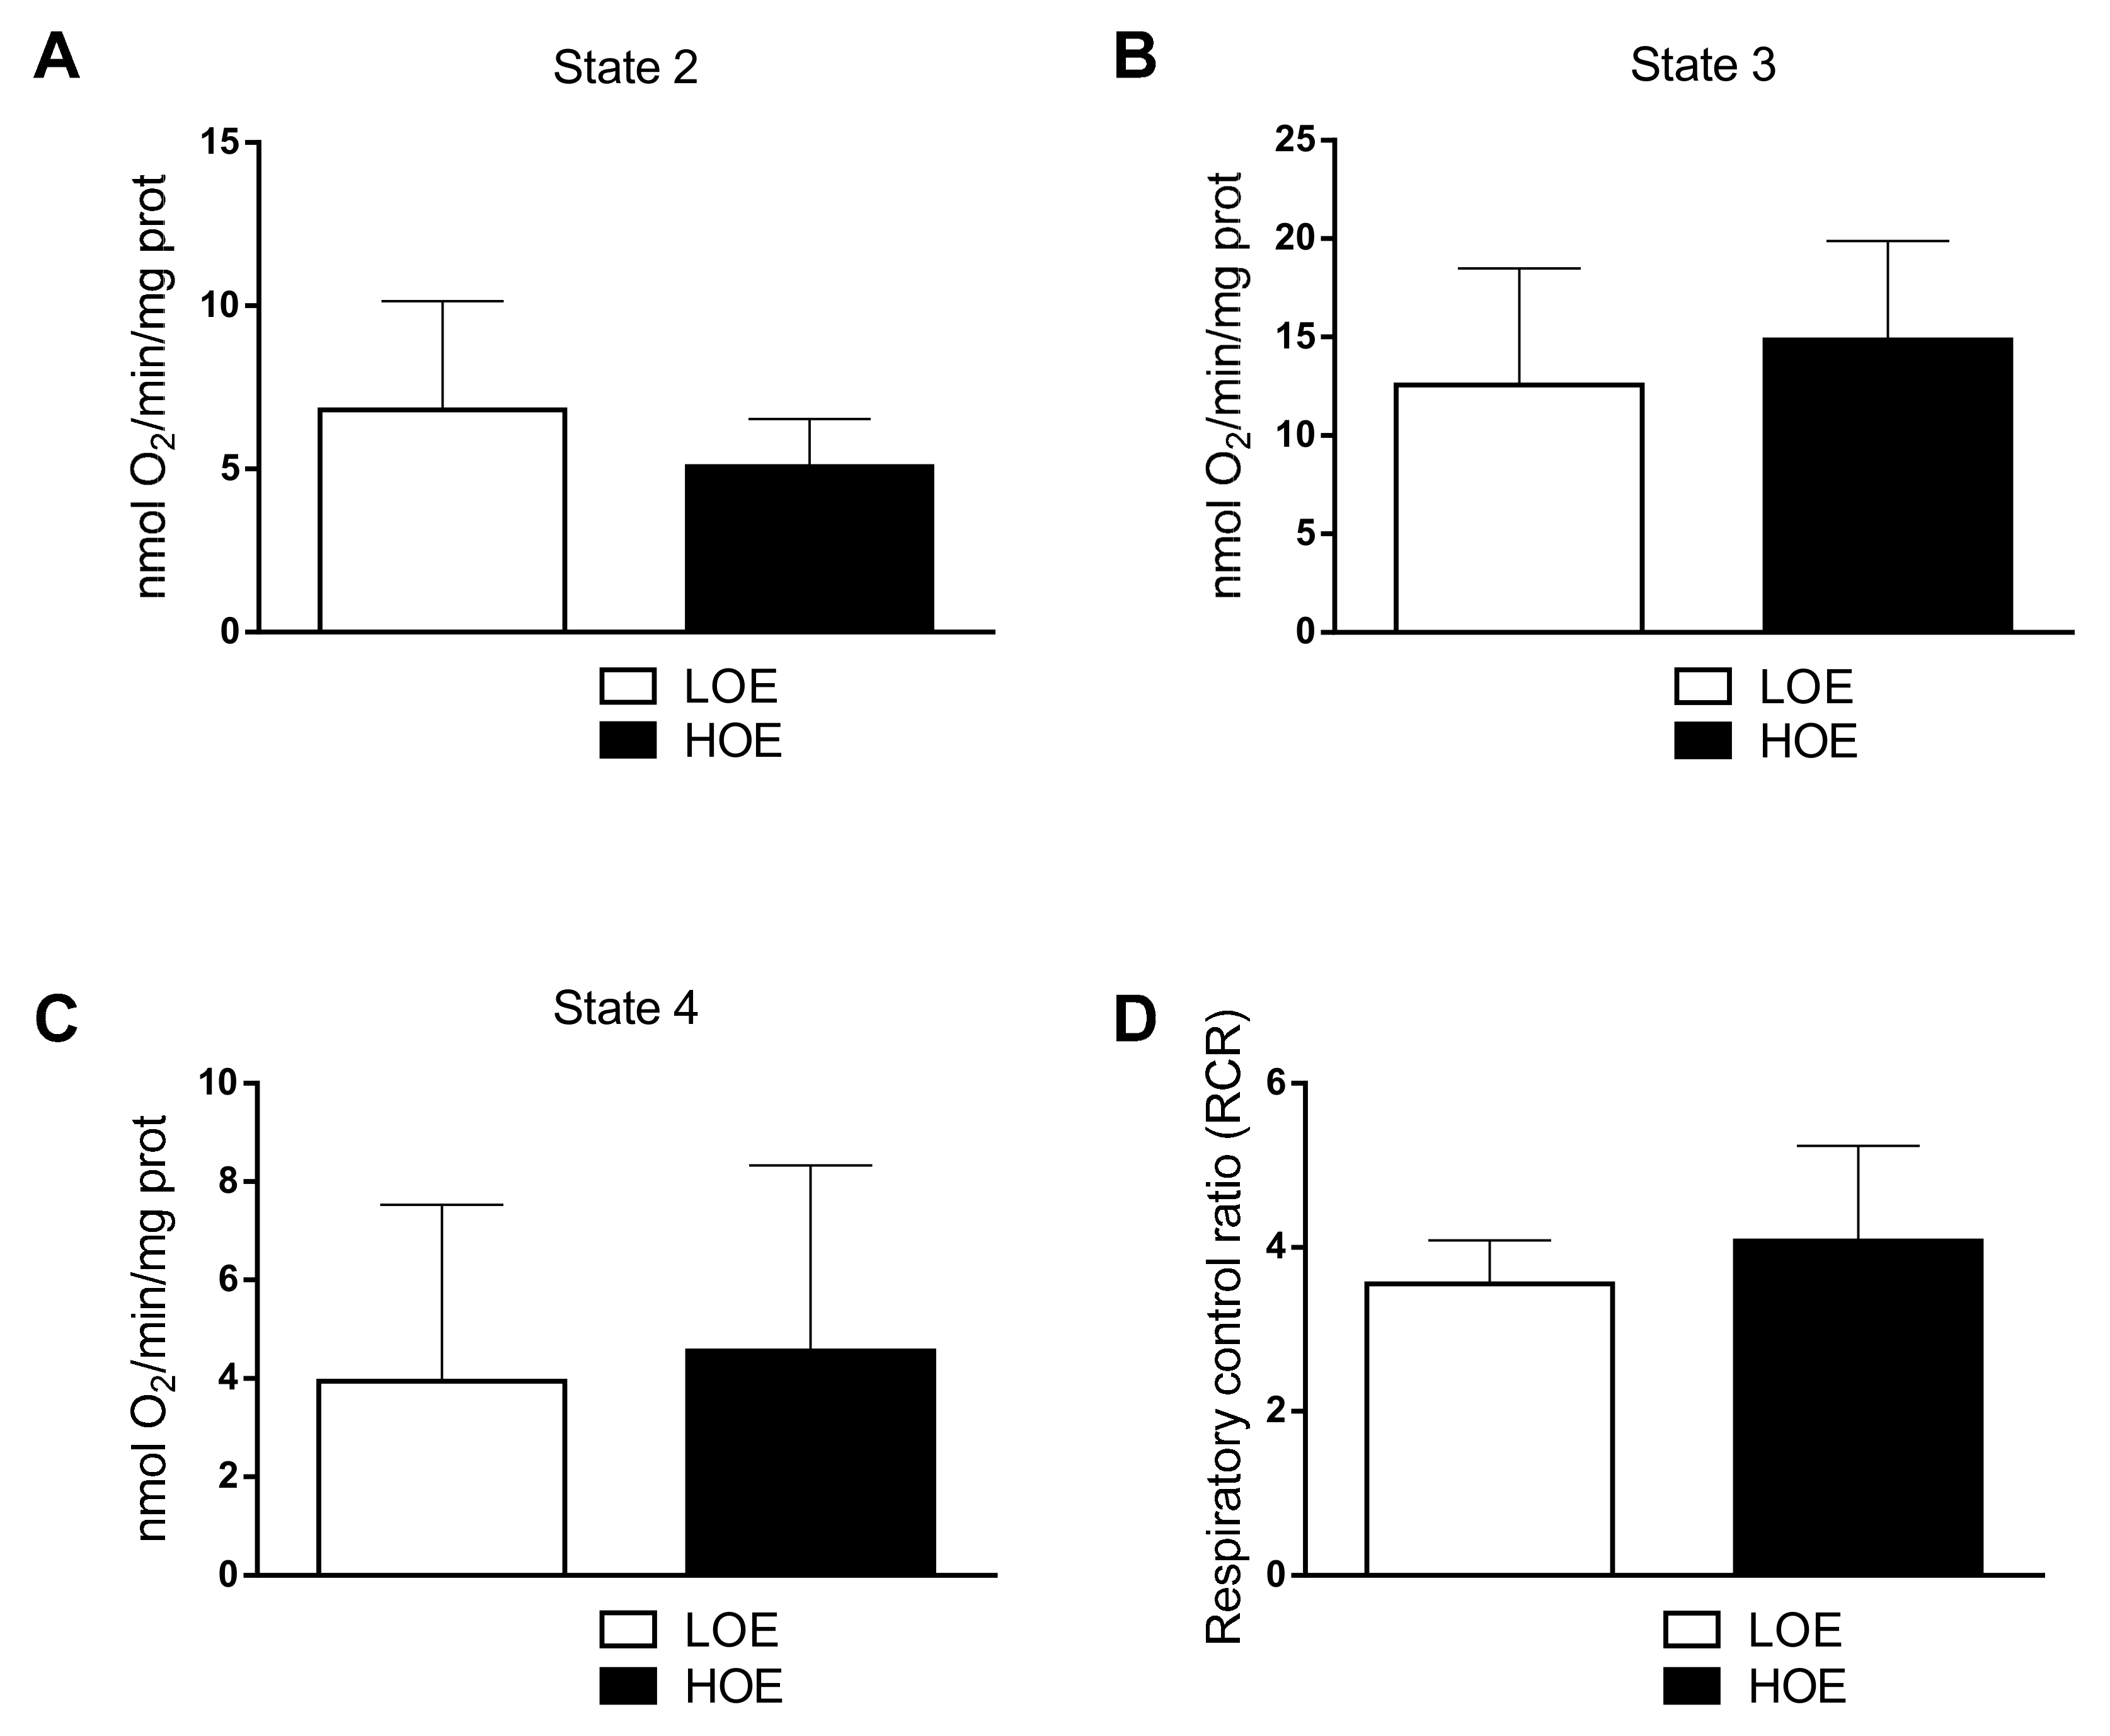
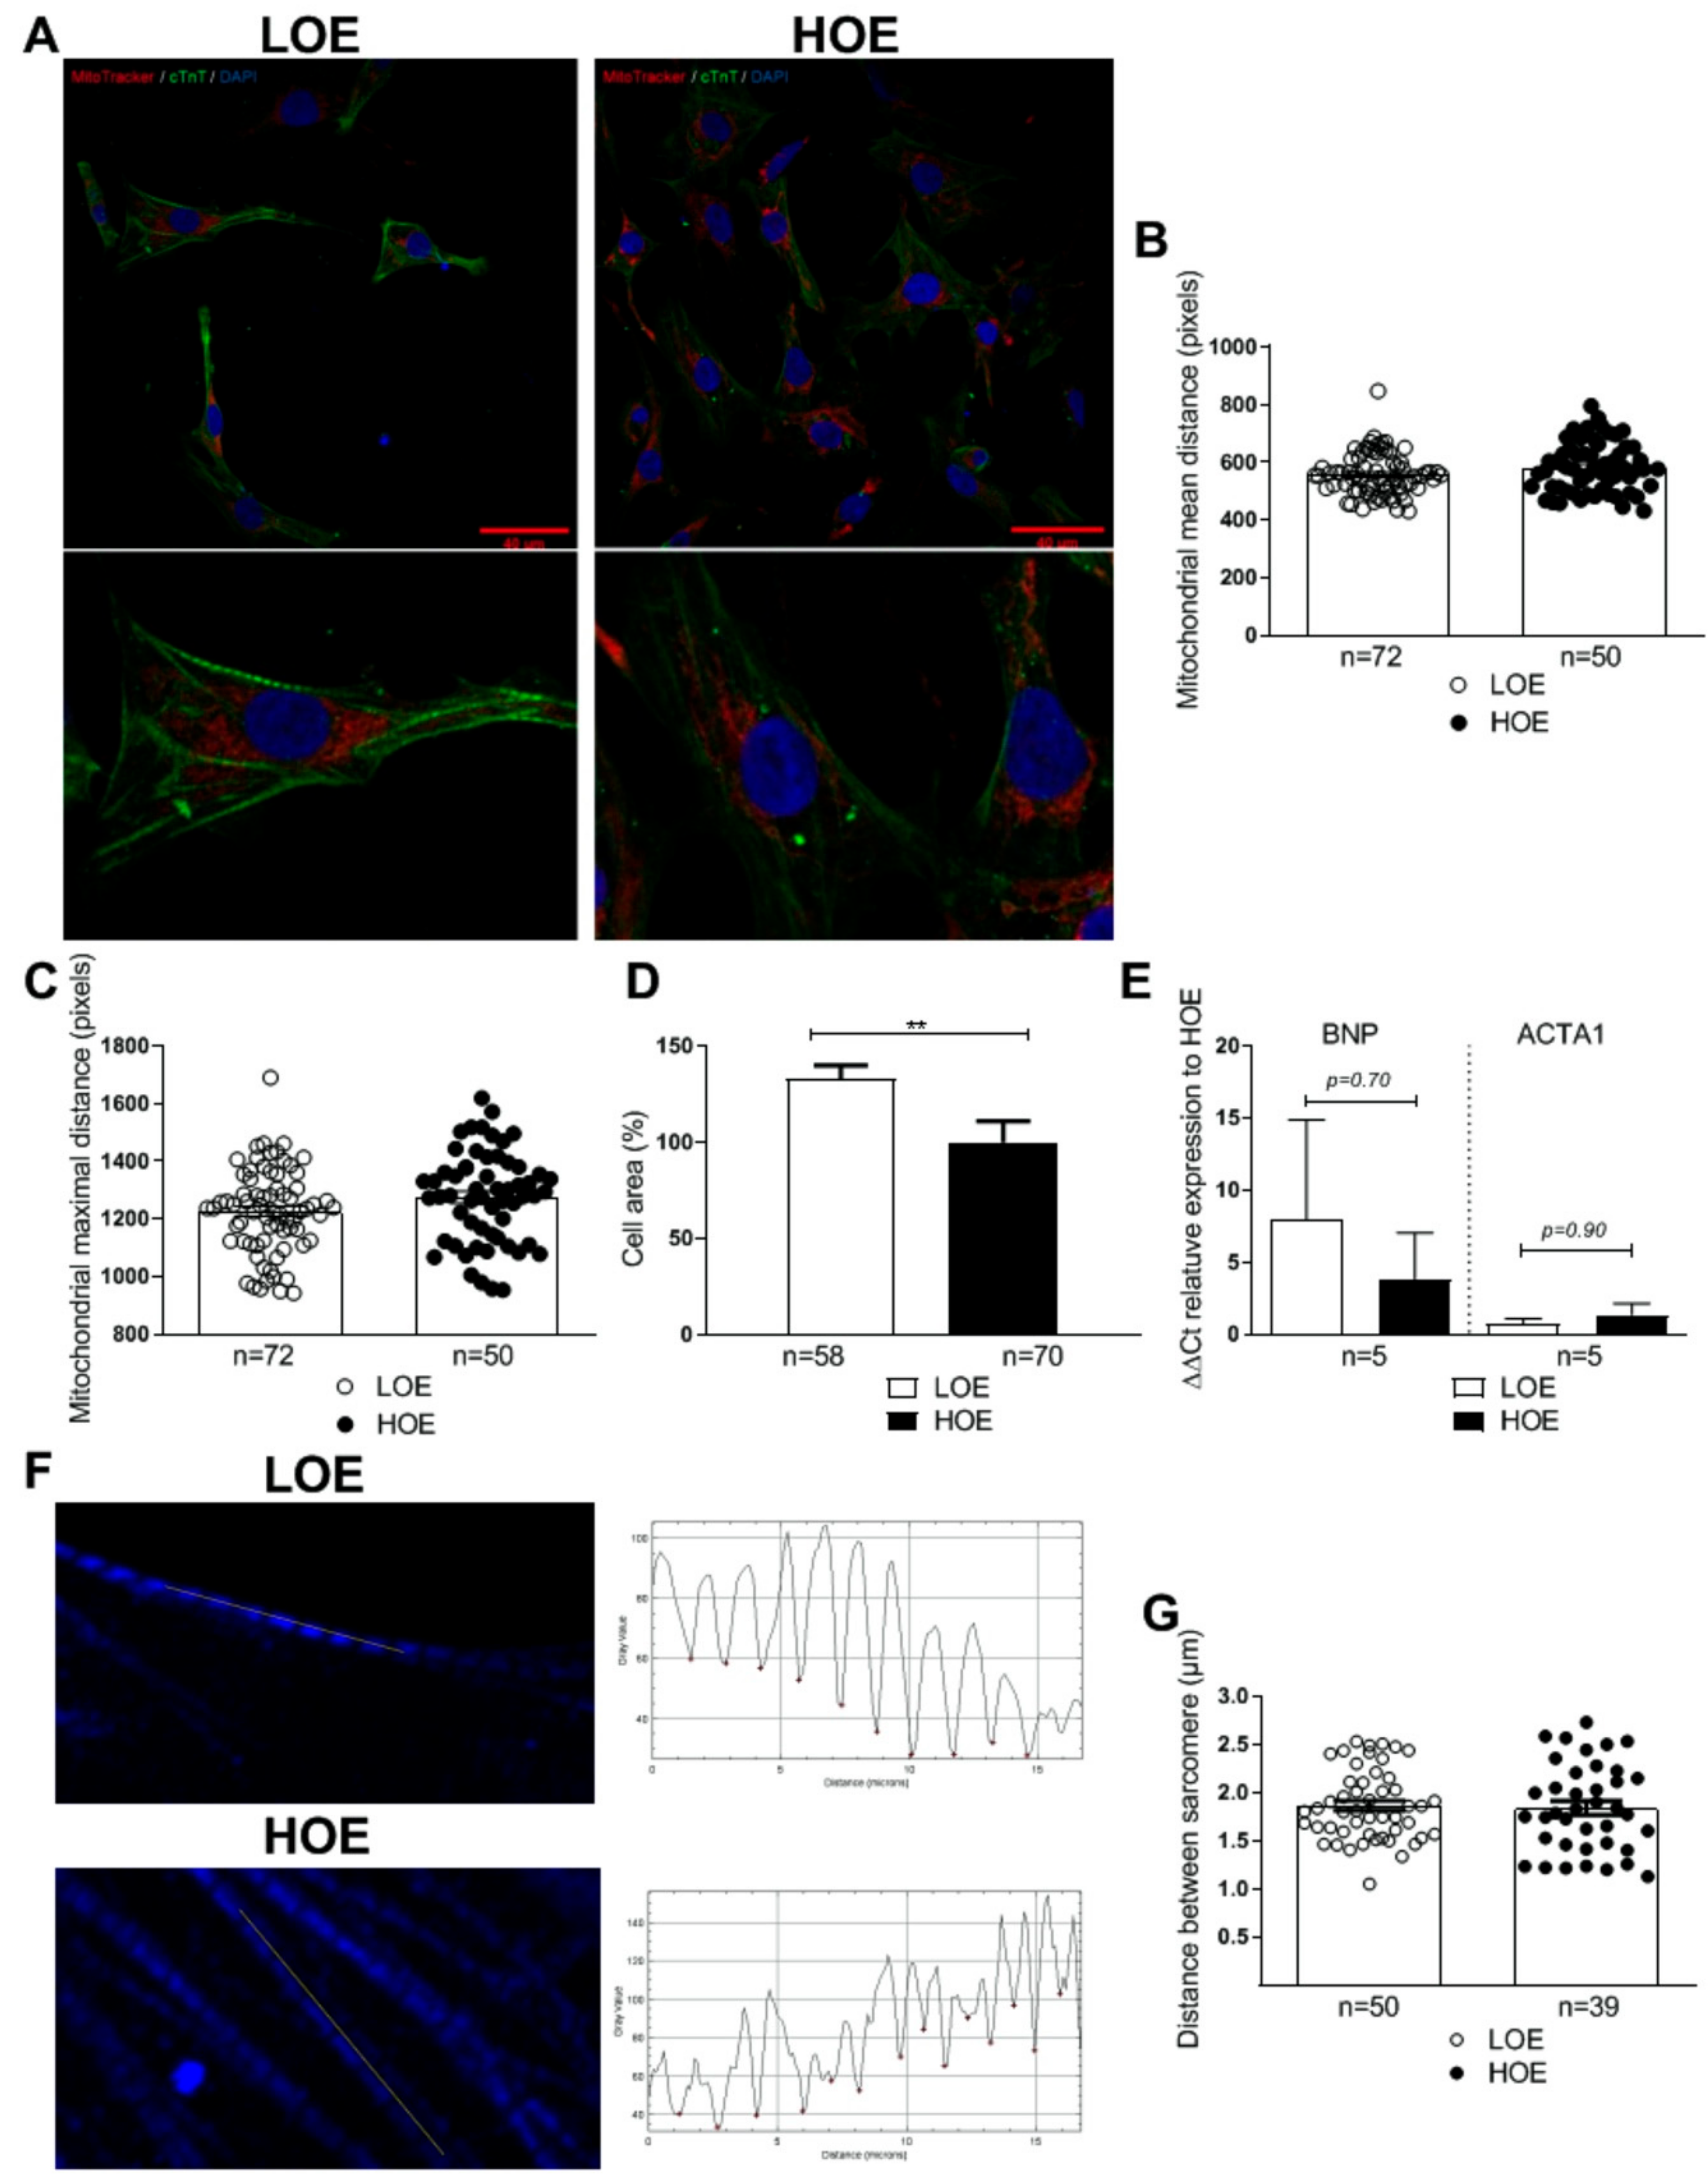
2.2. Oxygen Exposure Does Not Affect the Mitochondrial Distribution and Function in 3D Cardiac Spheroids
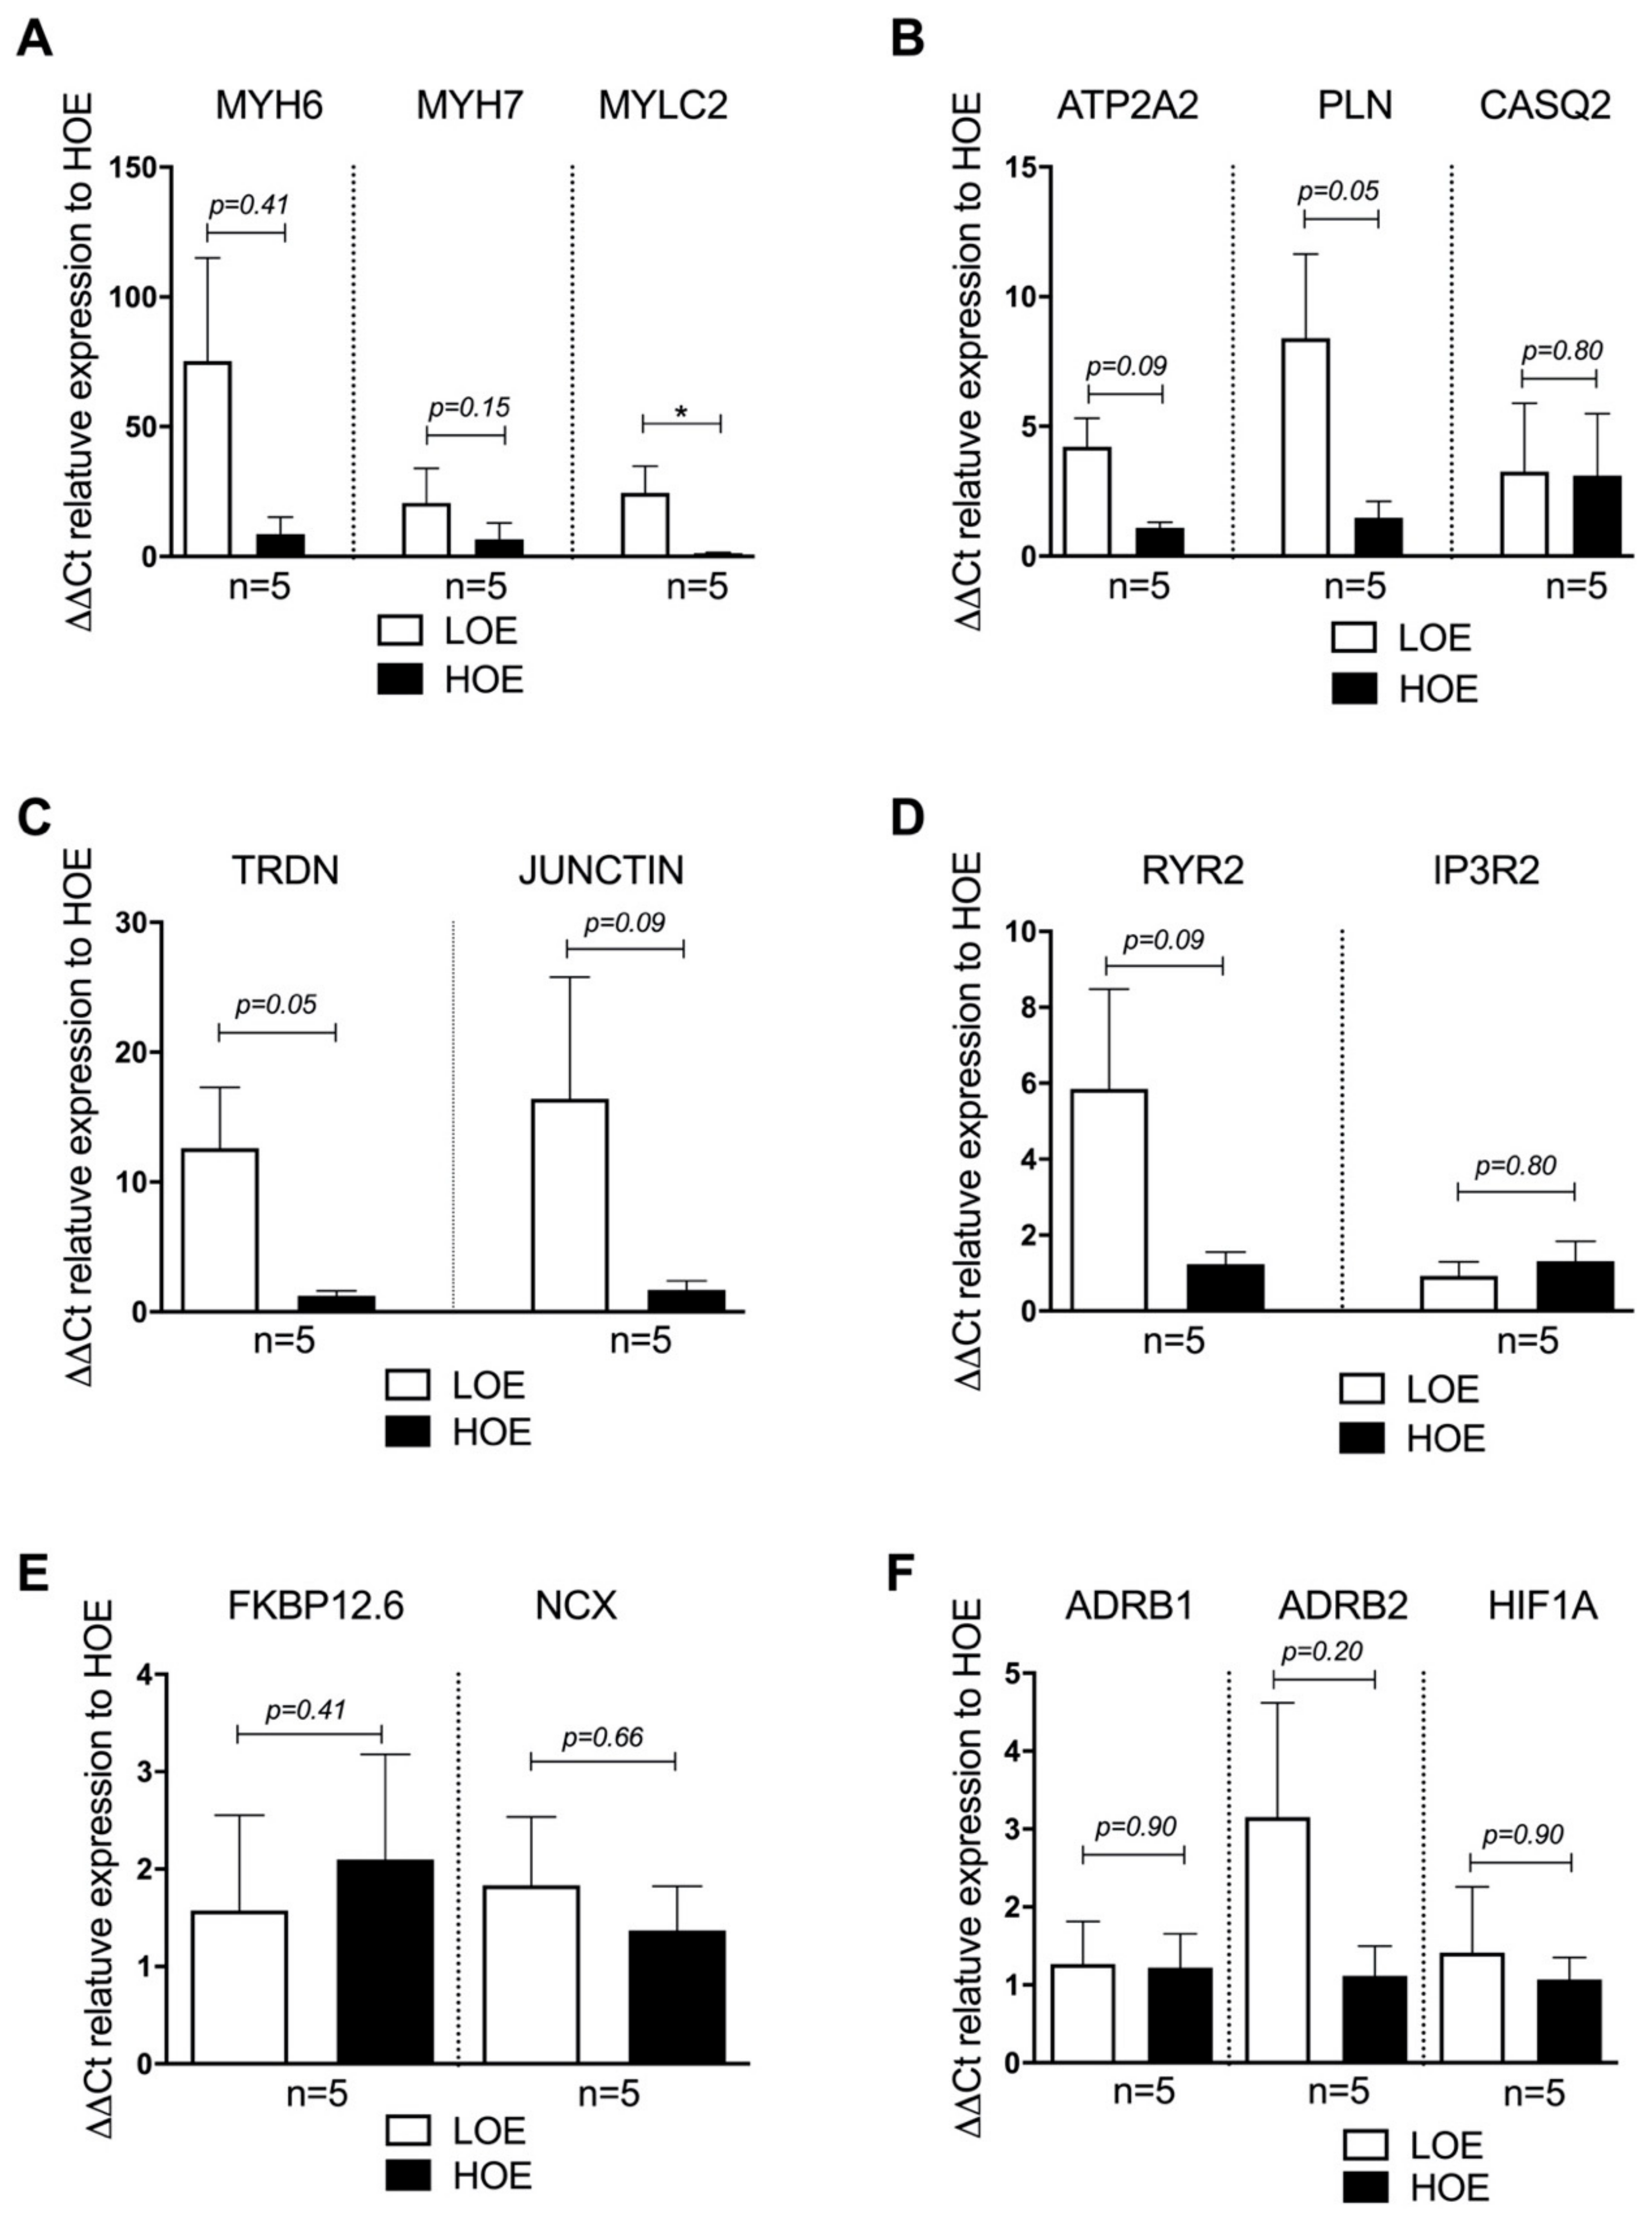
2.3. LOE Enhances the Expression of the Cardiac Markers in hPSC-CMs in 3D Cardiac Spheroids
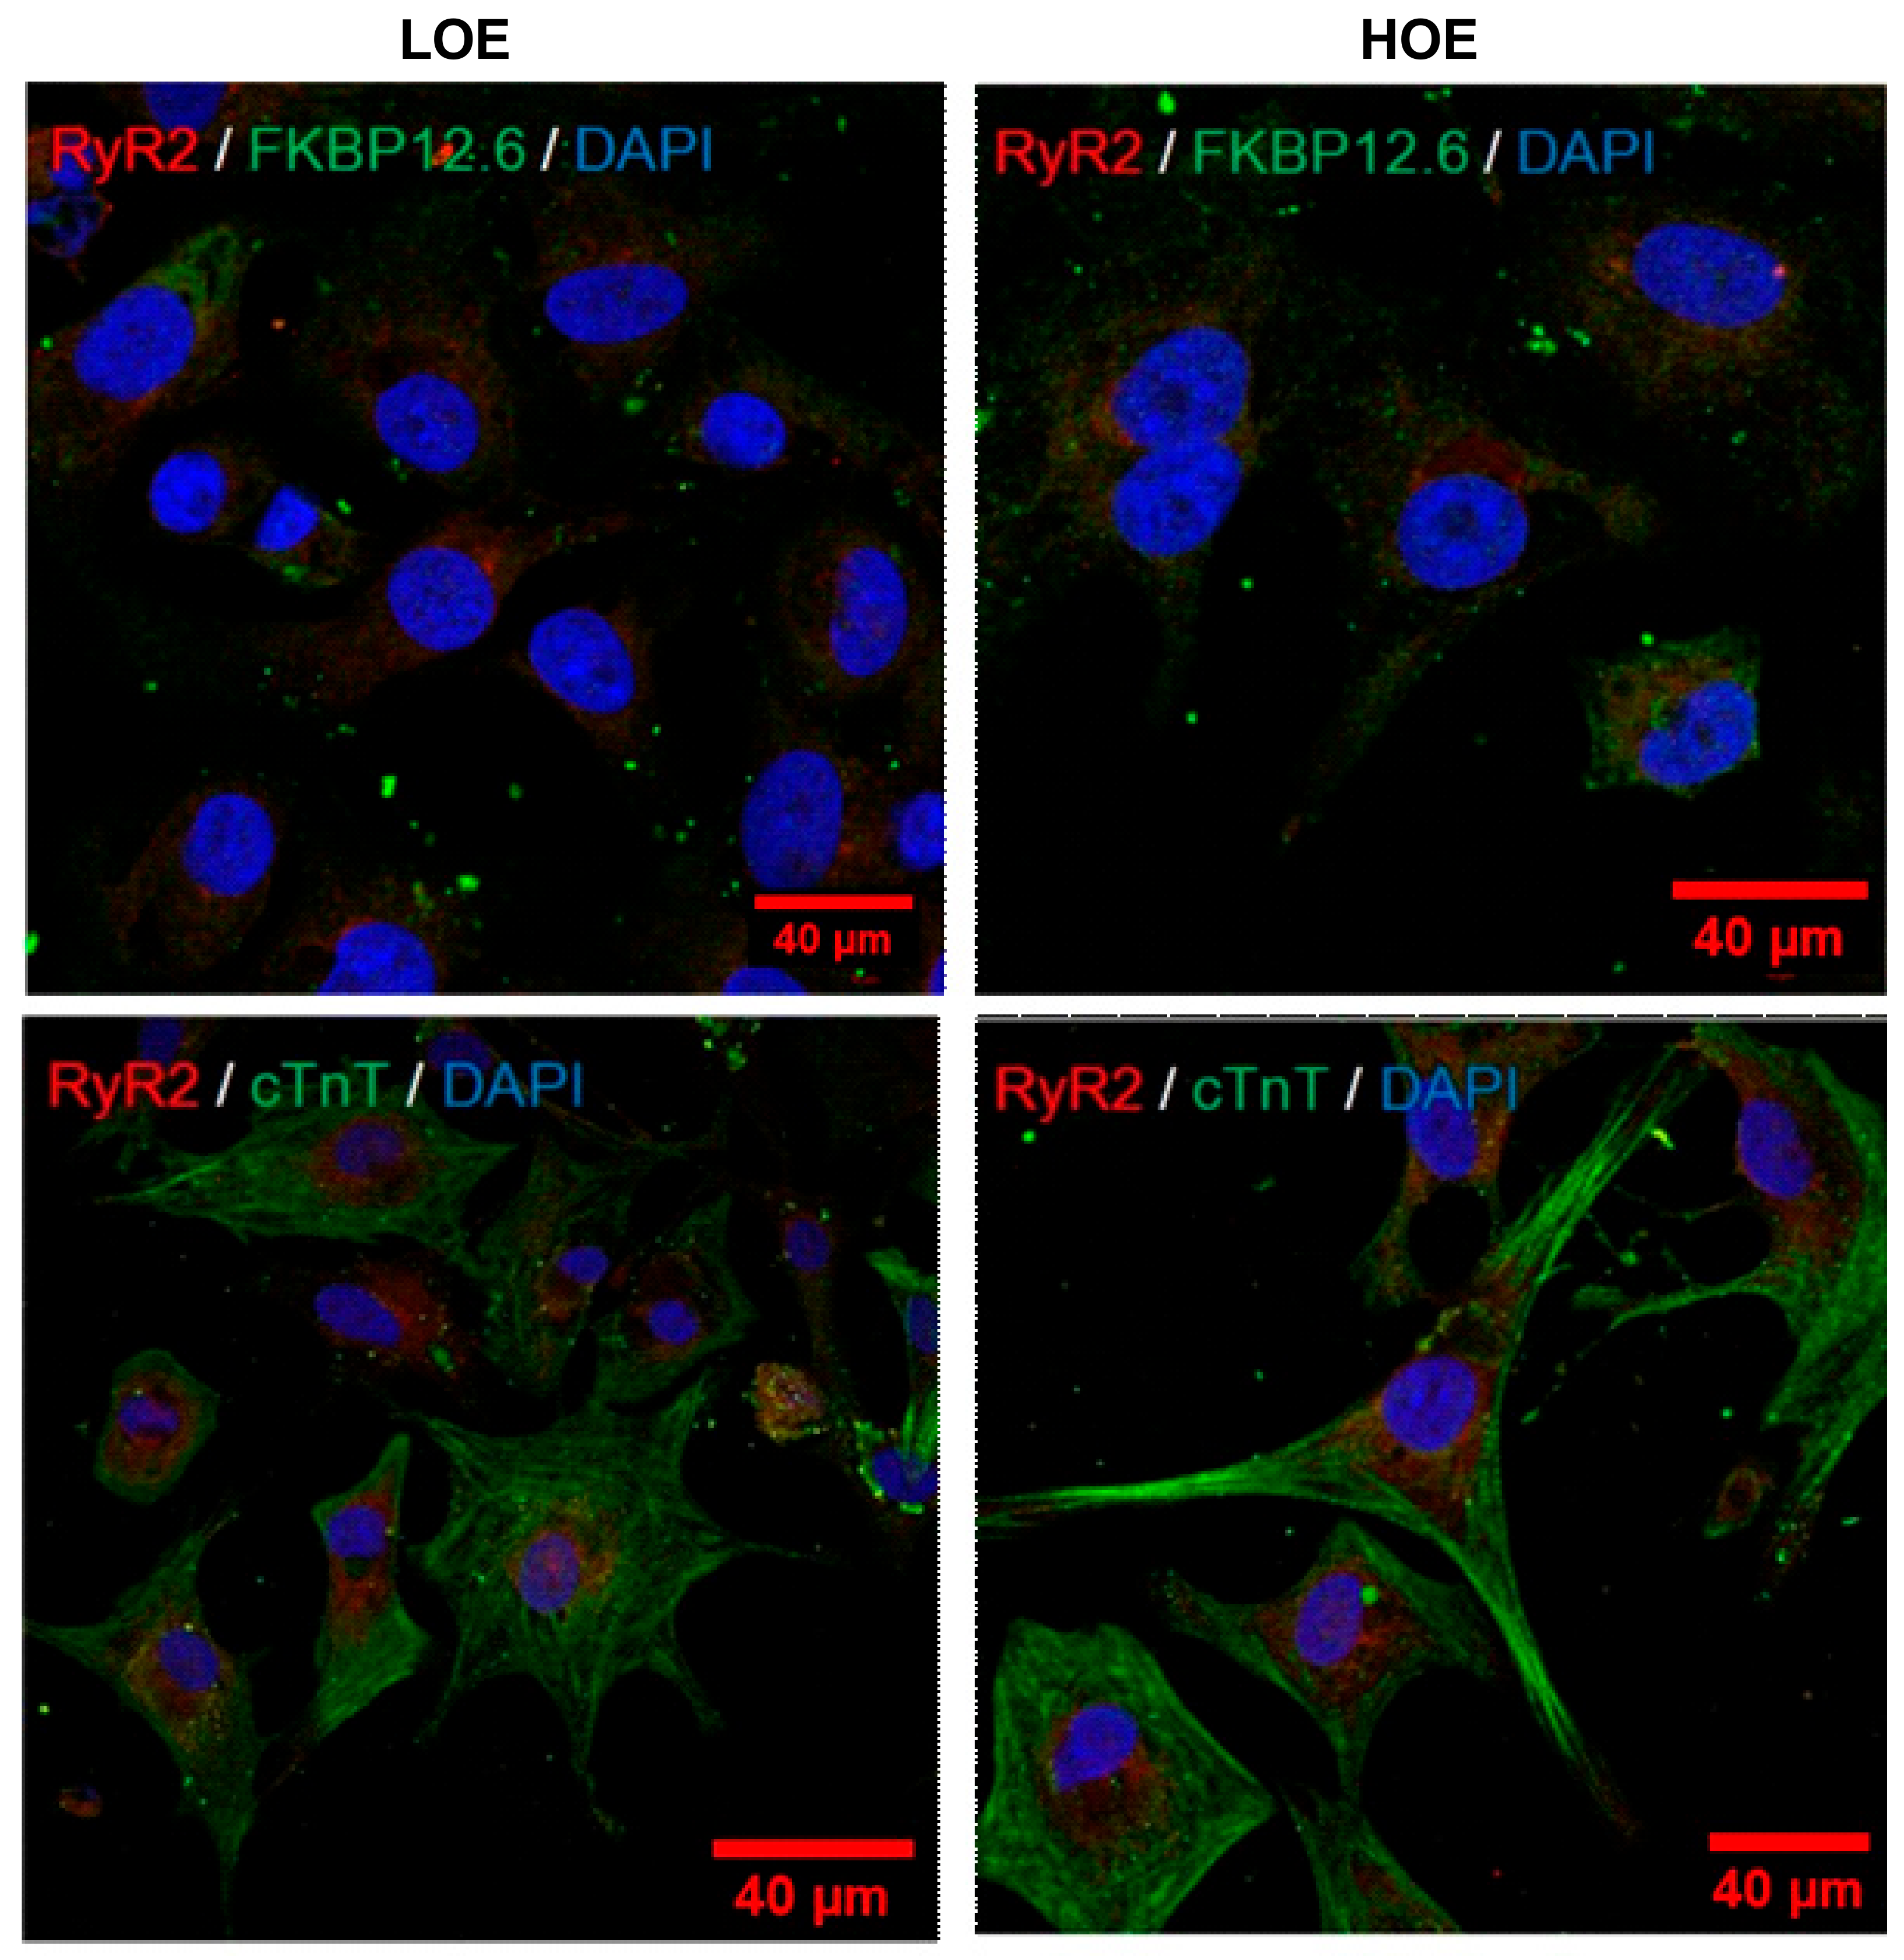
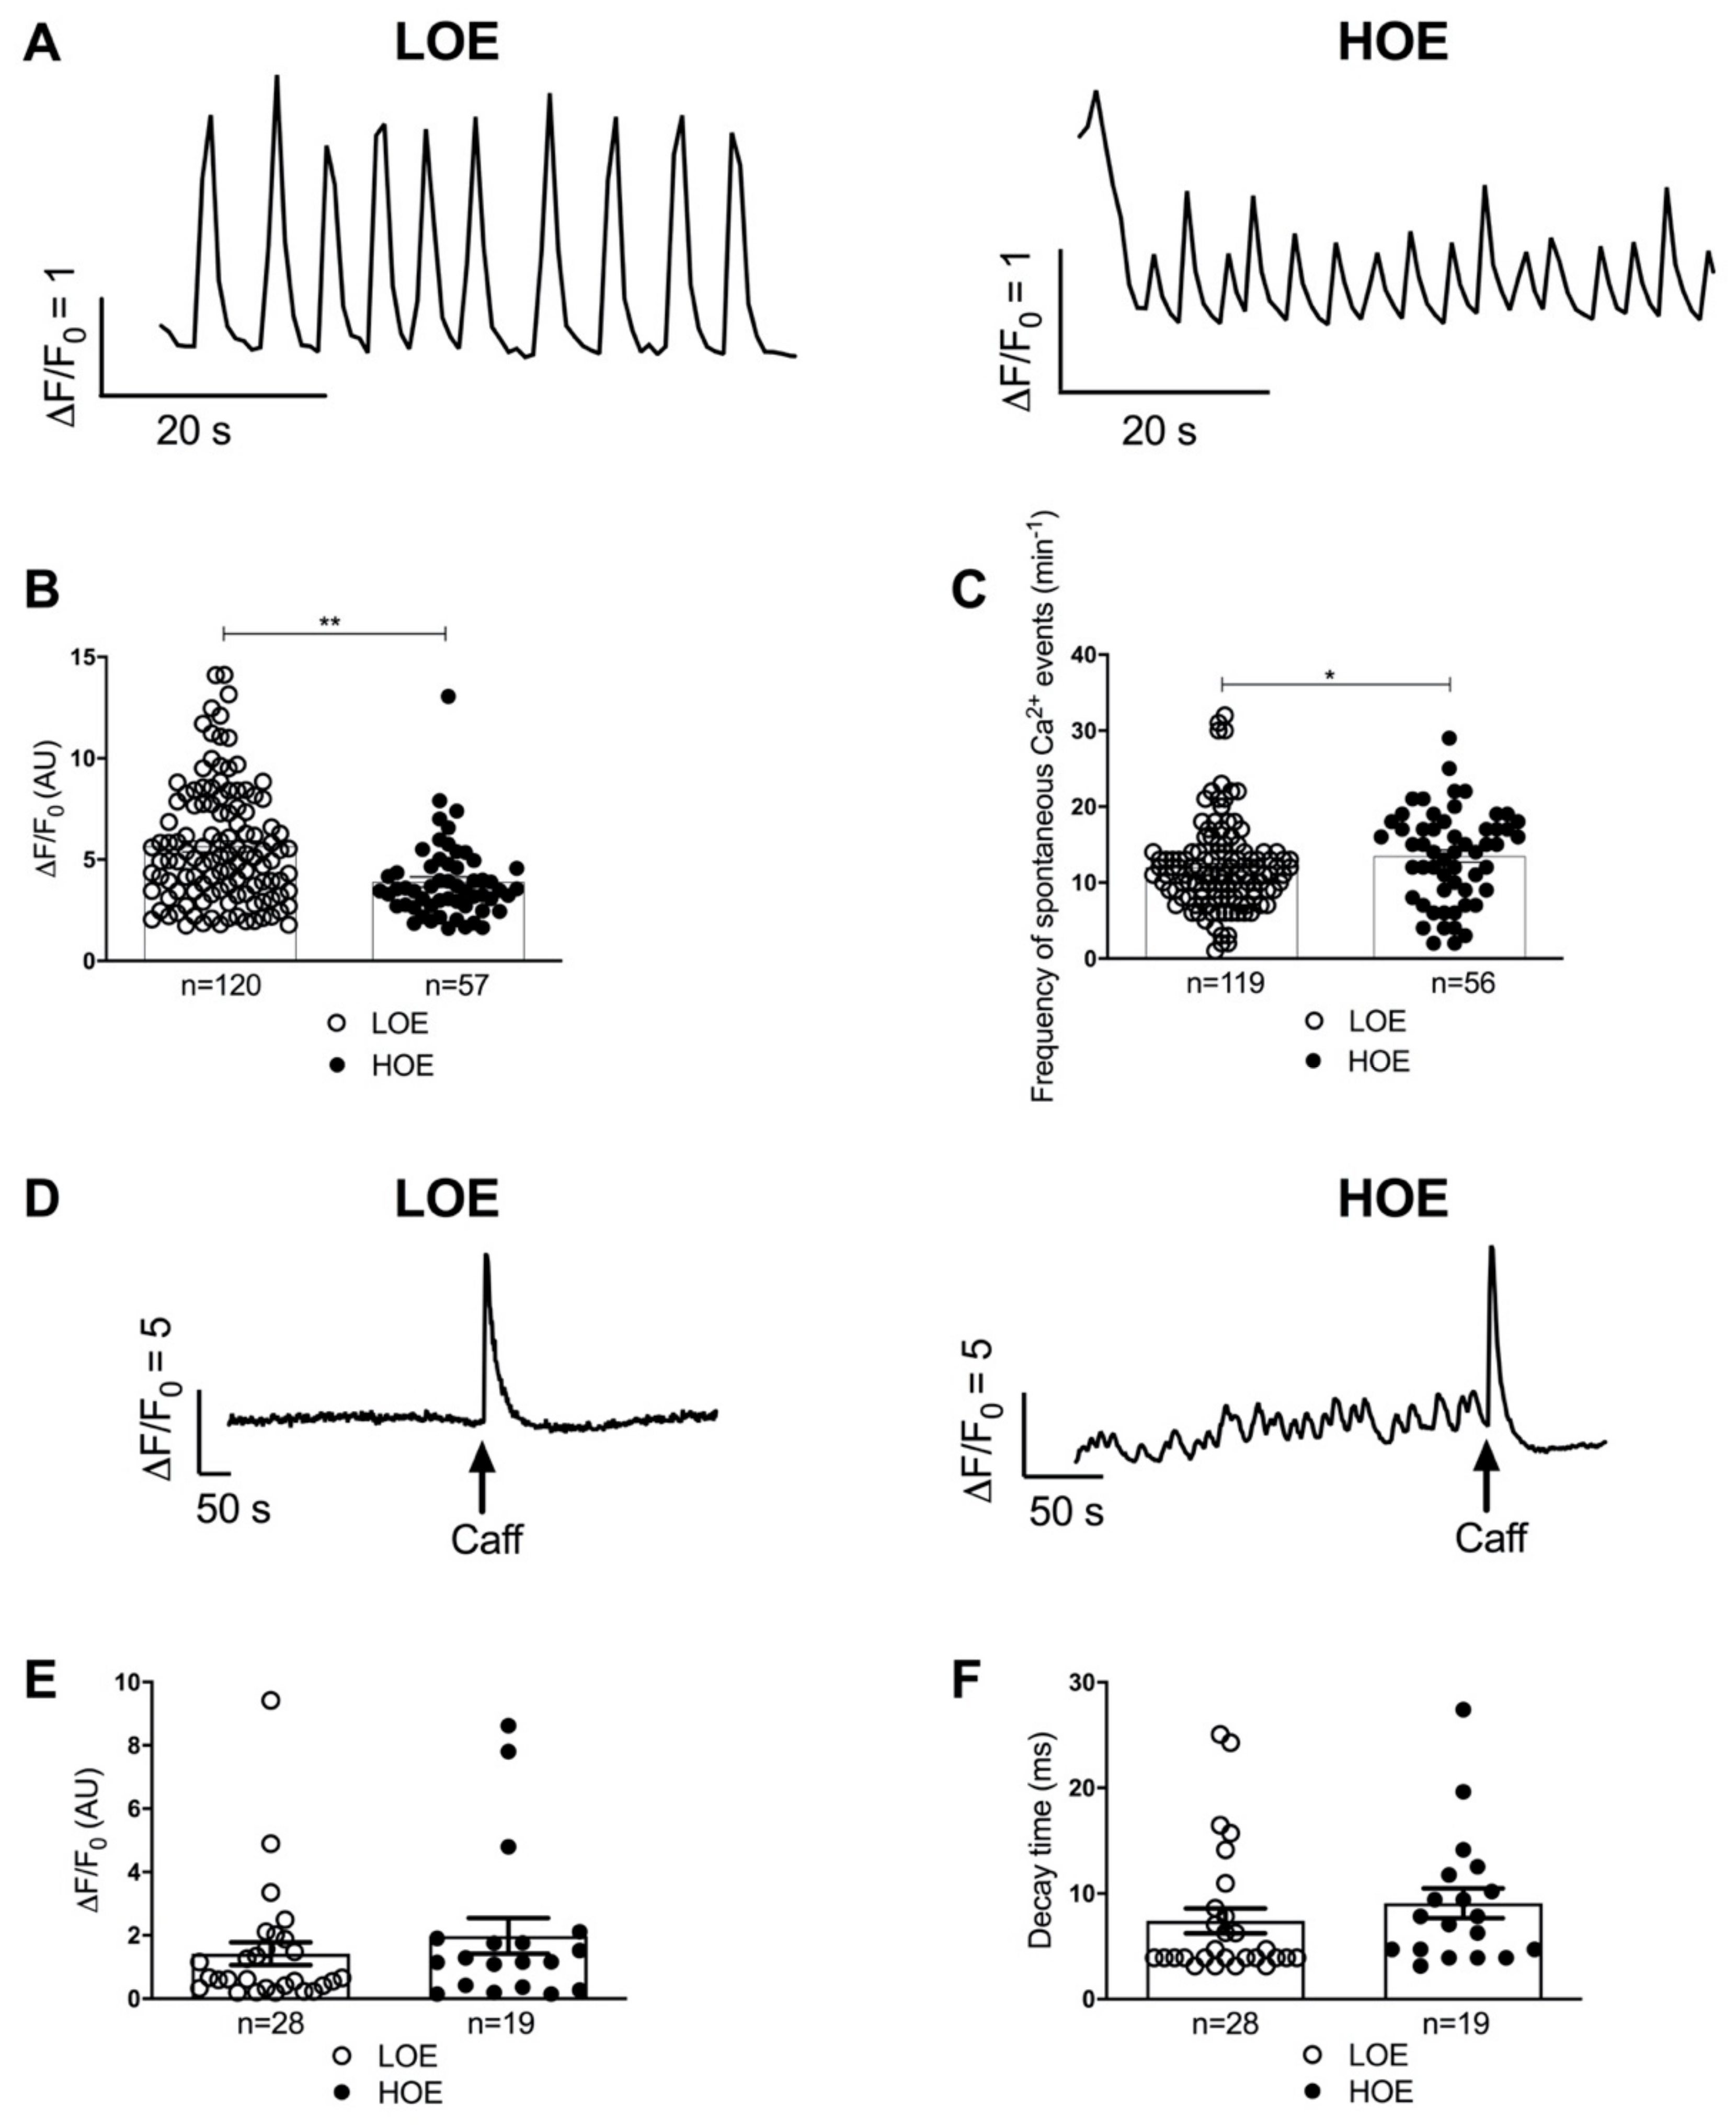
2.4. LOE Leads to a Steadier SR Ca2+ Handling in hPSC-CMs Contained in 3D Cardiac Spheroids
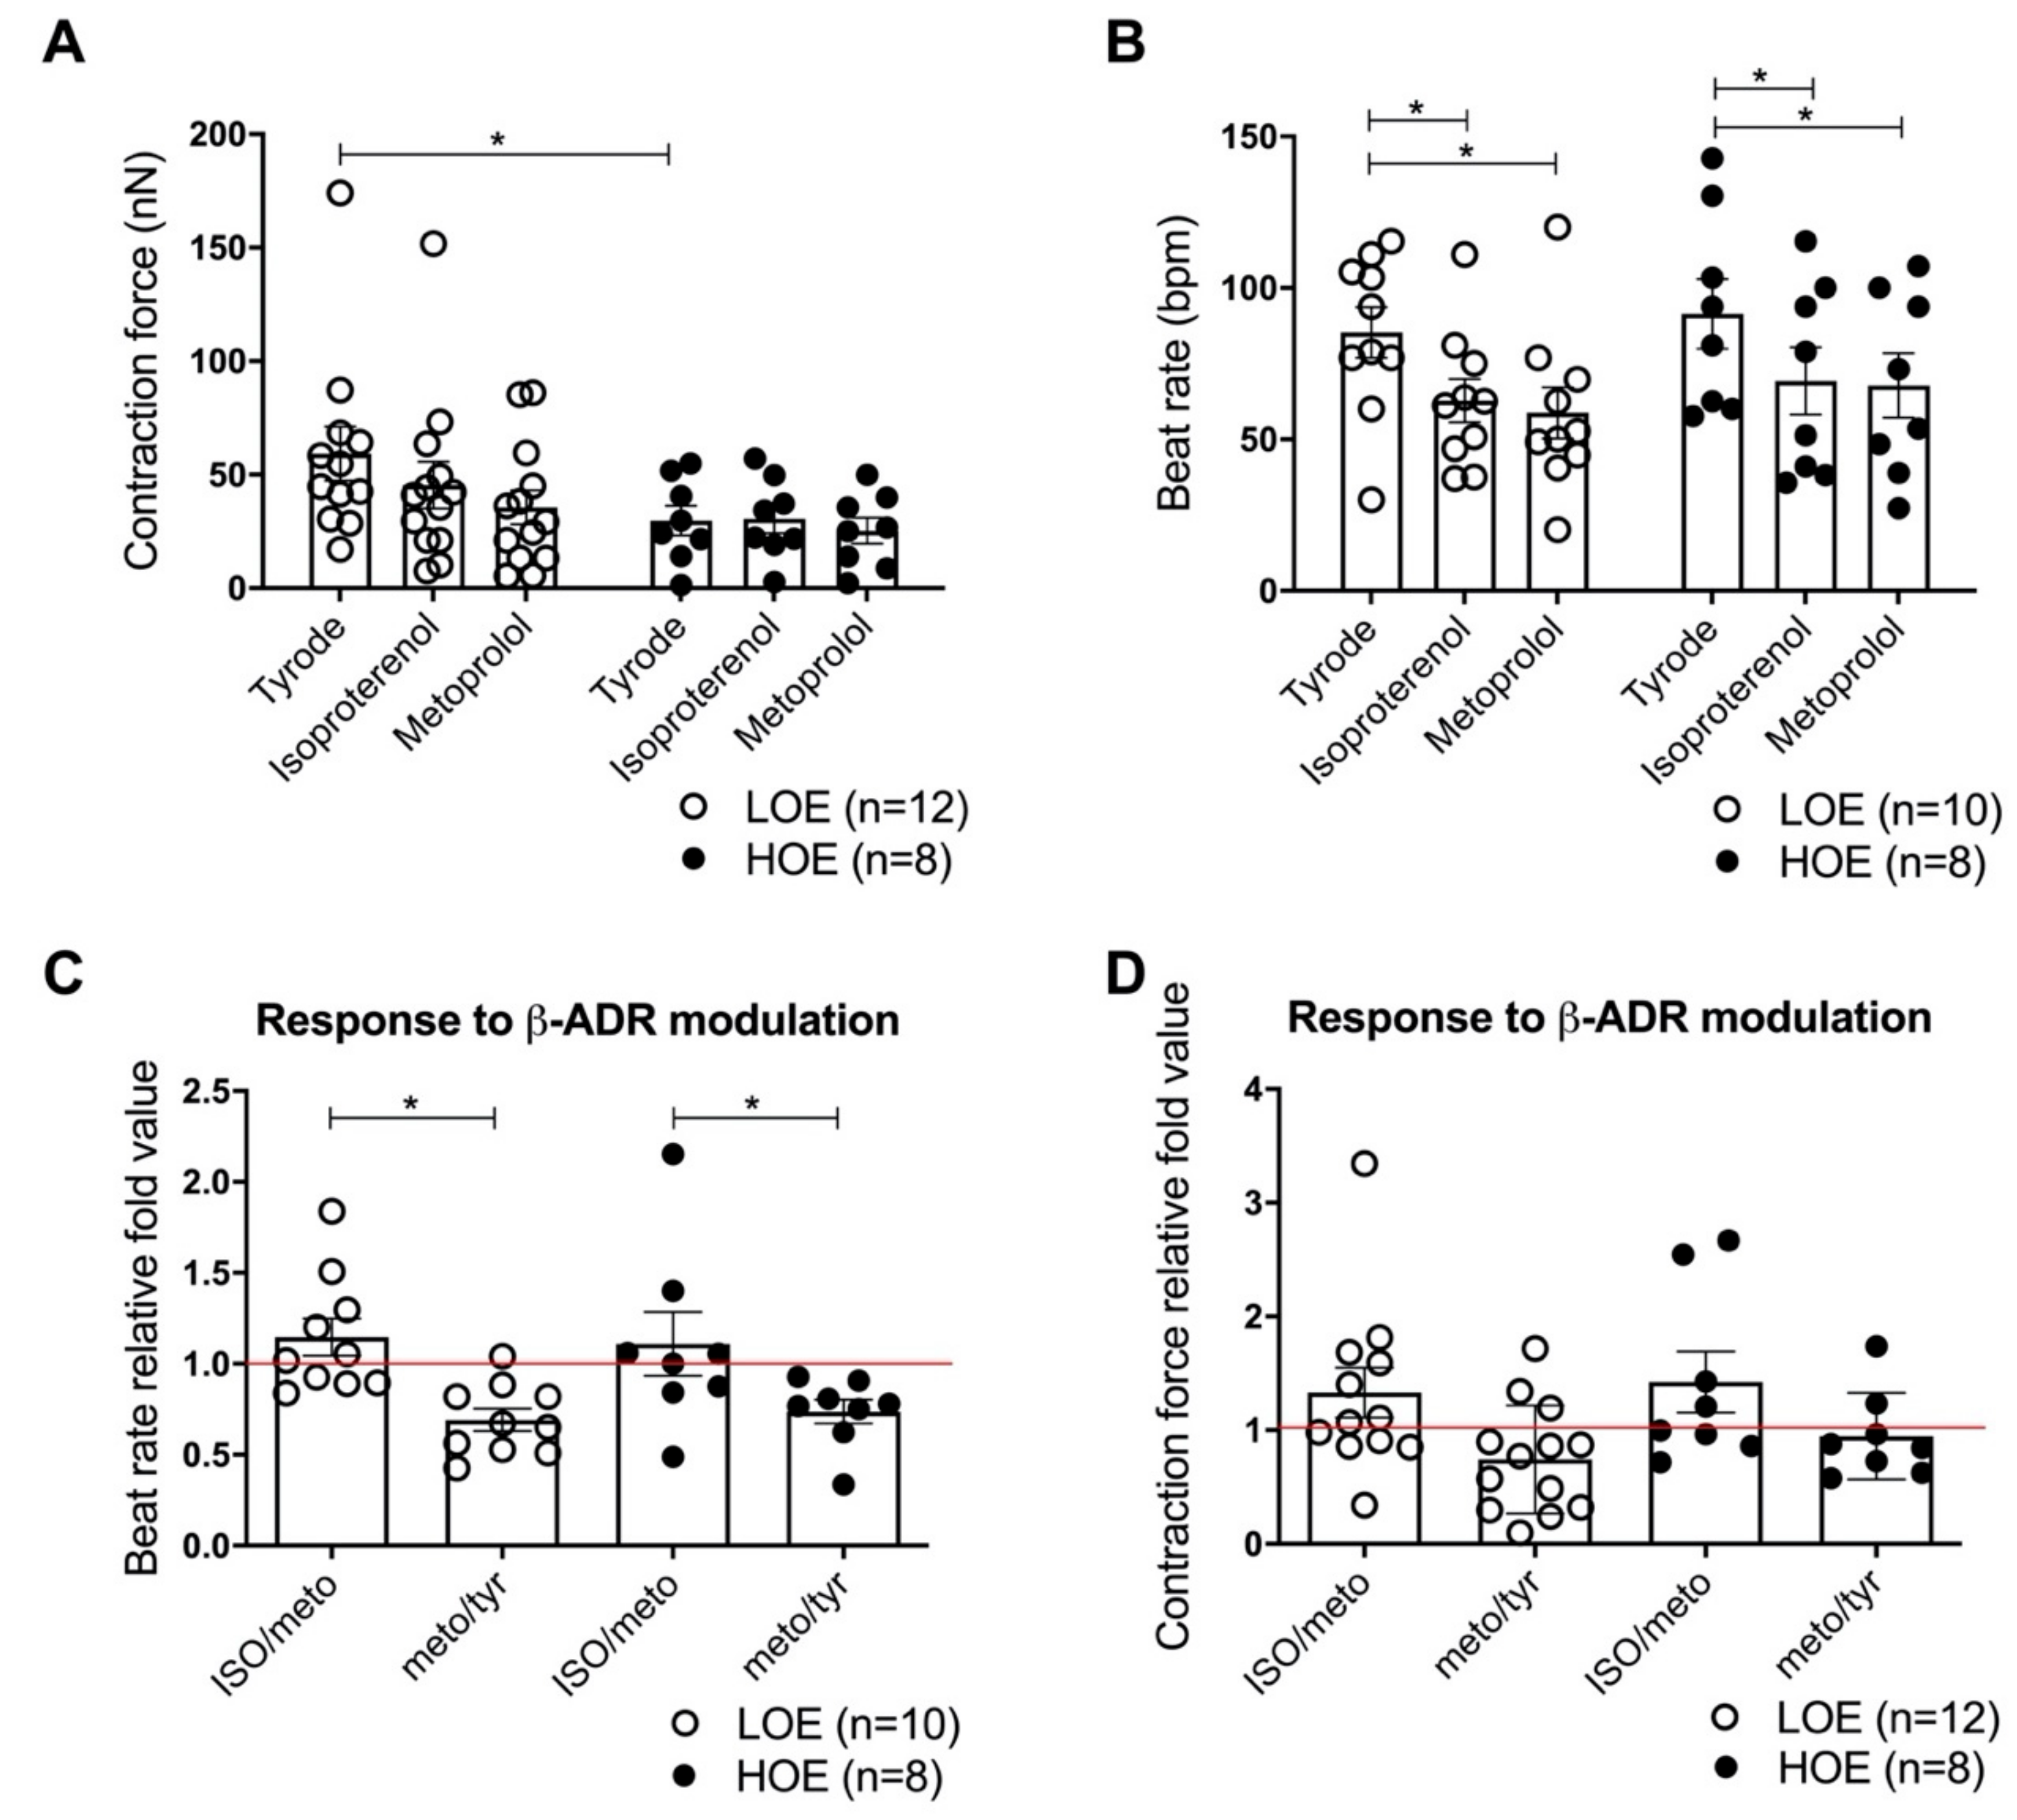
2.5. LOE Enhances the Contraction Force in 3D Cardiac Spheroids
3. Discussion
4. Material and Methods
4.1. Cell Lines
4.2. Cardiac Differentiation
4.3. qRT-PCR
4.4. Embryoid Body Dissociation
4.5. Immunocytochemistry
4.6. Measurement of Cytosolic Ca2+ Variations
4.7. Atomic Force Microscopy (AFM)
4.8. Determination of the Activity of the Respiratory Chain Complexes
4.9. Mitotracker
4.10. Measurement of Cell Areas and Sarcomere Length
4.11. Statistical Analysis
Supplementary Materials
Author Contributions
Funding
Informed Consent Statement
Acknowledgments
Conflicts of Interest
References
- Acimovic, I.; Vilotic, A.; Pesl, M.; Lacampagne, A.; Dvorak, P.; Rotrekl, V.; Meli, A.C. Human pluripotent stem cell-derived cardiomyocytes as research and therapeutic tools. BioMed Res. Int. 2014. [Google Scholar] [CrossRef] [PubMed]
- Simon, M.C.; Keith, B. The role of oxygen availability in embryonic development and stem cell function. Nat. Rev. Mol. Cell Biol. 2008, 9, 285–296. [Google Scholar] [CrossRef] [PubMed]
- Horton, R.E.; Auguste, D.T. Synergistic effects of hypoxia and extracellular matrix cues in cardiomyogenesis. Biomaterials 2012, 33, 6313–6319. [Google Scholar] [CrossRef] [PubMed]
- Leri, A.; Rota, M.; Hosoda, T.; Goichberg, P.; Anversa, P. Cardiac stem cell niches. Stem Cell Res. 2014, 13, 631–646. [Google Scholar] [CrossRef]
- Korski, K.I.; Kubli, D.A.; Wang, B.J.; Khalafalla, F.G.; Monsanto, M.M.; Firouzi, F.; Echeagaray, O.H.; Kim, T.; Adamson, R.M.; Dembitsky, W.P.; et al. Hypoxia prevents mitochondrial dysfunction and senescence in human c-kit+ cardiac progenitor cells. Stem Cells 2019, 37, 555–567. [Google Scholar] [CrossRef]
- Mummery Christine, L.; Zhang, J.; Elizabeth, S.N.; David, A.E.; Andrew, G.E.; Timothy, J.K. Differentiation of human embryonic stem cells and induced pluripotent stem cells to cardiomyocytes. Circ. Res. 2012, 111, 344–358. [Google Scholar] [CrossRef]
- Niebruegge, S.; Bauwens, C.L.; Peerani, R.; Thavandiran, N.; Masse, S.; Sevaptisidis, E.; Nanthakumar, K.; Woodhouse, K.; Husain, M.; Kumacheva, E.; et al. Generation of human embryonic stem cell-derived mesoderm and cardiac cells using size-specified aggregates in an oxygen-controlled bioreactor. Biotechnol. Bioeng. 2009, 102, 493–507. [Google Scholar] [CrossRef]
- Kudova, J.; Prochazkova, J.; Vasicek, O.; Perecko, T.; Sedlackova, M.; Pesl, M.; Pachernik, J.; Kubala, L. Hif-1alpha deficiency attenuates the cardiomyogenesis of mouse embryonic stem cells. PLoS ONE 2016, 11, e0158358. [Google Scholar] [CrossRef]
- Krishnan, J.; Ahuja, P.; Bodenmann, S.; Knapik, D.; Perriard, E.; Krek, W.; Perriard, J.-C. Essential role of developmentally activated hypoxia-inducible factor 1alpha for cardiac morphogenesis and function. Circ. Res. 2008, 103, 1139–1146. [Google Scholar] [CrossRef]
- Iyer, N.V.; Kotch, L.E.; Agani, F.; Leung, S.W.; Laughner, E.; Wenger, R.H.; Gassmann, M.; Gearhart, J.D.; Lawler, A.M.; Yu, A.Y.; et al. Cellular and developmental control of o2 homeostasis by hypoxia-inducible factor 1 alpha. Genes Dev. 1998, 12, 149–162. [Google Scholar] [CrossRef]
- Medley, T.L.; Furtado, M.; Lam, N.T.; Idrizi, R.; Williams, D.; Verma, P.J.; Costa, M.; Kaye, D.M. Effect of oxygen on cardiac differentiation in mouse ips cells: Role of hypoxia inducible factor-1 and wnt/beta-catenin signaling. PLoS ONE 2013, 8, e80280. [Google Scholar] [CrossRef] [PubMed]
- Acimovic, I.; Refaat, M.M.; Moreau, A.; Salykin, A.; Reiken, S.; Sleiman, Y.; Souidi, M.; Pribyl, J.; Kajava, A.V.; Richard, S.; et al. Post-translational modifications and diastolic calcium leak associated to the novel ryr2-d3638a mutation lead to cpvt in patient-specific hipsc-derived cardiomyocytes. J. Clin. Med. 2018, 7, 423. [Google Scholar] [CrossRef] [PubMed]
- Pesl, M.; Acimovic, I.; Pribyl, J.; Hezova, R.; Vilotic, A.; Fauconnier, J.; Vrbsky, J.; Kruzliak, P.; Skladal, P.; Kara, T.; et al. Forced aggregation and defined factors allow highly uniform-sized embryoid bodies and functional cardiomyocytes from human embryonic and induced pluripotent stem cells. Heart Vessel. 2014, 29, 834–846. [Google Scholar] [CrossRef] [PubMed]
- Dubois, N.C.; Craft, A.M.; Sharma, P.; Elliott, D.A.; Stanley, E.G.; Elefanty, A.G.; Gramolini, A.; Keller, G. Sirpa is a specific cell-surface marker for isolating cardiomyocytes derived from human pluripotent stem cells. Nat. Biotechnol. 2011, 29, 1011–1018. [Google Scholar] [CrossRef] [PubMed]
- Kattman, S.J.; Witty, A.D.; Gagliardi, M.; Dubois, N.C.; Niapour, M.; Hotta, A.; Ellis, J.; Keller, G. Stage-specific optimization of activin/nodal and bmp signaling promotes cardiac differentiation of mouse and human pluripotent stem cell lines. Cell Stem. Cell 2011, 8, 228–240. [Google Scholar] [CrossRef]
- Burridge, P.W.; Thompson, S.; Millrod, M.A.; Weinberg, S.; Yuan, X.; Peters, A.; Mahairaki, V.; Koliatsos, V.E.; Tung, L.; Zambidis, E.T. A universal system for highly efficient cardiac differentiation of human induced pluripotent stem cells that eliminates interline variability. PLoS ONE 2011, 6, e18293. [Google Scholar] [CrossRef]
- Palmer, J.W.; Tandler, B.; Hoppel, C.L. Biochemical differences between subsarcolemmal and interfibrillar mitochondria from rat cardiac muscle: Effects of procedural manipulations. Arch. Biochem. Biophys. 1985, 236, 691–702. [Google Scholar] [CrossRef]
- Chen, Y.; Amende, I.; Hampton, T.G.; Yang, Y.; Ke, Q.; Min, J.-Y.; Xiao, Y.-F.; Morgan, J.P. Vascular endothelial growth factor promotes cardiomyocyte differentiation of embryonic stem cells. Am. J. Physiol. Heart Circ. Physiol. 2006, 291, H1653–H1658. [Google Scholar] [CrossRef]
- Millauer, B.; Wizigmann-Voos, S.; Schnurch, H.; Martinez, R.; Moller, N.P.; Risau, W.; Ullrich, A. High affinity vegf binding and developmental expression suggest flk-1 as a major regulator of vasculogenesis and angiogenesis. Cell 1993, 72, 835–846. [Google Scholar] [CrossRef]
- Louzier, V.; Raffestin, B.; Leroux, A.; Branellec, D.; Caillaud, J.M.; Levame, M.; Eddahibi, S.; Adnot, S. Role of vegf-b in the lung during development of chronic hypoxic pulmonary hypertension. Am. J. Physiol. Lung Cell. Mol. Physiol. 2003, 284, L926–L937. [Google Scholar] [CrossRef]
- Bellomo, D.; John, P.H.; Ginters, U.S.; Carol, A.P.; Penny, S.T.; Gartside, M.; Mould, A.; Marian, M.C.; Ian, D.T.; Sean, M.G.; et al. Mice lacking the vascular endothelial growth factor-b gene (vegfb) have smaller hearts, dysfunctional coronary vasculature, and impaired recovery from cardiac ischemia. Circ. Res. 2000, 86, e29–e35. [Google Scholar] [CrossRef] [PubMed]
- Cameron, C.M.; Harding, F.; Hu, W.-S.; Kaufman, D.S. Activation of hypoxic response in human embryonic stem cell–derived embryoid bodies. Exp. Biol. Med. 2008, 233, 1044–1057. [Google Scholar] [CrossRef] [PubMed]
- Hu, D.; Linders, A.; Yamak, A.; Correia, C.; Kijlstra, J.D.; Garakani, A.; Xiao, L.; Milan, D.J.; van der Meer, P.; Serra, M.; et al. Metabolic maturation of human pluripotent stem cell-derived cardiomyocytes by inhibition of hif1α and ldha. Circ. Res. 2018, 123, 1066–1079. [Google Scholar] [CrossRef] [PubMed]
- Eschenhagen, T.; Mummery, C.; Knollmann, B.C. Modelling sarcomeric cardiomyopathies in the dish: From human heart samples to ipsc cardiomyocytes. Cardiovasc. Res. 2015, 105, 424–438. [Google Scholar] [CrossRef]
- Ronaldson-Bouchard, K.; Yeager, K.; Teles, D.; Chen, T.; Ma, S.; Song, L.; Morikawa, K.; Wobma, H.M.; Vasciaveo, A.; Ruiz, E.C.; et al. Engineering of human cardiac muscle electromechanically matured to an adult-like phenotype. Nat. Protoc. 2019, 14, 2781–2817. [Google Scholar] [CrossRef]
- Kim, D.H.; Lipke, E.A.; Kim, P.; Cheong, R.; Thompson, S.; Delannoy, M.; Suh, K.Y.; Tung, L.; Levchenko, A. Nanoscale cues regulate the structure and function of macroscopic cardiac tissue constructs. Proc. Natl. Acad. Sci. USA 2010, 107, 565–570. [Google Scholar] [CrossRef]
- Ribeiro, M.C.; Tertoolen, L.G.; Guadix, J.A.; Bellin, M.; Kosmidis, G.; D’Aniello, C.; Monshouwer-Kloots, J.; Goumans, M.J.; Wang, Y.L.; Feinberg, A.W.; et al. Functional maturation of human pluripotent stem cell derived cardiomyocytes in vitro--correlation between contraction force and electrophysiology. Biomaterials 2015, 51, 138–150. [Google Scholar] [CrossRef]
- Parikh, S.S.; Blackwell, D.J.; Gomez-Hurtado, N.; Frisk, M.; Wang, L.; Kim, K.; Dahl, C.P.; Fiane, A.; Tonnessen, T.; Kryshtal, D.O.; et al. Thyroid and glucocorticoid hormones promote functional t-tubule development in human-induced pluripotent stem cell-derived cardiomyocytes. Circ. Res. 2017, 121, 1323–1330. [Google Scholar] [CrossRef]
- Jeziorowska, D.; Fontaine, V.; Jouve, C.; Villard, E.; Dussaud, S.; Akbar, D.; Letang, V.; Cervello, P.; Itier, J.-M.; Pruniaux, M.-P.; et al. Differential sarcomere and electrophysiological maturation of human ipsc-derived cardiac myocytes in monolayer vs. Aggregation-based differentiation protocols. Int. J. Mol. Sci. 2017, 18, 1173. [Google Scholar] [CrossRef]
- Bedada, F.B.; Chan, S.S.K.; Metzger, S.K.; Zhang, L.; Zhang, J.; Garry, D.J.; Kamp, T.J.; Kyba, M.; Metzger, J.M. Acquisition of a quantitative, stoichiometrically conserved ratiometric marker of maturation status in stem cell-derived cardiac myocytes. Stem. Cell Rep. 2014, 3, 594–605. [Google Scholar] [CrossRef]
- Qu, C.; Puttonen, K.A.; Lindeberg, H.; Ruponen, M.; Hovatta, O.; Koistinaho, J.; Lammi, M.J. Chondrogenic differentiation of human pluripotent stem cells in chondrocyte co-culture. Int. J. Biochem. Cell Biol. 2013, 45, 1802–1812. [Google Scholar] [CrossRef] [PubMed]
- Pesl, M.; Pribyl, J.; Acimovic, I.; Vilotic, A.; Jelinkova, S.; Salykin, A.; Lacampagne, A.; Dvorak, P.; Meli, A.C.; Skladal, P.; et al. Atomic force microscopy combined with human pluripotent stem cell derived cardiomyocytes for biomechanical sensing. Biosens. Bioelectron. 2016, 85, 751–757. [Google Scholar] [CrossRef] [PubMed]
- Pribyl, J.; Pešl, M.; Caluori, G.; Acimovic, I.; Jelinkova, S.; Dvorak, P.; Skladal, P.; Rotrekl, V. Biomechanical characterization of human pluripotent stem cell-derived cardiomyocytes by use of atomic force microscopy. In Atomic Force Microscopy: Methods and Protocols; Santos, N.C., Carvalho, F.A., Eds.; Springer: New York, NY, USA, 2019; pp. 343–353. [Google Scholar]
- Sleiman, Y.; Souidi, M.; Kumar, R.; Yang, E.; Jaffré, F.; Zhou, T.; Bernardin, A.; Reiken, S.; Cazorla, O.; Kajava, A.V.; et al. Modeling polymorphic ventricular tachycardia at rest using patient-specific induced pluripotent stem cell-derived cardiomyocytes. EBioMedicine 2020, 60, 103024. [Google Scholar] [CrossRef] [PubMed]
- Jelinkova, S.; Vilotic, A.; Pribyl, J.; Aimond, F.; Salykin, A.; Acimovic, I.; Pesl, M.; Caluori, G.; Klimovic, S.; Urban, T.; et al. Dmd pluripotent stem cell derived cardiac cells recapitulate in vitro human cardiac pathophysiology. Front. Bioeng. Biotechnol. 2020, 8, 535. [Google Scholar] [CrossRef]


Publisher’s Note: MDPI stays neutral with regard to jurisdictional claims in published maps and institutional affiliations. |
© 2021 by the authors. Licensee MDPI, Basel, Switzerland. This article is an open access article distributed under the terms and conditions of the Creative Commons Attribution (CC BY) license (http://creativecommons.org/licenses/by/4.0/).
Share and Cite
Souidi, M.; Sleiman, Y.; Acimovic, I.; Pribyl, J.; Charrabi, A.; Baecker, V.; Scheuermann, V.; Pesl, M.; Jelinkova, S.; Skladal, P.; et al. Oxygen Is an Ambivalent Factor for the Differentiation of Human Pluripotent Stem Cells in Cardiac 2D Monolayer and 3D Cardiac Spheroids. Int. J. Mol. Sci. 2021, 22, 662. https://doi.org/10.3390/ijms22020662
Souidi M, Sleiman Y, Acimovic I, Pribyl J, Charrabi A, Baecker V, Scheuermann V, Pesl M, Jelinkova S, Skladal P, et al. Oxygen Is an Ambivalent Factor for the Differentiation of Human Pluripotent Stem Cells in Cardiac 2D Monolayer and 3D Cardiac Spheroids. International Journal of Molecular Sciences. 2021; 22(2):662. https://doi.org/10.3390/ijms22020662
Chicago/Turabian StyleSouidi, Monia, Yvonne Sleiman, Ivana Acimovic, Jan Pribyl, Azzouz Charrabi, Volker Baecker, Valerie Scheuermann, Martin Pesl, Sarka Jelinkova, Petr Skladal, and et al. 2021. "Oxygen Is an Ambivalent Factor for the Differentiation of Human Pluripotent Stem Cells in Cardiac 2D Monolayer and 3D Cardiac Spheroids" International Journal of Molecular Sciences 22, no. 2: 662. https://doi.org/10.3390/ijms22020662
APA StyleSouidi, M., Sleiman, Y., Acimovic, I., Pribyl, J., Charrabi, A., Baecker, V., Scheuermann, V., Pesl, M., Jelinkova, S., Skladal, P., Dvorak, P., Lacampagne, A., Rotrekl, V., & Meli, A. C. (2021). Oxygen Is an Ambivalent Factor for the Differentiation of Human Pluripotent Stem Cells in Cardiac 2D Monolayer and 3D Cardiac Spheroids. International Journal of Molecular Sciences, 22(2), 662. https://doi.org/10.3390/ijms22020662