MALDI TOF Mass Spectrometry Imaging of Blood Smear: Method Development and Evaluation

 ,
,  ,
,
Abstract
:1. Introduction
2. Results
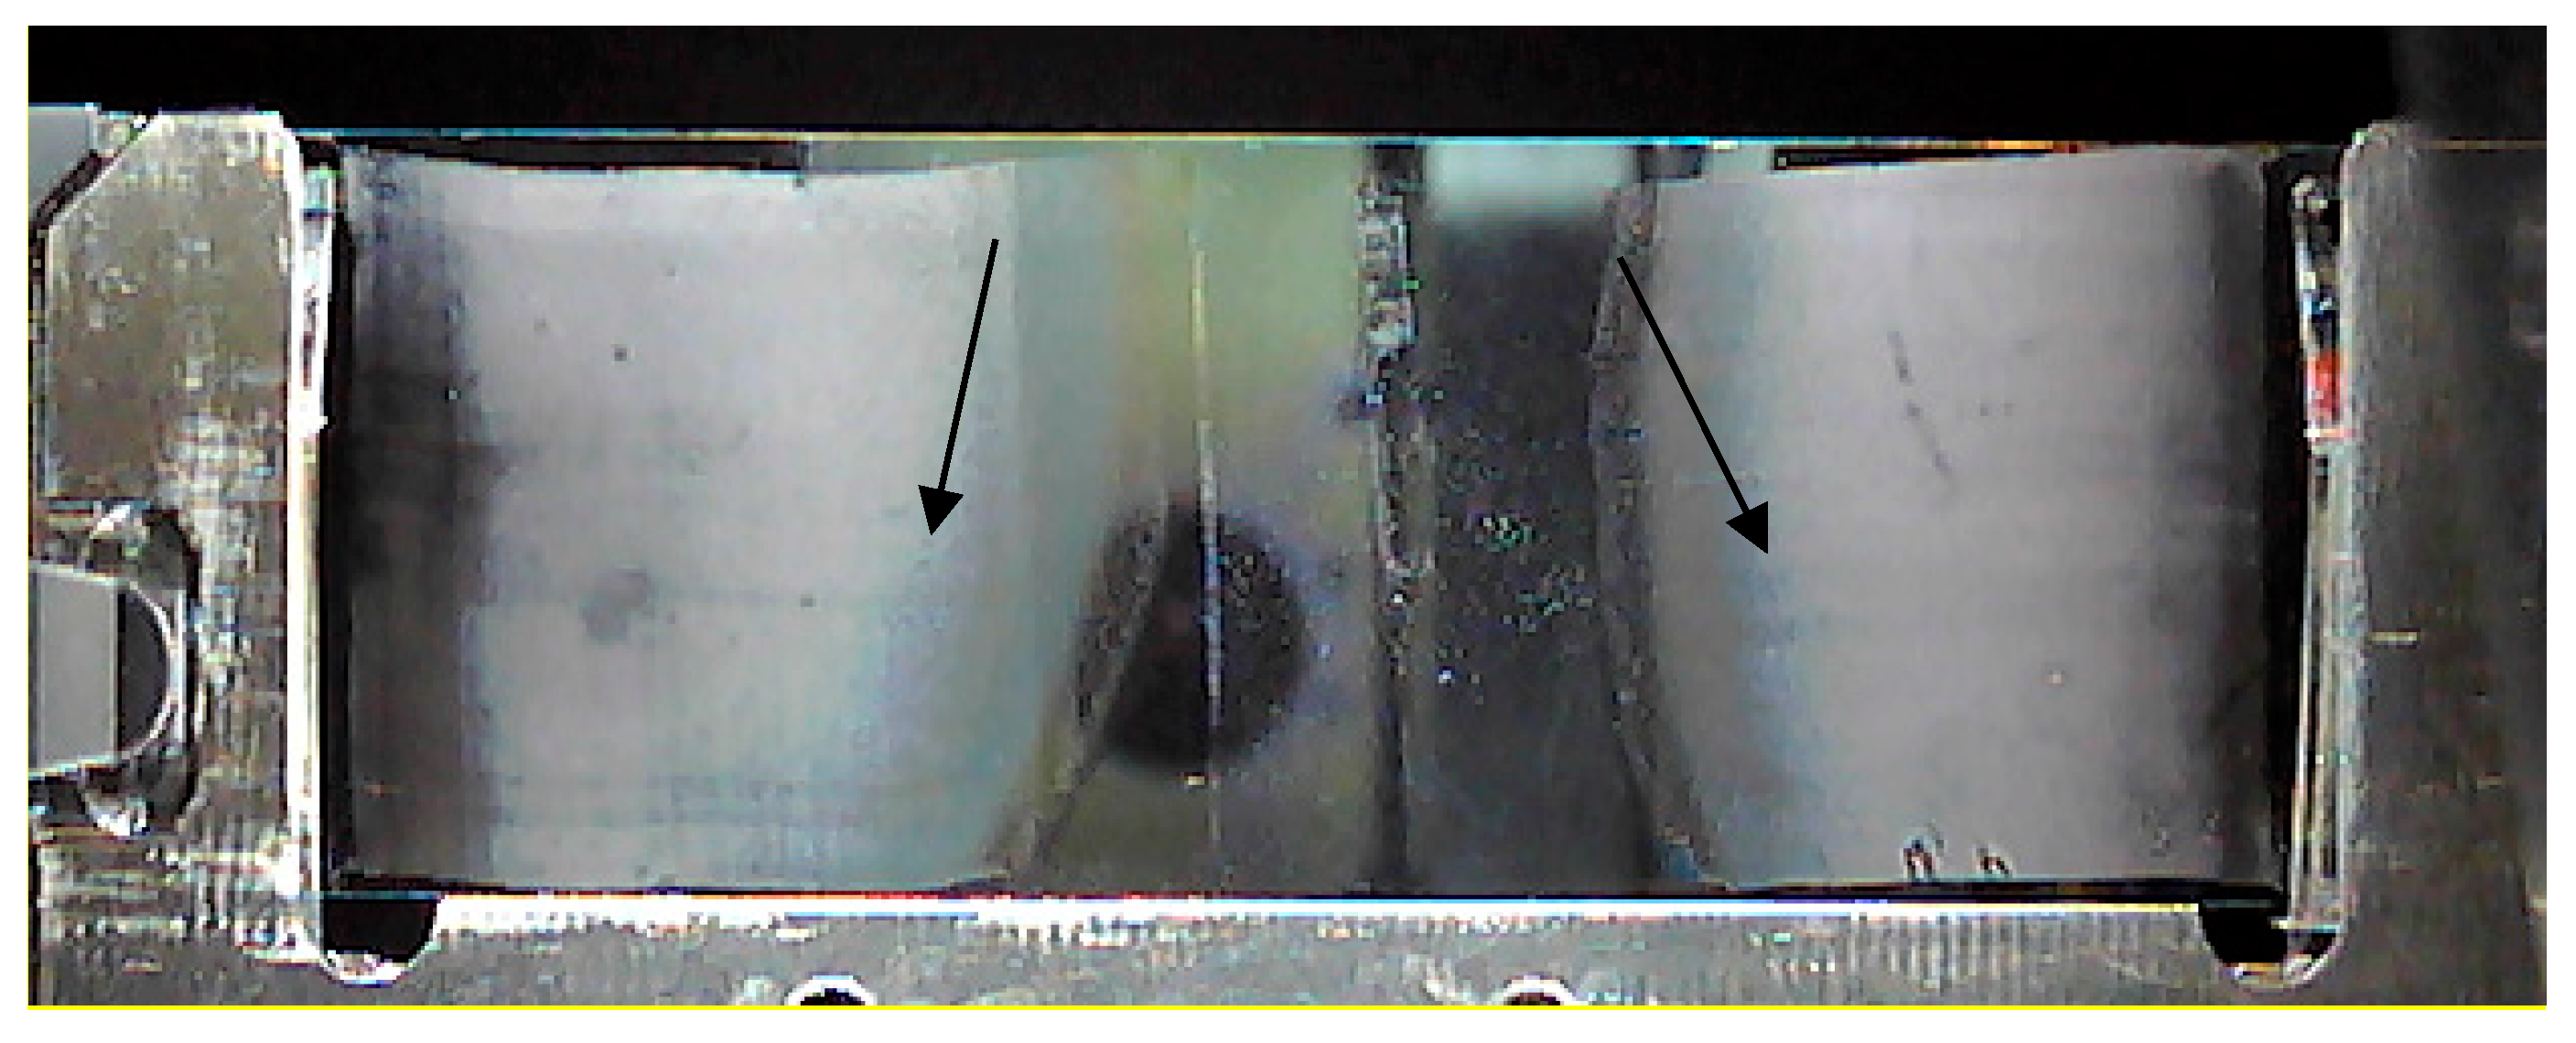
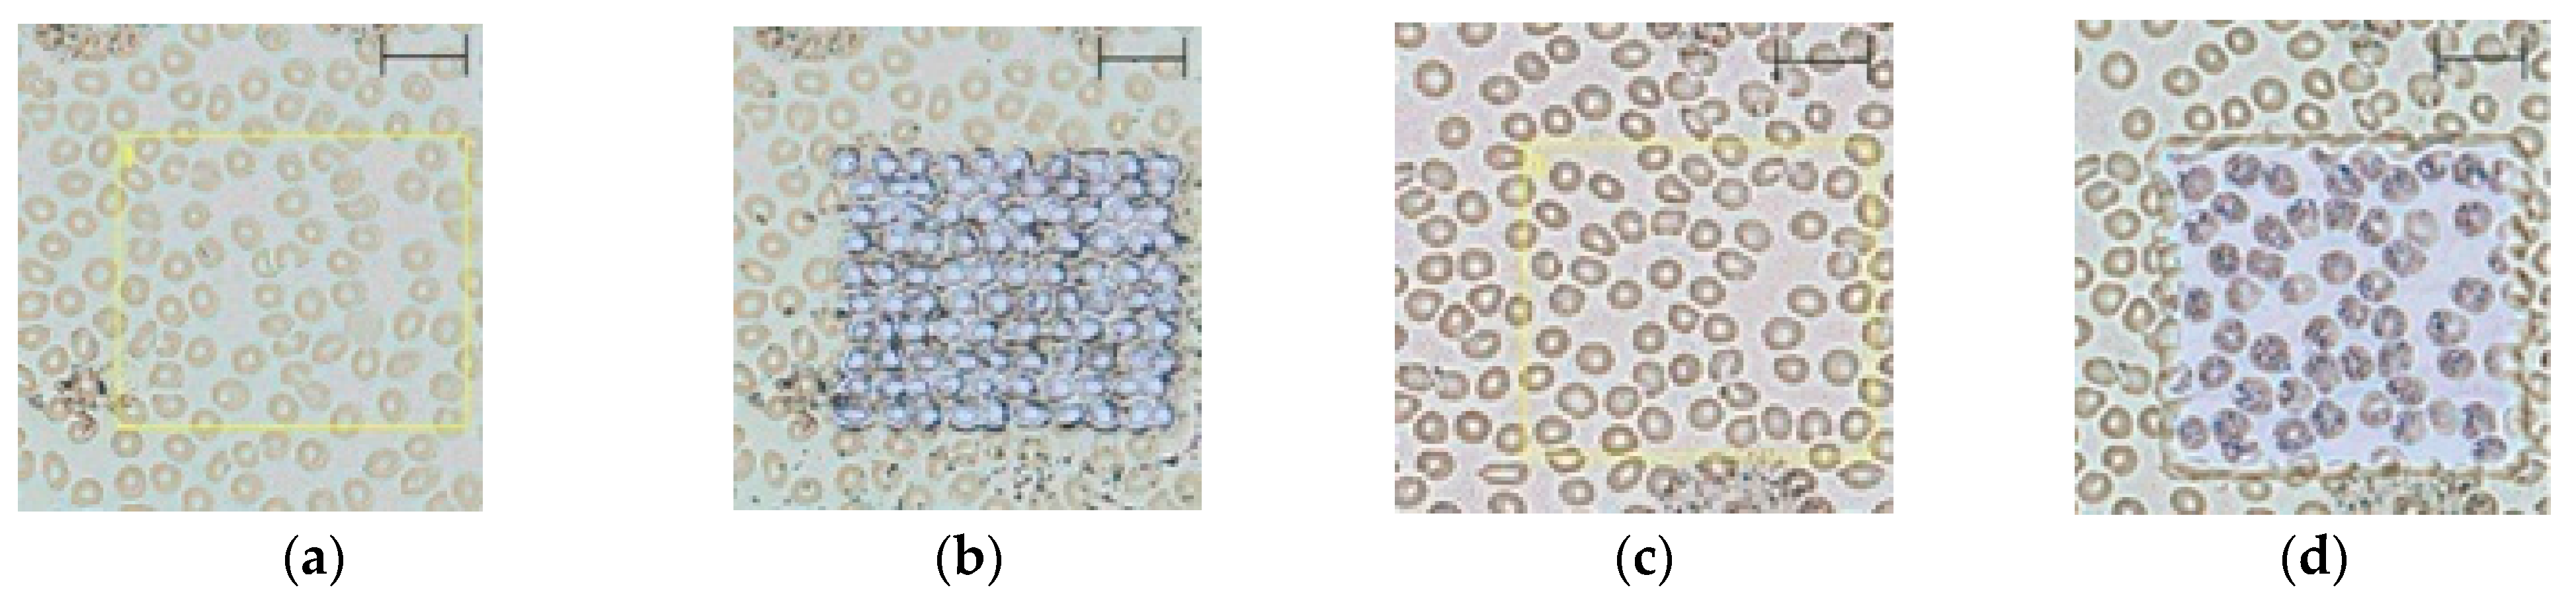
2.1. Method Development
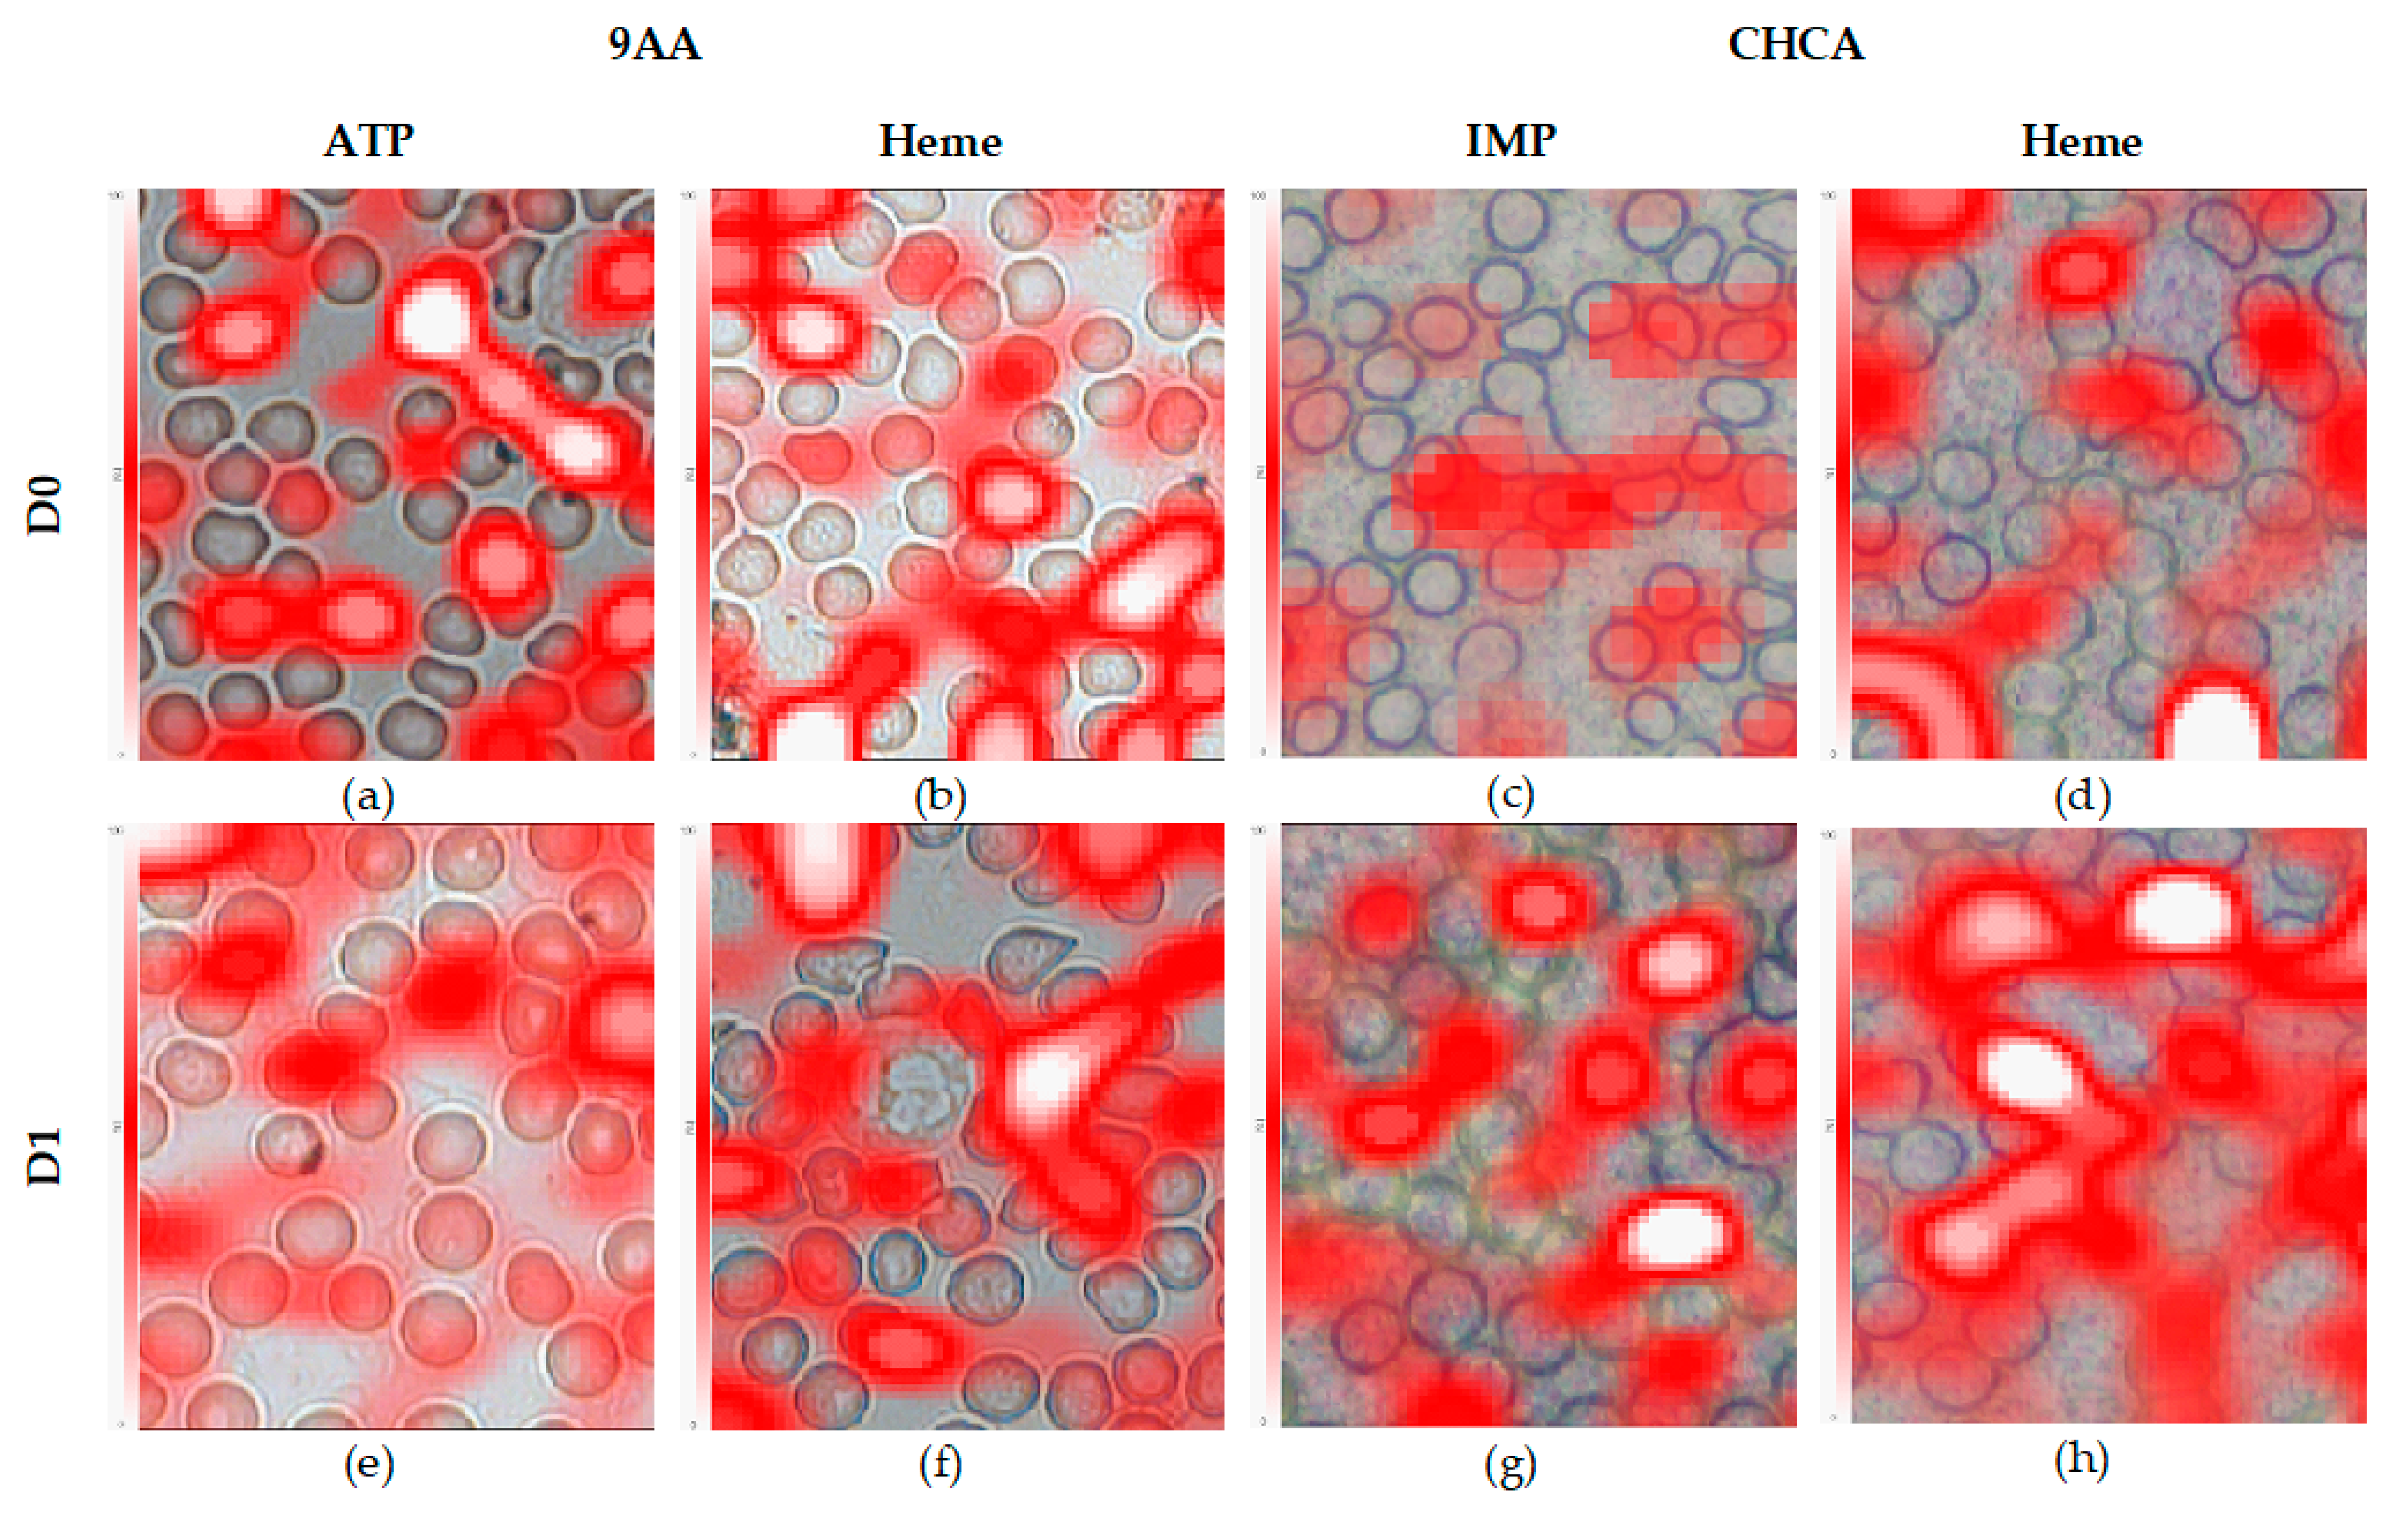
- D0: 80 nJ LASER energy (LASER intensity of 12% and 100 Hz frequency), x and y pitch sizes of 8 and 7 µm, and 50 LASER shots per pixel were predefined;
- D1: 95 nJ LASER energy (LASER intensity of 14% and 40 Hz frequency), x and y pitch sizes of 8 and 6 µm, and 30 LASER shots per pixel were predefined.
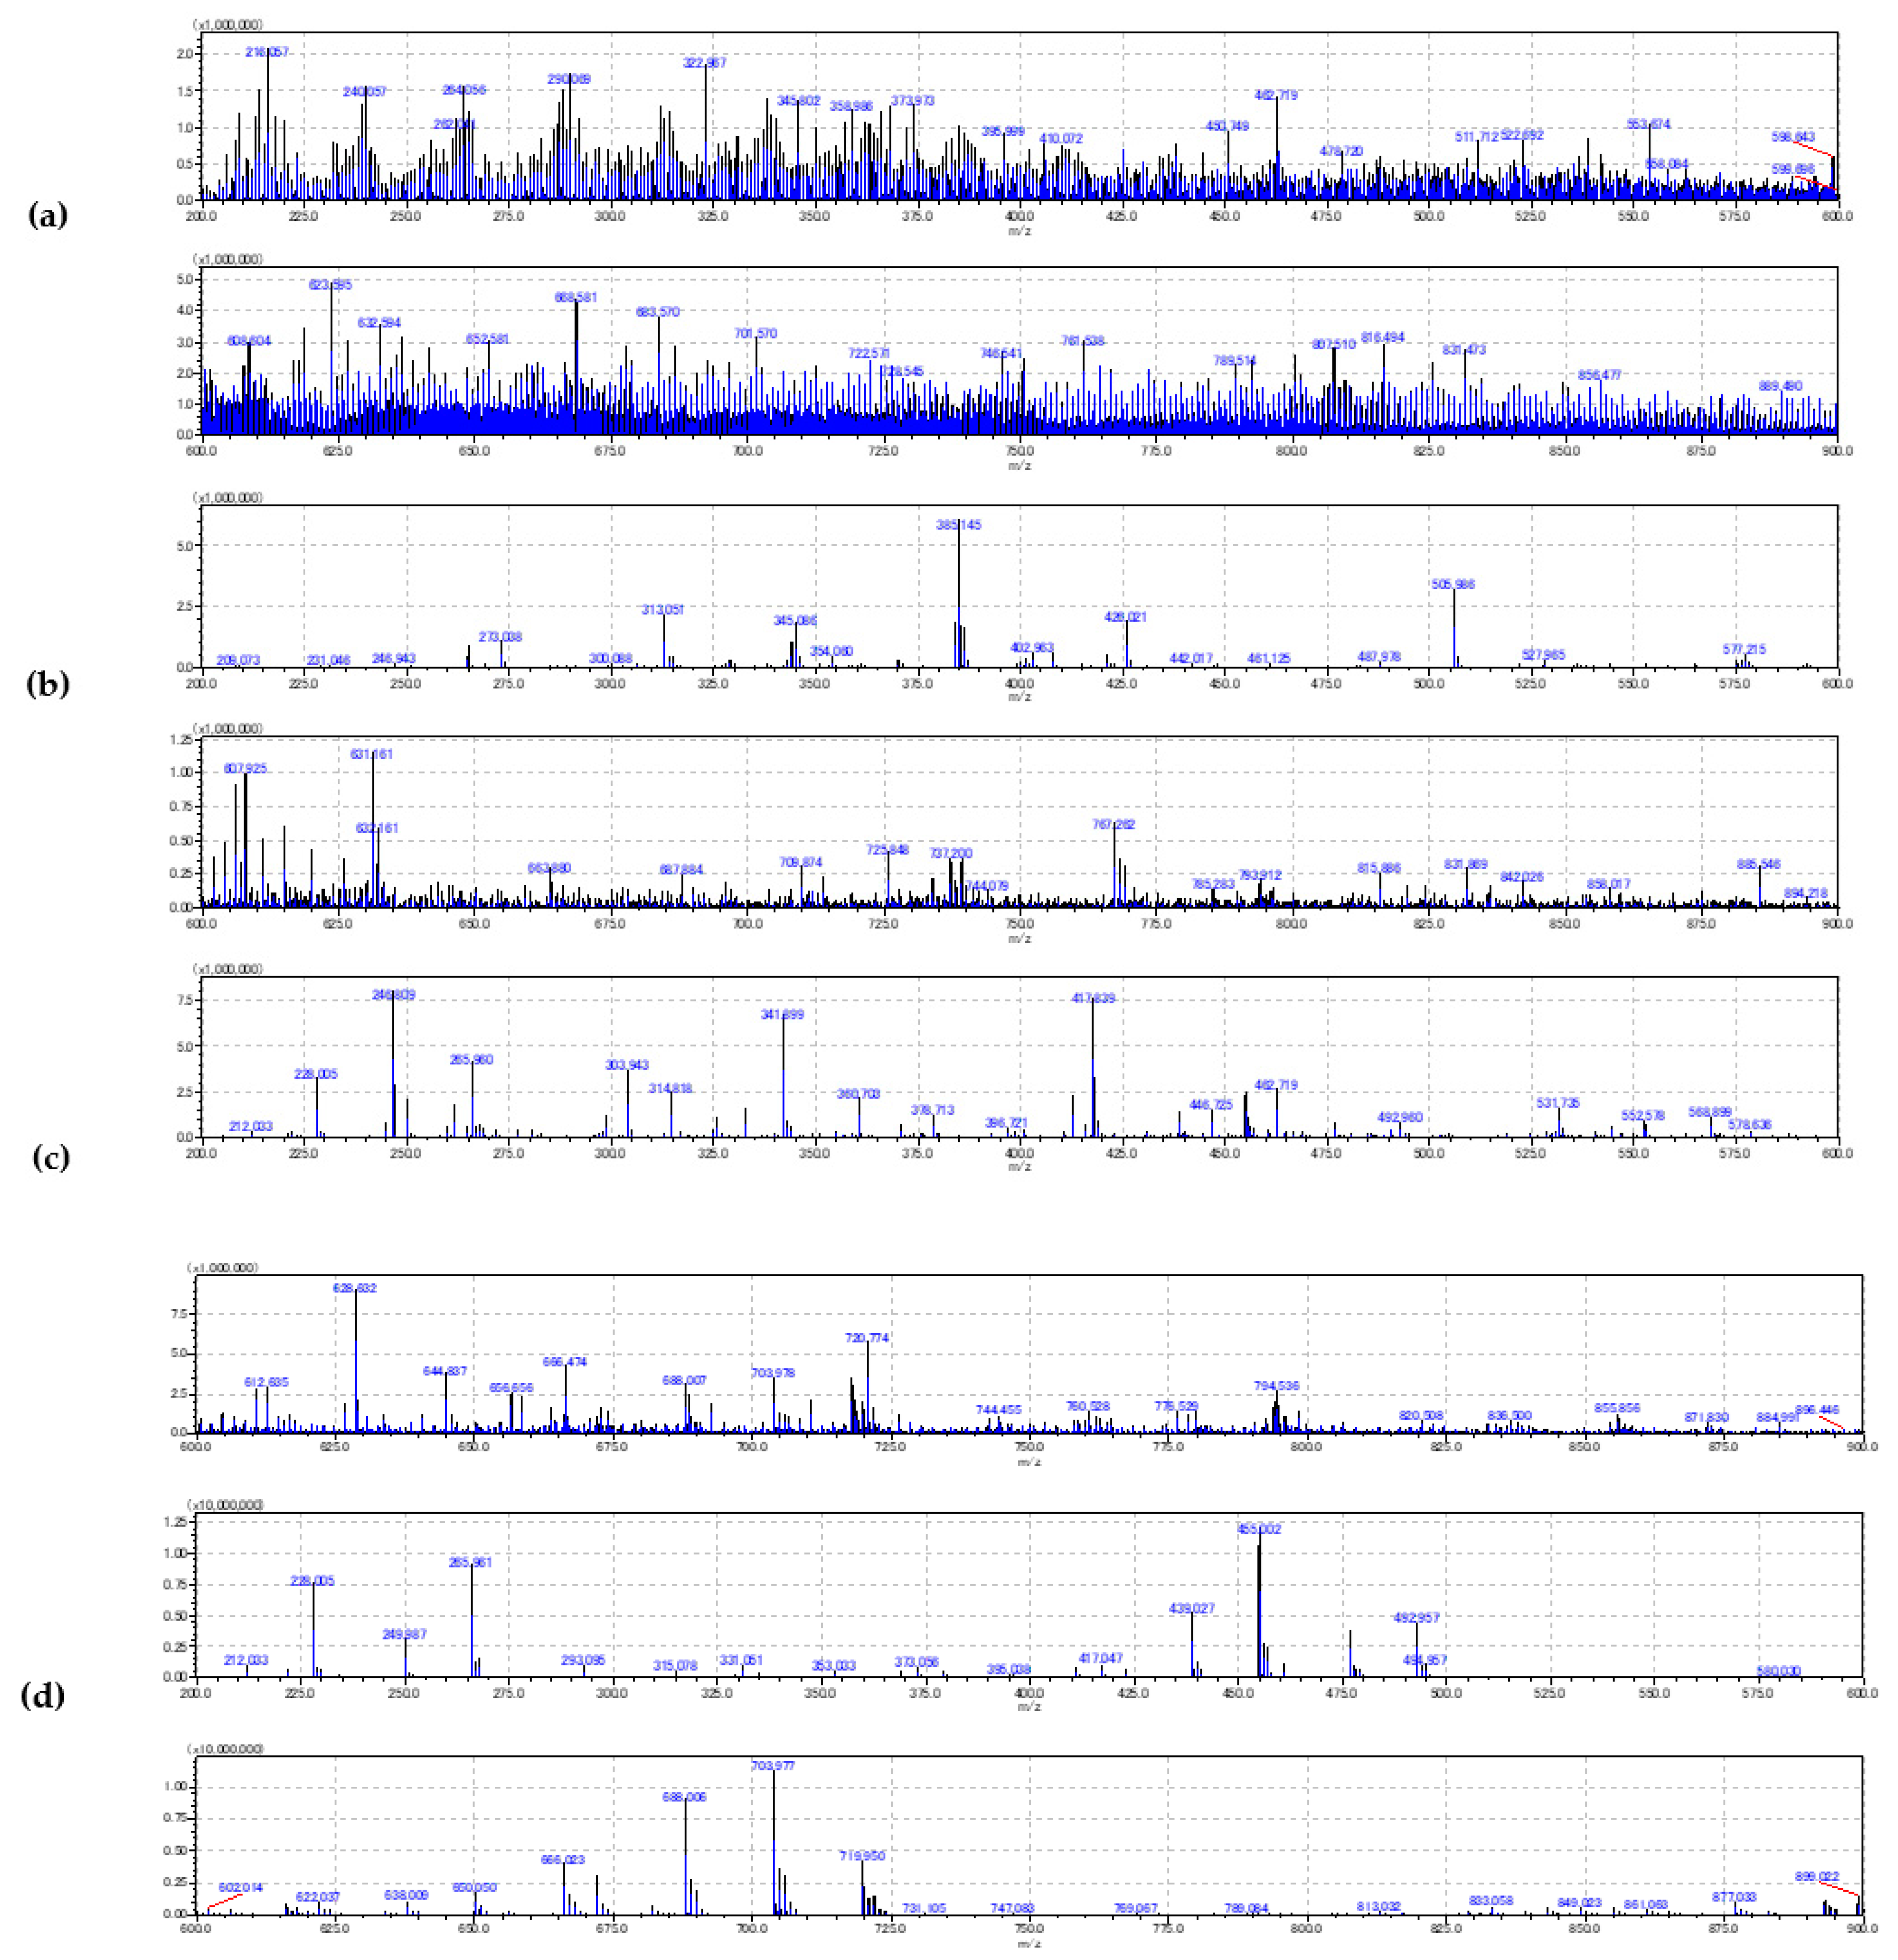
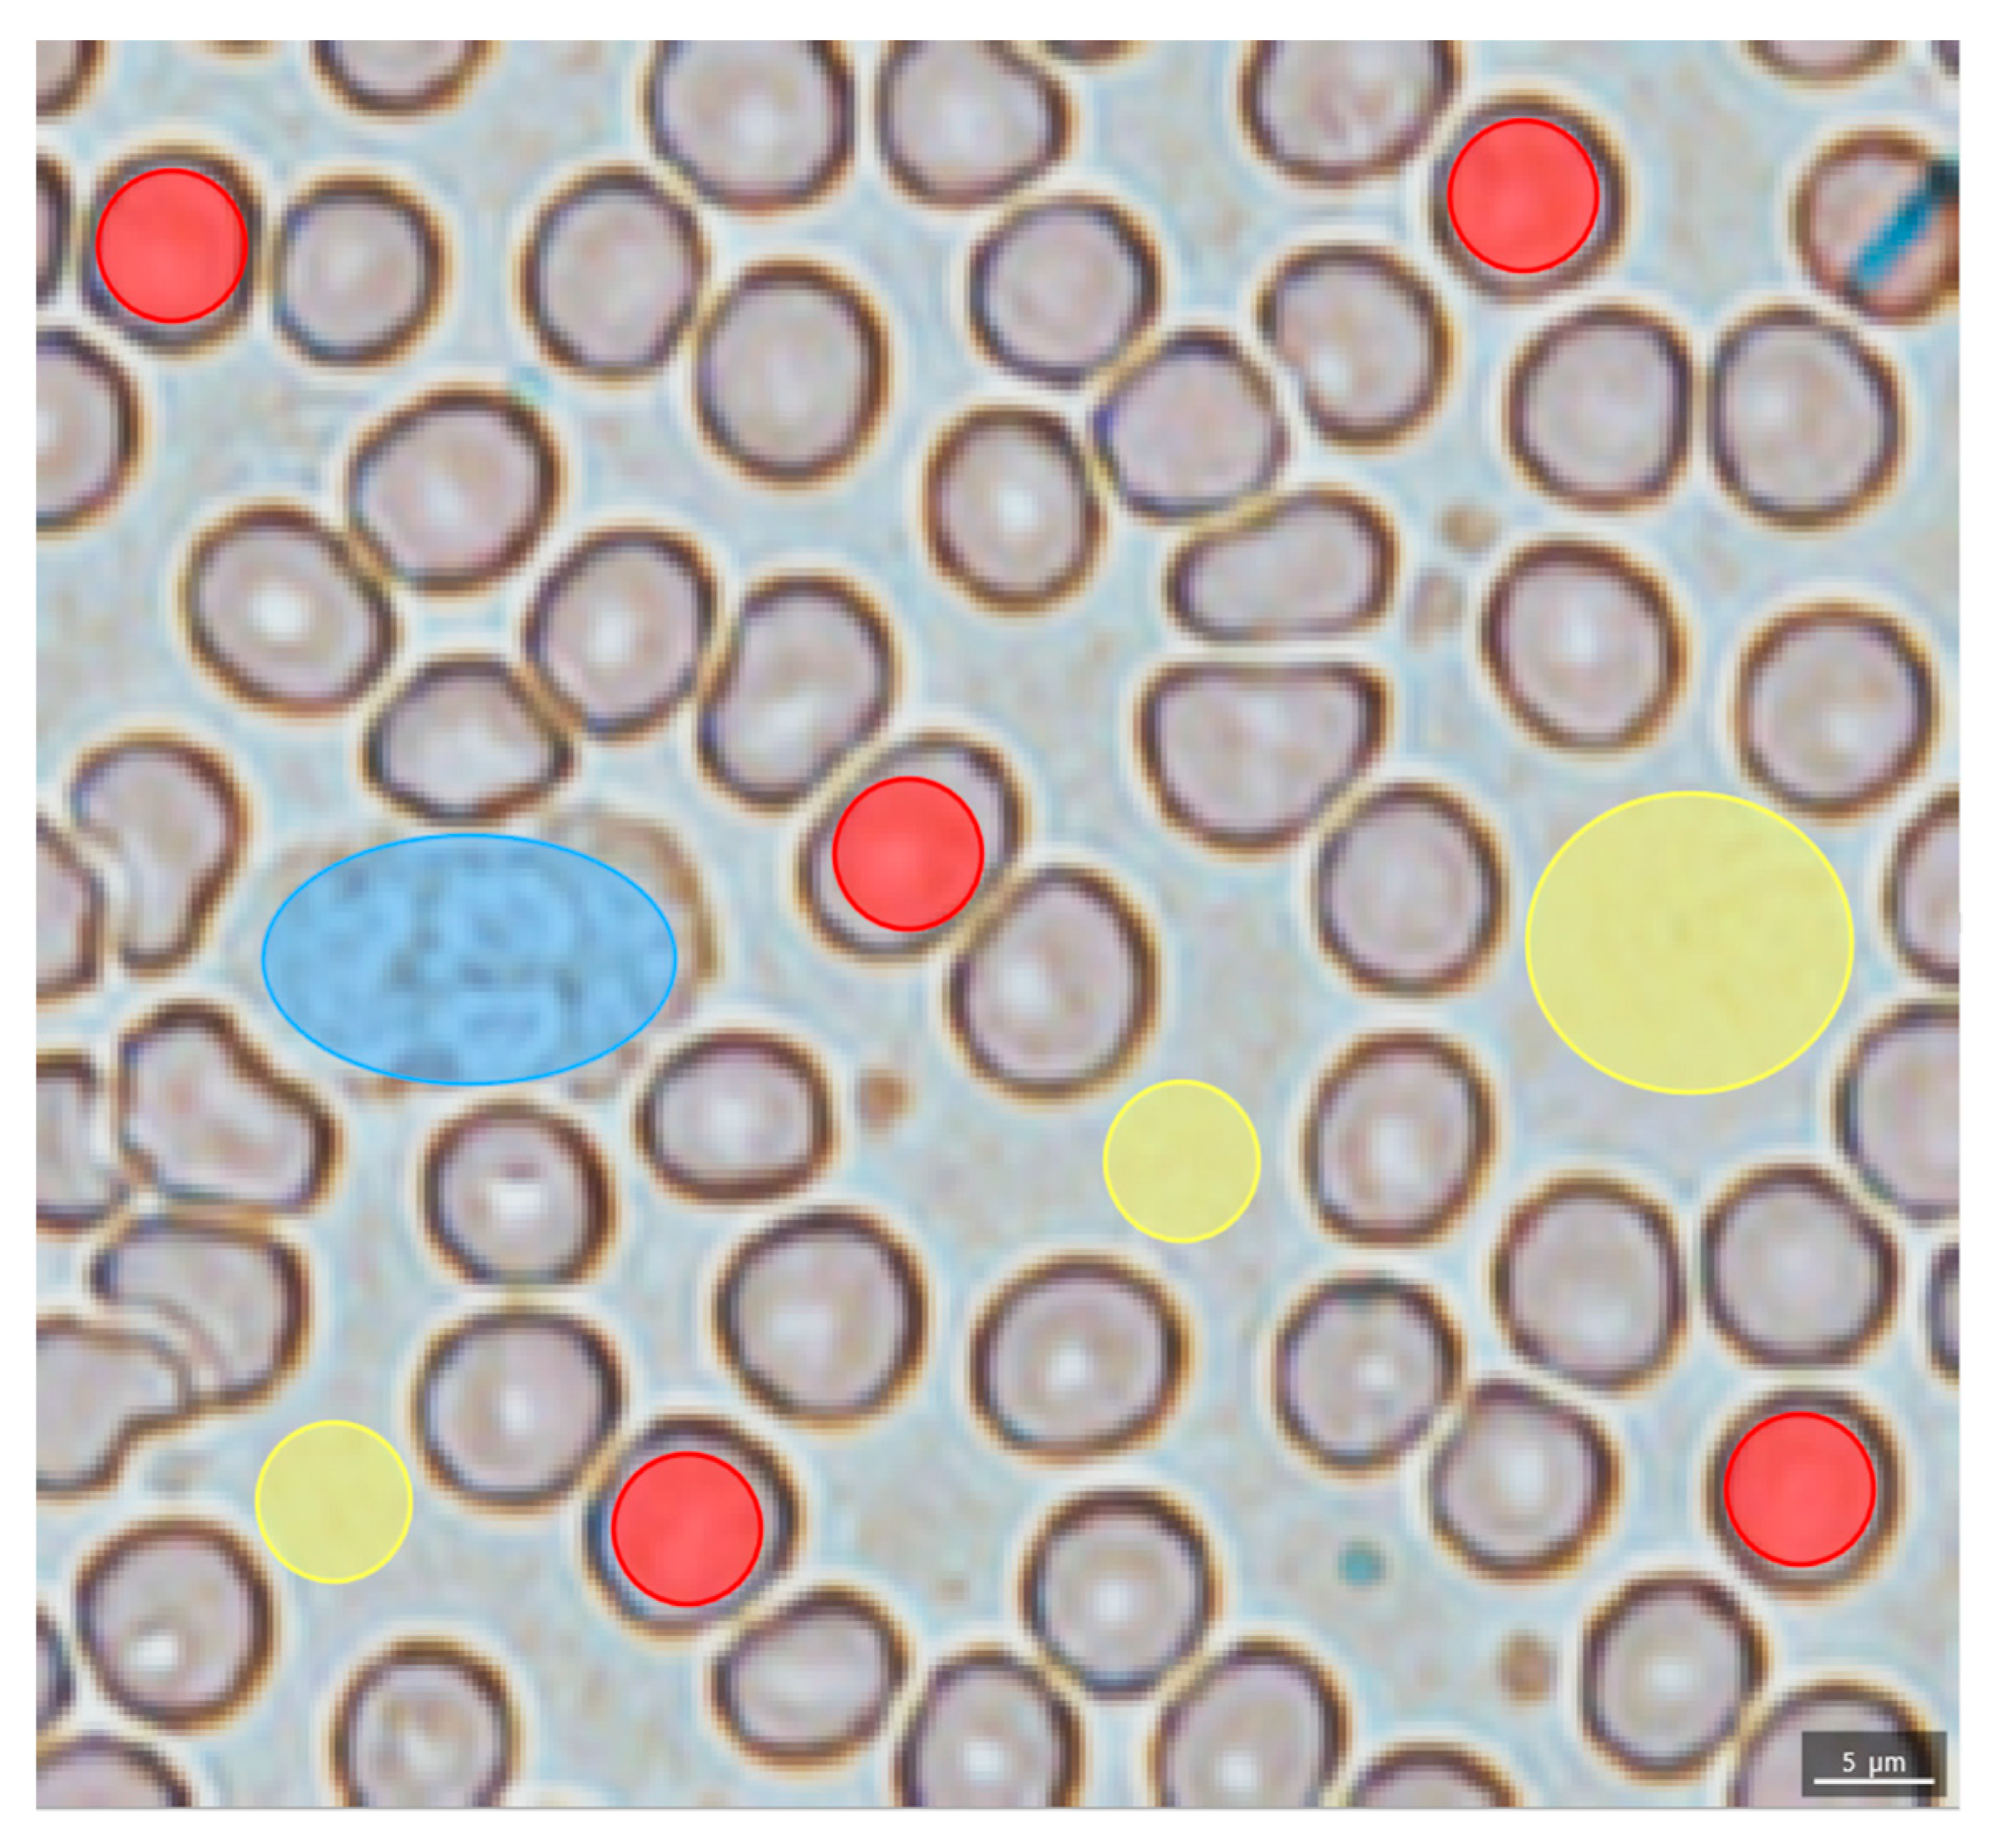
2.2. Evaluation of the Blood Smear MSI
3. Discussion
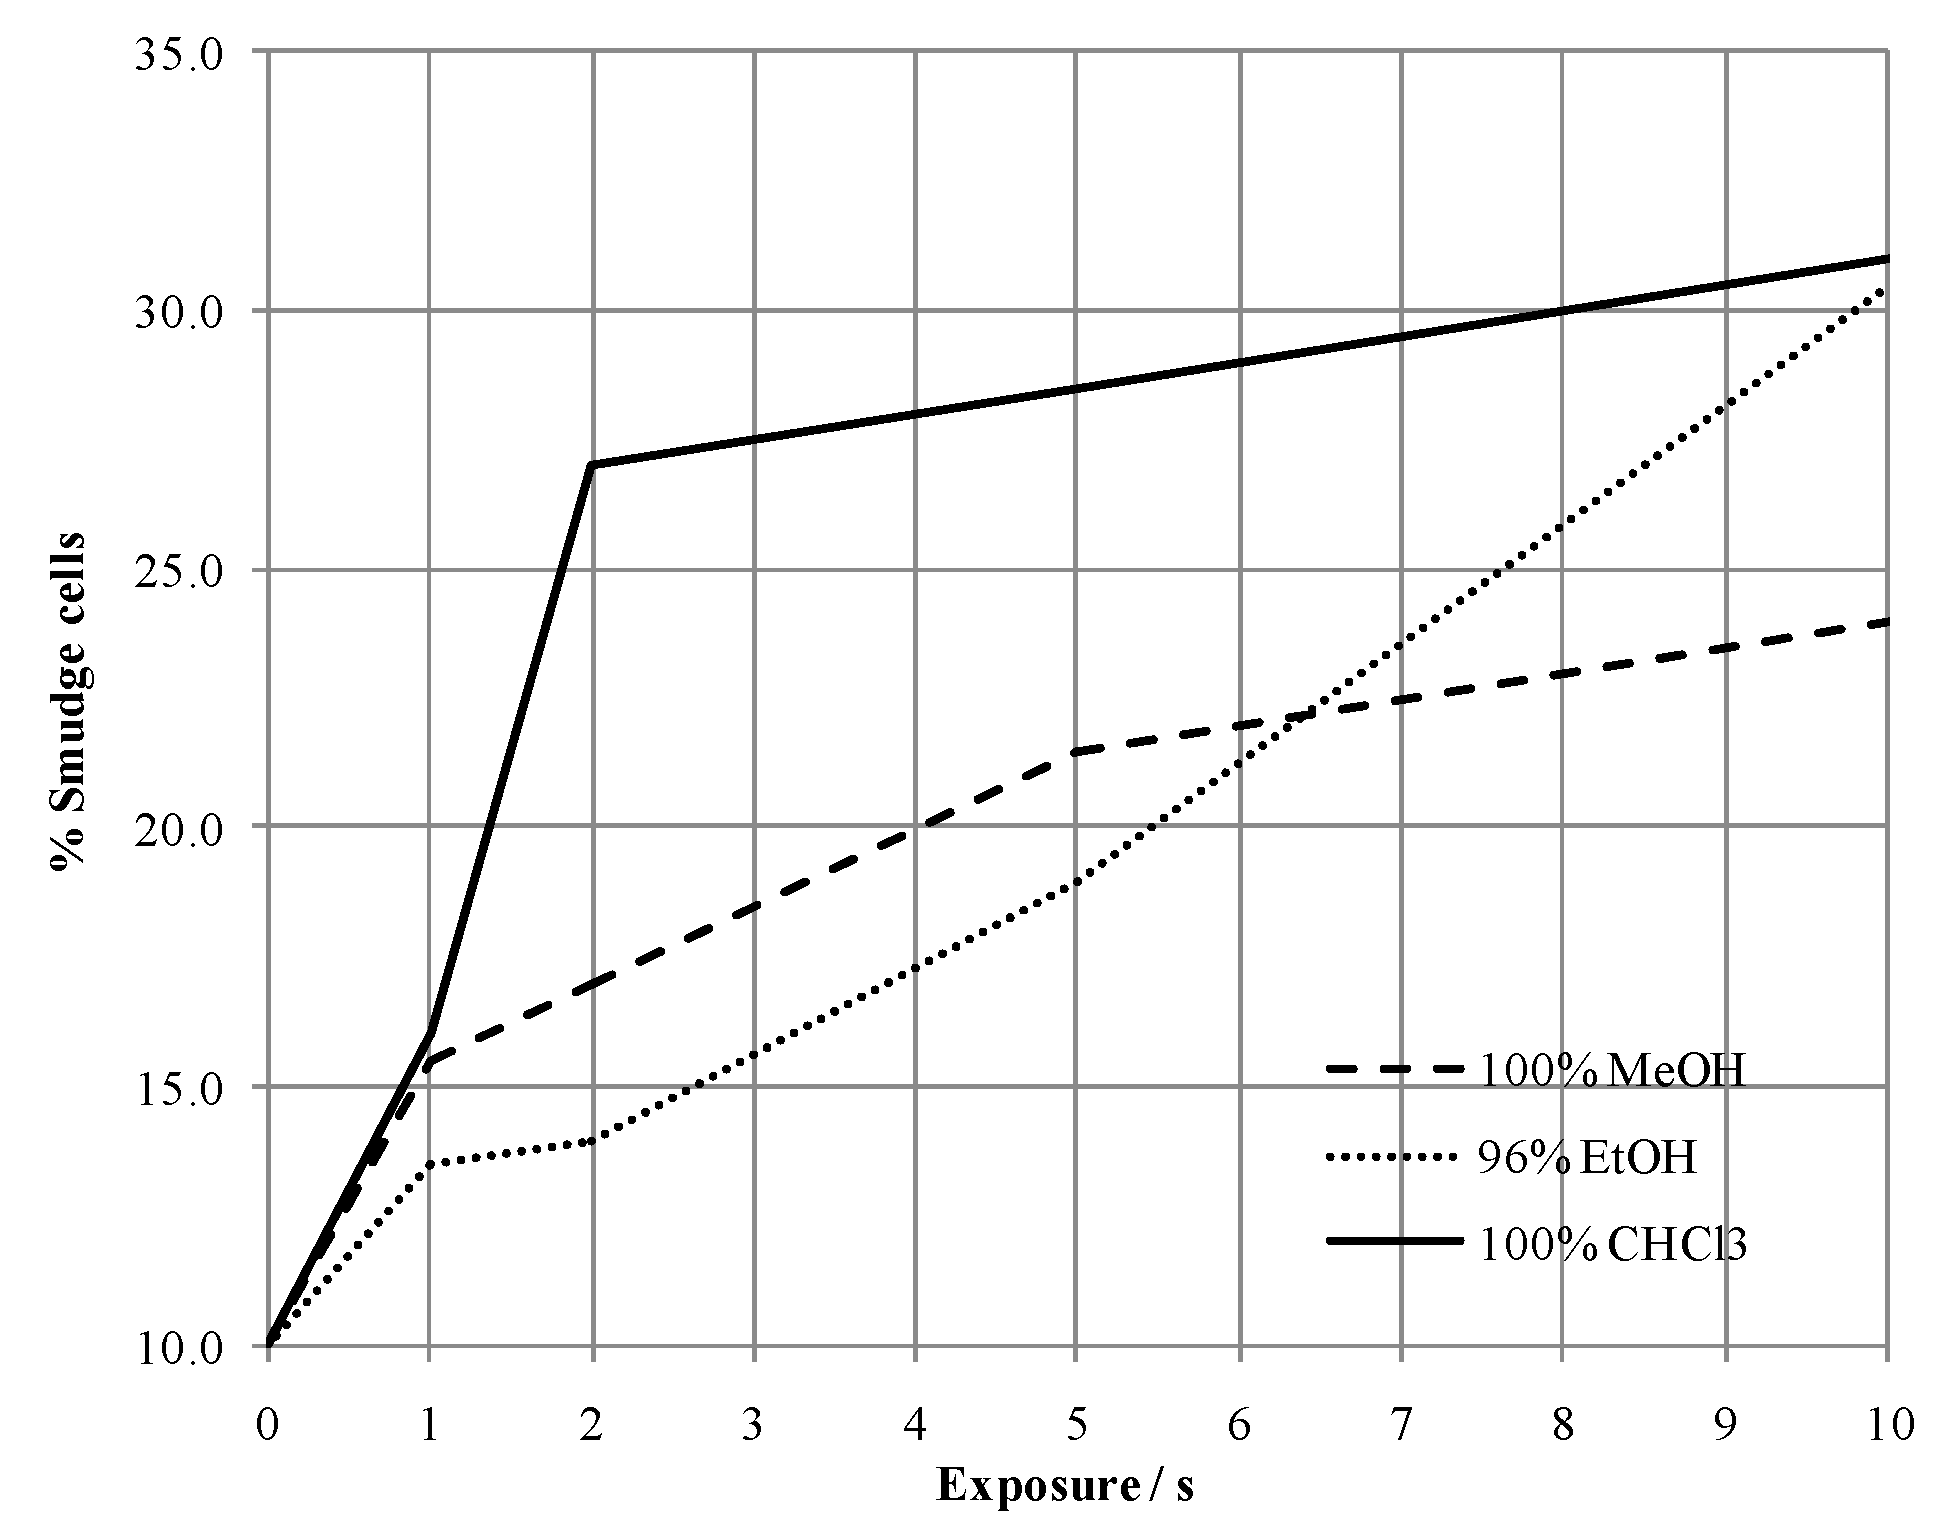
3.1. Sample Preparation and Instrumental Settings
3.2. Human Metabolome Database Search
4. Materials and Methods
4.1. Human Subjects
4.2. Sample Preparation
4.3. Instrumental Settings
4.4. Data Analysis
5. Conclusions
Supplementary Materials
Author Contributions
Funding
Institutional Review Board Statement
Informed Consent Statement
Data Availability Statement
Acknowledgments
Conflicts of Interest
Abbreviations
| 9AA | 9-aminoacridine |
| ATP | Adenosine triphosphate |
| CHCA | A-cyano-4-hydroxycinnamic acid |
| EDTA | Ethylenediaminetetraacetic acid |
| HMDB | Human metabolome database |
| IMP | Inosine monophosphate |
| IT | Ion trap |
| ITO | Indium tin oxide |
| KEGG | Kyoto Encyclopedia of Genes and Genomes |
| MALDI | Matrix assisted LASER desorption ionization |
| LC-MS/MS | Liquid chromatography coupled to tandem mass spectrometry |
| MSI | Mass spectrometry imaging |
| RBC | Red blood cells |
| ROI | Region of interest |
| SIMS | Secondary ion mass spectrometry |
| TIC | Total ion count |
| TOF | Time-of-flight |
| WBC | White blood cells |
References
- McKenzie, S.B.; Williams, L. Clinical Laboratory Hematology, 3rd ed.; Pearson: Upper Saddle River, NJ, USA, 2015; Available online: https://www.pearson.com/us/higher-education/program/Mc-Kenzie-Clinical-Laboratory-Hematology-3rd-Edition/PGM229351.html (accessed on 29 July 2020).
- Bonomini, M.; Pandolfi, A.; Sirolli, V.; Arduini, A.; Liberato, L.D.; Pietro, N.D. Erythrocyte Alterations and Increased Cardiovascular Risk in Chronic Renal Failure. Nephro-Urol. Mon. 2017, 9, e45866. Available online: https://sites.kowsarpub.com/num/articles/55539.html (accessed on 29 July 2020). [CrossRef] [Green Version]
- Chaleckis, R.; Murakami, I.; Takada, J.; Kondoh, H.; Yanagida, M. Individual variability in human blood metabolites identifies age-related differences. Proc. Natl. Acad. Sci. USA 2016, 113, 4252–4259. [Google Scholar] [CrossRef] [PubMed] [Green Version]
- Rübsaamen, K. Lipidomic Analysis of Circulating Human Blood Cells. Ph.D. Thesis, Der Naturwissenschaftlichen Fakultät III—Biologie und Vorklinische Medizin der Universität Regensburg, Regensburg, Germany, 2010. [Google Scholar]
- Harada, T.; Yuba-Kubo, A.; Sugiura, Y.; Zaima, N.; Hayasaka, T.; Goto-Inoue, N.; Wakui, M.; Suematsu, M.; Takeshita, K.; Ogawa, K.; et al. Visualization of Volatile Substances in Different Organelles with an Atmospheric-Pressure Mass Microscope. Anal. Chem. 2009, 81, 9153–9157. [Google Scholar] [CrossRef] [PubMed]
- Van de Plas, R.; Yang, J.; Spraggins, J.; Caprioli, R.M. Image fusion of mass spectrometry and microscopy: A multimodality paradigm for molecular tissue mapping. Nat. Methods 2015, 12, 366–372. [Google Scholar] [CrossRef] [PubMed] [Green Version]
- Porta Siegel, T.; Hamm, G.; Bunch, J.; Cappell, J.; Fletcher, J.S.; Schwamborn, K. Mass Spectrometry Imaging and Integration with Other Imaging Modalities for Greater Molecular Understanding of Biological Tissues. Mol. Imaging Biol. 2018, 20, 888–901. [Google Scholar] [CrossRef] [PubMed] [Green Version]
- Buchberger, A.R.; DeLaney, K.; Johnson, J.; Li, L. Mass Spectrometry Imaging: A Review of Emerging Advancements and Future Insights. Anal. Chem. 2018, 90, 240–265. [Google Scholar] [CrossRef]
- Sugiyama, E.; Yao, I.; Setou, M. Visualization of local phosphatidylcholine synthesis within hippocampal neurons using a compartmentalized culture system and imaging mass spectrometry. Biochem. Biophys. Res. Commun. 2018, 495, 1048–1054. [Google Scholar] [CrossRef]
- Spivey, E.C.; McMillen, J.C.; Ryan, D.J.; Spraggins, J.M.; Caprioli, R.M. Combining MALDI-2 and transmission geometry laser optics to achieve high sensitivity for ultra-high spatial resolution surface analysis. J. Mass Spectrom. 2019, 54, 366–370. [Google Scholar] [CrossRef]
- Zavalin, A.; Todd, E.M.; Rawhouser, P.D.; Yang, J.; Norris, J.L.; Caprioli, R.M. Direct imaging of single cells and tissue at sub-cellular spatial resolution using transmission geometry MALDI MS. J. Mass Spectrom. 2012, 47, 1473–1481. [Google Scholar] [CrossRef] [Green Version]
- Gorman, B.L.; Kraft, M.L. High-Resolution Secondary Ion Mass Spectrometry Analysis of Cell Membranes. Anal. Chem. 2020, 92, 1645–1652. [Google Scholar] [CrossRef] [Green Version]
- Spengler, B.; Huber, M.; Kaufmann, R. MALDI Ion Imaging and Biological Ion Imaging with a new Scanning UV-Laser Microprobe. In Book of Abstracts of 42nd Annual Conference on Mass Spectrometry and Allied Topics; American Society for Mass Spectrometry: Chicago, IL, USA, 1994; p. 1041. [Google Scholar]
- Sandra, K.; Pereira, A.D.S.; Vanhoenacker, G.; David, F.; Sandra, P. Comprehensive blood plasma lipidomics by liquid chromatography/quadrupole time-of-flight mass spectrometry. J. Chromatogr. A 2010, 1217, 4087–4099. [Google Scholar] [CrossRef] [PubMed]
- Annesley, T.M. Ion suppression in mass spectrometry. Clin. Chem. 2003, 49, 1041–1044. [Google Scholar] [CrossRef] [PubMed] [Green Version]
- Hankin, J.A.; Barkley, R.M.; Murphy, R.C. Sublimation as a method of matrix application for mass spectrometric imaging. J. Am. Soc. Mass Spectrom. 2007, 18, 1646–1652. [Google Scholar] [CrossRef] [PubMed] [Green Version]
- Soltwisch, J.; Kettling, H.; Vens-Cappell, S.; Wiegelmann, M.; Müthing, J.; Dreisewerd, K. Mass spectrometry imaging with laser-induced postionization. Science 2015, 348, 211–215. [Google Scholar] [CrossRef] [PubMed]
- Wiegelmann, M.; Dreisewerd, K.; Soltwisch, J. Influence of the Laser Spot Size, Focal Beam Profile, and Tissue Type on the Lipid Signals Obtained by MALDI-MS Imaging in Oversampling Mode. J. Am. Soc. Mass Spectrom. 2016, 27, 1952–1964. [Google Scholar] [CrossRef]
- Leopold, J.; Popkova, Y.; Engel, K.M.; Schiller, J. Recent Developments of Useful MALDI Matrices for the Mass Spectrometric Characterization of Lipids. Biomolecules 2018, 8, 173. [Google Scholar] [CrossRef] [Green Version]
- Nakashima, K.; Nakashima, H.; Shimoyama, M. Deoxydenosine triphosphate acting as an energy-transferring molecule in adenosine deaminase inhibited human erythrocytes. Biochim. Biophys. Acta 1991, 1094, 257–262. [Google Scholar] [CrossRef]
- Gieseg, S.P.; Baxter-Parker, G.; Lindsay, A. Neopterin, Inflammation and Oxidative Stress: What Could We Be Missing? Antioxidants 2018, 7, 80. [Google Scholar] [CrossRef] [Green Version]
- Imai, T.; Mihara, H.; Kurihara, T.; Esaki, N. Selenocysteine is selectively taken up by red blood cells. Biosci. Biotechnol. Biochem. 2009, 73, 2746. [Google Scholar] [CrossRef] [Green Version]
- Duclos, R.I.; Cleary, D.C.; Catcott, K.C.; Zhou, Z.S. Synthesis and characterization of Se-adenosyl-L-selenohomocysteine selenoxide. J. Sulfur Chem. 2015, 36, 135–144. [Google Scholar] [CrossRef] [Green Version]
- Mendel, R.R. The Molybdenum Cofactor. J. Biol. Chem. 2013, 288, 13165–13172. [Google Scholar] [CrossRef] [PubMed] [Green Version]
- Wishart, D.S.; Feunang, Y.D.; Marcu, A.; Guo, A.C.; Liang, K.; Vázquez-Fresno, R.; Sajed, T.; Johnson, D.; Li, C.; Karu, N.; et al. HMDB 4.0: The human metabolome database for 2018. Nucleic Acids Res. 2018, 46, D608–D617. [Google Scholar] [CrossRef] [PubMed]
- Kanehisa, M.; Goto, S. KEGG: Kyoto Encyclopedia of Genes and Genomes. Nucleic Acids Res. 2000, 28, 27–30. [Google Scholar] [CrossRef] [PubMed]


| Instrumental Settings | D0 | D1 | |||
|---|---|---|---|---|---|
| Cell Type | m/z | 9AA | CHCA | 9AA | CHCA |
| RBC | 200–900 a | 60 | 100 | 29 | 82 |
| WBC | 200–900 a | 68 | 145 | 80 | 100 |
| m/z | Adduct | KEGG ID | Metabolite | Cell/Plasma | Instrumental Settings | Cell Type |
|---|---|---|---|---|---|---|
| 367.99194 | M-H20-H | C00705 | 2′-Deoxycytidine diphosphate (dCDP) | 0.8 | D0− | RBC |
| 423.02167 | M-H | C00068 | Thiamin diphosphate | >0.1 | D1− | RBC |
| 607.17777 | 2M-H | C12270 | N-Acetylaspartylglutamic acid | 0.3 | ||
| 743.53308 | 2M-H | C13828 | Cervonoyl ethanolamide | 6.5 | ||
| 755.09679 | M-H | C06197 | Diadenosine triphosphate | >0.1 | ||
| 821.05335 | 2M-H | C00206 | 2′-Deoxyadenosine 5′-diphosphate | >0.1 | ||
| 221.97144 | M+K | C16511 | l-Homocysteic acid | 1.6 | D0+ | RBC |
| 265.96063 | M+K | C03287 | l-Glutamic acid 5-phosphate | 1.2 | ||
| 326.77131 | 2M+H | C06232 | Molybdate | 2.0 | ||
| 415.84174 | M+H-H2O | C01060 | 3,5-Diiodo-l-tyrosine | 0.8 | ||
| 456.0047 | M+H-2H2O | C00131 | 2′-Deoxyadenosine 5′-triphosphate (dATP) | 1.4 | ||
| 500.04952 | M+Na | C00513 | CDP-glycerol | 2.8 | ||
| 514.96755 | M+Na | C01345 | 2′-Deoxyinosine triphosphate | 0.5 | ||
| 694.83621 | 2M+Na | C05704 | Selenocystine | 0.7 | ||
| 790.43199 | M+K | C06125 | 3-O-Sulfogalactosylceramide (d18:1/14:0) | 0.7 | ||
| 418.04554 | M+K | C03451 | S-Lactoylglutathione | 0.6 | D1+ | RBC |
| 498.14504 | M+K | C00440 | 5-Methyltetrahydrofolic acid | 1.2 | ||
| 616.17073 | M+H | C00032 | Heme | 1.6 | ||
| 652.04788 | M+H-2H2O | C04426 | Uridine diphosphate acetylgalactosamine 4-sulfate | 0.7 | ||
| 774.11178 | M+H-2H2O | C00024 | Acetyl-CoA | 0.6 | ||
| 796.1011 | M+H | C00798 | Formyl-CoA | 0.9 | ||
| 338.96305 | 2M-H | C11499 | (S)-3-Sulfonatolactate | 0.5 | D0− | WBC |
| 367.99194 | M-H20-H | C00705 | dCDP | 0.6 | ||
| 409.06403 | 2M-H | C02470 | Xanthurenic acid | 1.7 | ||
| 601.60302 | 2M-H | C00836 | Sphinganine | 0.6 | ||
| 409.00689 | M-H20-H | C00104 | Inosine 5′-diphosphate (IDP) | 0.8 | D1− | WBC |
| 426.95079 | 2M-H | C06054 | 2-Oxo-3-hydroxy-4-phosphobutanoic acid | 17.8 | ||
| 488.97877 | M-H20-H | C00081 | Inosine triphosphate (ITP) | 3.2 | ||
| 506.11841 | M+Cl | C03204 | 10-Formyldihydrofolate | 9.2 | ||
| 506.99341 | M-H | C00081 | ITP | 1.9 | ||
| 724.08168 | M-H20-H | C00006 | NADP | >0.1 | ||
| 743.53308 | 2M-H | C13828 | Cervonoyl ethanolamide | 0.3 | ||
| 753.97899 | M+Cl | C02739 | Phosphoribosyl-ATP | >0.1 | ||
| 806.70364 | M-H20-H | C01190 | GlcCer(d18:1/25:0) | >0.1 | ||
| 221.97144 | M+K | C16511 | l-Homocysteic acid | 1.8 | D0+ | WBC |
| 265.96063 | M+K | C03287 | l-Glutamic acid 5-phosphate | 1.5 | ||
| 326.9293 | 2M+Na | C05527 | 3-Sulfinylpyruvic acid | 0.5 | ||
| 376.89968 | 2M+K | C05688 | l-Selenocysteine | 2.8 | ||
| 415.84174 | M+H-H2O | C01060 | 3,5-Diiodo-l-tyrosine | 0.7 | ||
| 456.0047 | M+H-2H2O | C00131 | Deoxyadenosine triphosphate | 1.8 | ||
| 694.83621 | 2M+Na | C05704 | Selenocystine | 0.6 | ||
| 701.98995 | M+H-H2O | C02739 | Phosphoribosyl-ATP | 0.6 | ||
| 709.07265 | 2M+K | C05925 | Dihydroneopterin phosphate | 1.7 | ||
| 762.92406 | 2M+H-H2O | C00119 | Phosphoribosyl pyrophosphate | 0.6 | ||
| 478.16774 | M+Na | C00445 | (6R)-5,10-methenyltetrahydrofolate | 0.7 | D1+ | WBC |
| 586.02355 | M+H-2H2O | C19851 | ADP-ribose 1″-2″ cyclic phosphate | 0.4 | ||
| 706.13261 | M+Na | C04856 | NADHX | 0.4 | ||
| 728.10302 | M+H-H2O | C00005 | NADPH | 0.9 | ||
| 779.09063 | M+Na | C06197 | Diadenosine triphosphate | 1.0 | ||
| 865.13597 | 2M+H | C05692 | Se-Adenosyl-l-selenohomocysteine | 0.5 |
| Ionization | Cellular Marker Compound | Adduct Ion | Monoisotopic m/z (Da) |
|---|---|---|---|
| Negative | ATP | [M − H]− | 505.988 |
| Heme (Fe II) | [M − H]− | 615.170 | |
| Positive | IMP | [M + Na]+ | 371.037 |
| Heme (Fe III) | [M]+ | 616.177 |
Publisher’s Note: MDPI stays neutral with regard to jurisdictional claims in published maps and institutional affiliations. |
© 2021 by the authors. Licensee MDPI, Basel, Switzerland. This article is an open access article distributed under the terms and conditions of the Creative Commons Attribution (CC BY) license (http://creativecommons.org/licenses/by/4.0/).
Share and Cite
Debeljak, Ž.; Niehoff, A.-C.; Bandjak, A.; Mandić, D.; Bošnjak, B.; Heffer, M.; Mrđenović, S.; Marković, I.; Zjalić, M.; Šerić, V. MALDI TOF Mass Spectrometry Imaging of Blood Smear: Method Development and Evaluation. Int. J. Mol. Sci. 2021, 22, 585. https://doi.org/10.3390/ijms22020585
Debeljak Ž, Niehoff A-C, Bandjak A, Mandić D, Bošnjak B, Heffer M, Mrđenović S, Marković I, Zjalić M, Šerić V. MALDI TOF Mass Spectrometry Imaging of Blood Smear: Method Development and Evaluation. International Journal of Molecular Sciences. 2021; 22(2):585. https://doi.org/10.3390/ijms22020585
Chicago/Turabian StyleDebeljak, Željko, Ann-Christin Niehoff, Ana Bandjak, Dario Mandić, Bojana Bošnjak, Marija Heffer, Stefan Mrđenović, Ivana Marković, Milorad Zjalić, and Vatroslav Šerić. 2021. "MALDI TOF Mass Spectrometry Imaging of Blood Smear: Method Development and Evaluation" International Journal of Molecular Sciences 22, no. 2: 585. https://doi.org/10.3390/ijms22020585
APA StyleDebeljak, Ž., Niehoff, A.-C., Bandjak, A., Mandić, D., Bošnjak, B., Heffer, M., Mrđenović, S., Marković, I., Zjalić, M., & Šerić, V. (2021). MALDI TOF Mass Spectrometry Imaging of Blood Smear: Method Development and Evaluation. International Journal of Molecular Sciences, 22(2), 585. https://doi.org/10.3390/ijms22020585