
Identification of Exosomal MicroRNA Signature by Liquid Biopsy in Hereditary Hemorrhagic Telangiectasia Patients

 ,
,  , ,
, ,  ,
,  and
and 
Abstract
: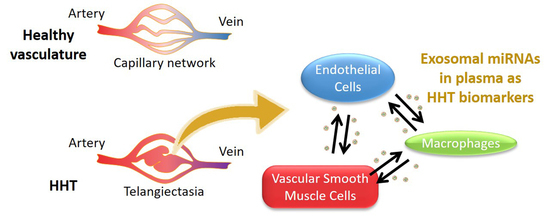
1. Introduction
2. Results
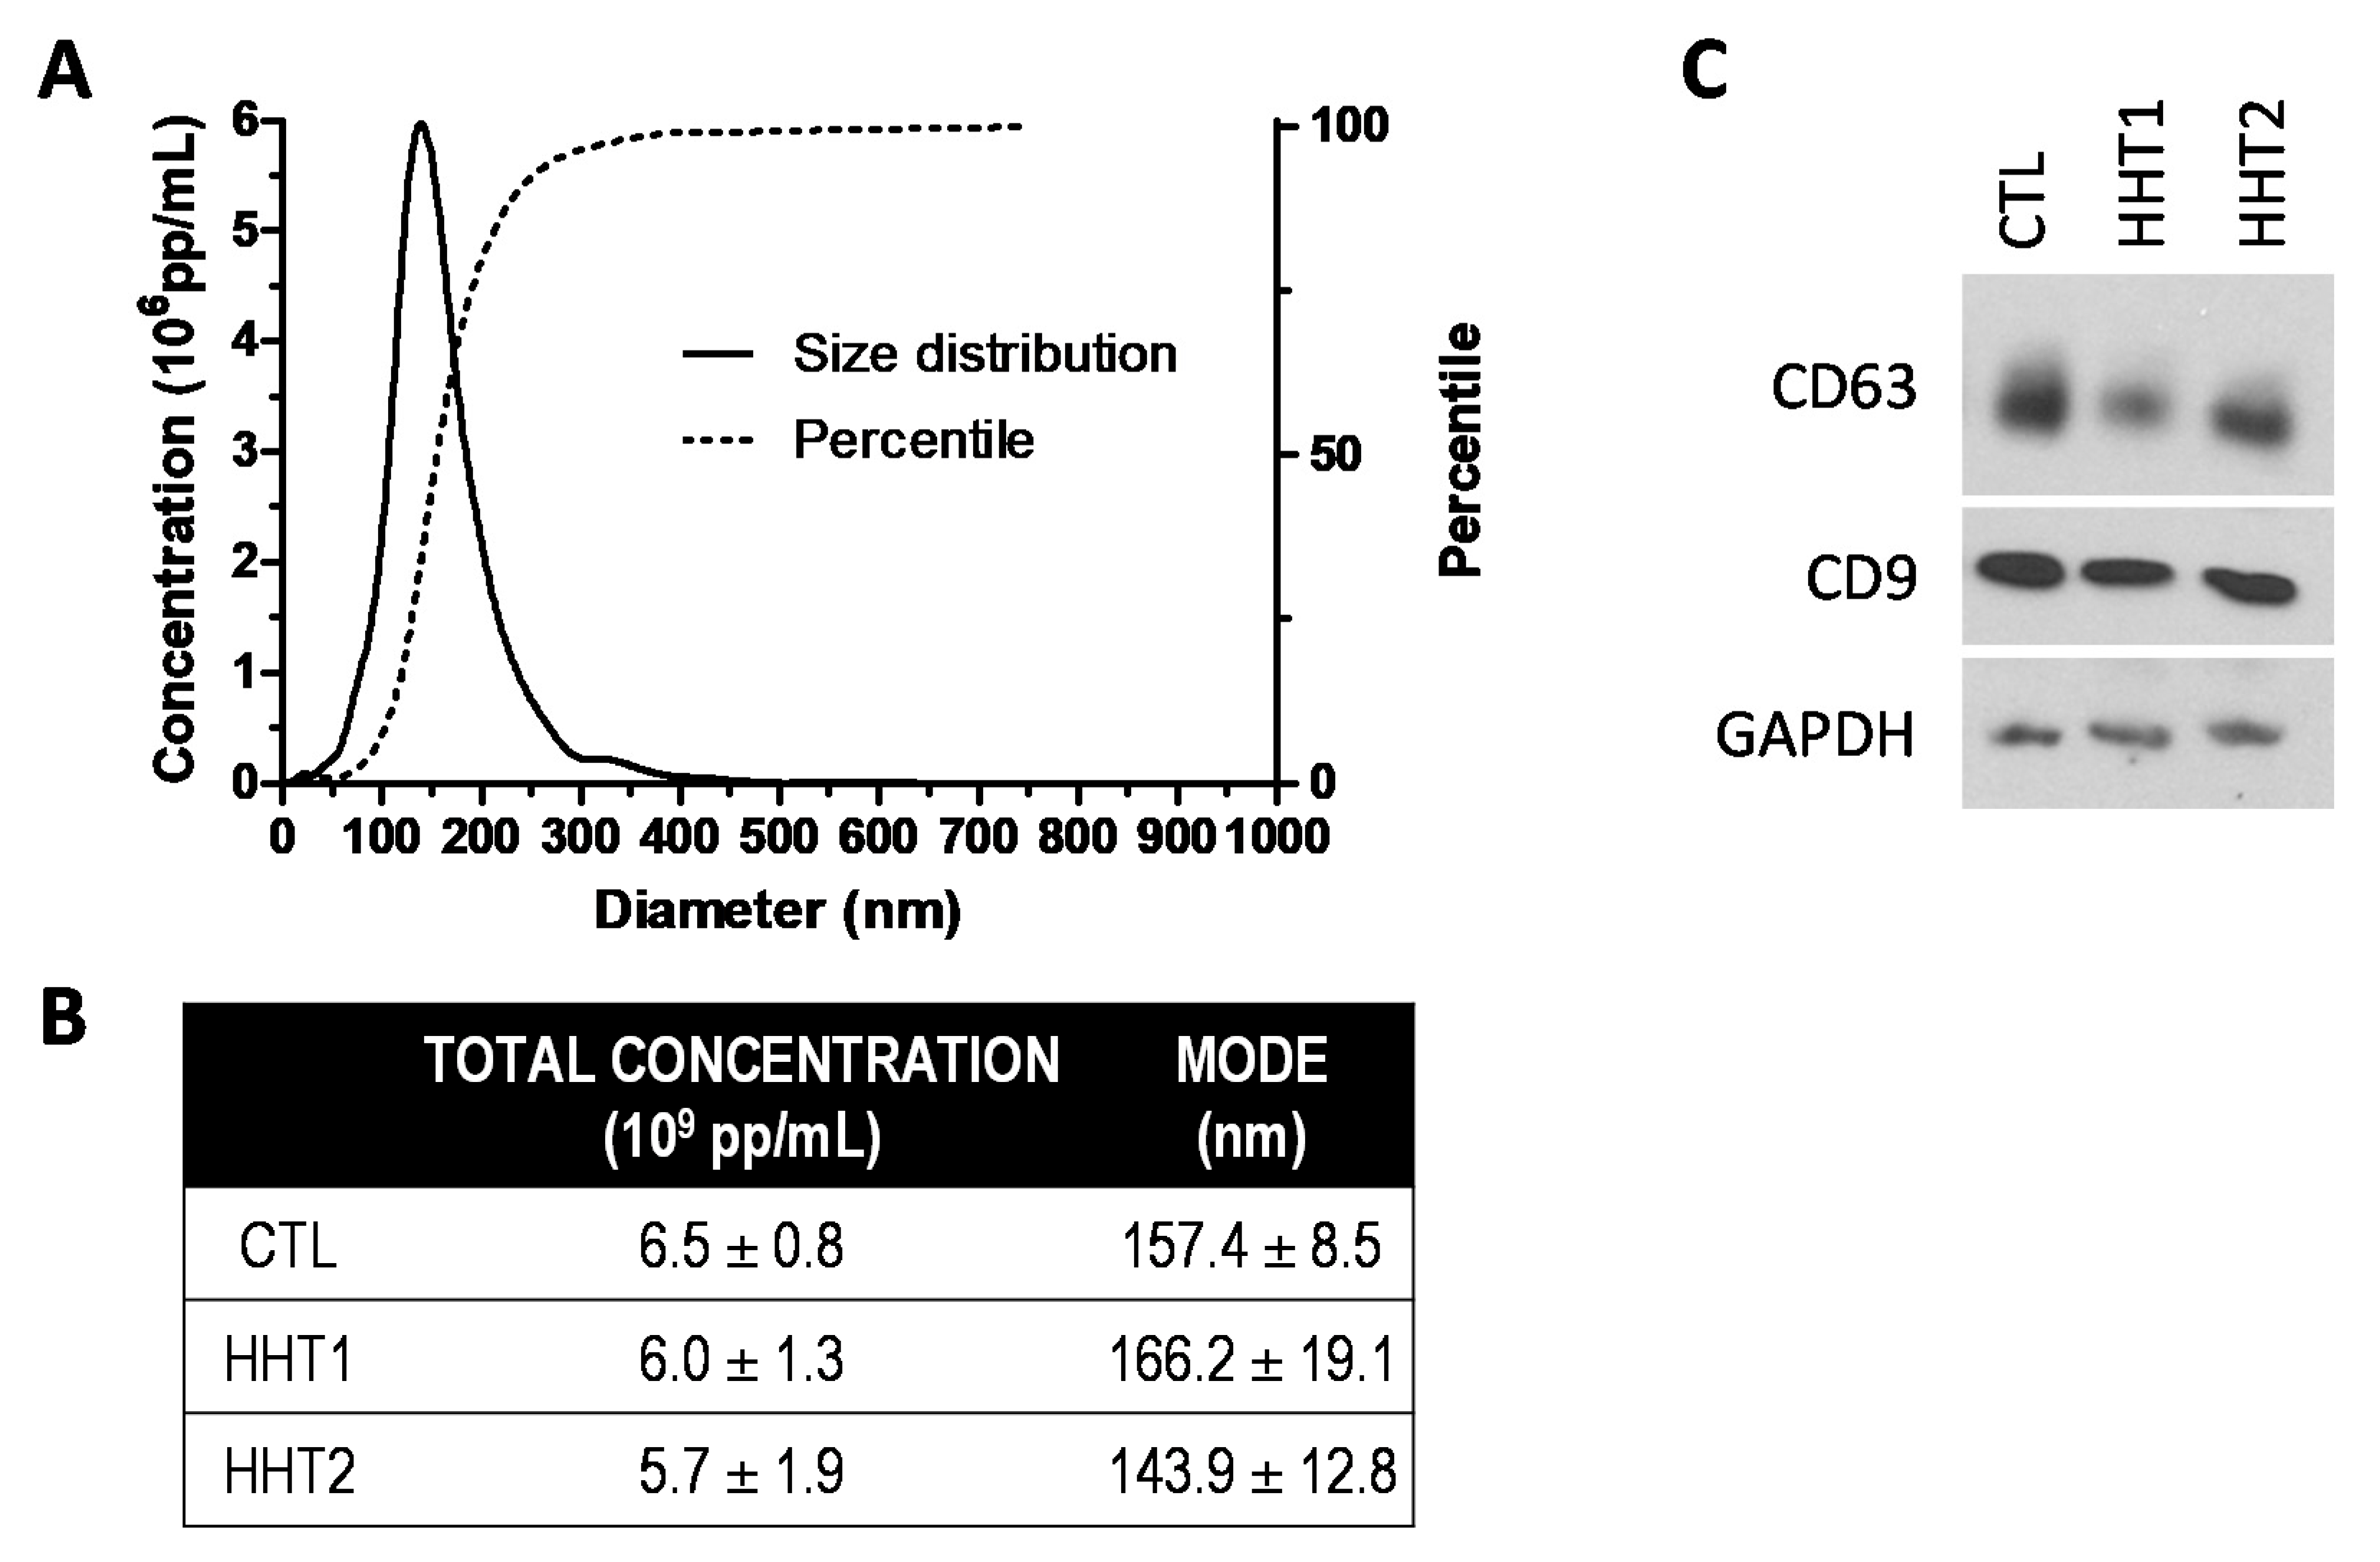
2.1. The Exosome Isolation Shows Similarity among Samples
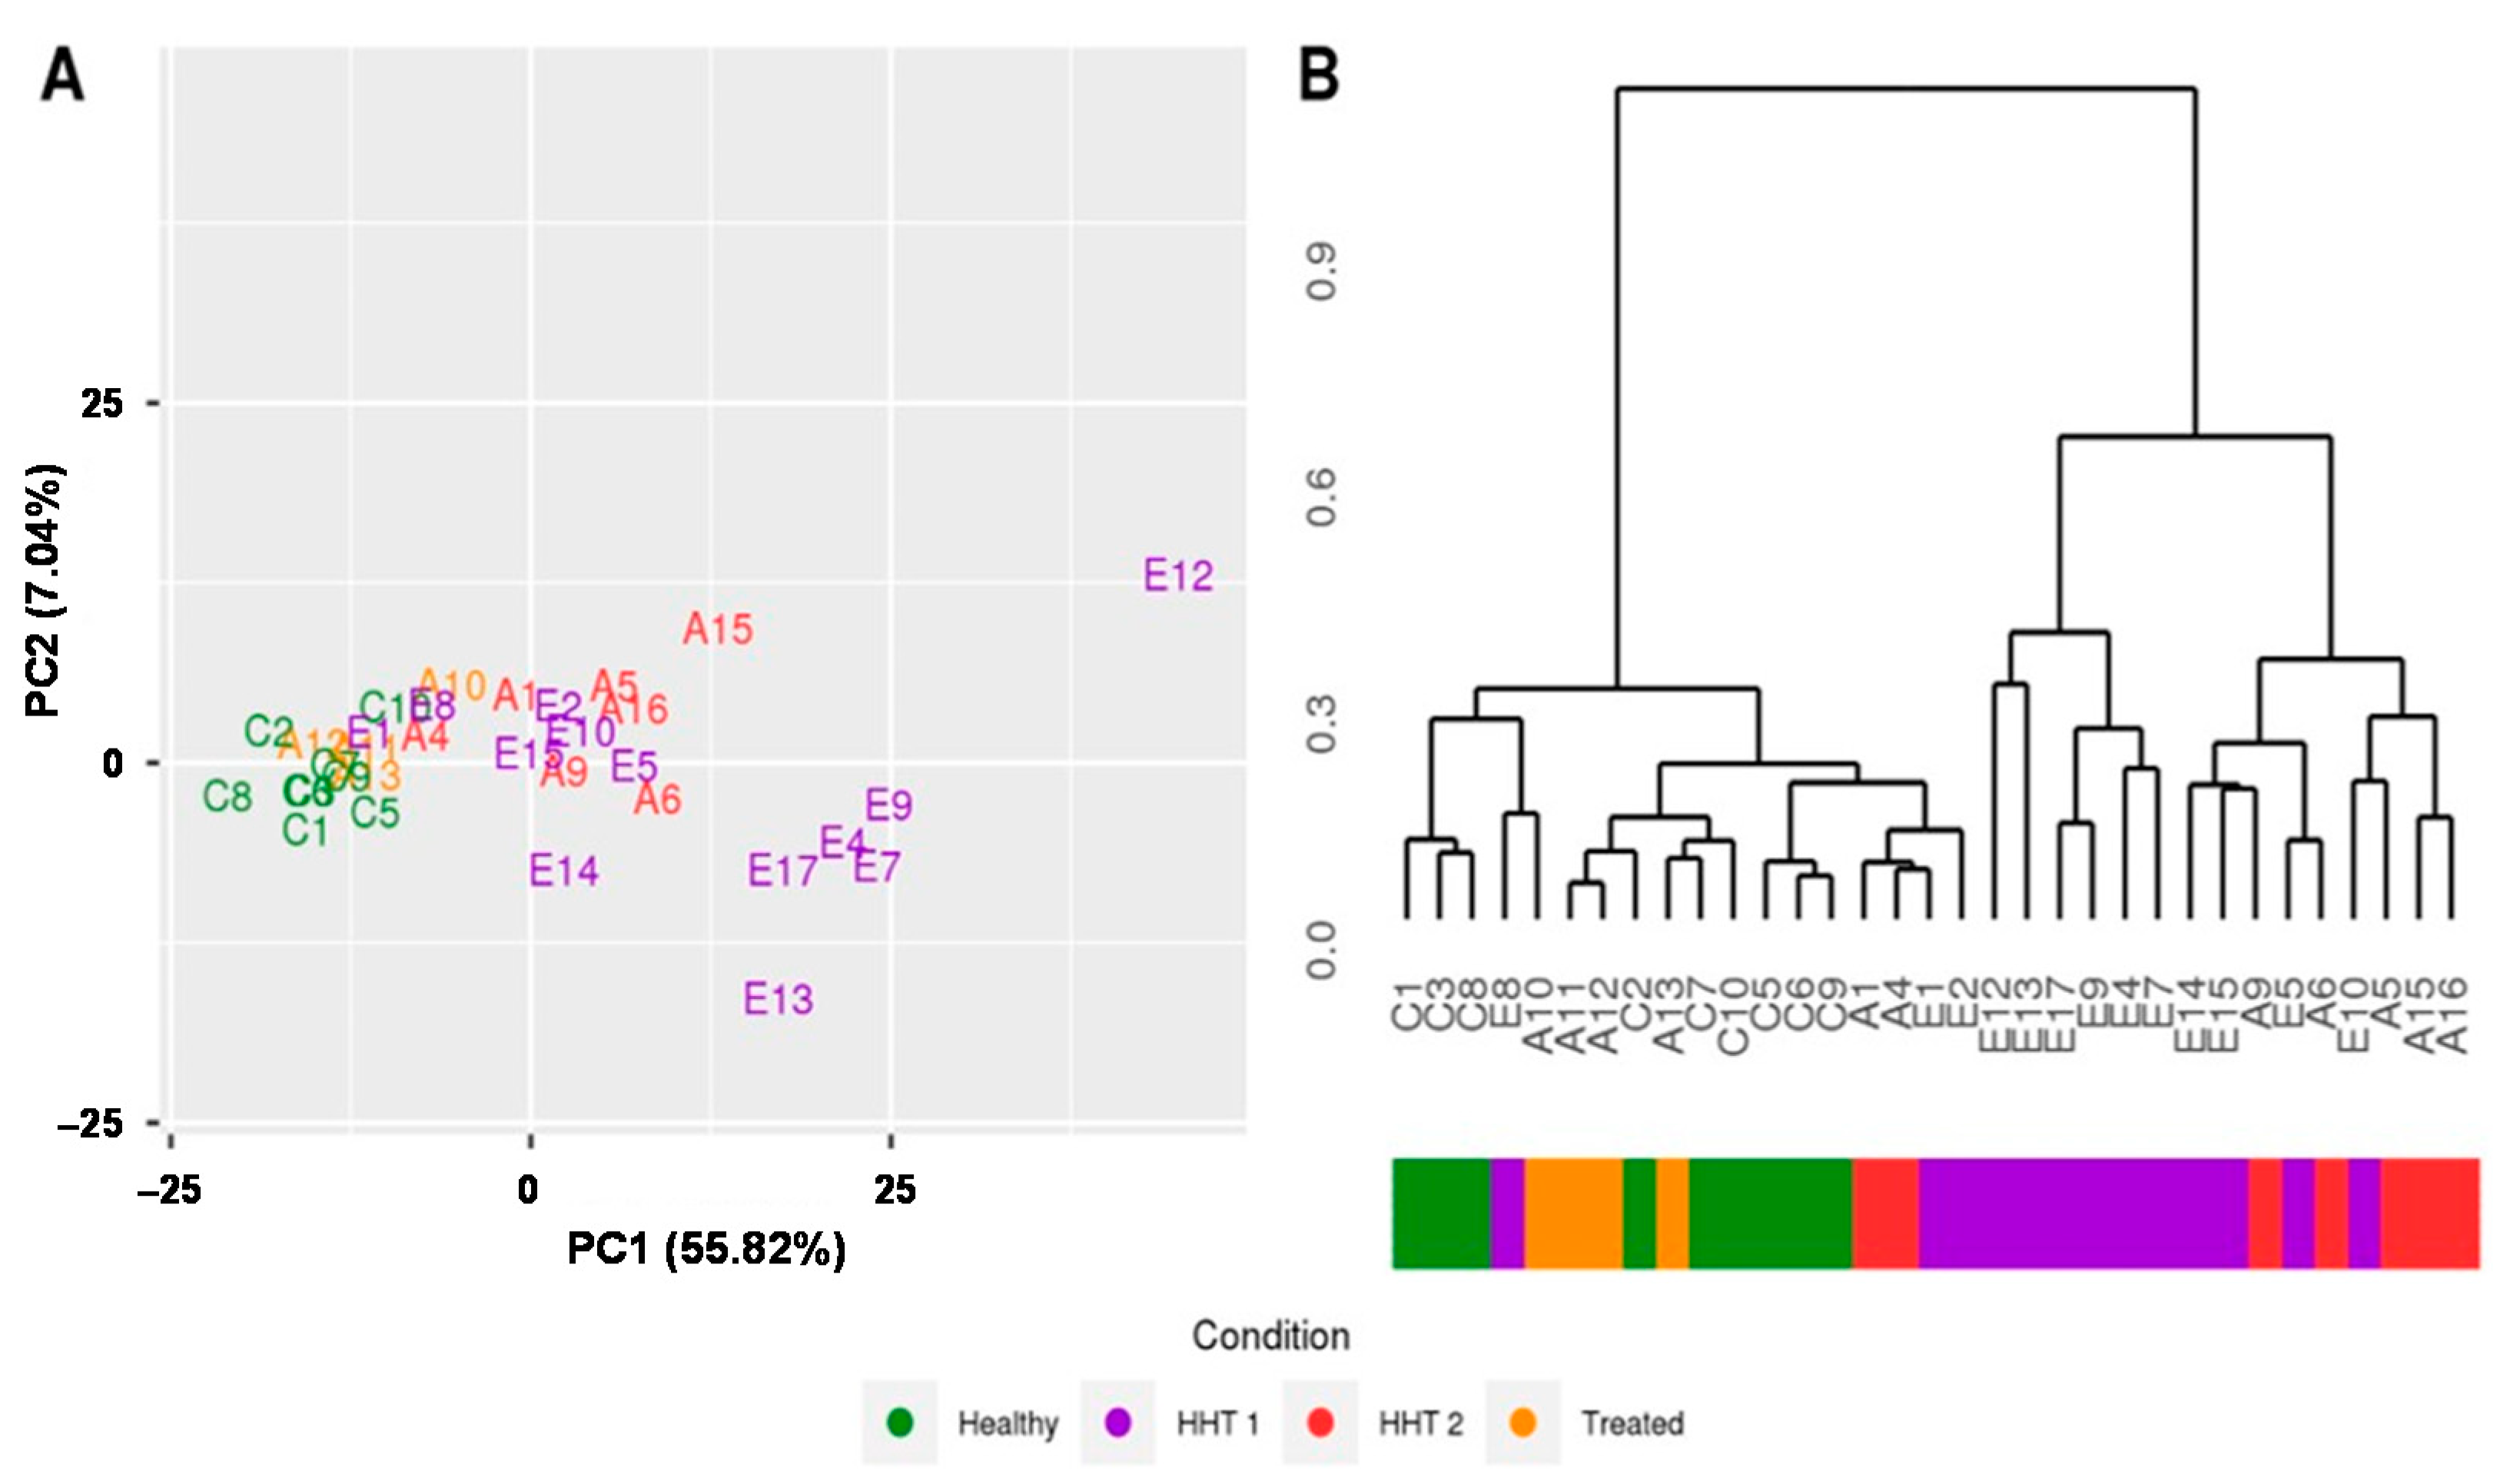
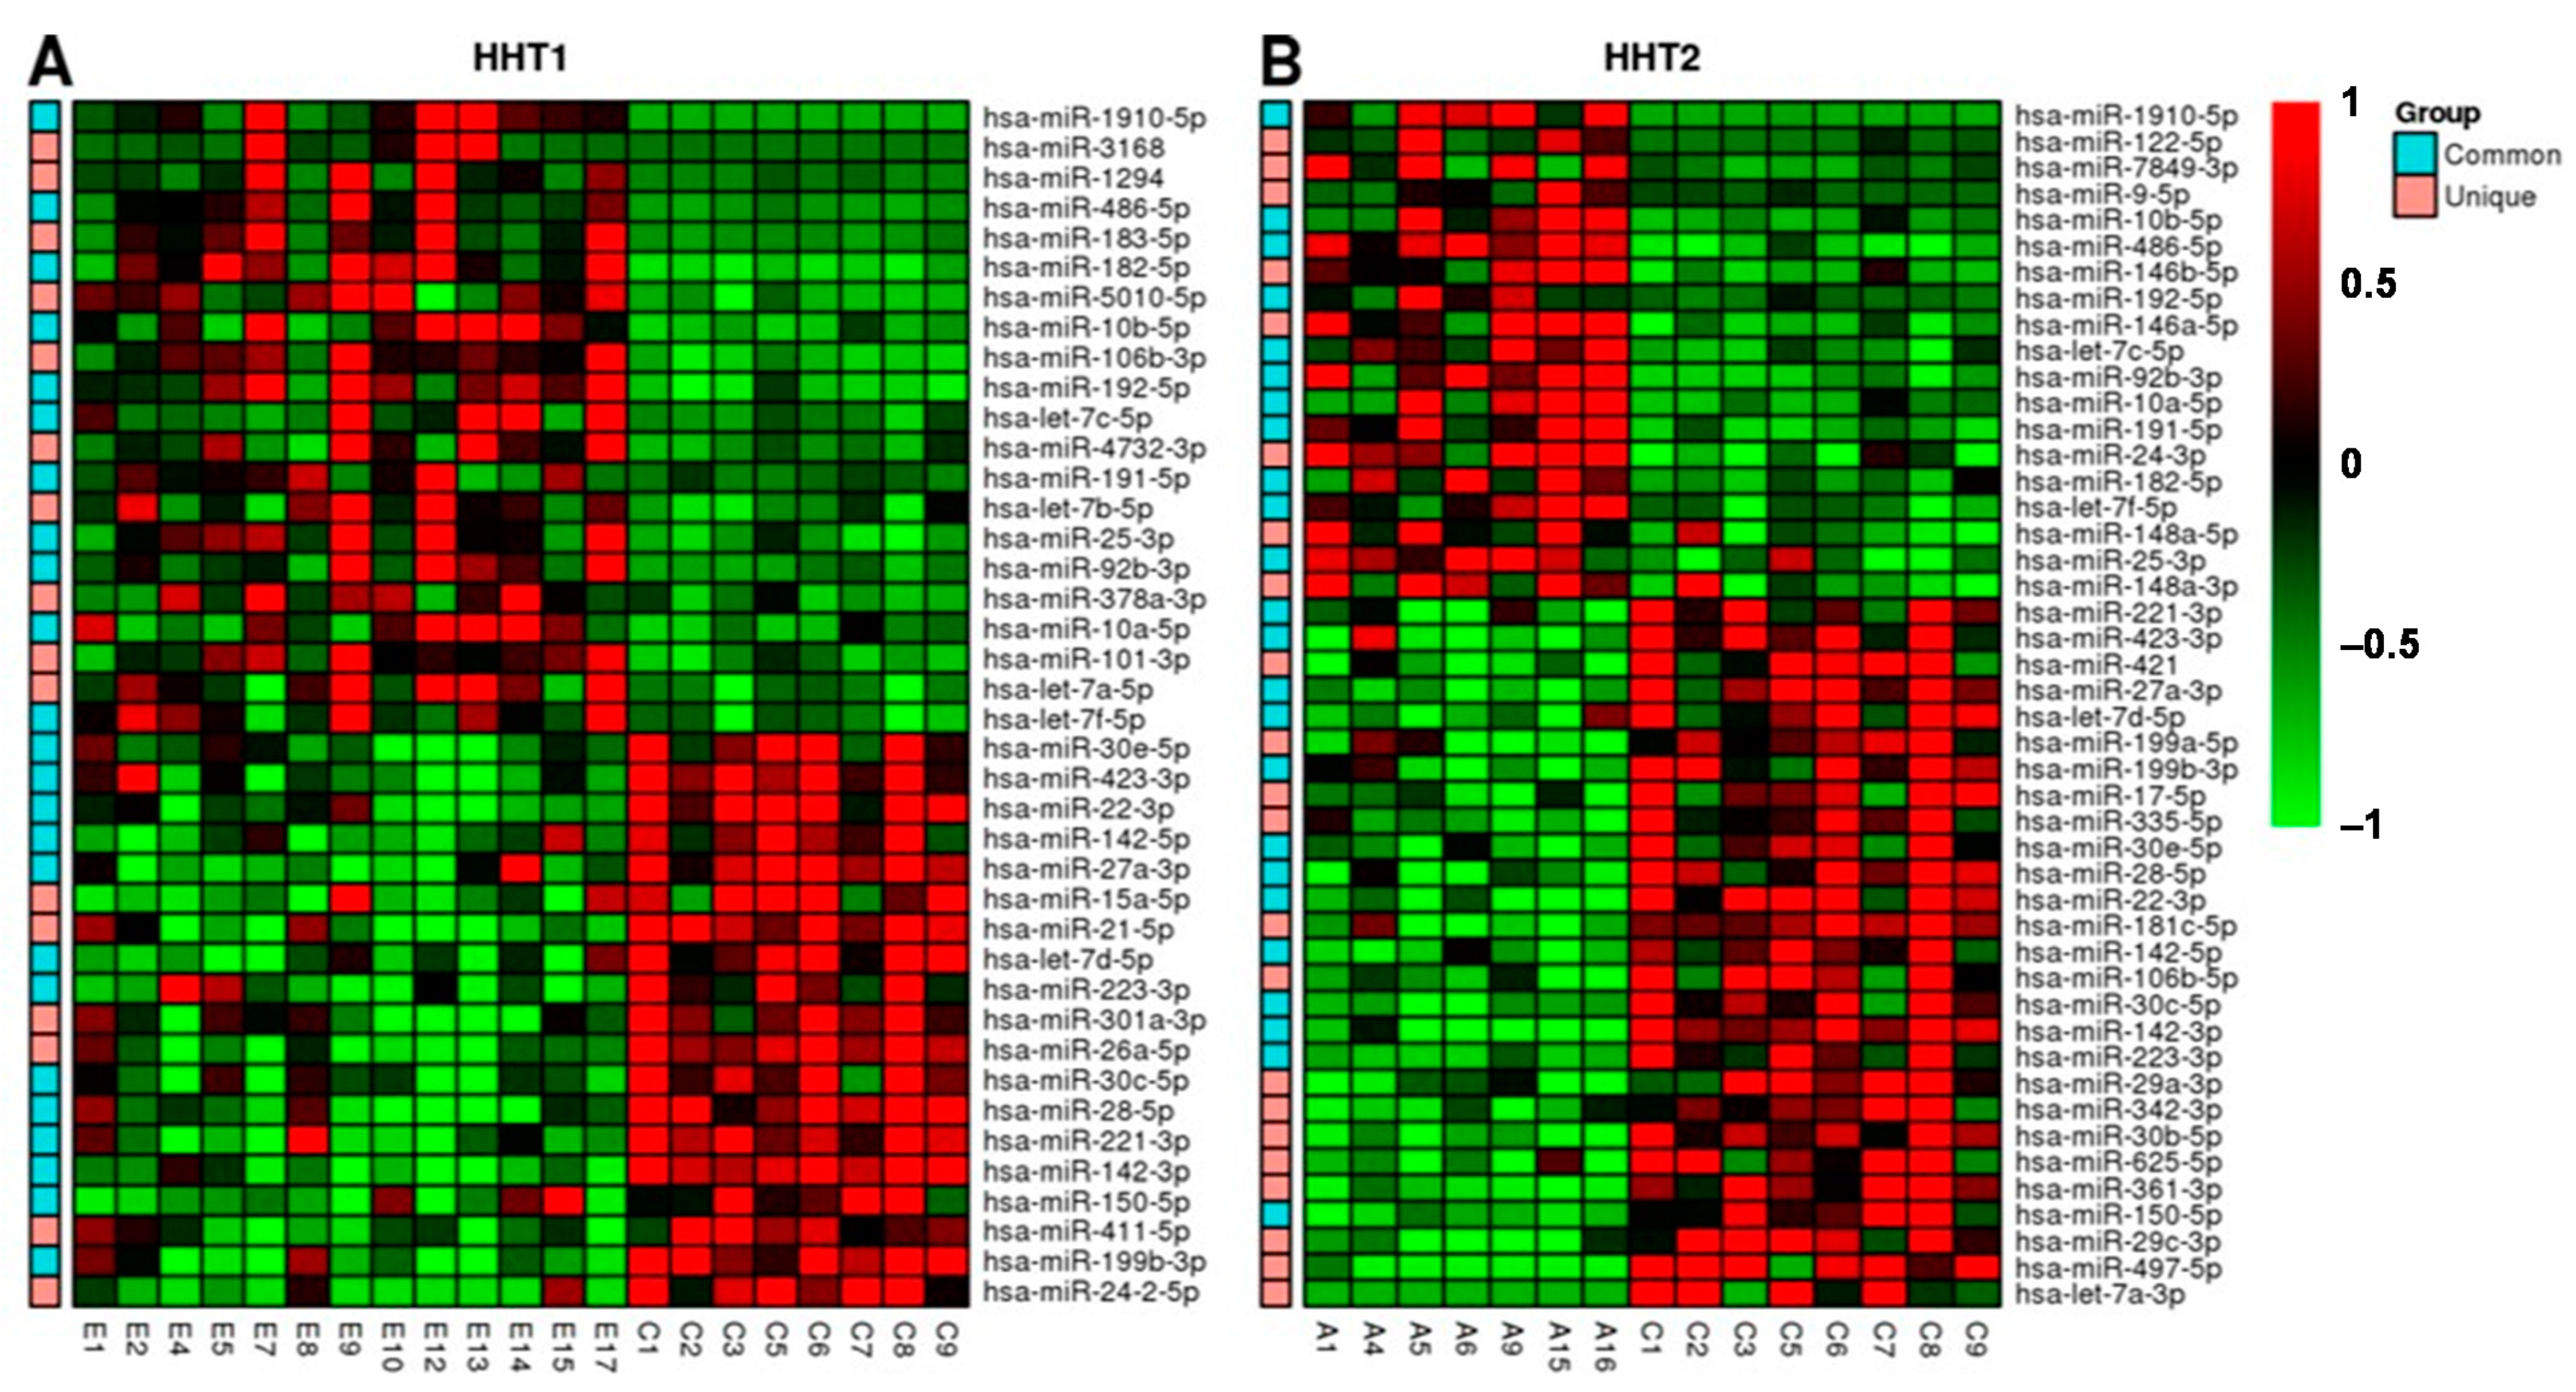
2.2. MiRNAs Signatures Differentiate HHT Subtypes and Healthy Samples
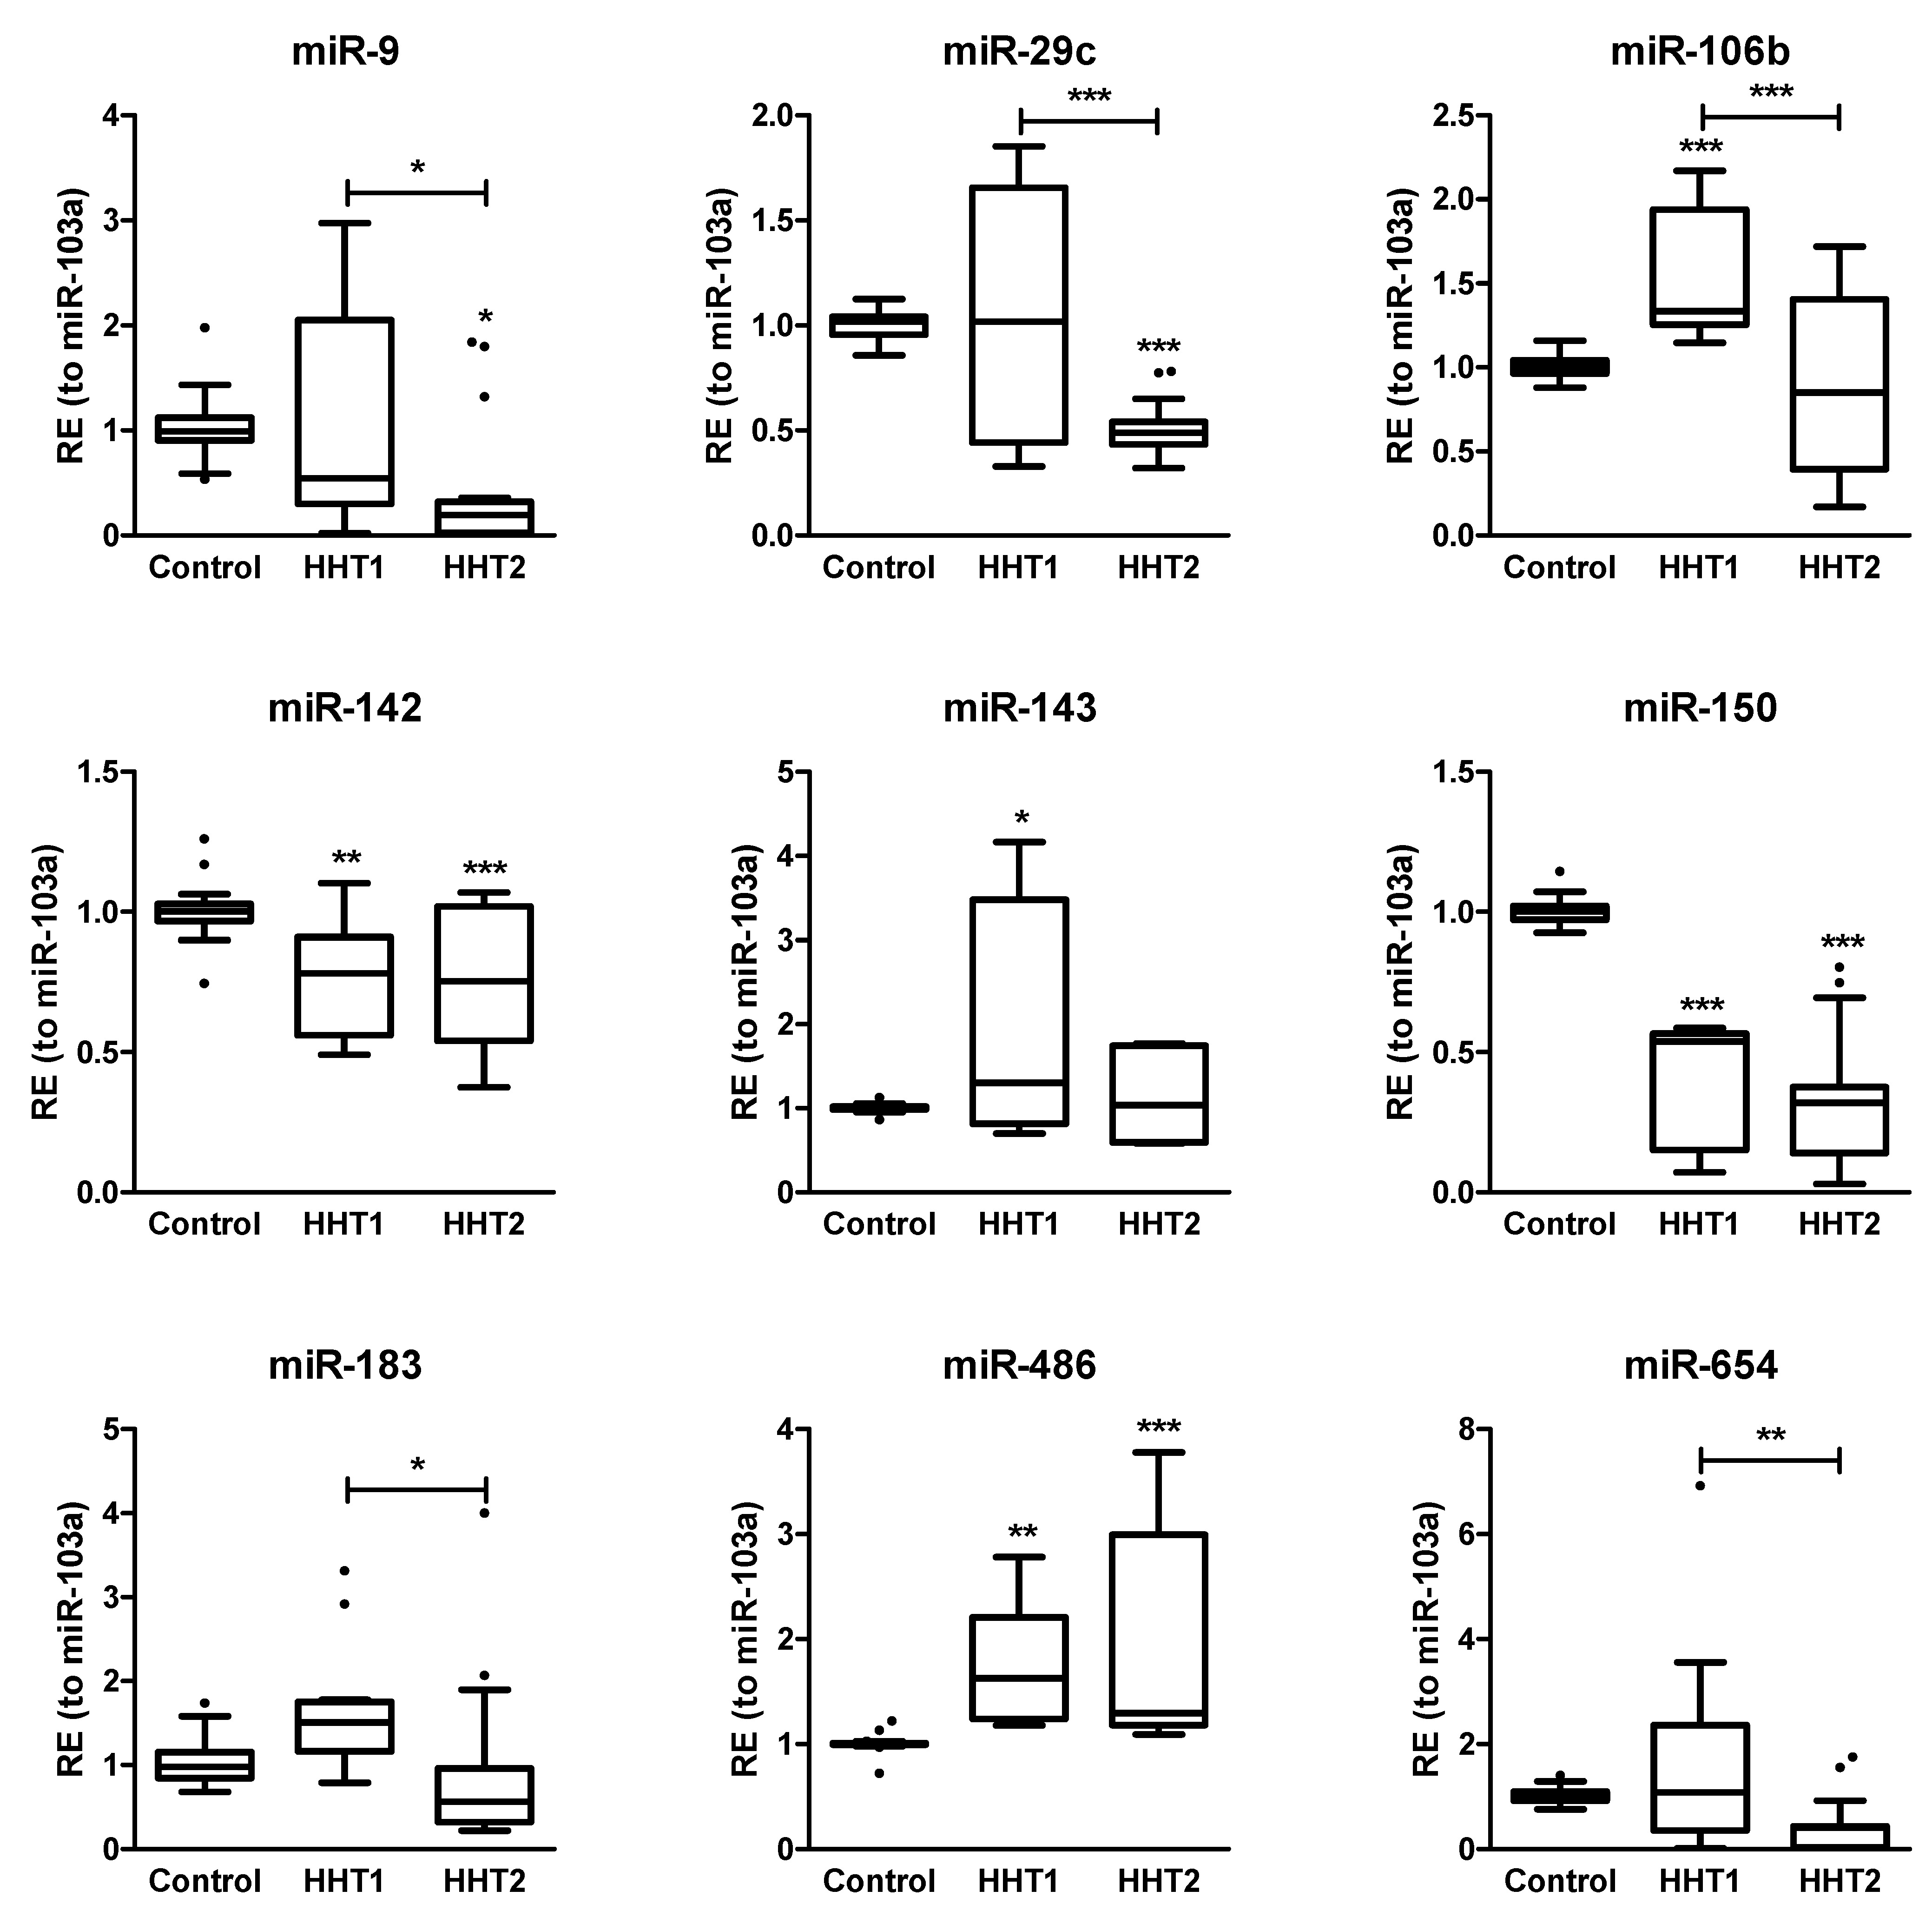
2.3. MiRNAs Differentially Expressed among HHT Patients and Control Samples
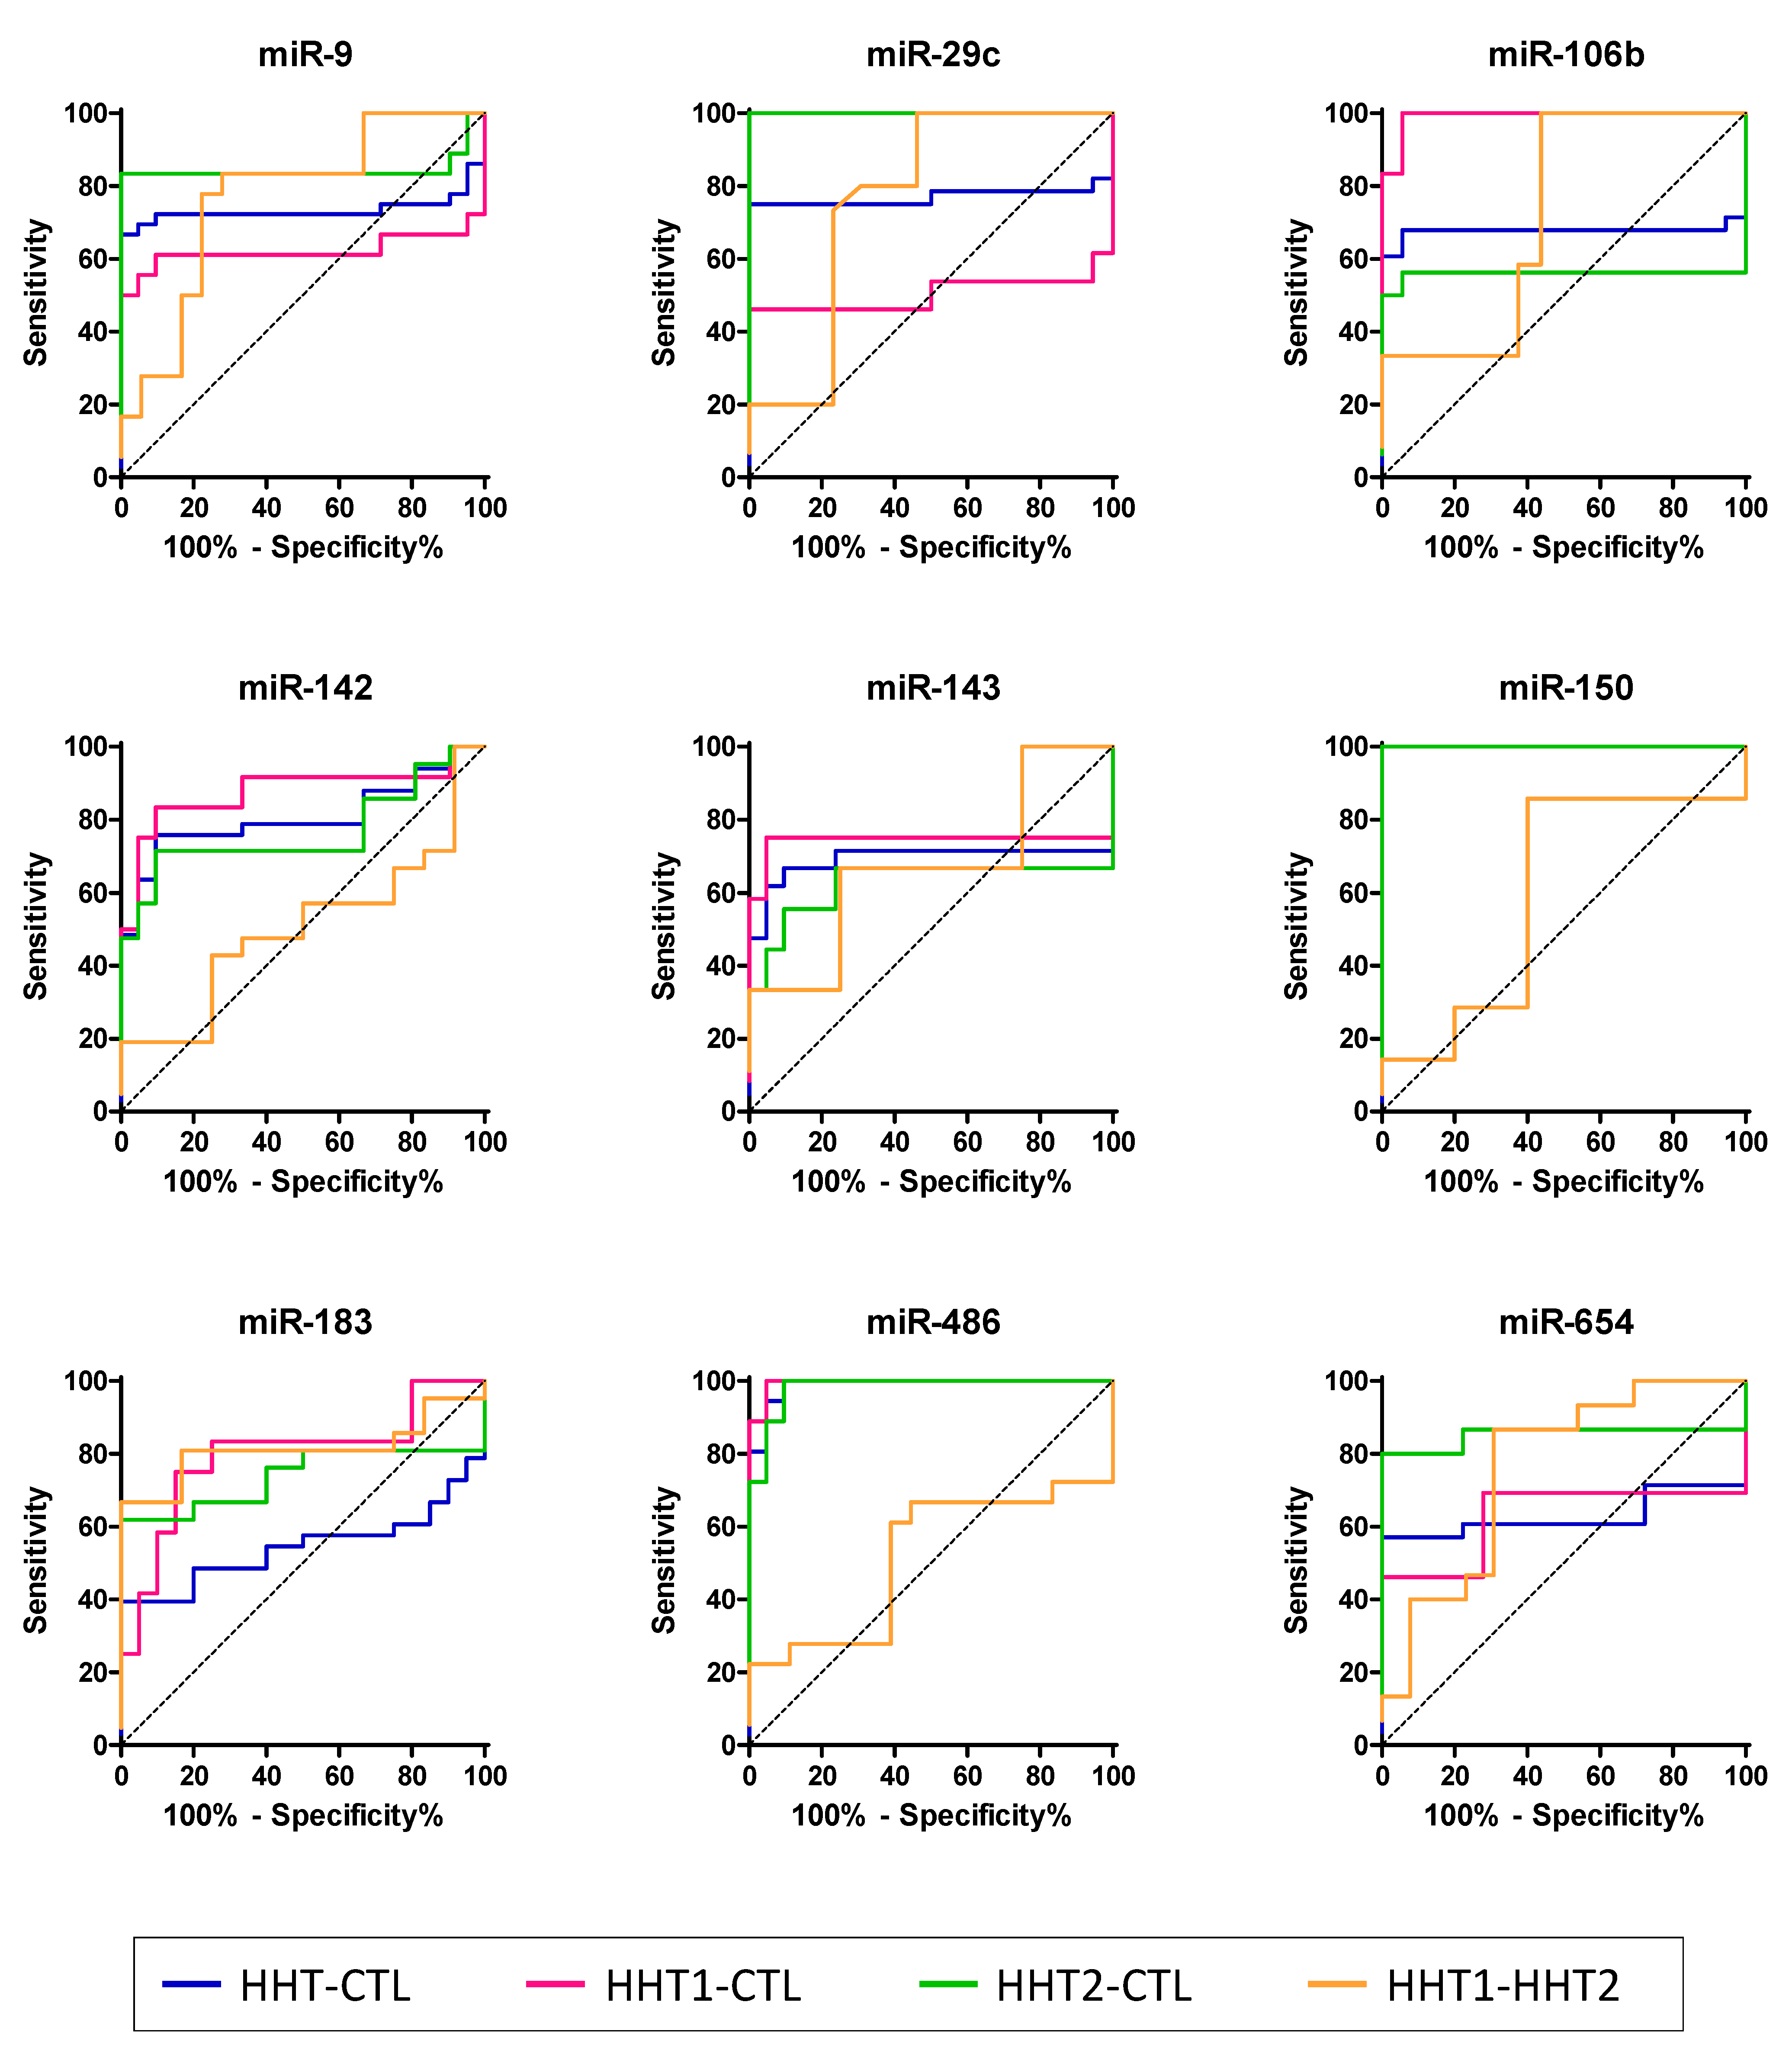
2.4. HHT-Associated miRNAs Have Diagnostic Value
2.5. Screening the Cellular Source of Exosomal miRNAs
3. Discussion
4. Materials and Methods
4.1. Volunteers and Blood Samples, Exosome Isolation, and miRNA Extraction and Sequencing
4.2. Exosome Isolation and miRNA Extraction
4.3. Small RNA Sequencing
4.4. Retrotranscription and Quantitative PCR (RT-qPCR)
4.5. Data Processing and Statistical Analysis
4.6. Analysis of Functional Terms
4.7. Cell Culture
5. Conclusions
6. Patents
Supplementary Materials
Author Contributions
Funding
Institutional Review Board Statement
Informed Consent Statement
Data Availability Statement
Acknowledgments
Conflicts of Interest
References
- Snodgrass, R.; Chico, T.; Arthur, H. Hereditary Haemorrhagic Telangiectasia, an Inherited Vascular Disorder in Need of Improved Evidence-Based Pharmaceutical Interventions. Genes 2021, 12, 174. [Google Scholar] [CrossRef]
- McDonald, J.; Wooderchak-Donahue, W.; VanSant Webb, C.; Whitehead, K.; Stevenson, D.A.; Bayrak-Toydemir, P. Hereditary hemorrhagic telangiectasia: Genetics and molecular diagnostics in a new era. Front. Genet. 2015, 6, 1. [Google Scholar] [CrossRef]
- Bernabeu, C.; Bayrak-Toydemir, P.; McDonald, J.; Letarte, M. Potential Second-Hits in Hereditary Hemorrhagic Telangiectasia. J. Clin. Med. 2020, 9, 3571. [Google Scholar] [CrossRef]
- Reimers, N.; Pantel, K. Liquid biopsy: Novel technologies and clinical applications. Clin. Chem. Lab. Med. 2019, 57, 312–316. [Google Scholar] [CrossRef] [PubMed]
- Liu, J.; Chen, Y.; Pei, F.; Zeng, C.; Yao, Y.; Liao, W.; Zhao, Z. Extracellular Vesicles in Liquid Biopsies: Potential for Disease Diagnosis. BioMed Res. Int. 2021, 2021, 1–17. [Google Scholar] [CrossRef]
- Makarova, J.; Turchinovich, A.; Shkurnikov, M.; Tonevitsky, A. Extracellular miRNAs and Cell-Cell Communication: Problems and Prospects. Trends Biochem. Sci. 2021, 46, 640–651. [Google Scholar] [CrossRef]
- Villarroya-Beltri, C.; Gutierrez-Vazquez, C.; Sanchez-Cabo, F.; Perez-Hernandez, D.; Vazquez, J.; Martin-Cofreces, N.; Martinez-Herrera, D.J.; Pascual-Montano, A.; Mittelbrunn, M.; Sanchez-Madrid, F. Sumoylated hnRNPA2B1 controls the sorting of miRNAs into exosomes through binding to specific motifs. Nat. Commun. 2013, 4, 2980. [Google Scholar] [CrossRef] [PubMed] [Green Version]
- Tabruyn, S.P.; Hansen, S.; Ojeda-Fernández, M.-L.; Bovy, N.; Zarrabeitia, R.; Recio-Poveda, L.; Bernabeu, C.; Martial, J.A.; Botella, L.-M.; Struman, I. MiR-205 is downregulated in hereditary hemorrhagic telangiectasia and impairs TGF-beta signaling pathways in endothelial cells. Angiogenesis 2013, 16, 877–887. [Google Scholar] [CrossRef] [PubMed] [Green Version]
- Cannavicci, A.; Zhang, Q.; Dai, S.C.; Faughnan, M.E.; Kutryk, M.J.B. Decreased levels of miR-28-5p and miR-361-3p and increased levels of insulin-like growth factor 1 mRNA in mononuclear cells from patients with hereditary hemorrhagic telangiectasia (1). Can. J. Physiol. Pharmacol. 2019, 97, 562–569. [Google Scholar] [CrossRef] [PubMed]
- Zhang, Q.; Kandic, I.; Faughnan, M.E.; Kutryk, M.J. Elevated circulating microRNA-210 levels in patients with hereditary hemorrhagic telangiectasia and pulmonary arteriovenous malformations: A potential new biomarker. Biomarkers 2013, 18, 23–29. [Google Scholar] [CrossRef] [PubMed]
- Deng, L.; Blanco, F.J.; Stevens, H.; Lu, R.; Caudrillier, A.; McBride, M.; McClure, J.D.; Grant, J.; Thomas, M.; Frid, M.; et al. MicroRNA-143 Activation Regulates Smooth Muscle and Endothelial Cell Crosstalk in Pulmonary Arterial Hypertension. Circ. Res. 2015, 117, 870–883. [Google Scholar] [CrossRef]
- Shrestha, A.; Mukhametshina, R.T.; Taghizadeh, S.; Vasquez-Pacheco, E.; Cabrera-Fuentes, H.; Rizvanov, A.; Mari, B.; Carraro, G.; Bellusci, S. MicroRNA-142 is a multifaceted regulator in organogenesis, homeostasis, and disease. Dev. Dyn. 2017, 246, 285–290. [Google Scholar] [CrossRef] [PubMed] [Green Version]
- Wang, Z.; Liu, Z.; Fang, X.; Yang, H. MiR-142-5p Suppresses Tumorigenesis by Targeting PIK3CA in Non-Small Cell Lung Cancer. Cell. Physiol. Biochem. 2017, 43, 2505–2515. [Google Scholar] [CrossRef] [Green Version]
- Chen, X.; Xu, X.; Pan, B.; Zeng, K.; Xu, M.; Liu, X.; He, B.; Pan, Y.; Sun, H.; Wang, S. miR-150-5p suppresses tumor progression by targeting VEGFA in colorectal cancer. Aging 2018, 10, 3421–3437. [Google Scholar] [CrossRef]
- Li, Y.; Ren, W.; Wang, X.; Yu, X.; Cui, L.; Li, X.; Zhang, X.; Shi, B. MicroRNA-150 relieves vascular remodeling and fibrosis in hypoxia-induced pulmonary hypertension. Biomed. Pharmacother. 2019, 109, 1740–1749. [Google Scholar] [CrossRef]
- Lu, Y.; Wen, H.; Huang, J.; Liao, P.; Liao, H.; Tu, J.; Zeng, Y. Extracellular vesicle-enclosed miR-486-5p mediates wound healing with adipose-derived stem cells by promoting angiogenesis. J. Cell. Mol. Med. 2020, 24, 9590–9604. [Google Scholar] [CrossRef] [PubMed]
- Li, Q.; Xu, Y.; Lv, K.; Wang, Y.; Zhong, Z.; Xiao, C.; Zhu, K.; Ni, C.; Wang, K.; Kong, M.; et al. Small extracellular vesicles containing miR-486-5p promote angiogenesis after myocardial infarction in mice and nonhuman primates. Sci. Transl. Med. 2021, 13, eabb0202. [Google Scholar] [CrossRef] [PubMed]
- Martinez-Micaelo, N.; Beltran-Debon, R.; Baiges, I.; Faiges, M.; Alegret, J.M. Specific circulating microRNA signature of bicuspid aortic valve disease. J. Transl. Med. 2017, 15, 76. [Google Scholar] [CrossRef] [Green Version]
- Semo, J.; Chernin, G.; Jonas, M.; Shimoni, S.; George, J. Deletion of the Mir-106b~ 25 MicroRNA cluster attenuates atherosclerosis in Apolipoprotein E knockout mice. Lipids Health Dis. 2019, 18, 208. [Google Scholar] [CrossRef] [PubMed] [Green Version]
- Han, X.; Wang, H.; Li, Y.; Liu, L.; Gao, S. A 2 miRNAs-based signature for the diagnosis of atherosclerosis. BMC Cardiovasc. Disord. 2021, 21, 150. [Google Scholar] [CrossRef]
- Shang, A.; Wang, X.; Gu, C.; Liu, W.; Sun, J.; Zeng, B.; Chen, C.; Ji, P.; Wu, J.; Quan, W.; et al. Exosomal miR-183-5p promotes angiogenesis in colorectal cancer by regulation of FOXO1. Aging 2020, 12, 8352–8371. [Google Scholar] [CrossRef]
- Chen, X.; Yang, F.; Zhang, T.; Wang, W.; Xi, W.; Li, Y.; Zhang, D.; Huo, Y.; Zhang, J.; Yang, A.; et al. MiR-9 promotes tumorigenesis and angiogenesis and is activated by MYC and OCT4 in human glioma. J. Exp. Clin. Cancer Res. 2019, 38, 99. [Google Scholar] [CrossRef] [PubMed] [Green Version]
- Lu, J.; Liu, Q.H.; Wang, F.; Tan, J.J.; Deng, Y.Q.; Peng, X.H.; Liu, X.; Zhang, B.; Xu, X.; Li, X.P. Exosomal miR-9 inhibits angiogenesis by targeting MDK and regulating PDK/AKT pathway in nasopharyngeal carcinoma. J. Exp. Clin. Cancer Res. 2018, 37, 147. [Google Scholar] [CrossRef] [Green Version]
- Chen, C.; Huang, Z.; Mo, X.; Song, Y.; Li, X.; Zhang, M. The circular RNA 001971/miR-29c-3p axis modulates colorectal cancer growth, metastasis, and angiogenesis through VEGFA. J. Exp. Clin. Cancer Res. 2020, 39, 91. [Google Scholar] [CrossRef]
- Fan, Y.C.; Mei, P.J.; Chen, C.; Miao, F.A.; Zhang, H.; Li, Z.L. MiR-29c inhibits glioma cell proliferation, migration, invasion and angiogenesis. J. Neurooncol. 2013, 115, 179–188. [Google Scholar] [CrossRef] [PubMed]
- Zhao, S.; Gordon, W.; Du, S.; Zhang, C.; He, W.; Xi, L.; Mathur, S.; Agostino, M.; Paradis, T.; von Schack, D.; et al. QuickMIRSeq: A pipeline for quick and accurate quantification of both known miRNAs and isomiRs by jointly processing multiple samples from microRNA sequencing. BMC Bioinform. 2017, 18, 180. [Google Scholar] [CrossRef] [Green Version]
- Tam, S.; Tsao, M.S.; McPherson, J.D. Optimization of miRNA-seq data preprocessing. Brief Bioinform 2015, 16, 950–963. [Google Scholar] [CrossRef] [Green Version]
- Robinson, M.D.; Oshlack, A. A scaling normalization method for differential expression analysis of RNA-seq data. Genome Biol. 2010, 11, R25. [Google Scholar] [CrossRef] [Green Version]
- Love, M.I.; Huber, W.; Anders, S. Moderated estimation of fold change and dispersion for RNA-seq data with DESeq2. Genome Biol. 2014, 15, 550. [Google Scholar] [CrossRef] [Green Version]
- Tarazona, S.; Furio-Tari, P.; Turra, D.; Pietro, A.D.; Nueda, M.J.; Ferrer, A.; Conesa, A. Data quality aware analysis of differential expression in RNA-seq with NOISeq R/Bioc package. Nucleic Acids Res. 2015, 43, e140. [Google Scholar] [CrossRef] [PubMed] [Green Version]
- Murtagh, F.; Legendre, P. Ward’s Hierarchical Agglomerative Clustering Method: Which Algorithms Implement Ward’s Criterion? J. Classif. 2014, 31, 274–295. [Google Scholar] [CrossRef] [Green Version]
- Chou, C.H.; Shrestha, S.; Yang, C.D.; Chang, N.W.; Lin, Y.L.; Liao, K.W.; Huang, W.C.; Sun, T.H.; Tu, S.J.; Lee, W.H.; et al. miRTarBase update 2018: A resource for experimentally validated microRNA-target interactions. Nucleic Acids Res. 2018, 46, D296–D302. [Google Scholar] [CrossRef]
- Sticht, C.; De La Torre, C.; Parveen, A.; Gretz, N. miRWalk: An online resource for prediction of microRNA binding sites. PLoS ONE 2018, 13, e0206239. [Google Scholar] [CrossRef]
- Mi, H.; Muruganujan, A.; Huang, X.; Ebert, D.; Mills, C.; Guo, X.; Thomas, P.D. Protocol Update for large-scale genome and gene function analysis with the PANTHER classification system (v.14.0). Nat. Protoc. 2019, 14, 703–721. [Google Scholar] [CrossRef]
- Genin, M.; Clement, F.; Fattaccioli, A.; Raes, M.; Michiels, C. M1 and M2 macrophages derived from THP-1 cells differentially modulate the response of cancer cells to etoposide. BMC Cancer 2015, 15, 577. [Google Scholar] [CrossRef] [Green Version]


| Panther Pathways 1 | Genes in Reference 2 | Genes in List 3 | FE 4 | FDR 5 |
|---|---|---|---|---|
| Gonadotropin-releasing hormone receptor pathway (P06664) | 230 | 64 | 6.41 | 2.13 × 10⁻²⁶ |
| CCKR signaling map (P06959) | 174 | 54 | 7.15 | 3.27 × 10⁻²⁴ |
| Apoptosis signaling pathway (P00006) | 118 | 45 | 8.79 | 3.39 × 10⁻²³ |
| p53 pathway feedback loops 2 (P04398) | 51 | 30 | 13.56 | 1.42 × 10⁻¹⁹ |
| Angiogenesis (P00005) | 173 | 47 | 6.26 | 2.69 × 10⁻¹⁹ |
| p53 pathway (P00059) | 87 | 33 | 8.74 | 4.09 × 10⁻¹⁷ |
| EGF receptor signaling pathway (P00018) | 134 | 39 | 6.71 | 5.68 × 10⁻¹⁷ |
| Interleukin signaling pathway (P00036) | 89 | 32 | 8.29 | 3.72 × 10⁻¹⁶ |
| Ras pathway (P04393) | 74 | 29 | 9.03 | 1.69 × 10⁻¹⁵ |
| Inflammation mediated by chemokine and cytokine signaling pathway (P00031) | 260 | 50 | 4.43 | 2.27 × 10⁻¹⁵ |
| PDGF signaling pathway (P00047) | 148 | 36 | 5.61 | 8.73 × 10⁻¹⁴ |
| TGF-beta signaling pathway (P00052) | 97 | 28 | 6.65 | 2.46 × 10⁻¹² |
| AUC | Sensitivity | Specificity | ||||||
|---|---|---|---|---|---|---|---|---|
| % | 95% CI | p-Value | % | 95% CI | % | 95% CI | ||
| miR-9 | HHT-CTL | 73.3 | 59.3–87.4 | 0.0036 | 66.7 | 49.0–81.4 | 100.0 | 83.9–100.0 |
| HHT1-CTL | 62.2 | 40.7–83.8 | 0.1951 | 61.1 | 35.7–82.7 | 90.5 | 69.6–98.9 | |
| HHT2-CTL | 84.4 | 68.2–100.1 | 0.0003 | 83.3 | 58.6–96.4 | 100.0 | 83.9–100 | |
| HHT1-HHT2 | 76.9 | 60.9–92.9 | 0.0059 | 77.8 | 52.4–93.6 | 77.8 | 52.4–93.6 | |
| miR-29c | HHT-CTL | 77.0 | 61.8–92.2 | 0.0022 | 75 | 55.1–89.3 | 100.0 | 81.5–100.0 |
| HHT1-CTL | 50.4 | 24.4–76.5 | 0.9681 | 46.15 | 19.2–74.9 | 100.0 | 81.5–100.0 | |
| HHT2-CTL | 100.0 | 100.0–100.0 | <0.0001 | 100.0 | 78.2–100.0 | 100.0 | 81.5–100.0 | |
| HHT1-HHT2 | 76.7 | 57.4–95.9 | 0.0166 | 100.0 | 78.2–100.0 | 53.9 | 25.1–80.8 | |
| miR-106b | HHT-CTL | 67.7 | 50.5–84.8 | 0.0452 | 67.9 | 47.6–84.1 | 94.4 | 72.7–99.9 |
| HHT1-CTL | 99.1 | 96.7–100.0 | <0.0001 | 100.0 | 73.5–100.0 | 94.4 | 72.7–99.9 | |
| HHT2-CTL | 55.9 | 31.7–80.1 | 0.5575 | 50.0 | 24.7–75.3 | 100.0 | 81.5–100.0 | |
| HHT1-HHT2 | 72.4 | 52.9–91.9 | 0.0459 | 56.3 | 29.9–80.2 | 100.0 | 73.5–100.0 | |
| miR-142 | HHT-CTL | 80.7 | 68.8–92.5 | 0.0002 | 75.8 | 57.7–88.9 | 90.5 | 69.6–98.8 |
| HHT1-CTL | 87.7 | 72.6–100.0 | 0.0004 | 83.3 | 51.6–97.9 | 90.5 | 69.6–98.8 | |
| HHT2-CTL | 76.6 | 61.1–92.1 | 0.0031 | 71.4 | 47.8–88.7 | 90.5 | 69.6–98.8 | |
| HHT1-HHT2 | 50.4 | 30.2–70.6 | 0.9701 | 100.0 | 83.9–100.0 | 8.3 | 0.2–38.5 | |
| miR-143 | HHT-CTL | 69.2 | 50.1–88.2 | 0.0336 | 66.7 | 43.0–85.4 | 90.5 | 69.6–98.8 |
| HHT1-CTL | 74.2 | 49.9–98.5 | 0.0225 | 75.0 | 42.8–94.5 | 95.2 | 76.2–99.9 | |
| HHT2-CTL | 62.4 | 32.9–92.0 | 0.2876 | 55.6 | 21.2–86.3 | 90.5 | 69.6–98.8 | |
| HHT1-HHT2 | 66.7 | 41.8–91.5 | 0.2009 | 33.3 | 7.5–70.1 | 100.0 | 73.5–100.0 | |
| miR-150 | HHT-CTL | 100.0 | 100.0–100.0 | <0.0001 | 100.0 | 89.4–100.0 | 100.0 | 83.9–100.0 |
| HHT1-CTL | 100.0 | 100.0–100.0 | <0.0001 | 100.0 | 78.2–100.0 | 100.0 | 83.9–100.0 | |
| HHT2-CTL | 100.0 | 100.0–100.0 | <0.0001 | 100.0 | 83.9–100.0 | 100.0 | 83.9–100.0 | |
| HHT1-HHT2 | 60.0 | 39.7–80.3 | 0.3122 | 85.7 | 63.7–97.0 | 60.0 | 32.3–83.7 | |
| miR-183 | HHT-CTL | 54.4 | 38.7–70.1 | 0.5947 | 39.4 | 22.9–57.9 | 100.0 | 83.2–100.0 |
| HHT1-CTL | 79.6 | 61.8–97.4 | 0.0057 | 75.0 | 42.8–94.5 | 85.0 | 62.1–96.8 | |
| HHT2-CTL | 73.8 | 61.8–97.4 | 0.0091 | 61.9 | 38.4–81.9 | 100.0 | 83.2–100.0 | |
| HHT1-HHT2 | 81.4 | 66.2–96.5 | 0.0031 | 81.0 | 58.1–94.6 | 83.3 | 51.6–97.9 | |
| miR-486 | HHT-CTL | 98.8 | 96.7–100.0 | <0.0001 | 100.0 | 90.3–100.0 | 90.5 | 69.6–98.8 |
| HHT1-CTL | 99.5 | 98.1–100.0 | <0.0001 | 100.0 | 81.5–100.0 | 95.2 | 76.2–99.9 | |
| HHT2-CTL | 98.2 | 94.9–100.0 | <0.0001 | 100.0 | 81.5–100.0 | 90.5 | 69.6–98.8 | |
| HHT1-HHT2 | 51.5 | 31.5–71.6 | 0.8743 | 61.1 | 35.7–82.7 | 61.1 | 35.7–82.7 | |
| miR-654 | HHT-CTL | 62.9 | 45.8–79.9 | 0.1435 | 57.1 | 37.2–75.5 | 100.0 | 81.5–100.0 |
| HHT1-CTL | 62.8 | 38.7–86.9 | 0.2298 | 46.2 | 19.2–74.9 | 100.0 | 81.5–100.0 | |
| HHT2-CTL | 85.2 | 67.9–100.0 | 0.0006 | 80.0 | 51.9–95.7 | 100.0 | 81.5–100.0 | |
| HHT1-HHT2 | 75.9 | 57.3–94.5 | 0.02 | 86.7 | 59.5–98.3 | 69.2 | 38.6–90.9 | |
| M1 | M2 | PAEC | PASMC | |||||
|---|---|---|---|---|---|---|---|---|
| Cyto | Exo | Cyto | Exo | Cyto | Exo | Cyto | Exo | |
| miR-9 | + | + | + | + | − | − | − | − |
| miR-29c | + | + | + | + | + | + | + | + |
| miR-106b | + | + | + | + | + | + | + | + |
| miR-142 | + | + | + | + | − | − | − | − |
| miR-143 | + | − | + | − | + | − | + | + |
| miR-150 | − | − | − | − | + | + | − | − |
| miR-183 | + | + | + | + | − | − | − | − |
| miR-486 | + | − | + | − | + | + | − | − |
| miR-654 | − | − | − | − | + | − | + | + |
Publisher’s Note: MDPI stays neutral with regard to jurisdictional claims in published maps and institutional affiliations. |
© 2021 by the authors. Licensee MDPI, Basel, Switzerland. This article is an open access article distributed under the terms and conditions of the Creative Commons Attribution (CC BY) license (https://creativecommons.org/licenses/by/4.0/).
Share and Cite
Pozo-Agundo, A.; Villaescusa, N.; Martorell-Marugán, J.; Soriano, O.; Leyva, S.; Jódar-Reyes, A.B.; Botella, L.M.; Carmona-Sáez, P.; Blanco, F.J. Identification of Exosomal MicroRNA Signature by Liquid Biopsy in Hereditary Hemorrhagic Telangiectasia Patients. Int. J. Mol. Sci. 2021, 22, 9450. https://doi.org/10.3390/ijms22179450
Pozo-Agundo A, Villaescusa N, Martorell-Marugán J, Soriano O, Leyva S, Jódar-Reyes AB, Botella LM, Carmona-Sáez P, Blanco FJ. Identification of Exosomal MicroRNA Signature by Liquid Biopsy in Hereditary Hemorrhagic Telangiectasia Patients. International Journal of Molecular Sciences. 2021; 22(17):9450. https://doi.org/10.3390/ijms22179450
Chicago/Turabian StylePozo-Agundo, Ana, Nerea Villaescusa, Jordi Martorell-Marugán, Olga Soriano, Socorro Leyva, Ana Belén Jódar-Reyes, Luisa María Botella, Pedro Carmona-Sáez, and Francisco Javier Blanco. 2021. "Identification of Exosomal MicroRNA Signature by Liquid Biopsy in Hereditary Hemorrhagic Telangiectasia Patients" International Journal of Molecular Sciences 22, no. 17: 9450. https://doi.org/10.3390/ijms22179450
APA StylePozo-Agundo, A., Villaescusa, N., Martorell-Marugán, J., Soriano, O., Leyva, S., Jódar-Reyes, A. B., Botella, L. M., Carmona-Sáez, P., & Blanco, F. J. (2021). Identification of Exosomal MicroRNA Signature by Liquid Biopsy in Hereditary Hemorrhagic Telangiectasia Patients. International Journal of Molecular Sciences, 22(17), 9450. https://doi.org/10.3390/ijms22179450