Article

Machine Learning-Based Radiomics Signatures for EGFR and KRAS Mutations Prediction in Non-Small-Cell Lung Cancer

1
Professional Master Program in Artificial Intelligence in Medicine, College of Medicine, Taipei Medical University, Taipei 106, Taiwan
2
Research Center for Artificial Intelligence in Medicine, Taipei Medical University, Taipei 106, Taiwan
3
Translational Imaging Research Center, Taipei Medical University Hospital, Taipei 110, Taiwan
4
International Master/Ph.D. Program in Medicine, College of Medicine, Taipei Medical University, Taipei 110, Taiwan
5
Oncology Center, Bai Chay Hospital, Quang Ninh 20000, Vietnam
6
Department of Medical Imaging, Taipei Medical University Hospital, Taipei 11031, Taiwan
7
Department of Radiology, School of Medicine, College of Medicine, Taipei Medical University, Taipei 11031, Taiwan
*
Authors to whom correspondence should be addressed.
Int. J. Mol. Sci. 2021, 22(17), 9254; https://doi.org/10.3390/ijms22179254
Submission received: 31 July 2021 / Revised: 22 August 2021 / Accepted: 25 August 2021 / Published: 26 August 2021
(This article belongs to the Special Issue Radiomics: Advanced Techniques in Oncologic Imaging)

Abstract

:
Early identification of epidermal growth factor receptor (EGFR) and Kirsten rat sarcoma viral oncogene homolog (KRAS) mutations is crucial for selecting a therapeutic strategy for patients with non-small-cell lung cancer (NSCLC). We proposed a machine learning-based model for feature selection and prediction of EGFR and KRAS mutations in patients with NSCLC by including the least number of the most semantic radiomics features. We included a cohort of 161 patients from 211 patients with NSCLC from The Cancer Imaging Archive (TCIA) and analyzed 161 low-dose computed tomography (LDCT) images for detecting EGFR and KRAS mutations. A total of 851 radiomics features, which were classified into 9 categories, were obtained through manual segmentation and radiomics feature extraction from LDCT. We evaluated our models using a validation set consisting of 18 patients derived from the same TCIA dataset. The results showed that the genetic algorithm plus XGBoost classifier exhibited the most favorable performance, with an accuracy of 0.836 and 0.86 for detecting EGFR and KRAS mutations, respectively. We demonstrated that a noninvasive machine learning-based model including the least number of the most semantic radiomics signatures could robustly predict EGFR and KRAS mutations in patients with NSCLC.

1. Introduction

Lung cancer is one of the most fatal cancers; it has the second highest prevalence globally, resulting in 18% of cancer cases and 11.4% of deaths globally [1]. Non-small-cell lung cancer (NSCLC) accounts for >85% of reported lung cancers, with adenocarcinoma being the most common pathological type of NSCLC [2]. In 2020, the 5-year overall survival rate of patients with lung cancer was <15%, and 228,820 new cases of lung cancer and 135,720 deaths from lung cancer were estimated to occur [3].
Epidermal growth factor receptor (EGFR) and Kirsten rat sarcoma viral oncogene homolog (KRAS) are the two most frequently observed mutations in patients with NSCLC [4]. Patients with EGFR mutations exhibit higher sensitivity to gefitinib and erlotinib, whereas those with KRAS mutations are prone to drug resistance [4,5,6,7,8,9]. Thus, the early detection of EGFR and KRAS mutations can facilitate the selection of treatment modalities for specific mutation types and enable efficient short- and long-term management, thus improving the prognosis and prolonging the survival duration of patients with NSCLC [4]. Because the number of patients harboring both mutations is considerably limited, the confirmation of one mutation can lead to the exclusion of the other mutation [5]. Although traditional diagnostic methods used to identify mutated sequences in tumor cells have contributed to the advancement of targeted therapies, they are highly invasive and time intensive [9]. Therefore, new noninvasive screening methods should be urgently developed to overcome the drawbacks of invasive traditional approaches [10,11,12,13,14].
With the development of state-of-the-art artificial intelligence techniques, a detailed radiographic quantitative analysis of tumor characteristics can be performed using ubiquitous medical images instead of a qualitative assessment [15]. The aforementioned process is referred to as “radiomics”, which involves the extraction of tumoral features and the evaluation of the association between noninvasive multimodality imaging and pathophysiology [15,16]. Noninvasive models demonstrated a higher predictive power than did routine clinical diagnostic methods [15,17,18,19,20,21,22] and could predict EGFR and KRAS mutations before treatment. In 2017, Gevaert et al. [20] used the decision tree algorithm to categorize the mutations of interest but failed to recognize the KRAS mutation using the algorithm. Furthermore, Shiri et al. [22] established a stochastic gradient descent model with semantic radiographic features and reported that the model exhibited satisfactory performance in identifying patients with NSCLC harboring the EGFR or KRAS mutation. However, the authors’ framework was complex because the model required various radiomics features to achieve high accuracy.
In the present study, we hypothesized that a machine learning-based feature selection and prediction model using the least semantic radiomics features from low-dose computed tomography (CT) findings can predict EGFR and KRAS mutations in patients with NSCLC. We used the public dataset from The Cancer Imaging Archive (TCIA) [23] published by Bakr et al. [24]. The proposed machine learning model is potentially useful for the early prediction of driver gene mutations in patients with NSCLC and thus facilitates early therapeutic intervention and improves overall outcomes.

2. Results

2.1. Patients’ Characteristics

We retrospectively identified a cohort of 211 patients with NSCLC; of these, 161 with confirmed EGFR and KRAS mutations who met the inclusion criteria [24] were included. Of the 161 patients, 143 (average age: 69.2 ± 8.84 years; 107 men and 36 women) and 18 (average age: 66.9 ± 13.85 years, 4 men and 14 women) were included in the training and validation sets, respectively. According to the exclusion criteria, we excluded 50 patients from the original dataset [24]. Compared with the training set, the validation set consisted of considerably younger patients and a lower proportion of men. No difference in smoking or recurrence status was noted between the training and validation sets. Most of the patients included in the training set had an adenocarcinoma-type tumor (n = 111), and only 3 patients had an unspecified histological type. All patients in the validation cohort had adenocarcinoma (n = 18). The number of patients with EGFR and KRAS mutations significantly differed between the two cohorts. However, the percentage of patients with cancer recurrence or progression did not significantly differ between the cohorts. No information regarding surgical or posttreatment outcomes was recorded. Table 1 lists the characteristics of patients included in our study.

2.2. Radiomics Signature Building

We performed feature selection analysis among different feature categories to investigate and identify crucial feature signatures for our models. The genetic algorithm (GA) [25] exhibited the highest accuracy in predicting both EGFR and KRAS mutations (Figure 1). The number of feature signatures was maintained as low as possible while achieving satisfactory performance.

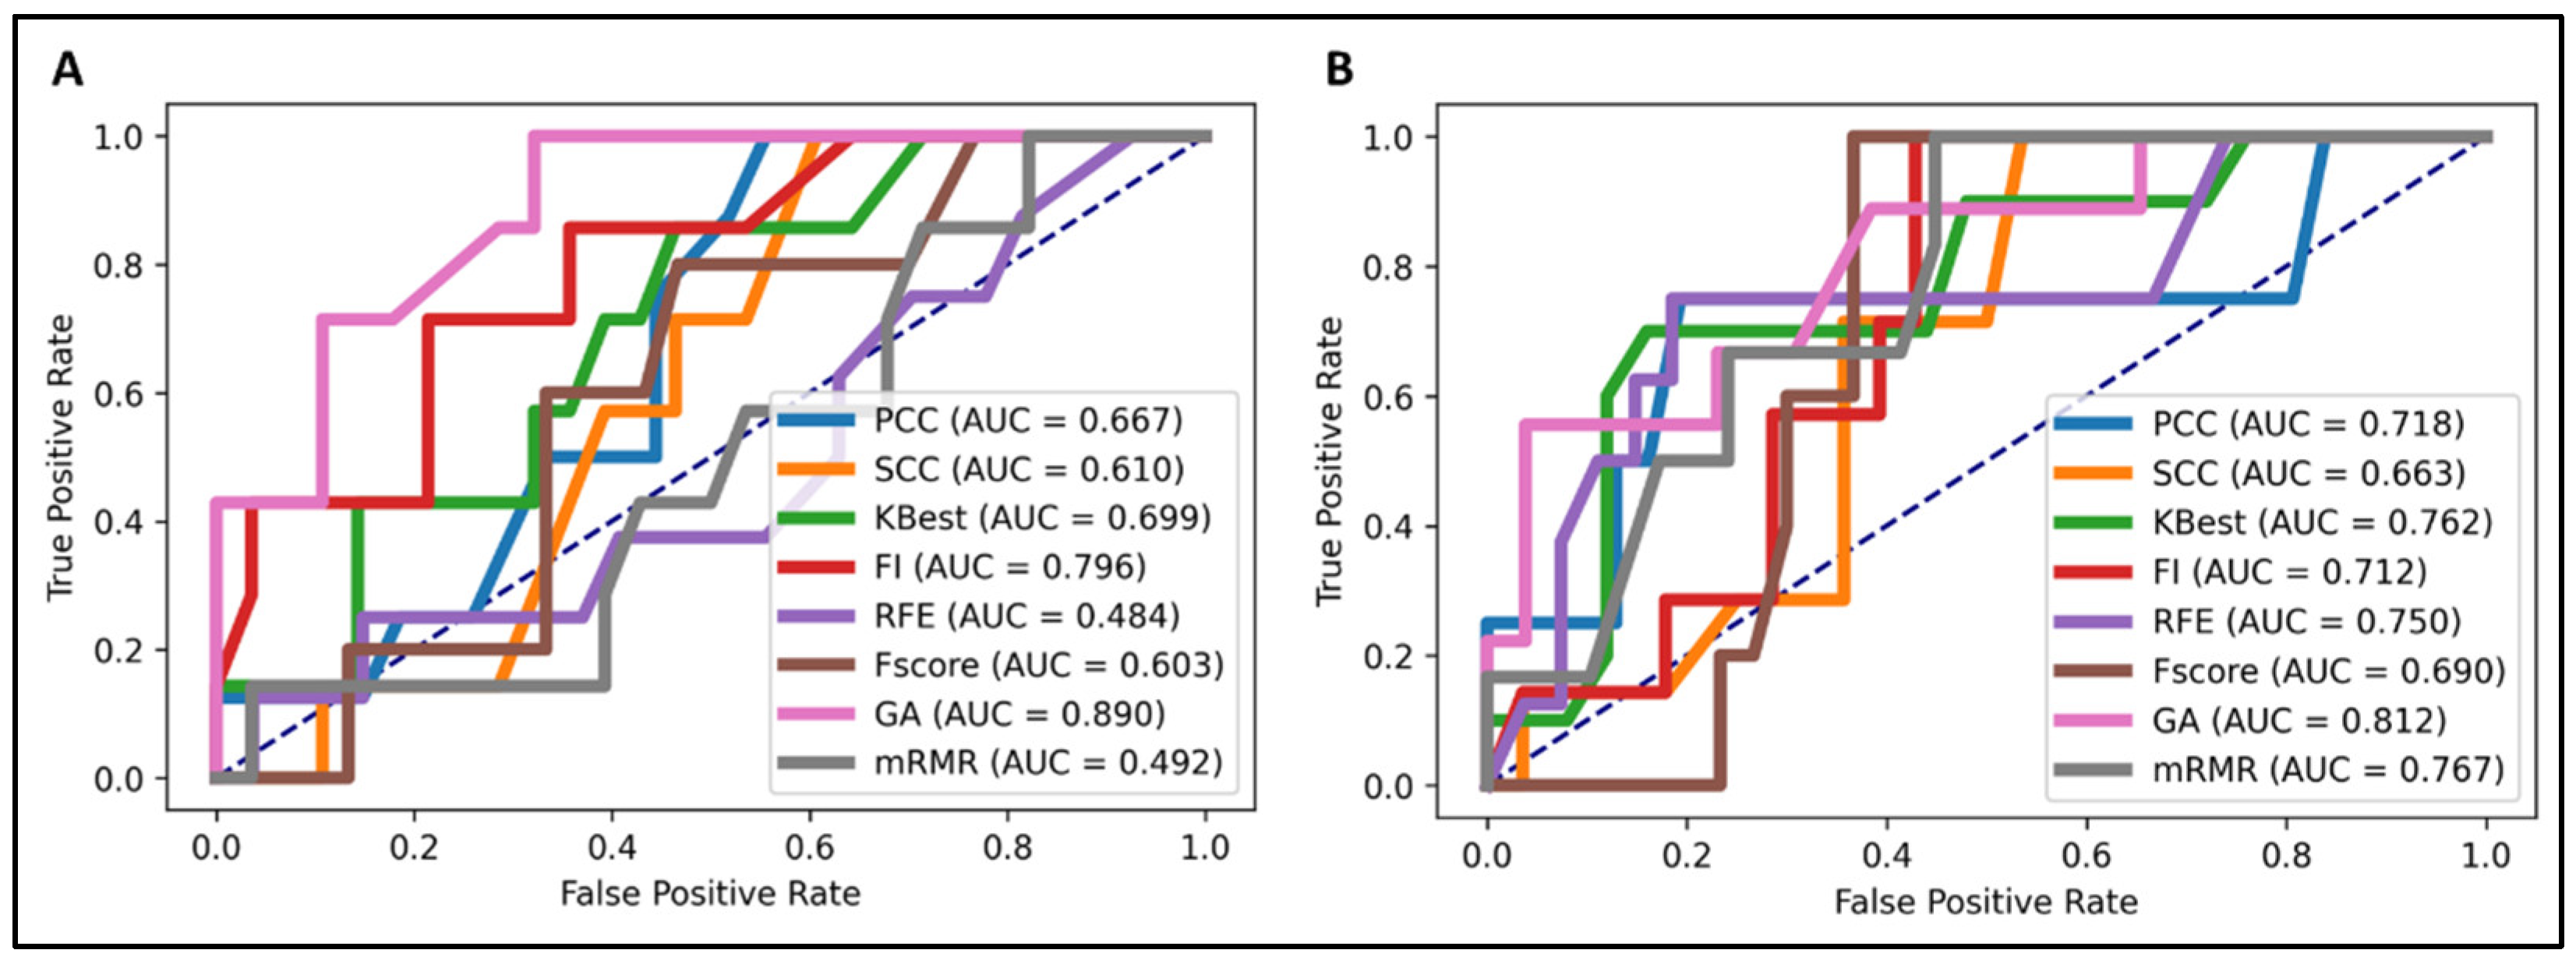
2.3. Supervised Learning Classification

After identifying optimal features using the GA, we examined the performance of different classification algorithms, namely, logistic regression (LR), k-nearest neighbors (kNN), random forest (RF), and eXtreme Gradient Boosting (XGBoost). On the basis of their performance, we subsequently determined the most appropriate algorithm for building the final classification model. In addition, we performed grid-search cross-validation to identify the most optimal parameters for all the aforementioned machine learning algorithms. XGBoost was superior to the other conventional machine learning algorithms in detecting both EGFR and KRAS mutations. As shown in Table 2, our XGBoost model exhibited a sensitivity of 43.5% and 55.6%, specificity of 94.6% and 89.3%, and accuracy of 84.5% and 77.2% in detecting EGFR and KRAS mutations, respectively.
Although the results were satisfactory, an imbalance was observed between sensitivity and specificity. Therefore, we applied the synthetic minority oversampling technique [26] to solve this imbalance problem. As shown in Table 2, we achieved a more balanced result with a sensitivity of 65.2% and 55.6% and a specificity of 88.2% and 95.4% for detecting EGFR and KRAS mutations, respectively. The XGBoost classifier demonstrated the most favorable performance, indicating that it was the optimal algorithm for solving this radiomics-related binomial classification problem.

2.4. Validation of Models

We combined the XGBoost classifier algorithm with each optimal feature selector. In addition, we applied our optimal models to validation data to evaluate their performance for unseen data. In this step, our model showed a sensitivity of 66.7% and 33.3%, specificity of 83.3% and 93.3%, and accuracy of 77.8% and 83.3% in detecting EGFR and KRAS mutations, respectively. The sensitivity for the KRAS mutation was lower because of limited data availability (we had only three KRAS mutant samples in the validation cohort, and our model could correctly predict one of them). By contrast, our model could correctly predict various KRAS wild-type samples with an accuracy of 93.3%. This result indicated the efficiency of our model when used for examining different datasets.

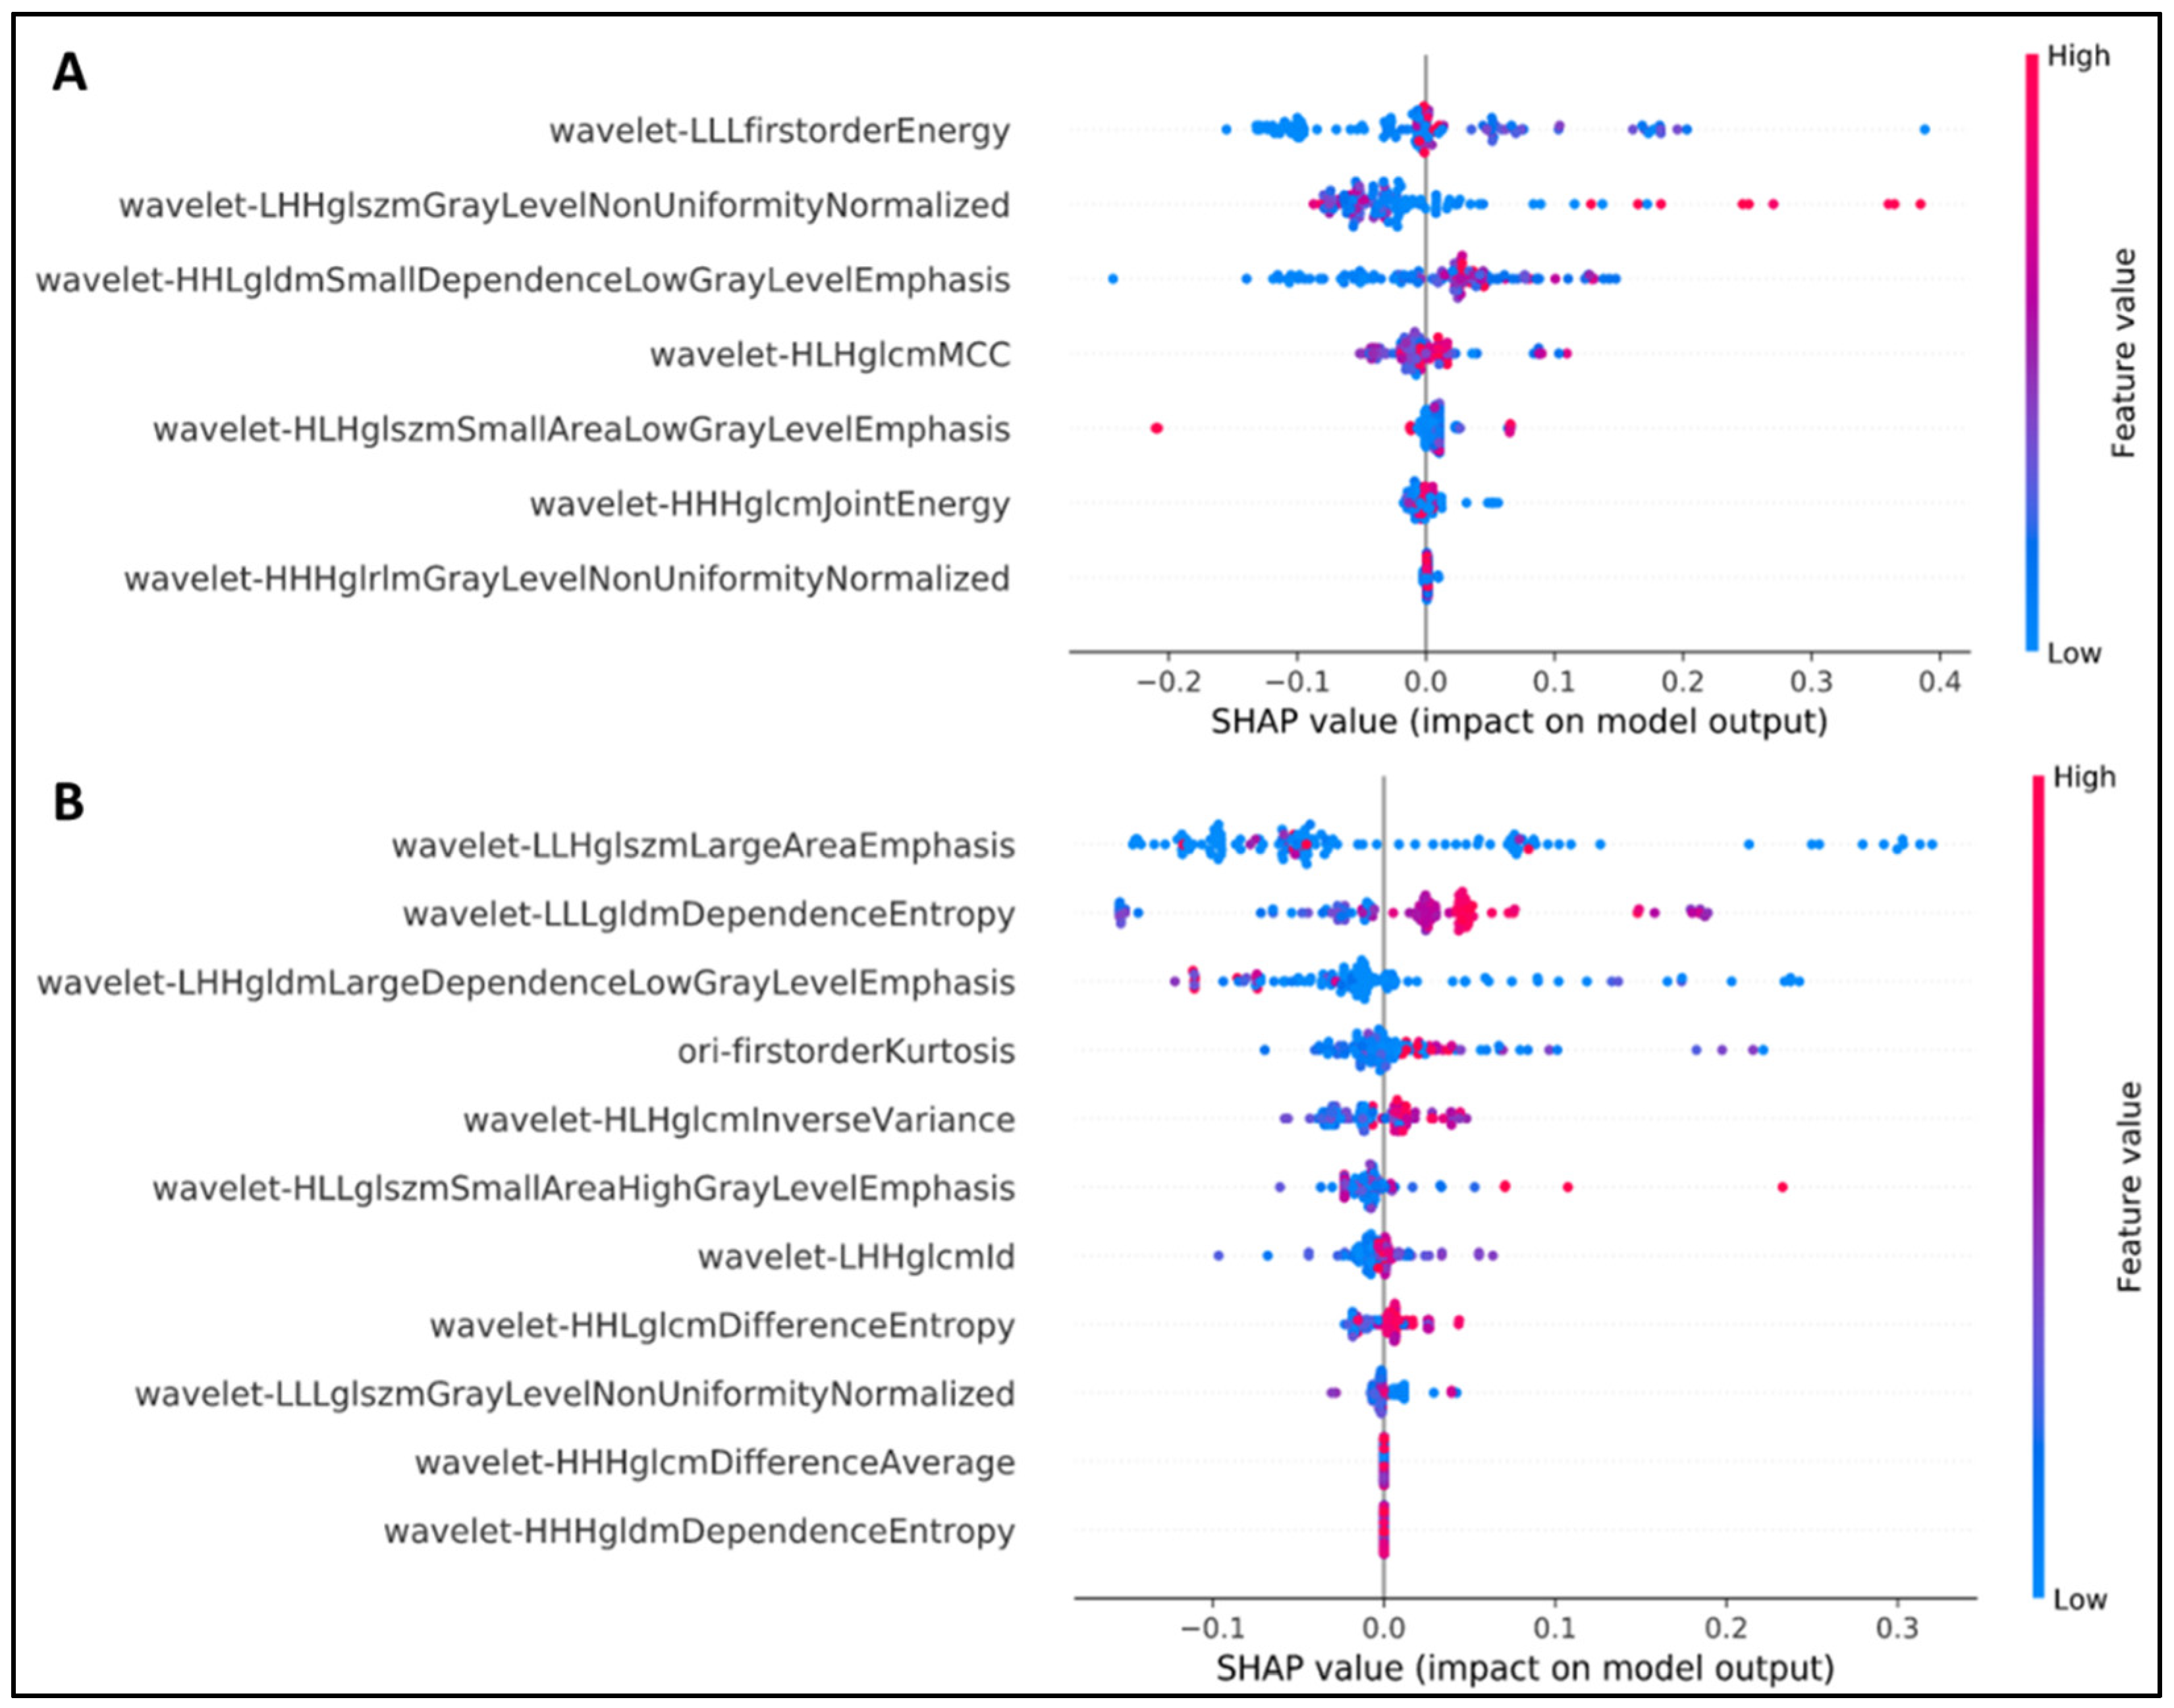
2.5. Explanation of Feature Selection Using SHAP

Shapley additive explanation (SHAP) analysis [27] was performed to explain the output of our machine learning model and radiomics feature set. As shown in Figure 2, all crucial features were obtained from the wavelet transform. The wavelet-based transform could more effectively improve the radiomics-based prediction model compared with the original radiomics feature. “Energy” was determined to be the most crucial feature; this finding is in accordance with those of previous studies.
Among the seven most favorable features identified in the first model, the wavelet LLL–first-order–energy feature contributed the most to the detection of EGFR status. The first-order statistics refer to the distribution of voxel intensities within the image region defined by the mask through commonly used and basic metrics. Energy is a quantity of voxel values within the regions of interest (ROIs), and a higher energy denotes a larger sum of squares of these values [28].
In terms of the KRAS detection task, the wavelet LLH–gray-level size zone matrix (GLSZM)–large area emphasis was the most appropriate feature. For more information, a GLSZM enumerates gray-level areas (i.e., the number of connected voxels sharing the similar intensity of the gray level in an image), whereas large area emphasis (LAE) measures the distribution of regions with a large area; a higher LAE value indicates the presence of greater size zones and more coarse textures [28].

2.6. Comparison with Previous Radiomics-Based EGFR and KRAS Prediction Models

We compared the predictive performance of our model with that of radiomics-based models used in previous studies for predicting EGFR and KRAS mutations. Pinheiro et al. [29], Shiri et al. [22], and Zhang et al. [30] used the same dataset as we did; thus, we compared their results with our findings. A detailed comparison is presented in Table 3 and Section 3.

3. Discussion

In our study, we proposed a comprehensive machine learning approach and feature selection assessment to efficiently detect EGFR and KRAS mutations in patients with NSCLC; early detection of these mutations can help in the administration of suitable individualized and targeted treatment options. The public dataset consisting of 211 patients with NSCLC was derived from a previous study on the TCIA [23,24]. Of these, 143 patients (116 EGFR and 114 KRAS mutation carriers) and 18 patients (6 EGFR and 3 KRAS mutation carriers) were included in the training and validation cohorts, respectively.
Our proposed model correctly predicted EGFR and KRAS mutations with an area under the curve (AUC) of 0.89 and 0.812, respectively. According to the results, it is observed that there were about 10% of examined patients that had false negatives or positives. To explain this, our strategy failed in those cases because of the limit of training data. The model might not have enough data to train sufficiently, and it has failed in some cases that they did not learn well. In the future, more comprehensive data should be retrieved to reach a better performance with less false positives and negatives. The AUC of the KRAS model in the validation set was lower than that in the other model due to imbalanced data; only 3 of 18 patients had the KRAS mutation. However, the specificity of this model was remarkably high (95.4%), indicating that our second model could still perform efficiently on different datasets regardless of their distribution. Moreover, we achieved these results by including only 7 and 11 features in the EGFR and KRAS model, respectively.
Pinheiro et al. [29] and Shiri et al. [22] have analyzed and interpreted radiomics features extracted from the same public dataset included in the current study [23,24]. Pinheiro et al. introduced a model built on the XGBoost algorithm and its feature importance ranking function. Utilizing the similar classifier to predict EGFR mutations, the authors selected a subset of the 37 most semantic radiomics features, yielding an AUC of 0.7458 (vs. 0.89 in our model); however, the model failed to detect the KRAS mutation with an AUC of 0.5035 (vs. 0.812 in our model). The decreased efficiency of the model in classifying EGFR and KRAS mutations [29] might be due to differences in feature selection methods. Despite the use of the same classifier algorithm, the authors employed Pearson’s correlation coefficient method to exclude the least significant features. The radiomics features are continuous numerical variables that may contain outliers, resulting in a low or even insignificant correlation coefficient between features [31].
The model developed by Shiri et al. [22] demonstrated more favorable performance in detecting the KRAS mutation. Their reported AUC of 0.83 was slightly higher than our AUC of 0.812. However, the detection of the EGFR mutation did not yield a similar outcome; our EGFR model could generate a superior result to the “stochastic gradient boosting–select from model” ensemble, with AUCs of 0.89 and 0.78 for our study and previous study, respectively. Their results were not as distinct as those of our model. Therefore, our model exhibited relatively stable performance in the detection of both mutation types.
Zhang et al. [30] conducted a retrospective single-center study of 248 patients with lung adenocarcinoma (135 men and 113 women, mean age of 62.43 ± 9.19 years) and investigated the prediction capacity of pretherapy 18F-FDG PET/CT-based radiomics features for EGFR mutation status in patients with NSCLC. All patients were histologically confirmed to have the EGFR mutation (i.e., mutant or wild-type) and underwent 18F-FDG PET/CT 1 month prior to treatment. The original dataset was then randomly split into training and validation sets containing 175 and 73 patients, respectively. The LIFEx package [32] was used to extract 47 PET radiomics features and 45 CT radiomics features in combination with the segmentation of ROIs by two radiologists. The 10 most semantic predictive features were retained using the Mann–Whitney U test and the “least absolute shrinkage and selection operator” regression analysis (10-fold cross-validation), and the establishment of the model was based on the LR algorithm to measure the “rad-score” for each patient. In terms of the predictive efficacy of the EGFR mutation, the model containing only signature radiomics features or clinical features demonstrated a higher AUC than did our proposed model (i.e., 0.85 vs. 0.845), whereas the AUC generated from the clinical model was significantly lower than that of our model (i.e., 0.78 vs. 0.845). Considering the higher sensitivity (91.7 vs. 69.6) and lower specificity (70.3 vs. 83.9), the rad-score and clinical complex model demonstrated, to some extent, a lower accuracy (80.8 vs. 81.0) but a significantly higher AUC (0.87 vs. 0.845). The identification of EGFR mutants is relevant to clinical practice because it can help determine the therapeutic strategy for specific individuals carrying mutations associated with improved sensitivity to gefitinib and erlotinib [4,5,7]. In this study, with the inclusion of only 6 EGFR mutation carriers in the validation set compared with 12 EGFR wild-type carriers, the sensitivity score was acceptable. For the subsequent steps, we boosted our model to increase sensitivity and detect the mutants more efficiently; however, with only seven semantic radiomics features, the EGFR model could predict imbalanced data, thus demonstrating itself as a valuable predictive model for further studies.
Although the performance of our models was considerably promising, our study has various limitations that should be addressed. First, the original dataset [23,24] consisted of 211 patients; however, only 161 patients were included, and no external validation set was considered. Although the results were favorable, we must still evaluate the predictive performance of our two models by including a broader cohort of patients with NSCLC with known EGFR and KRAS mutation status. Second, we must advance the model’s capacity for handling imbalanced data, thereby generalizing the prediction outcome to more datasets. Third, our study could apply the state-of-the-art deep learning algorithm to implement the classification task. Many studies have successfully developed models to solve this problem [30,33,34,35,36] with satisfactory results. These findings encourage us to conduct future studies using neural networks to build the baseline model. Finally, the radiogenomics model can be considered by applying it to more comprehensive genotypes such as EGFR-TKI sensitivity [37] or exon levels [38]. Thereafter, it can be applied for clinical settings in the future.

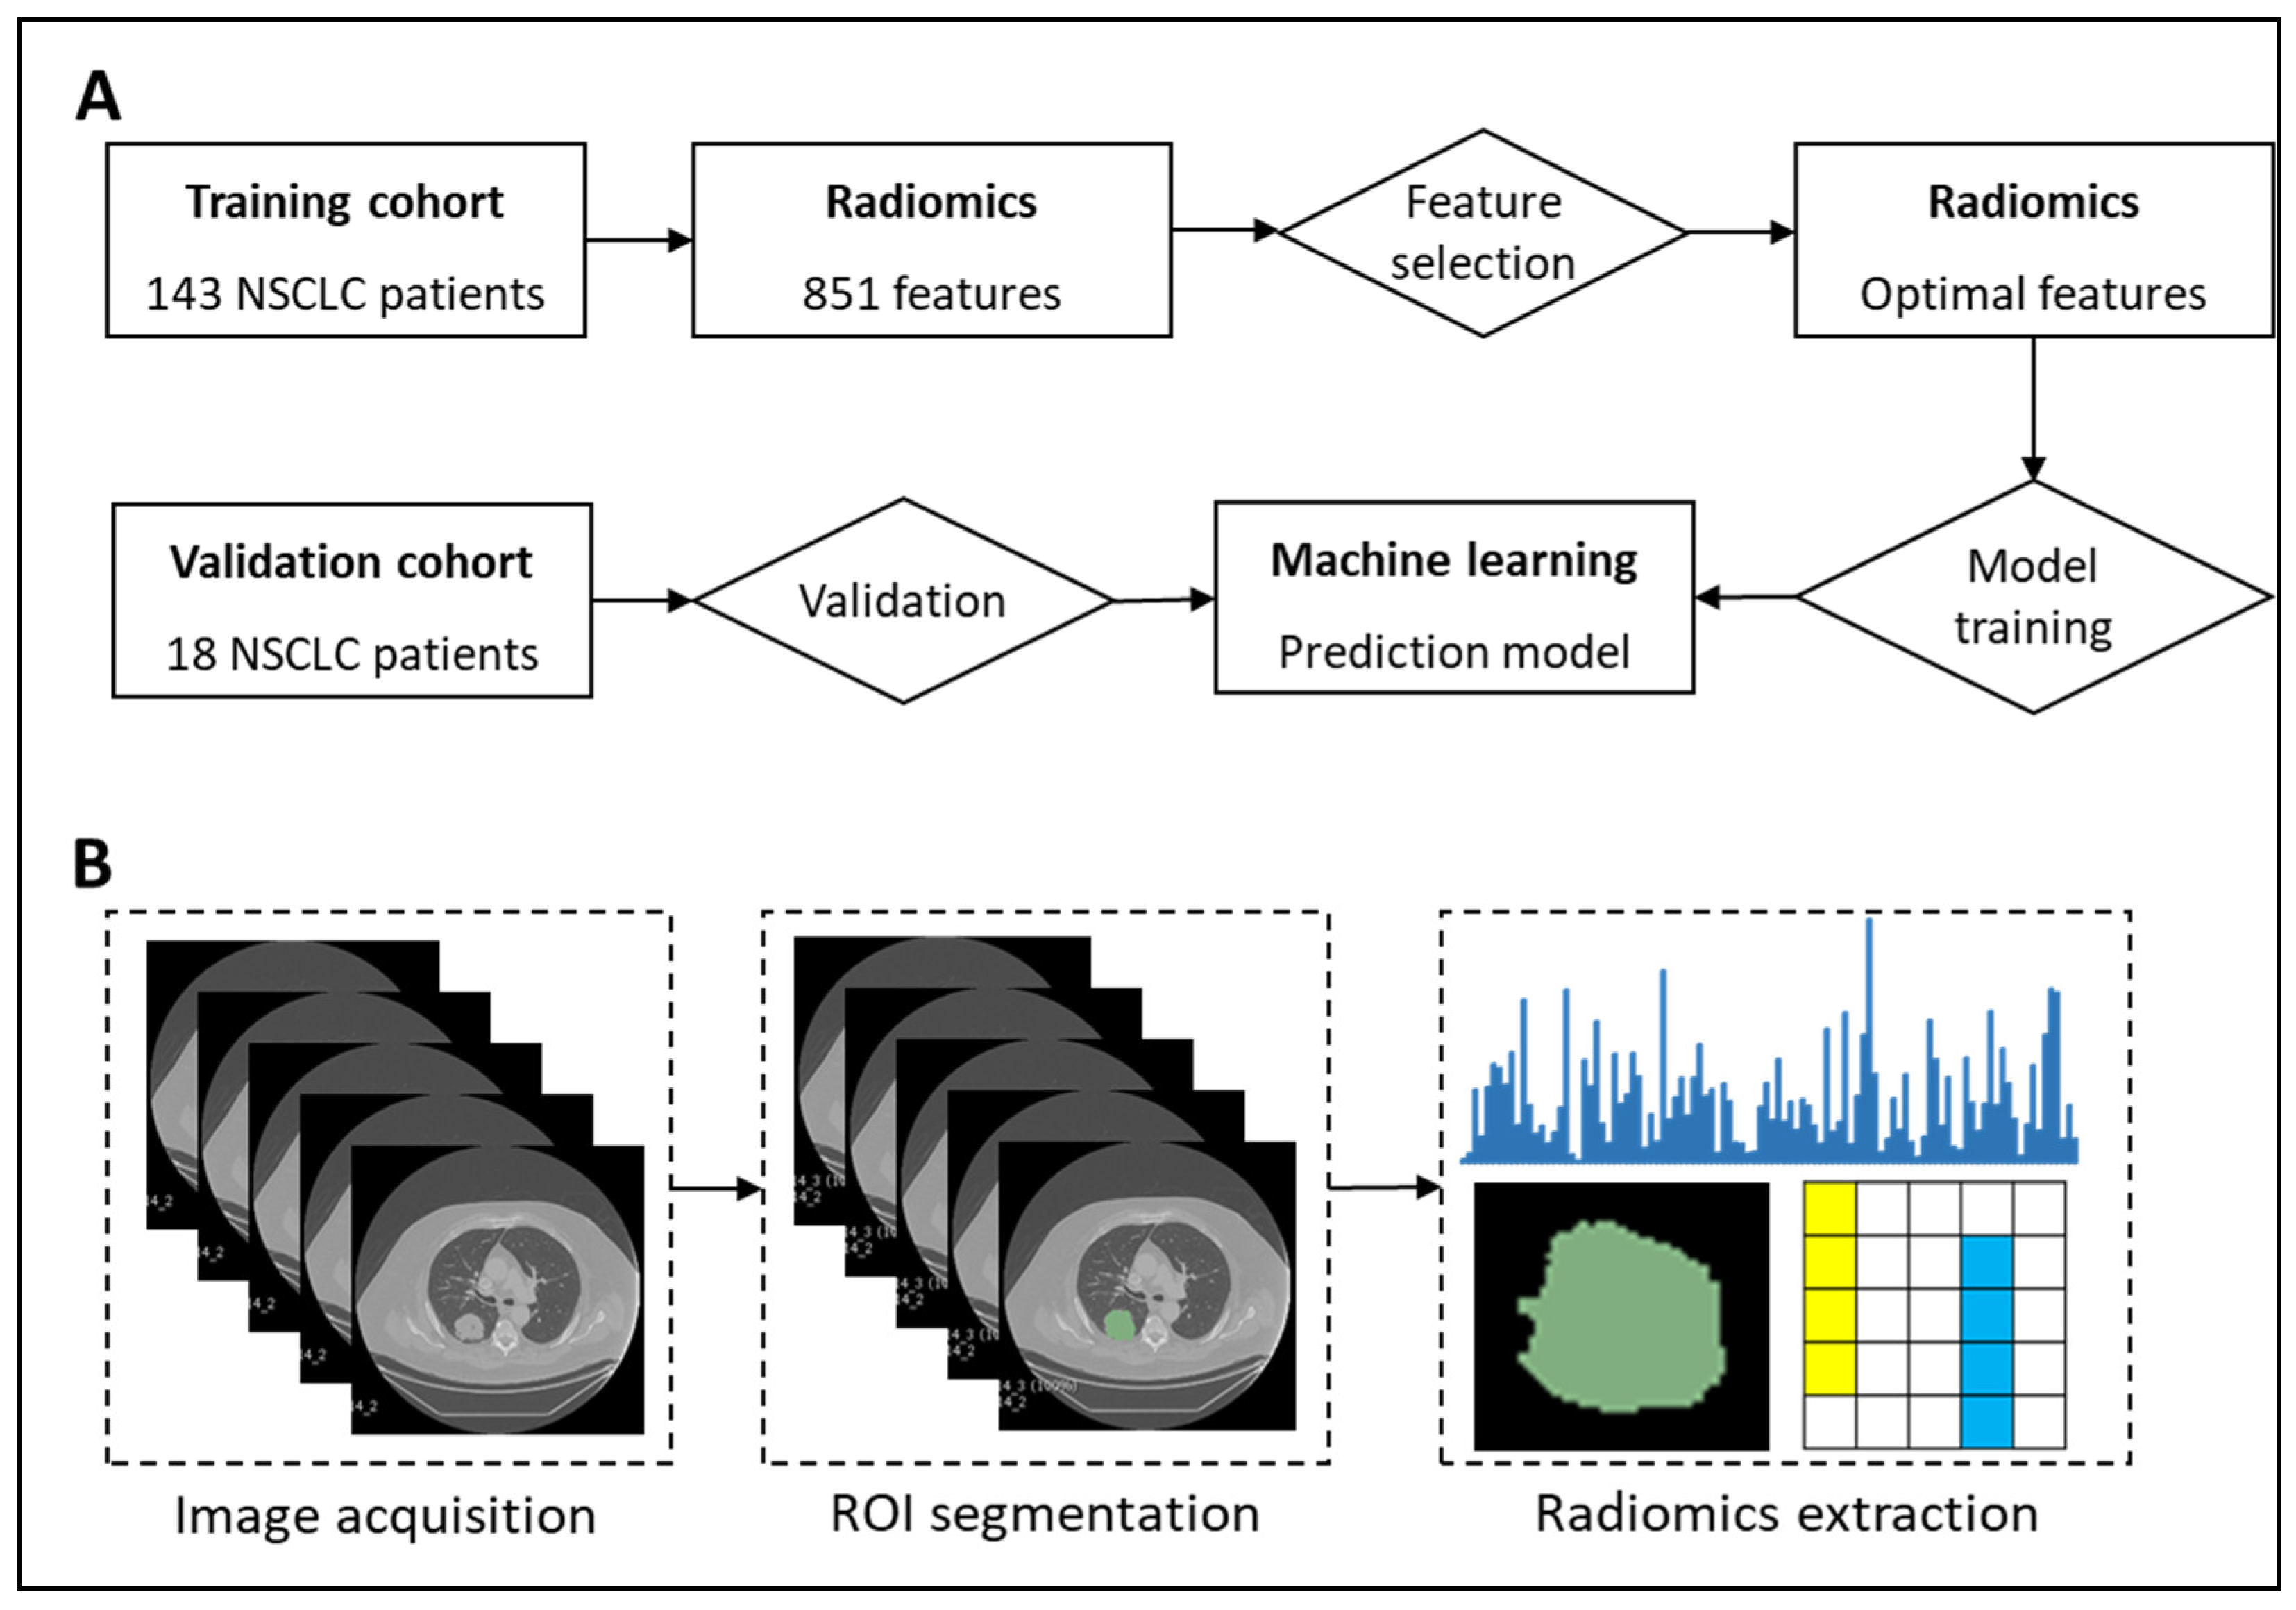
4. Materials and Methods

Figure 3 presents our proposed radiogenomics framework for predicting EGFR and KRAS mutations in patients with NSCLC.

4.1. NSCLC Patient Cohort

Datasets used in this study were retrieved from TCIA [23], which is a comprehensive resource for cancer imaging data. Because we aimed to improve the prediction of EGFR and KRAS mutations, we used a benchmark dataset that was introduced by [24]. This dataset comprises the CT images, positron emission tomography (PET)/CT images, and semantic annotations of tumors for a total of 211 patients. This dataset included two cohorts: the R01 cohort consisted of 162 patients with NSCLC, and the AMC cohort consisted of 49 additional patients. The first cohort was retrieved from Stanford University School of Medicine and Palo Alto Veterans Affairs Healthcare System, whereas the second cohort was retrieved only from Stanford University School of Medicine at different timelines. For both cohorts, the following clinical data were obtained where available: smoking history (211), survival (211), recurrence status (210), histology (211), histopathological grading (162), and pathological TNM staging (161). We used R01 as the training cohort and AMC as the validation cohort to examine the performance of the model.
Only patients who met the inclusion criteria were enrolled in the final dataset. The inclusion criteria for patients were as follows: (i) availability of images with less or no noise phenomenon, (ii) absence of artificial images, and (iii) availability of accurately segmented and full-sequence images. Finally, we included 161 patients in our dataset, of whom 143 and 18 were included in the training and validation sets, respectively. Since two datasets came from two different cohorts, the validation data can be treated as external data to evaluate the performance of the model.

4.2. Segmentation of Lung Tumors

We analyzed the CT findings of 161 patients from the dataset [24] who met the inclusion criteria. The ROIs were manually segmented by a chest radiologist with 8 years of experience and edited, where necessary, using ePAD [39]. Subsequently, all ROIs manually segmented by the first radiologist were evaluated by the second radiologist with 10 years of experience. Some unreasonable segmentations for the boundaries of ROIs were modified, where appropriate, to ensure segmentation precision.

4.3. Radiomics Feature Extraction

In this study, lung tumors were manually segmented by two doctors with 8–10 years of work experience. Subsequently, we used PyRadiomics library [28] to extract the different characteristics of radiomics features, namely, (i) intensity, (ii) image derivatives, (iii) geodesic information, (iv) texture features, and (v) posterior probability maps. In total, 851 features extracted from the library were categorized into 9 classes, namely, original, wavelet HHH, wavelet HHL, wavelet HLH, wavelet HLL, wavelet LHH, wavelet LHL, wavelet LLH, and wavelet LLL. Each category consisted of six subcategories, namely, first-order, gray-level co-occurrence matrix, GLSZM, gray-level run length matrix, neighboring gray tone difference matrix, and gray-level dependence matrix. The original radiomics category consisted of one additional subcategory, namely, shape. The radiomics classes were described by van Griethuysen et al. [28]. Because we would like to assess the performance results using radiomics, we did not include any pathological features in the models.

4.4. Feature Selection

We performed different feature selection analyses to identify features that might be crucial for our model. We used the following feature selection techniques: univariate selection, recursive feature elimination (RFE), feature importance, filter methods, F-score, GA, minimum redundancy feature selection, and the KBest algorithm.
The advantages and disadvantages of each technique are described as follows.

4.4.1. Univariate Selection

Univariate feature selection [40] is performed to investigate each separated feature to determine the magnitude of the association between features and the target variable. With various options available, this method can efficiently manipulate data.

4.4.2. RFE

RFE [41] involves the removal of the most insignificant features until the model has the optimal number of features. Moreover, RFE aims to exclude features, thus resulting in collinearity.
This technique optimizes the number of features remaining in the final model using cross-validation scores to distinguish data subsets. In addition, RFE can be used to visualize chosen features through graphs accompanied by their respective scores and to examine the contribution of the features to the predictive outcome.

4.4.3. Feature Importance

Feature importance [42] assesses the contribution of each feature included in the model on the basis of their assigned scores obtained from regression analysis or classification. In this study, feature importance was used to identify features that were the most efficient in classifying EGFR and KRAS mutations in patients with NSCLC. Thus, feature importance can provide better insights into the model and more semantic interpretations.

4.4.4. Filter Methods

Filter methods [43] refer to a group of various statistical methods primarily used for data preprocessing. Four main statistical tests are used depending on the types of input features and the output variable, namely, Pearson’s correlation coefficient, linear discriminant analysis, analysis of variance, and a chi-squared test. Similar to other feature selection methods, filter methods select features based on scores that manifest the strength of the correlation or association of inspected input features with the predictive output. However, filter methods cannot remove or reduce the multicollinearity phenomenon, which can deteriorate the comprehensive performance of the model.

4.4.5. F-Score

F-score is a feature selection method for examining the difference between two datasets containing continuous numerical values [44]. In the binary classification task, the F-scores of related features are calculated based on Equation (1). In this study, we calculated the F-score to obtain optimal features.
F ( i ) ( 𝕩 ¯ i ( + ) 𝕩 ¯ i ) 2 + ( 𝕩 ¯ i ( ) 𝕩 ¯ i ) 2 1 n + 1 k = 1 n + ( x k , i ( + ) 𝕩 ¯ i ( + ) ) 2 + 1 n 1 k = 1 n ( x k , i ( ) 𝕩 ¯ i ( ) ) 2
where 𝕩 ¯ i ( + ) , 𝕩 ¯ i ( ) ,   𝕩 ¯ i ,   i are the mean i th feature of the whole, positive, and negative datasets, respectively, x k , i ( + ) is the i th feature of the k th positive instance, and x k , i ( ) is the i th feature of the kth negative instance. The numerator distinguishes between positive and negative sets, and the denominator interprets the one within each of the two sets. The higher the F-score is, the more likely the feature is to be more distinctive, thus making it more prominent compared with other features. Although the F-score cannot provide common information among discriminative features, it is a simple yet effective feature selection method for dichotomous problems.

4.4.6. GA

The GA, which is a stochastic feature selection algorithm based on the principle of natural selection, optimizes model performance by identifying the most favorable features [25]. The method produces numerous virtual generations, and each generation contains many individual features that are best suited to the training model and can yield the highest accuracy.

4.4.7. Minimum Redundancy Feature Selection

This method investigates the correlation between features and the predictive outcome and between the features themselves [45]. In the F-statistic test, the level of the correlation between the output and features must be high (relevance), whereas the correlation between features must be low (redundancy). Thereafter, the algorithm filters out a subset of features satisfying both the aforementioned criteria. Two objective functions, namely, the mutual information difference and mutual information quotient, are used to measure the discrimination or the level of relevance and redundancy, respectively [45].

4.4.8. KBest Algorithm

The features are selected based on their importance scores for the target variable. Subsequently, k most significant features are selected.

4.5. Machine Learning

Machine learning, which is based on artificial intelligence, involves the use of various algorithms that facilitate the extraction of semantic radiomics features from arbitrary medical imaging datasets [46,47]. Recent studies have demonstrated the capability of machine learning techniques to predict tumor classification and survival rates and even perform molecular profiling based on imaging biomarkers [46,48,49]. In the current study, we evaluated the predictive potential of four machine learning algorithms for the classification task. Among four different classifiers, the kNN and LR algorithms follow the principle of distance function learning and the logistic theorem, respectively. Although both RF and XGBoost are ensemble learning methods based on the votes of individual decision trees, XGBoost can handle imbalanced dichotomous data and visualize the ranking of feature importance for more favorable outcome interpretation [50]. For each of the aforementioned algorithms, we performed cross-validation to identify optimal parameters.
We used machine learning algorithms to classify and robustly predict EGFR and KRAS mutations in patients with NSCLC to improve their overall prognosis and treatment response.

4.6. Statistical Analysis

Student’s t test and the Mann–Whitney U test were performed to compare continuous and categorical variables, respectively, between the training and validation cohorts. All statistical analyses were conducted using Python. To determine the model that exhibited the most favorable performance in the binomial classification problem, we validated the performance of each model by examining its sensitivity, specificity, and accuracy as follows:
S e n s i t i v i t y = T P T P + F N
S p e c i f i c i t y = T N T N + F P
A c c u r a c y = T P + T N T P + F P + T N + F N
where TP, TN, FP, and FN represent the true positive, true negative, false positive, and false negative, respectively.
To better visualize and compare the performance of four algorithms and feature selection methods, the receiver operating characteristic curves were plotted using comparable AUC values.

5. Conclusions

In this study, we proposed a comprehensive, noninvasive machine learning approach utilizing the classifier algorithms and feature selection methods to robustly predict EGFR and KRAS mutations among patients with NSCLC based on medical radiomics features. We demonstrated that by using a subset of the least number of semantic features, we could reach a promising performance with AUC of 0.89 and 0.812 for EGFR and KRAS mutation status prediction, respectively. The established radiomics signature model helps to accelerate the diagnosis of mutations of interest, thus improving the outcomes of patients with NSCLC in the future. Furthermore, our radiogenomics framework holds potential in solving extension problems in NSCLC including other mutations or exon levels, and then provides more outcomes.

Author Contributions

Conceptualization, N.Q.K.L., Q.H.K. and C.-Y.C.; methodology, N.Q.K.L. and V.H.N.; software, Q.H.K. and V.H.N.; validation, N.Q.K.L. and C.-Y.C.; formal analysis, N.Q.K.L. and Q.H.K.; investigation, N.Q.K.L., Y.-C.C., S.-J.C. and C.-Y.C.; data curation, N.Q.K.L., Y.-C.C. and S.-J.C.; writing—original draft preparation, N.Q.K.L. and Q.H.K.; writing—review and editing, N.Q.K.L., Q.H.K., V.H.N., Y.-C.C., S.-J.C. and C.-Y.C.; visualization, N.Q.K.L.; supervision, N.Q.K.L., S.-J.C. and C.-Y.C.; funding acquisition, N.Q.K.L., S.-J.C. and C.-Y.C. All authors have read and agreed to the published version of the manuscript.

Funding

This research was partly supported by the Taiwan Higher Education Sprout Project by the Ministry of Education (DP2-110-21121-01-A-06) and Ministry of Science and Technology (MOST 109-2321-B-038-004). The APC was funded by the Taiwan Higher Education Sprout Project by the Ministry of Education (DP2-110-21121-01-A-06).

Institutional Review Board Statement

Ethical review and approval were waived for this study because all data were derived from the public TCIA database.

Informed Consent Statement

Patient consent was waived because all data were derived from the public TCIA database.

Data Availability Statement

Public data can be freely accessed and downloaded at https://wiki.cancerimagingarchive.net/display/Public/NSCLC+Radiogenomics (accessed on 6 June 2020).

Acknowledgments

Not applicable.

Conflicts of Interest

The authors declare no conflict of interest. The funders had no role in the design of the study; in the collection, analyses, or interpretation of data; in the writing of the manuscript, or in the decision to publish the results.

References

  1. Sung, H.; Ferlay, J.; Siegel, R.L.; Laversanne, M.; Soerjomataram, I.; Jemal, A.; Bray, F. Global cancer statistics 2020: GLOBOCAN estimates of incidence and mortality worldwide for 36 cancers in 185 countries. CA Cancer J. Clin. 2021, 71, 209–249. [Google Scholar] [CrossRef] [PubMed]
  2. Duma, N.; Santana-Davila, R.; Molina, J.R. Non–Small cell lung cancer: Epidemiology, screening, diagnosis, and treatment. In Mayo Clinic Proceedings; Elsevier: Amsterdam, The Netherlands, 2019; pp. 1623–1640. [Google Scholar]
  3. Siegel, R.L.; Miller, K.D.; Jemal, A. Cancer statistics. 2020 CA Cancer J. Clin. 2020, 70, 7–30. [Google Scholar] [CrossRef] [PubMed]
  4. Riely, G.J.; Marks, J.; Pao, W. KRAS mutations in non–small cell lung cancer. Proc. Am. Thorac. Soc. 2009, 6, 201–205. [Google Scholar] [CrossRef]
  5. Boch, C.; Kollmeier, J.; Roth, A.; Stephan-Falkenau, S.; Misch, D.; Grüning, W.; Bauer, T.T.; Mairinger, T. The frequency of EGFR and KRAS mutations in non-small cell lung cancer (NSCLC): Routine screening data for central Europe from a cohort study. BMJ Open 2013, 3, e002560. [Google Scholar] [CrossRef] [PubMed] [Green Version]
  6. Heeke, S.; Hofman, V.; Benzaquen, J.; Otto, J.; Tanga, V.; Zahaf, K.; Allegra, M.; Long-Mira, E.; Lassalle, S.; Marquette, C.H.; et al. Detection of EGFR Mutations From Plasma of NSCLC Patients Using an Automatic Cartridge-Based PCR System. Front. Pharm. 2021, 12, 657743. [Google Scholar] [CrossRef] [PubMed]
  7. Pao, W.; Miller, V.; Zakowski, M.; Doherty, J.; Politi, K.; Sarkaria, I.; Singh, B.; Heelan, R.; Rusch, V.; Fulton, L. EGF receptor gene mutations are common in lung cancers from “never smokers” and are associated with sensitivity of tumors to gefitinib and erlotinib. Proc. Natl. Acad. Sci. USA 2004, 101, 13306–13311. [Google Scholar] [CrossRef] [PubMed] [Green Version]
  8. Pao, W.; Wang, T.Y.; Riely, G.J.; Miller, V.A.; Pan, Q.; Ladanyi, M.; Zakowski, M.F.; Heelan, R.T.; Kris, M.G.; Varmus, H.E. KRAS mutations and primary resistance of lung adenocarcinomas to gefitinib or erlotinib. PLoS Med. 2005, 2, e17. [Google Scholar] [CrossRef] [Green Version]
  9. Thomas, A.; Liu, S.V.; Subramaniam, D.S.; Giaccone, G. Refining the treatment of NSCLC according to histological and molecular subtypes. Nat. Rev. Clin. Oncol. 2015, 12, 511–526. [Google Scholar] [CrossRef]
  10. Li, Z.; Shu, J.; Yang, B.; Zhang, Z.; Huang, J.; Chen, Y. Emerging non-invasive detection methodologies for lung cancer. Oncol. Lett. 2020, 19, 3389–3399. [Google Scholar] [CrossRef]
  11. Farooq, M.; Herman, J.G. Noninvasive diagnostics for early detection of lung cancer: Challenges and potential with a focus on changes in DNA methylation. Cancer Epidemiol. Biomark. Prev. 2020, 29, 2416–2422. [Google Scholar] [CrossRef]
  12. Tang, D.; Shen, Y.; Wang, M.; Yang, R.; Wang, Z.; Sui, A.; Jiao, W.; Wang, Y. Identification of plasma microRNAs as novel noninvasive biomarkers for early detection of lung cancer. Eur. J. Cancer Prev. 2013, 22, 540–548. [Google Scholar] [CrossRef] [PubMed]
  13. Cazzoli, R.; Buttitta, F.; Di Nicola, M.; Malatesta, S.; Marchetti, A.; Rom, W.N.; Pass, H.I. microRNAs derived from circulating exosomes as noninvasive biomarkers for screening and diagnosing lung cancer. J. Thorac. Oncol. 2013, 8, 1156–1162. [Google Scholar] [CrossRef] [PubMed] [Green Version]
  14. Toloza, E.M.; Harpole, L.; McCrory, D.C. Noninvasive staging of non-small cell lung cancer: A review of the current evidence. Chest 2003, 123, 137S–146S. [Google Scholar] [CrossRef]
  15. Xu, Y.; Hosny, A.; Zeleznik, R.; Parmar, C.; Coroller, T.; Franco, I.; Mak, R.H.; Aerts, H.J. Deep learning predicts lung cancer treatment response from serial medical imaging. Clin. Cancer Res. 2019, 25, 3266–3275. [Google Scholar] [CrossRef] [Green Version]
  16. Liu, Z.; Wang, S.; Di Dong, J.W.; Fang, C.; Zhou, X.; Sun, K.; Li, L.; Li, B.; Wang, M.; Tian, J. The applications of radiomics in precision diagnosis and treatment of oncology: Opportunities and challenges. Theranostics 2019, 9, 1303. [Google Scholar] [CrossRef]
  17. Parmar, C.; Grossmann, P.; Bussink, J.; Lambin, P.; Aerts, H.J. Machine learning methods for quantitative radiomic biomarkers. Sci. Rep. 2015, 5, 1–11. [Google Scholar]
  18. Aerts, H.J.; Velazquez, E.R.; Leijenaar, R.T.; Parmar, C.; Grossmann, P.; Carvalho, S.; Bussink, J.; Monshouwer, R.; Haibe-Kains, B.; Rietveld, D. Decoding tumour phenotype by noninvasive imaging using a quantitative radiomics approach. Nat. Commun. 2014, 5, 1–9. [Google Scholar] [CrossRef]
  19. Hosny, A.; Parmar, C.; Coroller, T.P.; Grossmann, P.; Zeleznik, R.; Kumar, A.; Bussink, J.; Gillies, R.J.; Mak, R.H.; Aerts, H.J. Deep learning for lung cancer prognostication: A retrospective multi-cohort radiomics study. PLoS Med. 2018, 15, e1002711. [Google Scholar] [CrossRef] [Green Version]
  20. Gevaert, O.; Echegaray, S.; Khuong, A.; Hoang, C.D.; Shrager, J.B.; Jensen, K.C.; Berry, G.J.; Guo, H.H.; Lau, C.; Plevritis, S.K. Predictive radiogenomics modeling of EGFR mutation status in lung cancer. Sci. Rep. 2017, 7, 1–8. [Google Scholar] [CrossRef]
  21. Rizzo, S.; Raimondi, S.; de Jong, E.E.; van Elmpt, W.; De Piano, F.; Petrella, F.; Bagnardi, V.; Jochems, A.; Bellomi, M.; Dingemans, A.M. Genomics of non-small cell lung cancer (NSCLC): Association between CT-based imaging features and EGFR and K-RAS mutations in 122 patients—An external validation. Eur. J. Radiol. 2019, 110, 148–155. [Google Scholar] [CrossRef]
  22. Shiri, I.; Maleki, H.; Hajianfar, G.; Abdollahi, H.; Ashrafinia, S.; Hatt, M.; Zaidi, H.; Oveisi, M.; Rahmim, A. Next-generation radiogenomics sequencing for prediction of EGFR and KRAS mutation status in NSCLC patients using multimodal imaging and machine learning algorithms. Mol. Imaging Biol. 2020, 22, 1132–1148. [Google Scholar] [CrossRef] [Green Version]
  23. Clark, K.; Vendt, B.; Smith, K.; Freymann, J.; Kirby, J.; Koppel, P.; Moore, S.; Phillips, S.; Maffitt, D.; Pringle, M.; et al. The Cancer Imaging Archive (TCIA): Maintaining and Operating a Public Information Repository. J. Digit. Imaging 2013, 26, 1045–1057. [Google Scholar]
  24. Bakr, S.; Gevaert, O.; Echegaray, S.; Ayers, K.; Zhou, M.; Shafiq, M.; Zheng, H.; Benson, J.A.; Zhang, W.; Leung, A.N.C.; et al. A radiogenomic dataset of non-small cell lung cancer. Sci. Data 2018, 5, 180202. [Google Scholar] [CrossRef] [Green Version]
  25. Mirjalili, S. Genetic algorithm. In Evolutionary Algorithms and Neural Networks; Springer: Berlin, Germany, 2019; pp. 43–55. [Google Scholar]
  26. Chawla, N.V.; Bowyer, K.W.; Hall, L.O.; Kegelmeyer, W.P. SMOTE: Synthetic minority over-sampling technique. J. Artif. Intell. Res. 2002, 16, 321–357. [Google Scholar] [CrossRef]
  27. Lundberg, S.; Lee, S.-I. A unified approach to interpreting model predictions. In Proceedings of the 31st International Conference on Neural Information Processing Systems, Long Beach, CA, USA, 4–9 December 2017. [Google Scholar]
  28. van Griethuysen, J.J.M.; Fedorov, A.; Parmar, C.; Hosny, A.; Aucoin, N.; Narayan, V.; Beets-Tan, R.G.H.; Fillion-Robin, J.C.; Pieper, S.; Aerts, H. Computational Radiomics System to Decode the Radiographic Phenotype. Cancer Res. 2017, 77, e104–e107. [Google Scholar] [CrossRef] [Green Version]
  29. Pinheiro, G.; Pereira, T.; Dias, C.; Freitas, C.; Hespanhol, V.; Costa, J.L.; Cunha, A.; Oliveira, H.P. Identifying relationships between imaging phenotypes and lung cancer-related mutation status: EGFR and KRAS. Sci. Rep. 2020, 10, 3625. [Google Scholar] [CrossRef]
  30. Zhang, J.; Zhao, X.; Zhao, Y.; Zhang, J.; Zhang, Z.; Wang, J.; Wang, Y.; Dai, M.; Han, J. Value of pre-therapy 18 F-FDG PET/CT radiomics in predicting EGFR mutation status in patients with non-small cell lung cancer. Eur. J. Nucl. Med. Mol. Imaging 2020, 47, 1137–1146. [Google Scholar] [CrossRef] [PubMed]
  31. Liu, H.; Motoda, H. Computational Methods of Feature Selection; CRC Press: Boca Raton, FL, USA, 2007. [Google Scholar]
  32. Nioche, C.; Orlhac, F.; Boughdad, S.; Reuzé, S.; Goya-Outi, J.; Robert, C.; Pellot-Barakat, C.; Soussan, M.; Frouin, F.; Buvat, I. LIFEx: A freeware for radiomic feature calculation in multimodality imaging to accelerate advances in the characterization of tumor heterogeneity. Cancer Res. 2018, 78, 4786–4789. [Google Scholar] [CrossRef] [Green Version]
  33. Moreno, S.; Bonfante, M.; Zurek, E.; Cherezov, D.; Goldgof, D.; Hall, L.; Schabath, M. A Radiogenomics Ensemble to Predict EGFR and KRAS Mutations in NSCLC. Tomography 2021, 7, 154–168. [Google Scholar] [CrossRef] [PubMed]
  34. Mu, W.; Jiang, L.; Zhang, J.; Shi, Y.; Gray, J.E.; Tunali, I.; Gao, C.; Sun, Y.; Tian, J.; Zhao, X. Non-invasive decision support for NSCLC treatment using PET/CT radiomics. Nat. Commun. 2020, 11, 1–11. [Google Scholar] [CrossRef] [PubMed]
  35. Zhao, W.; Yang, J.; Ni, B.; Bi, D.; Sun, Y.; Xu, M.; Zhu, X.; Li, C.; Jin, L.; Gao, P. Toward automatic prediction of EGFR mutation status in pulmonary adenocarcinoma with 3D deep learning. Cancer Med. 2019, 8, 3532–3543. [Google Scholar] [CrossRef] [Green Version]
  36. Dong, Y.; Hou, L.; Yang, W.; Han, J.; Wang, J.; Qiang, Y.; Zhao, J.; Hou, J.; Song, K.; Ma, Y.; et al. Multi-channel multi-task deep learning for predicting EGFR and KRAS mutations of non-small cell lung cancer on CT images. Quant. Imaging Med. Surg. 2021, 11, 2354–2375. [Google Scholar] [CrossRef]
  37. Li, K.; Yang, M.; Liang, N.; Li, S. Determining EGFR-TKI sensitivity of G719X and other uncommon EGFR mutations in non-small cell lung cancer: Perplexity and solution (Review). Oncol. Rep. 2017, 37, 1347–1358. [Google Scholar] [CrossRef] [PubMed] [Green Version]
  38. Xu, C.-W.; Lei, L.; Wang, W.-X.; Lin, L.; Zhu, Y.-C.; Wang, H.; Miao, L.-Y.; Wang, L.-P.; Zhuang, W.; Fang, M.-Y.; et al. Molecular Characteristics and Clinical Outcomes of EGFR Exon 19 C-Helix Deletion in Non–Small Cell Lung Cancer and Response to EGFR TKIs. Transl. Oncol. 2020, 13, 100791. [Google Scholar] [CrossRef] [PubMed]
  39. Rubin, D.L.; Akdogan, M.U.; Altindag, C.; Alkim, E. ePAD: An image annotation and analysis platform for quantitative imaging. Tomography 2019, 5, 170–183. [Google Scholar] [CrossRef] [PubMed]
  40. Subho, M.R.H.; Chowdhury, M.R.; Chaki, D.; Islam, S.; Rahman, M.M. A Univariate Feature Selection Approach for Finding Key Factors of Restaurant Business. In 2019 IEEE Region 10 Symposium (TENSYMP); IEEE: Piscataway Township, NJ, USA, 2019; pp. 605–610. [Google Scholar]
  41. Zeng, X.; Chen, Y.-W.; Tao, C. Feature selection using recursive feature elimination for handwritten digit recognition. In Proceedings of the 2009 Fifth International Conference on Intelligent Information Hiding and Multimedia Signal Processing, Kyoto, Japan, 12–14 September 2009; IEEE: Piscataway Township, NJ, USA, 2009; pp. 1205–1208. [Google Scholar]
  42. Geng, X.; Liu, T.-Y.; Qin, T.; Li, H. Feature selection for ranking. In Proceedings of the 30th Annual International ACM SIGIR Conference on Research and Development in Information Retrieval, Amsterdam, The Netherlands, 23–27 July 2007; Association for Computing Machinery: Amsterdam, The Netherlands, 2007; pp. 407–414. [Google Scholar]
  43. Sánchez-Marono, N.; Alonso-Betanzos, A.; Tombilla-Sanromán, M. Filter methods for feature selection–A comparative study. In Proceedings of the International Conference on Intelligent Data Engineering and Automated Learning, Birmingham, UK, 16–19 December 2007; Springer: Berlin, Germany, 2007; pp. 178–187. [Google Scholar]
  44. Chen, Y.-W.; Lin, C.-J. Combining SVMs with Various Feature Selection Strategies. In Feature Extraction: Foundations and Applications; Guyon, I., Nikravesh, M., Gunn, S., Zadeh, L.A., Eds.; Springer: Berlin/Heidelberg, Germany, 2006; pp. 315–324. [Google Scholar]
  45. Radovic, M.; Ghalwash, M.; Filipovic, N.; Obradovic, Z. Minimum redundancy maximum relevance feature selection approach for temporal gene expression data. BMC Bioinform. 2017, 18, 1–14. [Google Scholar] [CrossRef] [Green Version]
  46. Erickson, B.J.; Korfiatis, P.; Akkus, Z.; Kline, T.L. Machine learning for medical imaging. Radiographics 2017, 37, 505–515. [Google Scholar] [CrossRef]
  47. Le, N.Q.K.; Hung, T.N.K.; Do, D.T.; Lam, L.H.T.; Dang, L.H.; Huynh, T.-T. Radiomics-based machine learning model for efficiently classifying transcriptome subtypes in glioblastoma patients from MRI. Comput. Biol. Med. 2021, 132, 104320. [Google Scholar] [CrossRef]
  48. Zupan, B.; Demšar, J.; Kattan, M.W.; Beck, J.R.; Bratko, I. Machine learning for survival analysis: A case study on recurrence of prostate cancer. Artif. Intell. Med. 2000, 20, 59–75. [Google Scholar] [CrossRef] [Green Version]
  49. Mattonen, S.A.; Davidzon, G.A.; Benson, J.; Leung, A.N.C.; Vasanawala, M.; Horng, G.; Shrager, J.B.; Napel, S.; Nair, V.S. Bone Marrow and Tumor Radiomics at (18)F-FDG PET/CT: Impact on Outcome Prediction in Non-Small Cell Lung Cancer. Radiology 2019, 293, 451–459. [Google Scholar] [CrossRef]
  50. Le, N.Q.; Do, D.T.; Chiu, F.-Y.; Yapp, E.K.; Yeh, H.-Y.; Chen, C.-Y. XGBoost Improves Classification of MGMT Promoter Methylation Status in IDH1 Wildtype Glioblastoma. J. Pers. Med. 2020, 10, 128. [Google Scholar] [CrossRef] [PubMed]
Figure 1. Predictive performance of different feature selection techniques in the NSCLC radiogenomics model. The genetic algorithm (GA) demonstrated the most favorable performance. (A) EGFR mutation prediction (area under the curve (AUC) = 0.89), (B) KRAS mutation prediction (AUC = 0.812).
Ijms 22 09254 g001
Figure 2. SHAP analysis to explain the crucial features of our NSCLC radiogenomics models. (A) EGFR mutation status, (B) KRAS mutation status.
Ijms 22 09254 g002
Figure 3. Prediction of EGFR mutation using radiomics, feature selection, and machine learning algorithms. (A) Study framework. (B) Workflow of radiomics.
Ijms 22 09254 g003
Table 1. Characteristics of patients in our cohorts.
Training (n = 143)Validation (n = 18)p Value
Age (mean ± SD, years)69.2 ± 8.8466.9 ± 13.850.334
Sex 0.123
Male1074
Female3614
Smoking status 0.069
Current30
Former919
Nonsmoker229
Histological type 0.5
Adenocarcinoma11118
NSCLC NOS 130
Squamous cell carcinoma290
EGFR mutation 0.074
Mutant236
Wild-type9312
KRAS mutation 0.074
Mutant273
Wild-type8715
Recurrence 0.123
Yes403
No10315
1 No other specific type.
Table 2. Assessment of different feature selection-based machine learning models for predicting EGFR and KRAS mutations.
OriginalSMOTE
SensSpecAccSensSpecAcc
EGFRLR4.31008143.578.571.6
kNN34.892.58160.967.766.4
RF21.797.882.852.284.978.4
XGBoost43.594.684.565.288.283.6
KRASLR11.198.978.148.173.667.5
kNN18.598.979.855.667.864.9
RF33.396.681.651.975.970.2
XGBoost55.689.377.255.695.486
LR: logistic regression, kNN: k-nearest neighbors, RF: random forest, XGBoost: eXtreme Gradient Boosting.
Table 3. Comparison between our proposed models and those of previous studies using the same TCIA data.
SensSpecAccAUC
EGFRPinheiro et al.---0.7458
Shiri et al.---0.78
Zhang et al.91.770.380.80.87
Ours65.288.283.60.89
KRASPinheiro et al.11.198.978.10.5035
Shiri et al.18.598.979.80.83
Ours55.695.4860.812
- means the metrics were not reported in the corresponding papers.
Publisher’s Note: MDPI stays neutral with regard to jurisdictional claims in published maps and institutional affiliations.

