
CRKL, AIFM3, AIF, BCL2, and UBASH3A during Human Kidney Development

 , , ,
, , , 
Abstract
:1. Introduction
2. Materials and Methods
2.1. Tissue Procurement and Processing
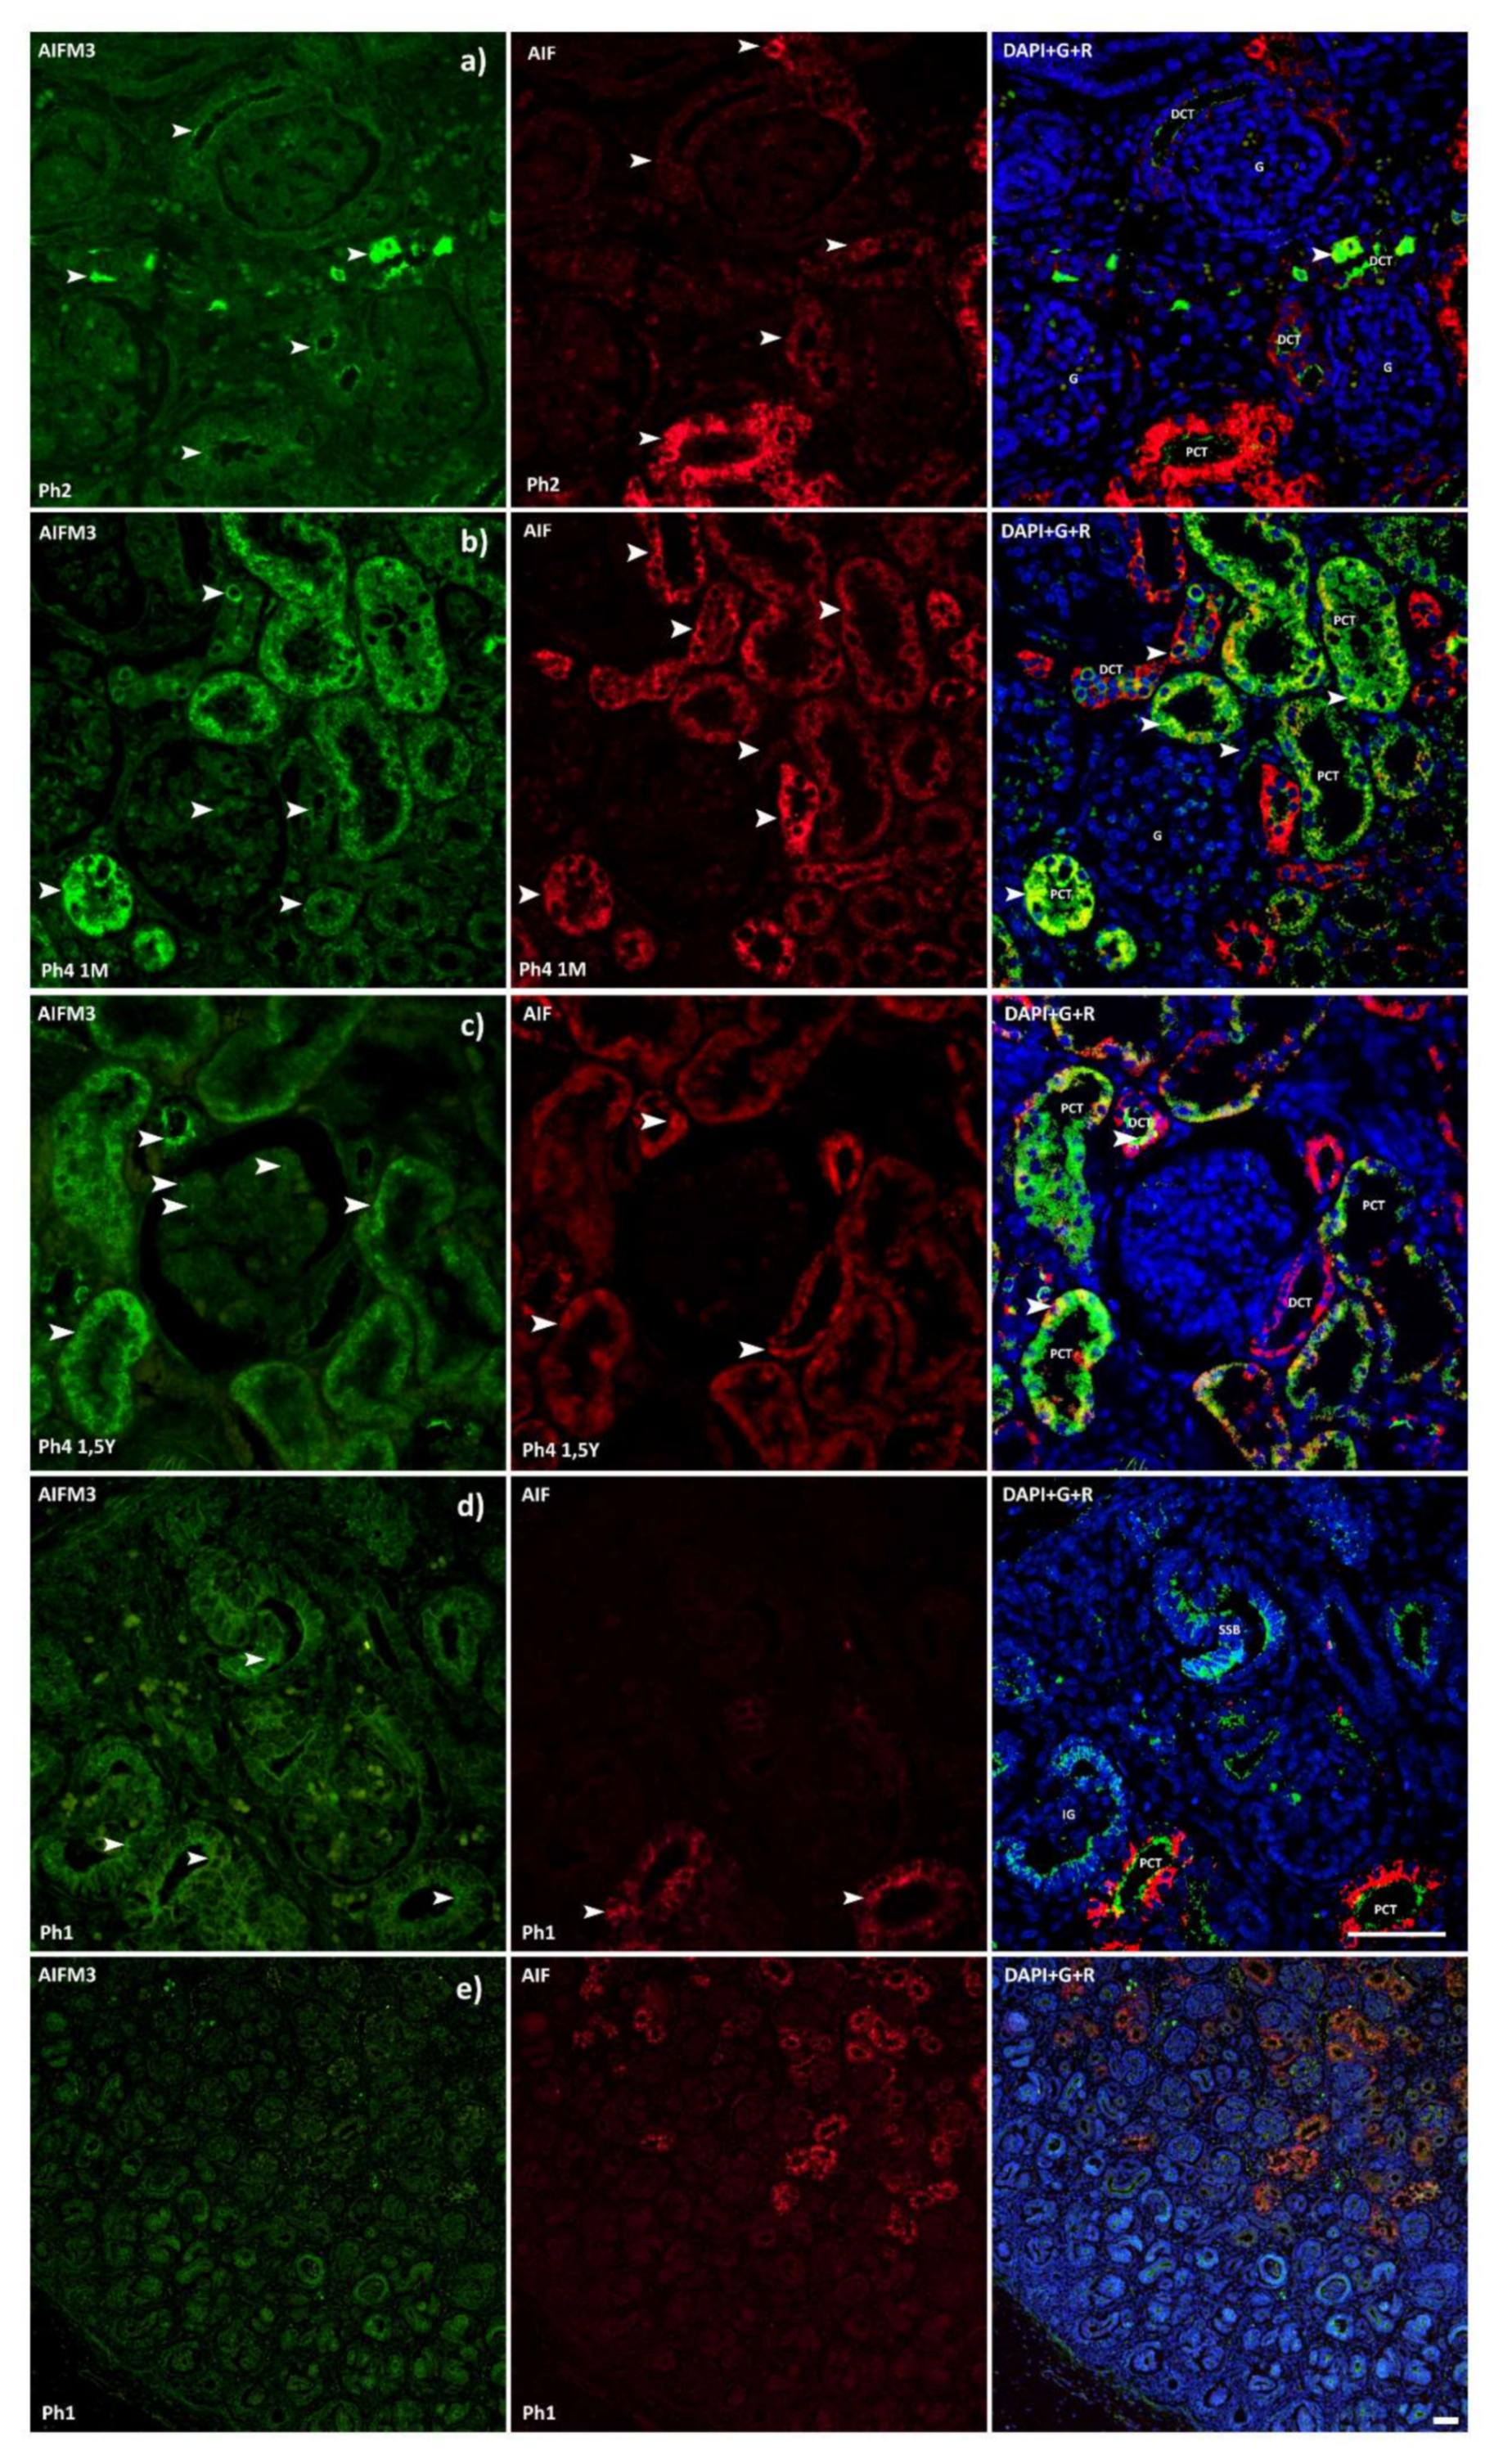
2.2. Immunofluorescence
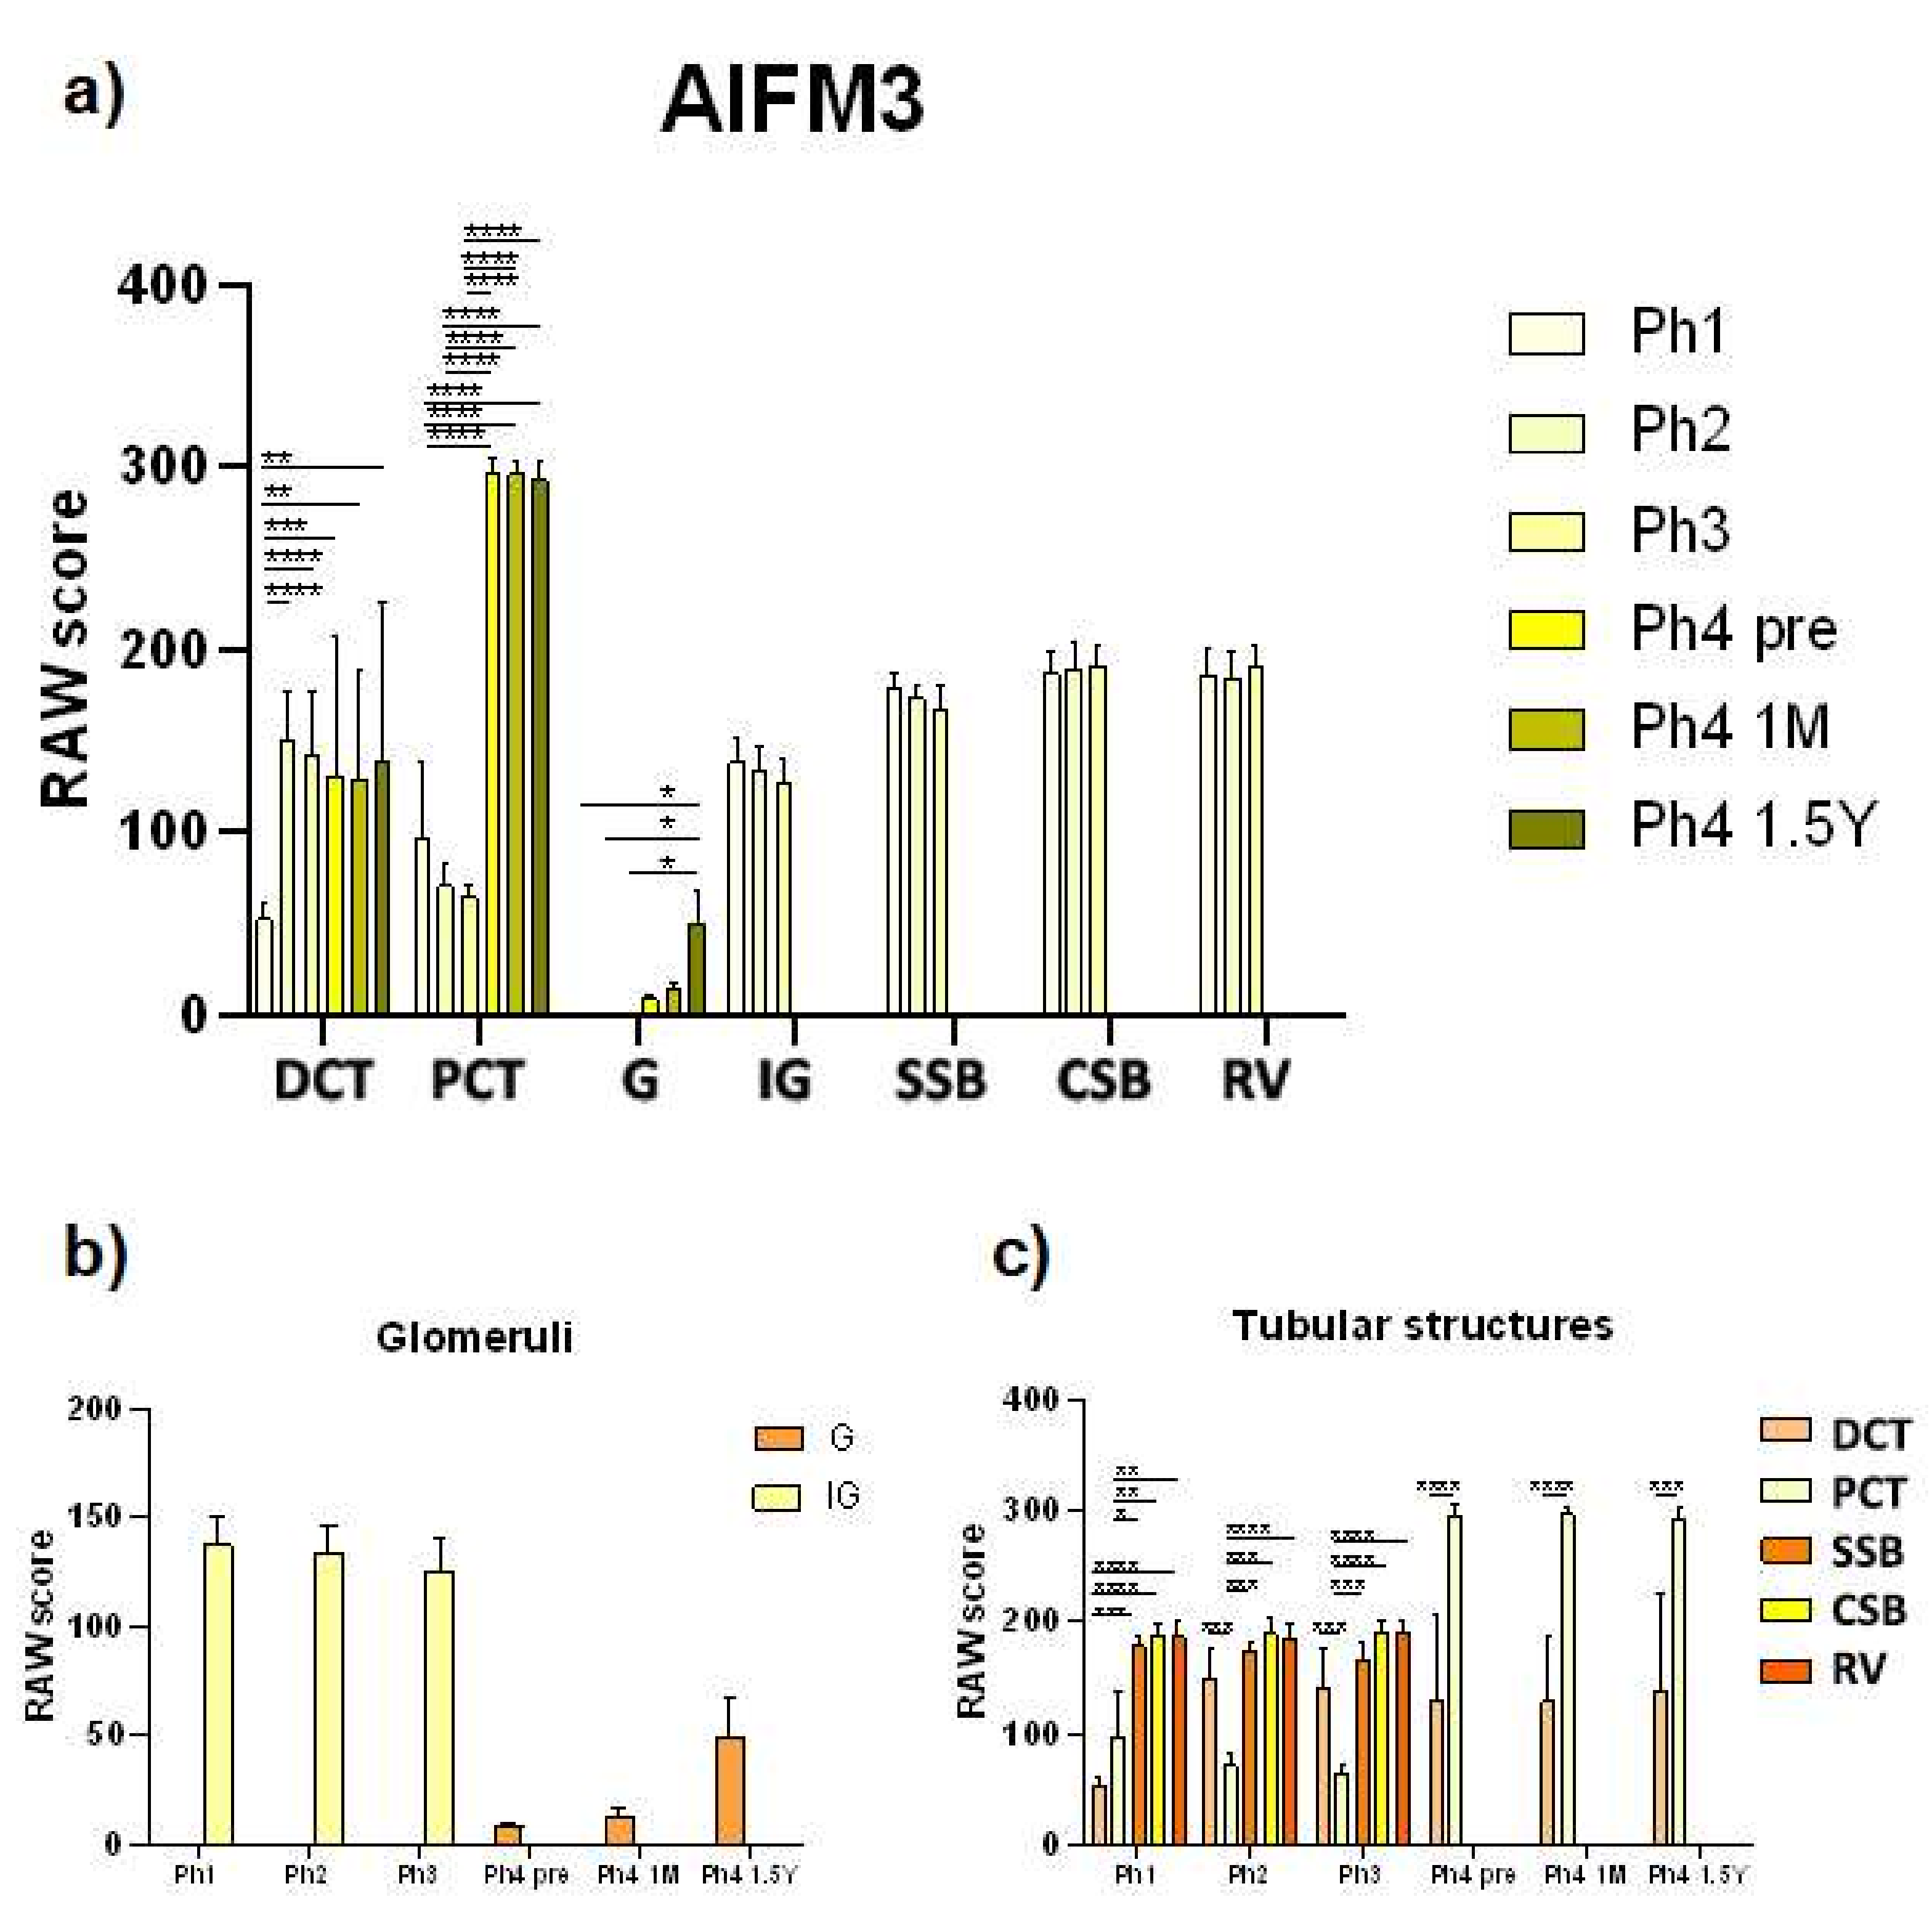
2.3. Quantification and Statistical Analysis of Positive Cells
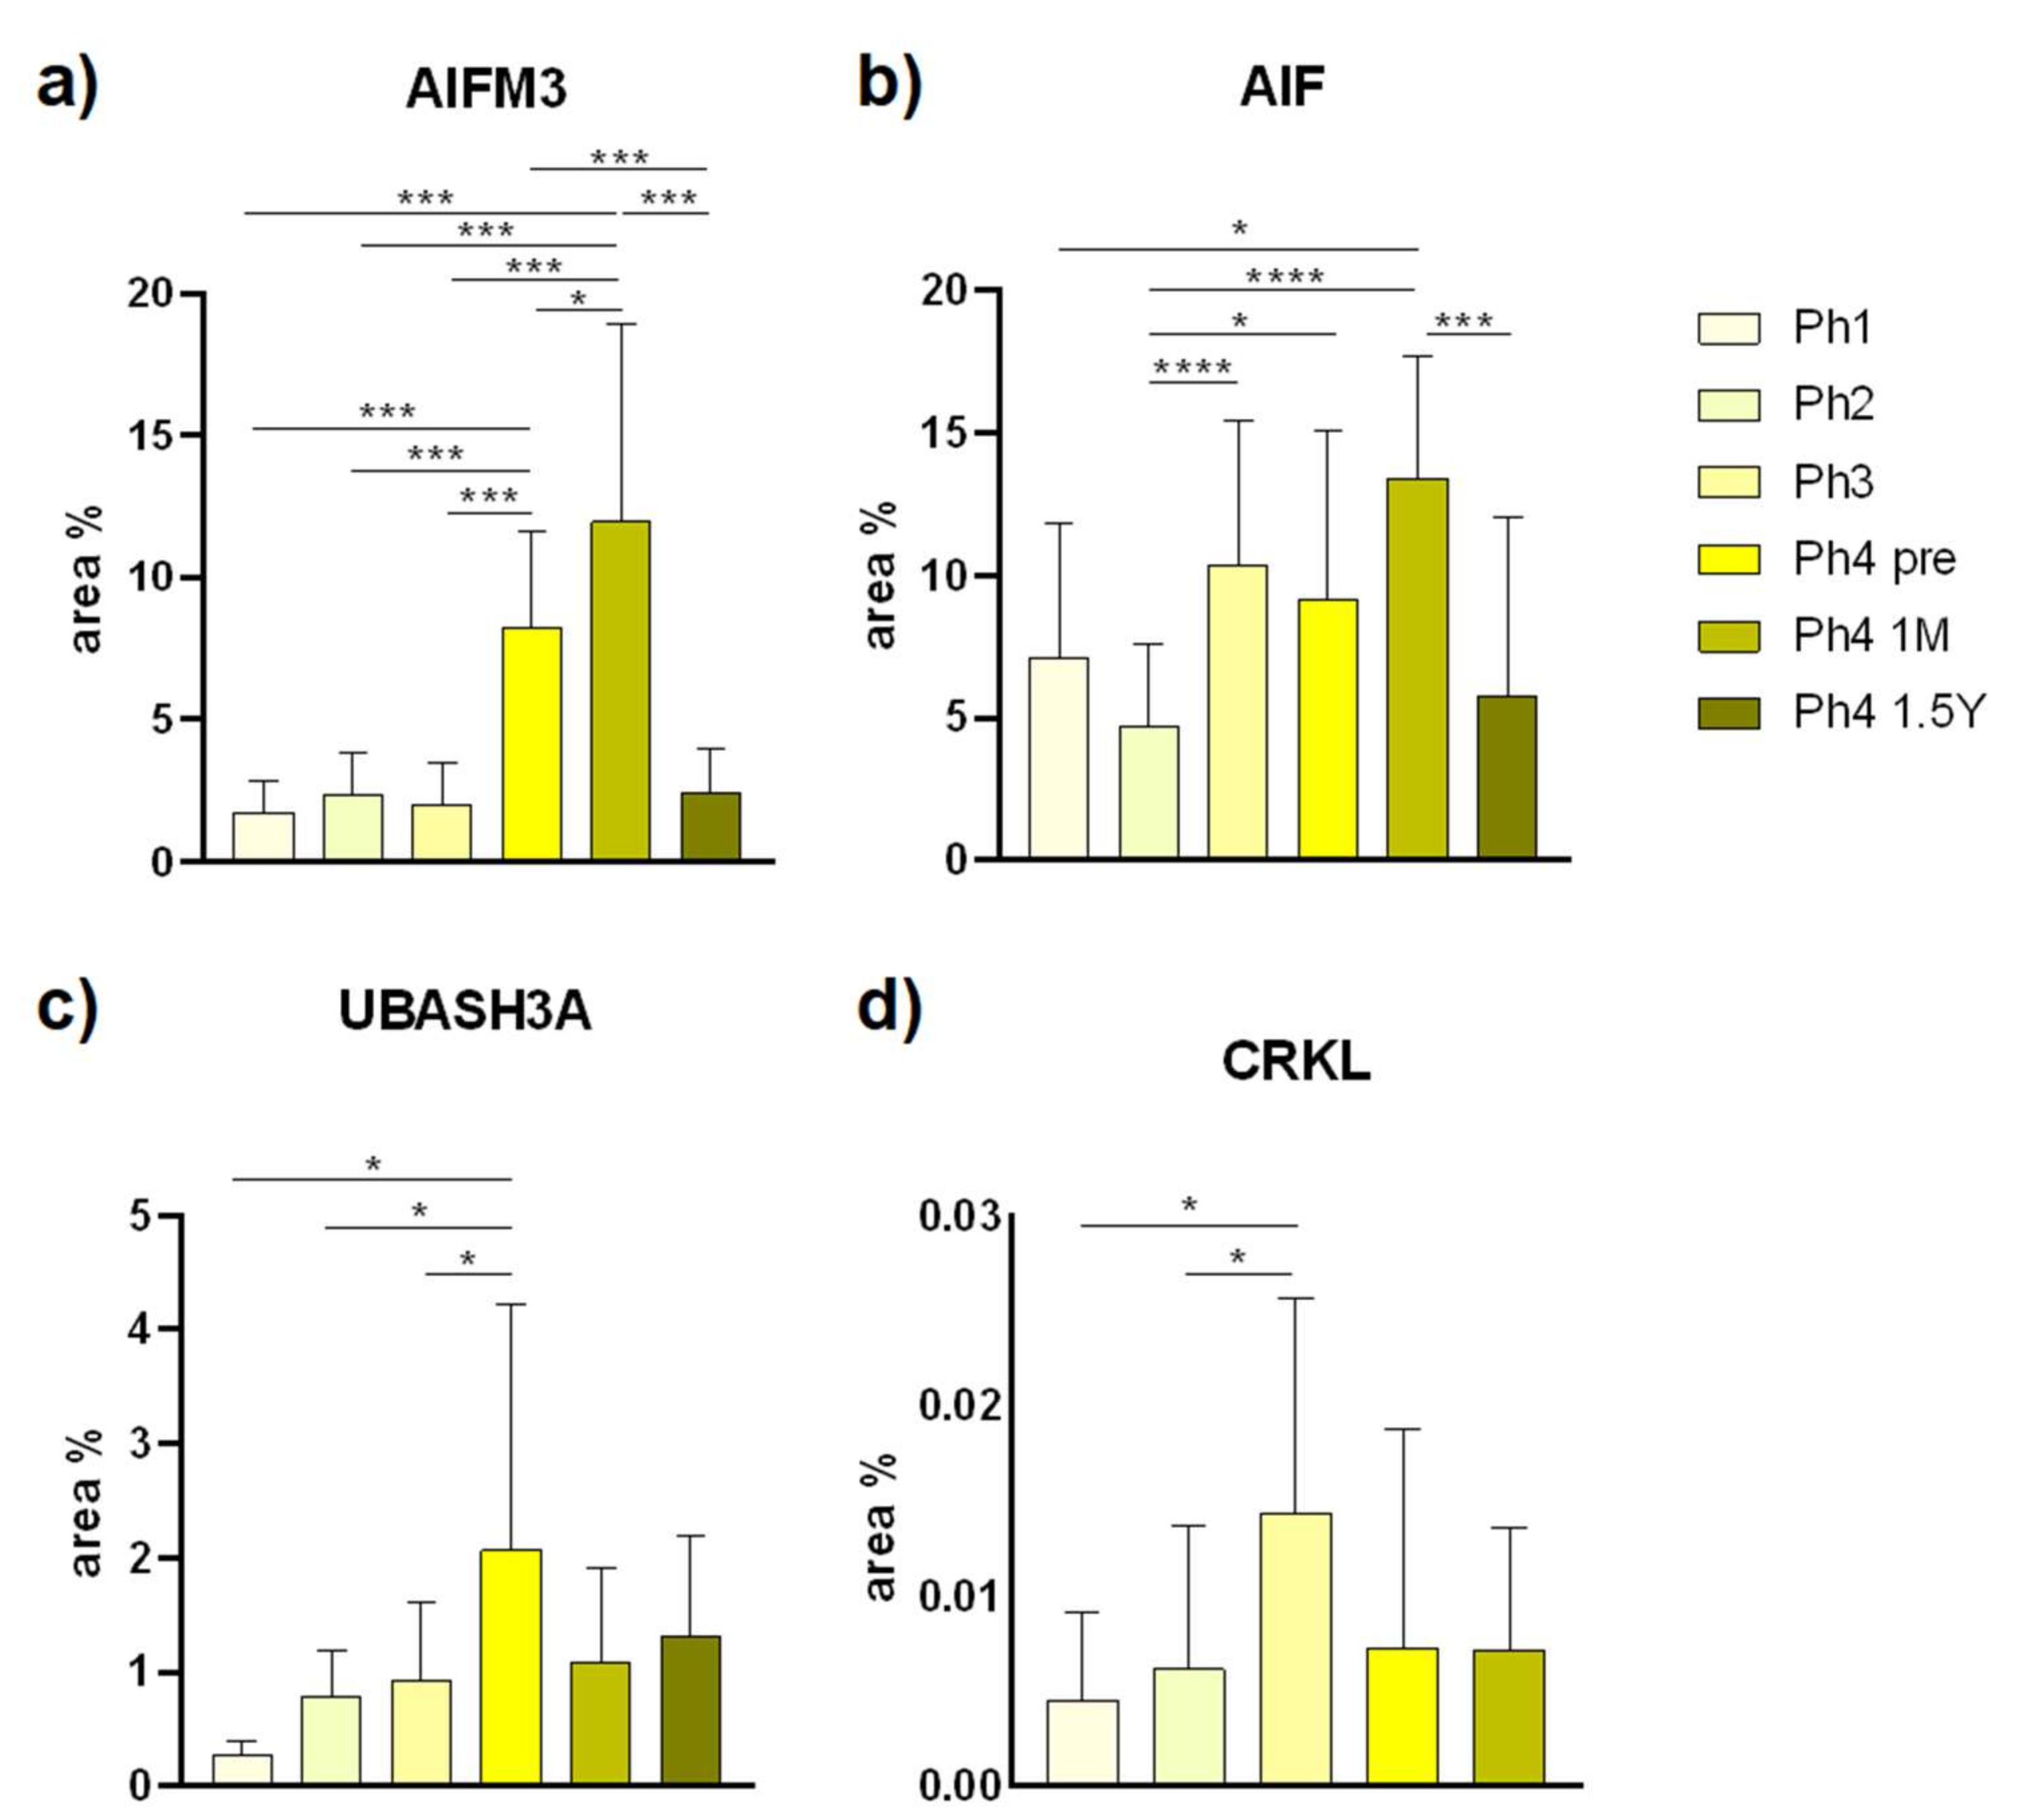
2.4. Data Acquisition and Statistical Analysis of Area Percentages
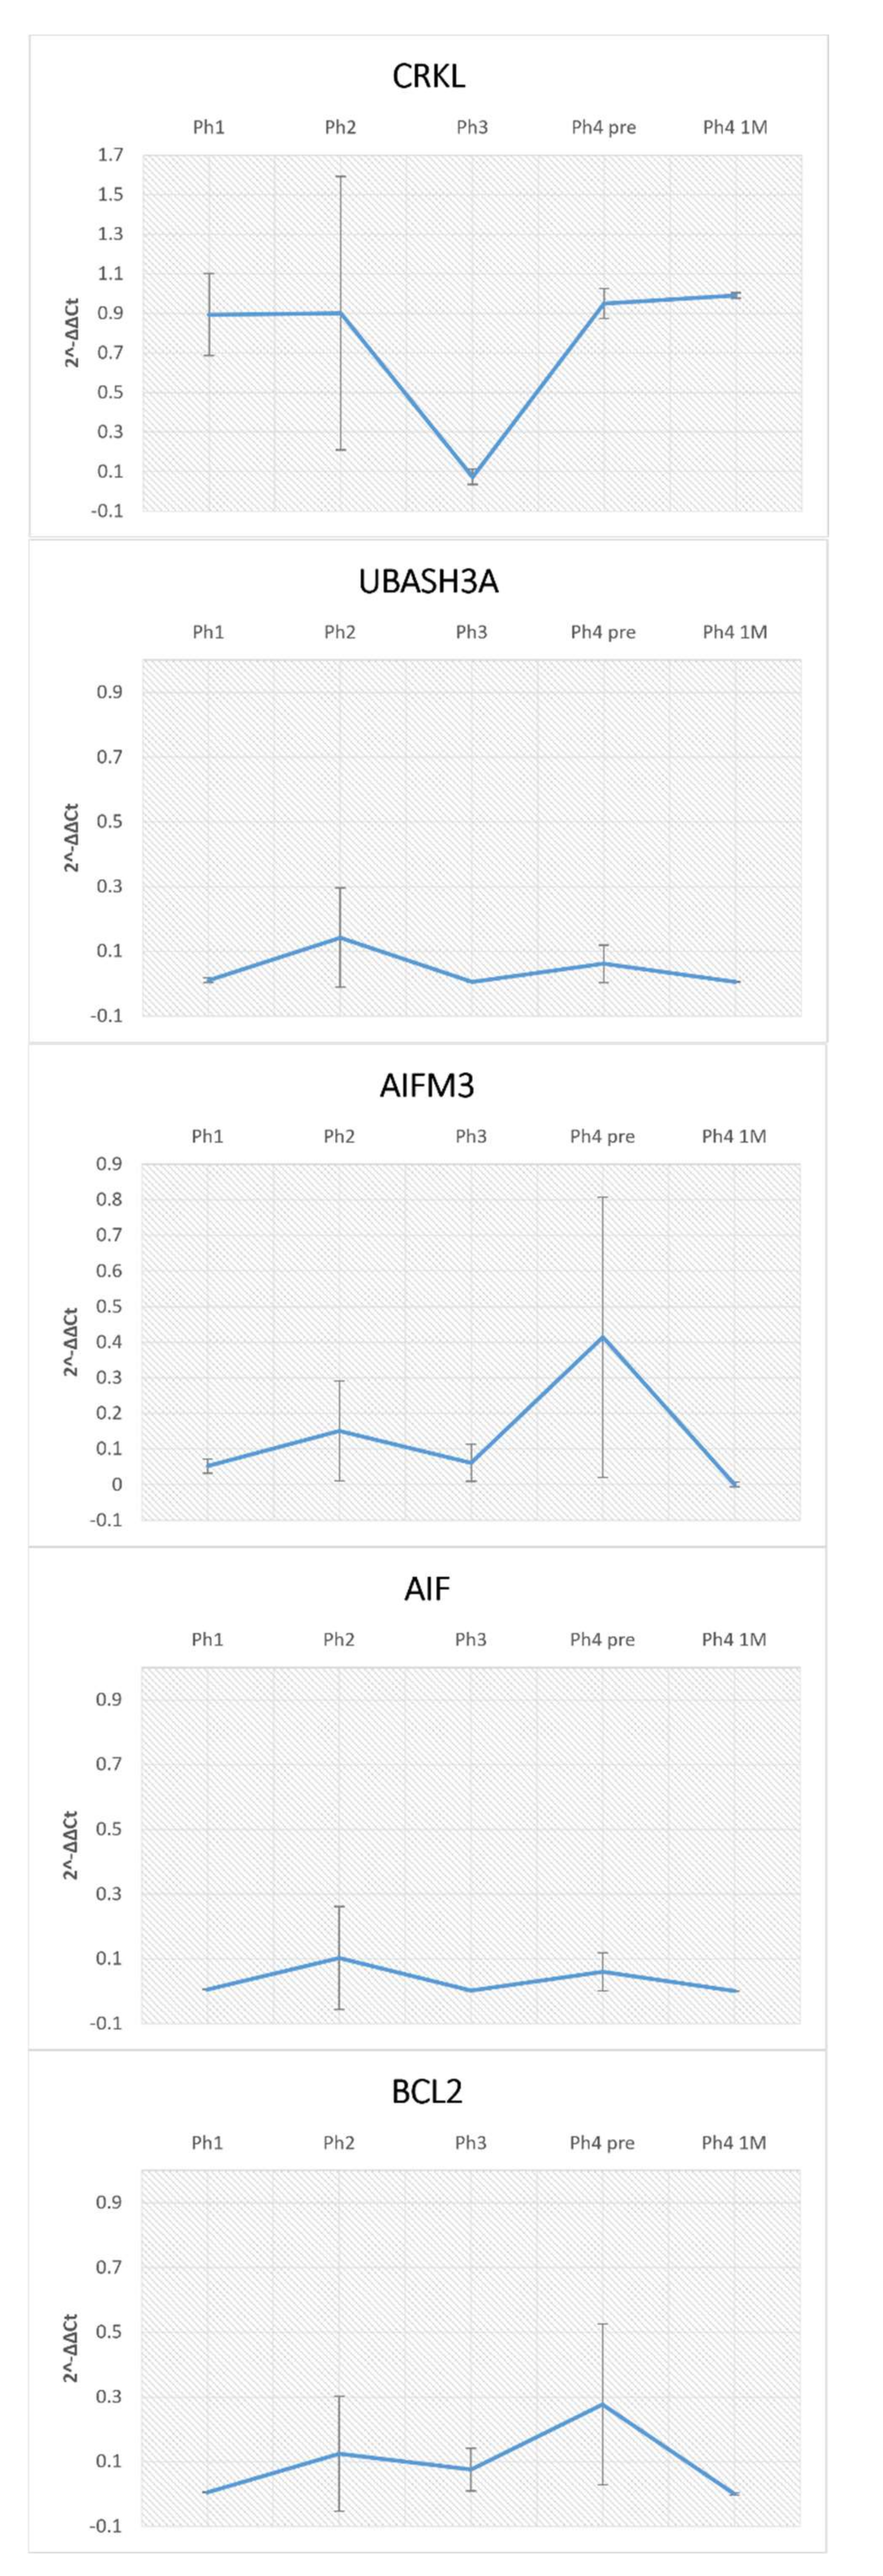
2.5. RNA Isolation and qRT-PCR
3. Results
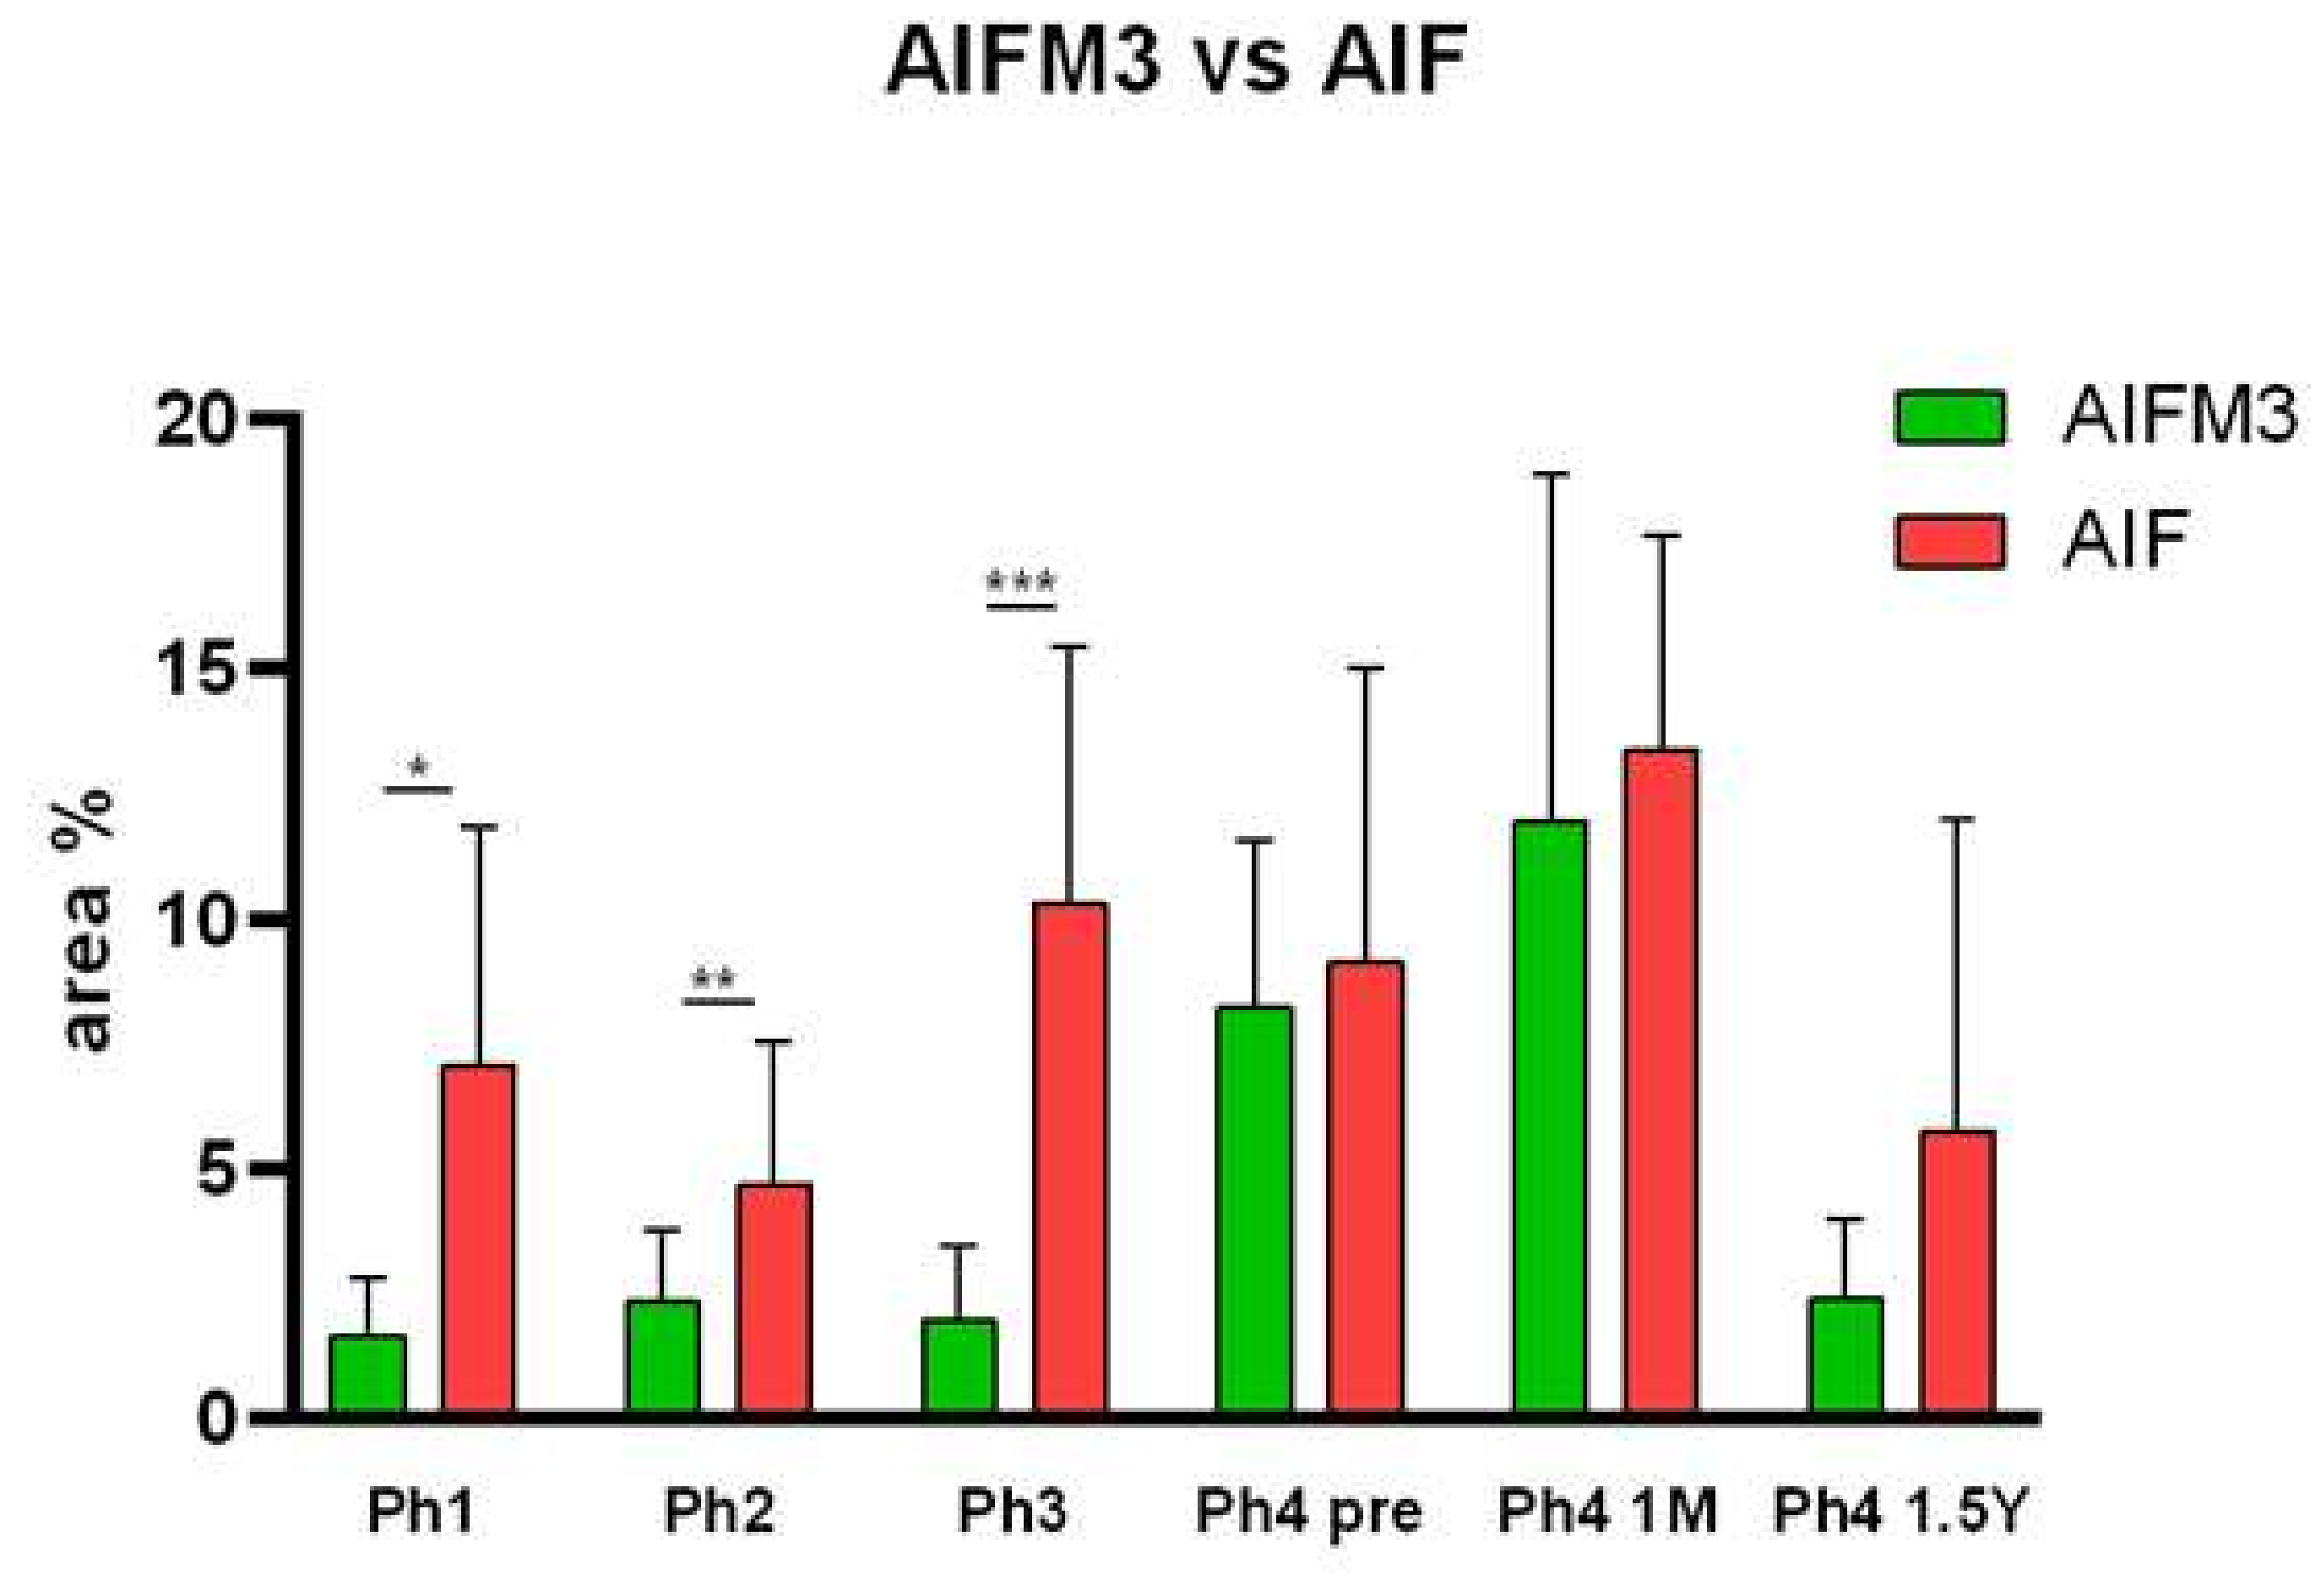
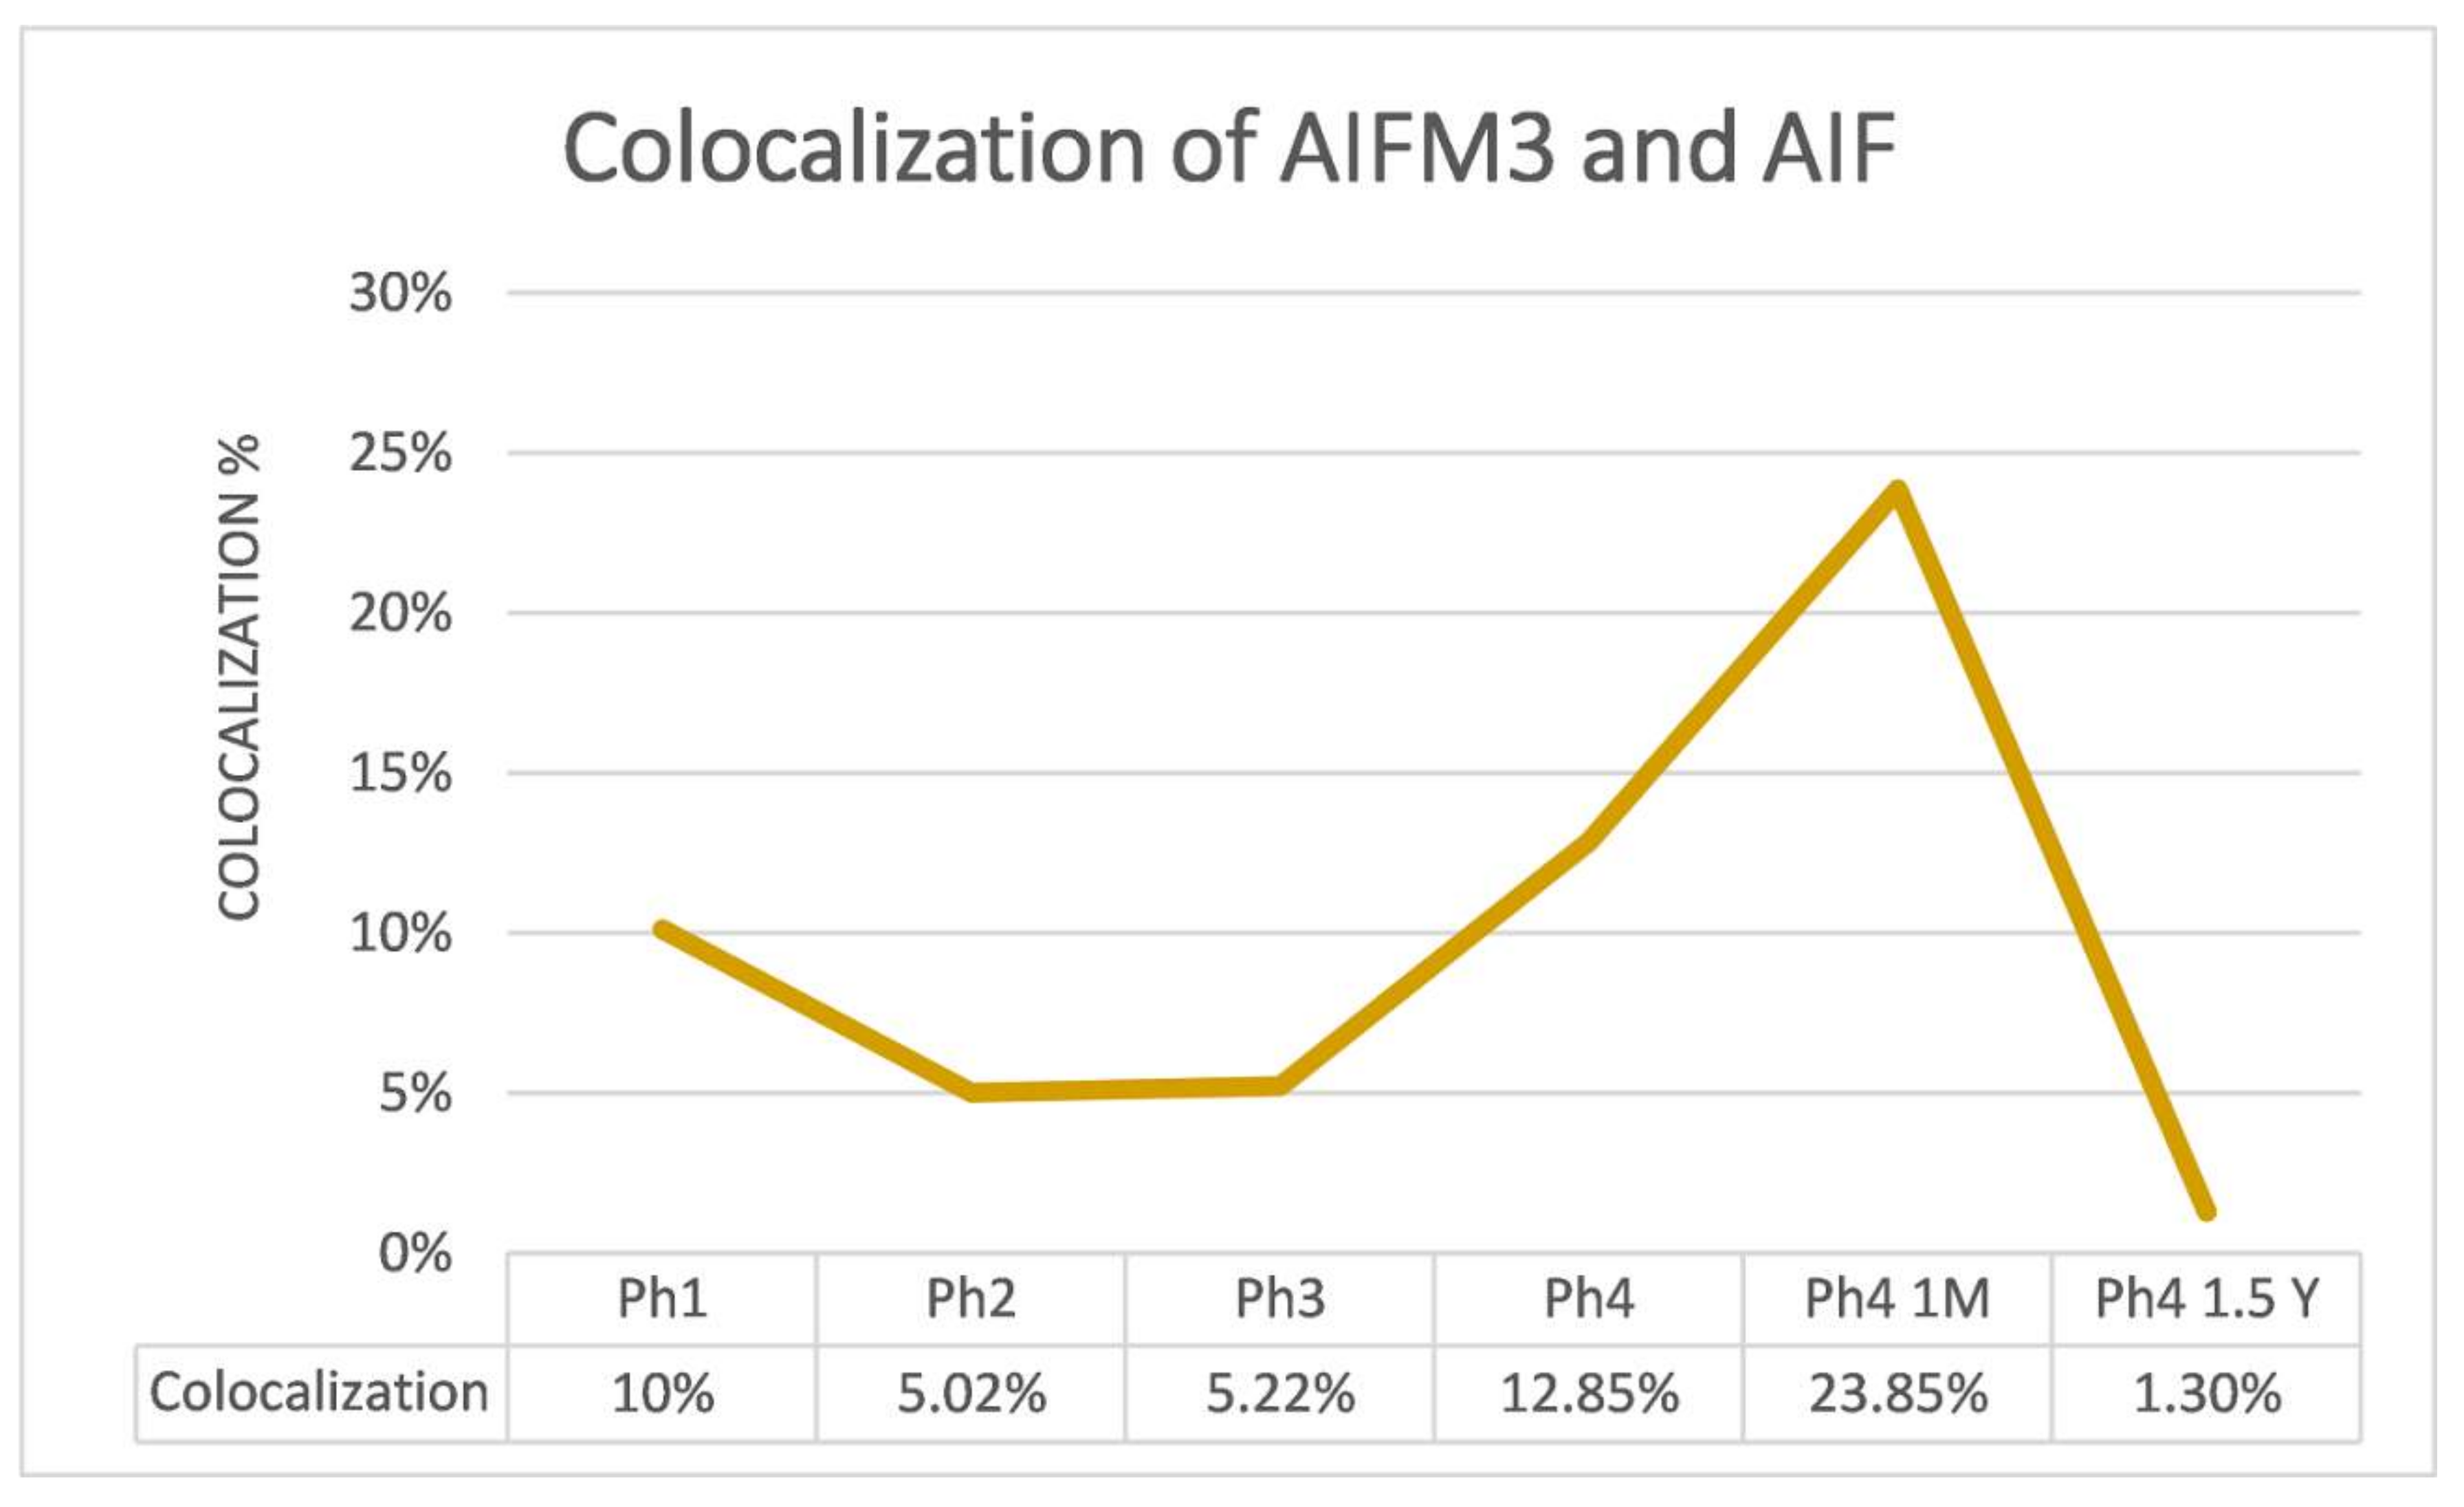
3.1. AIFM3
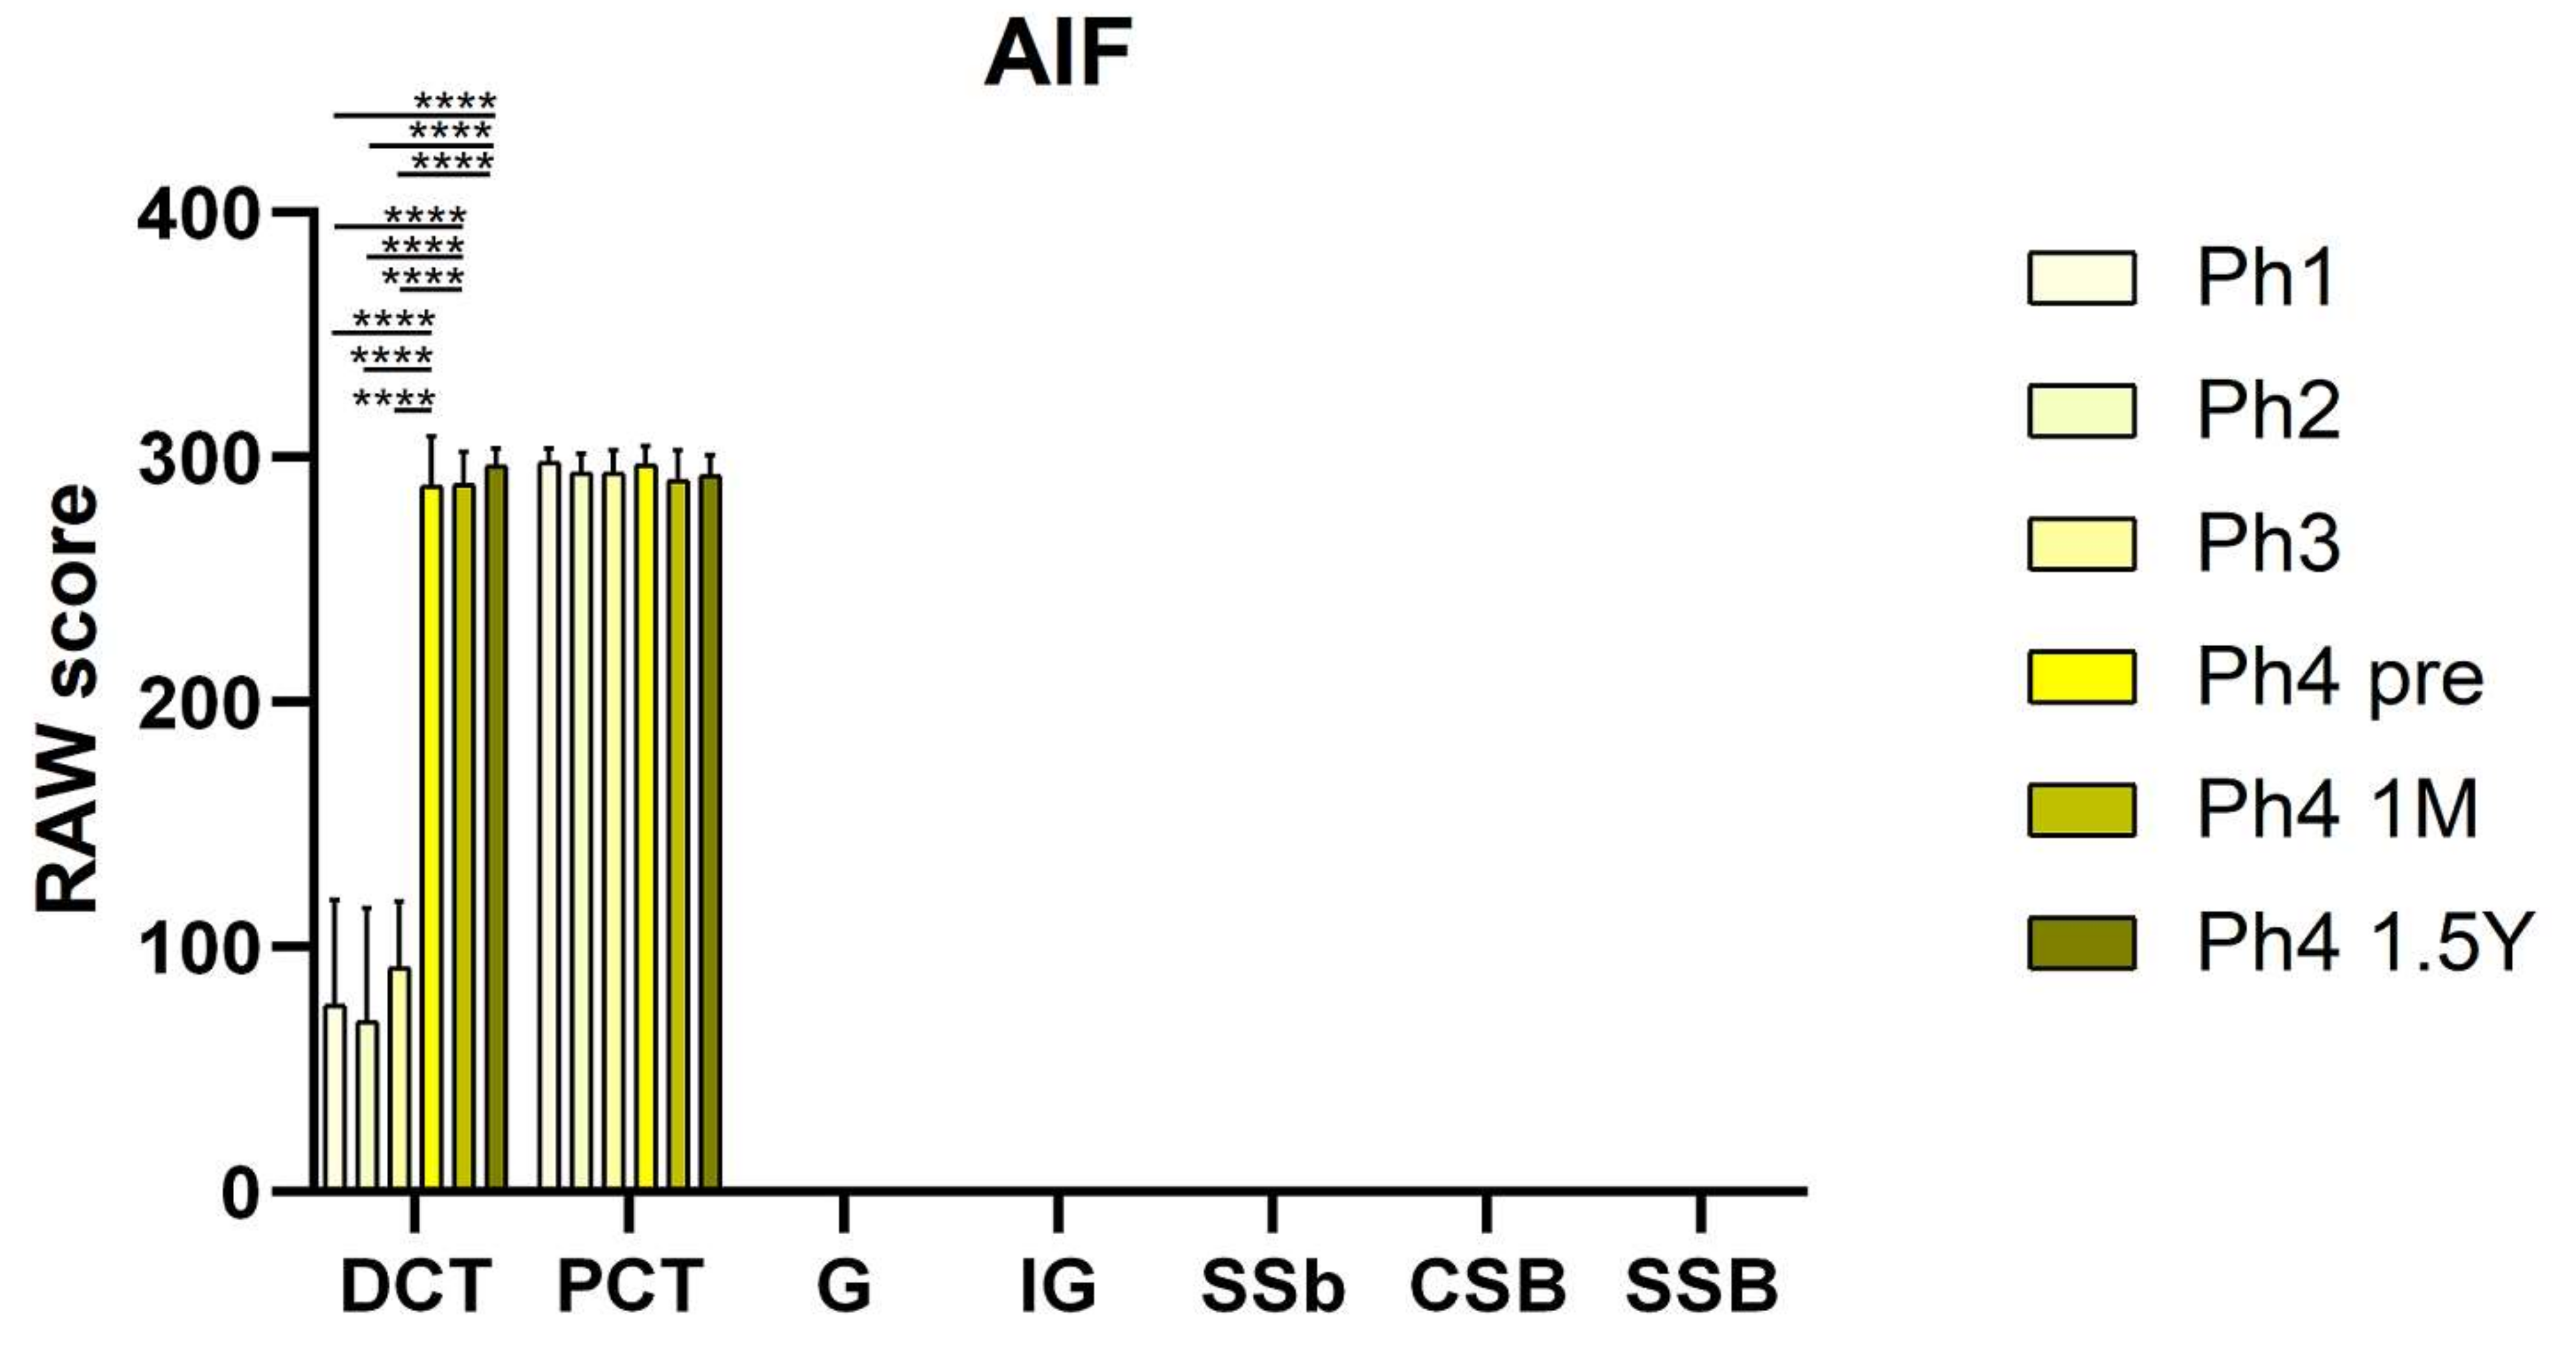
3.2. AIF
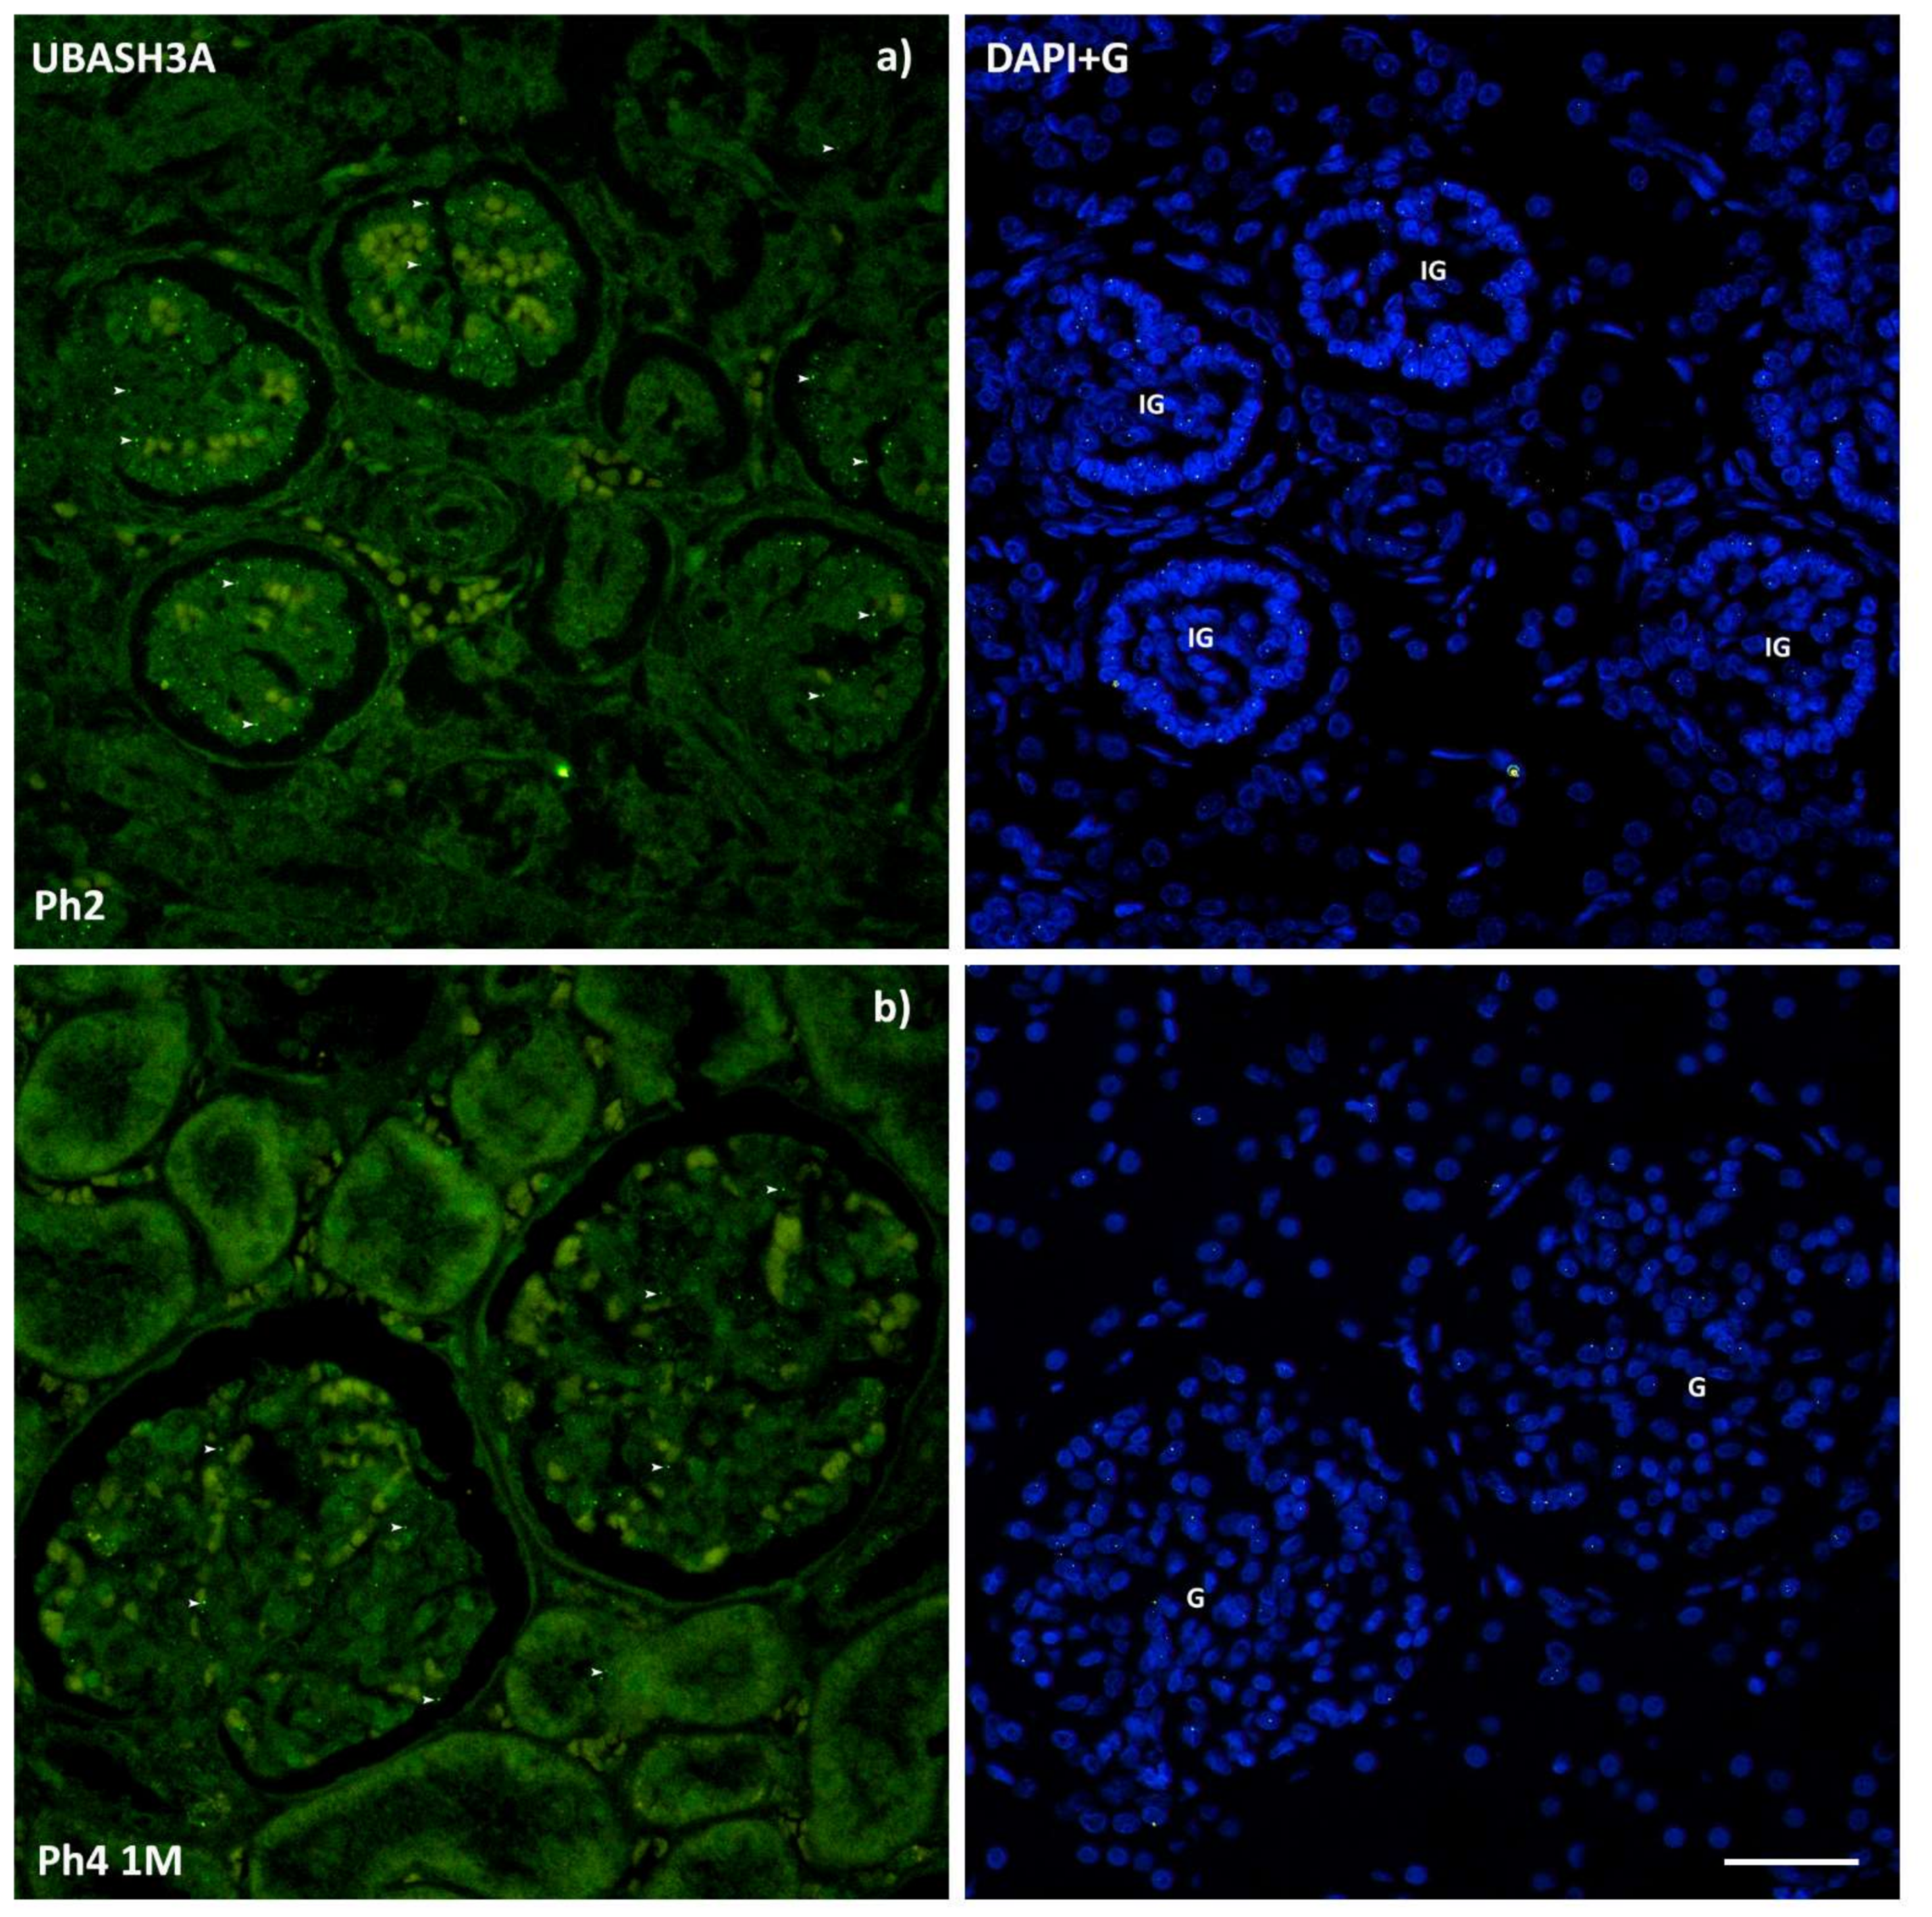
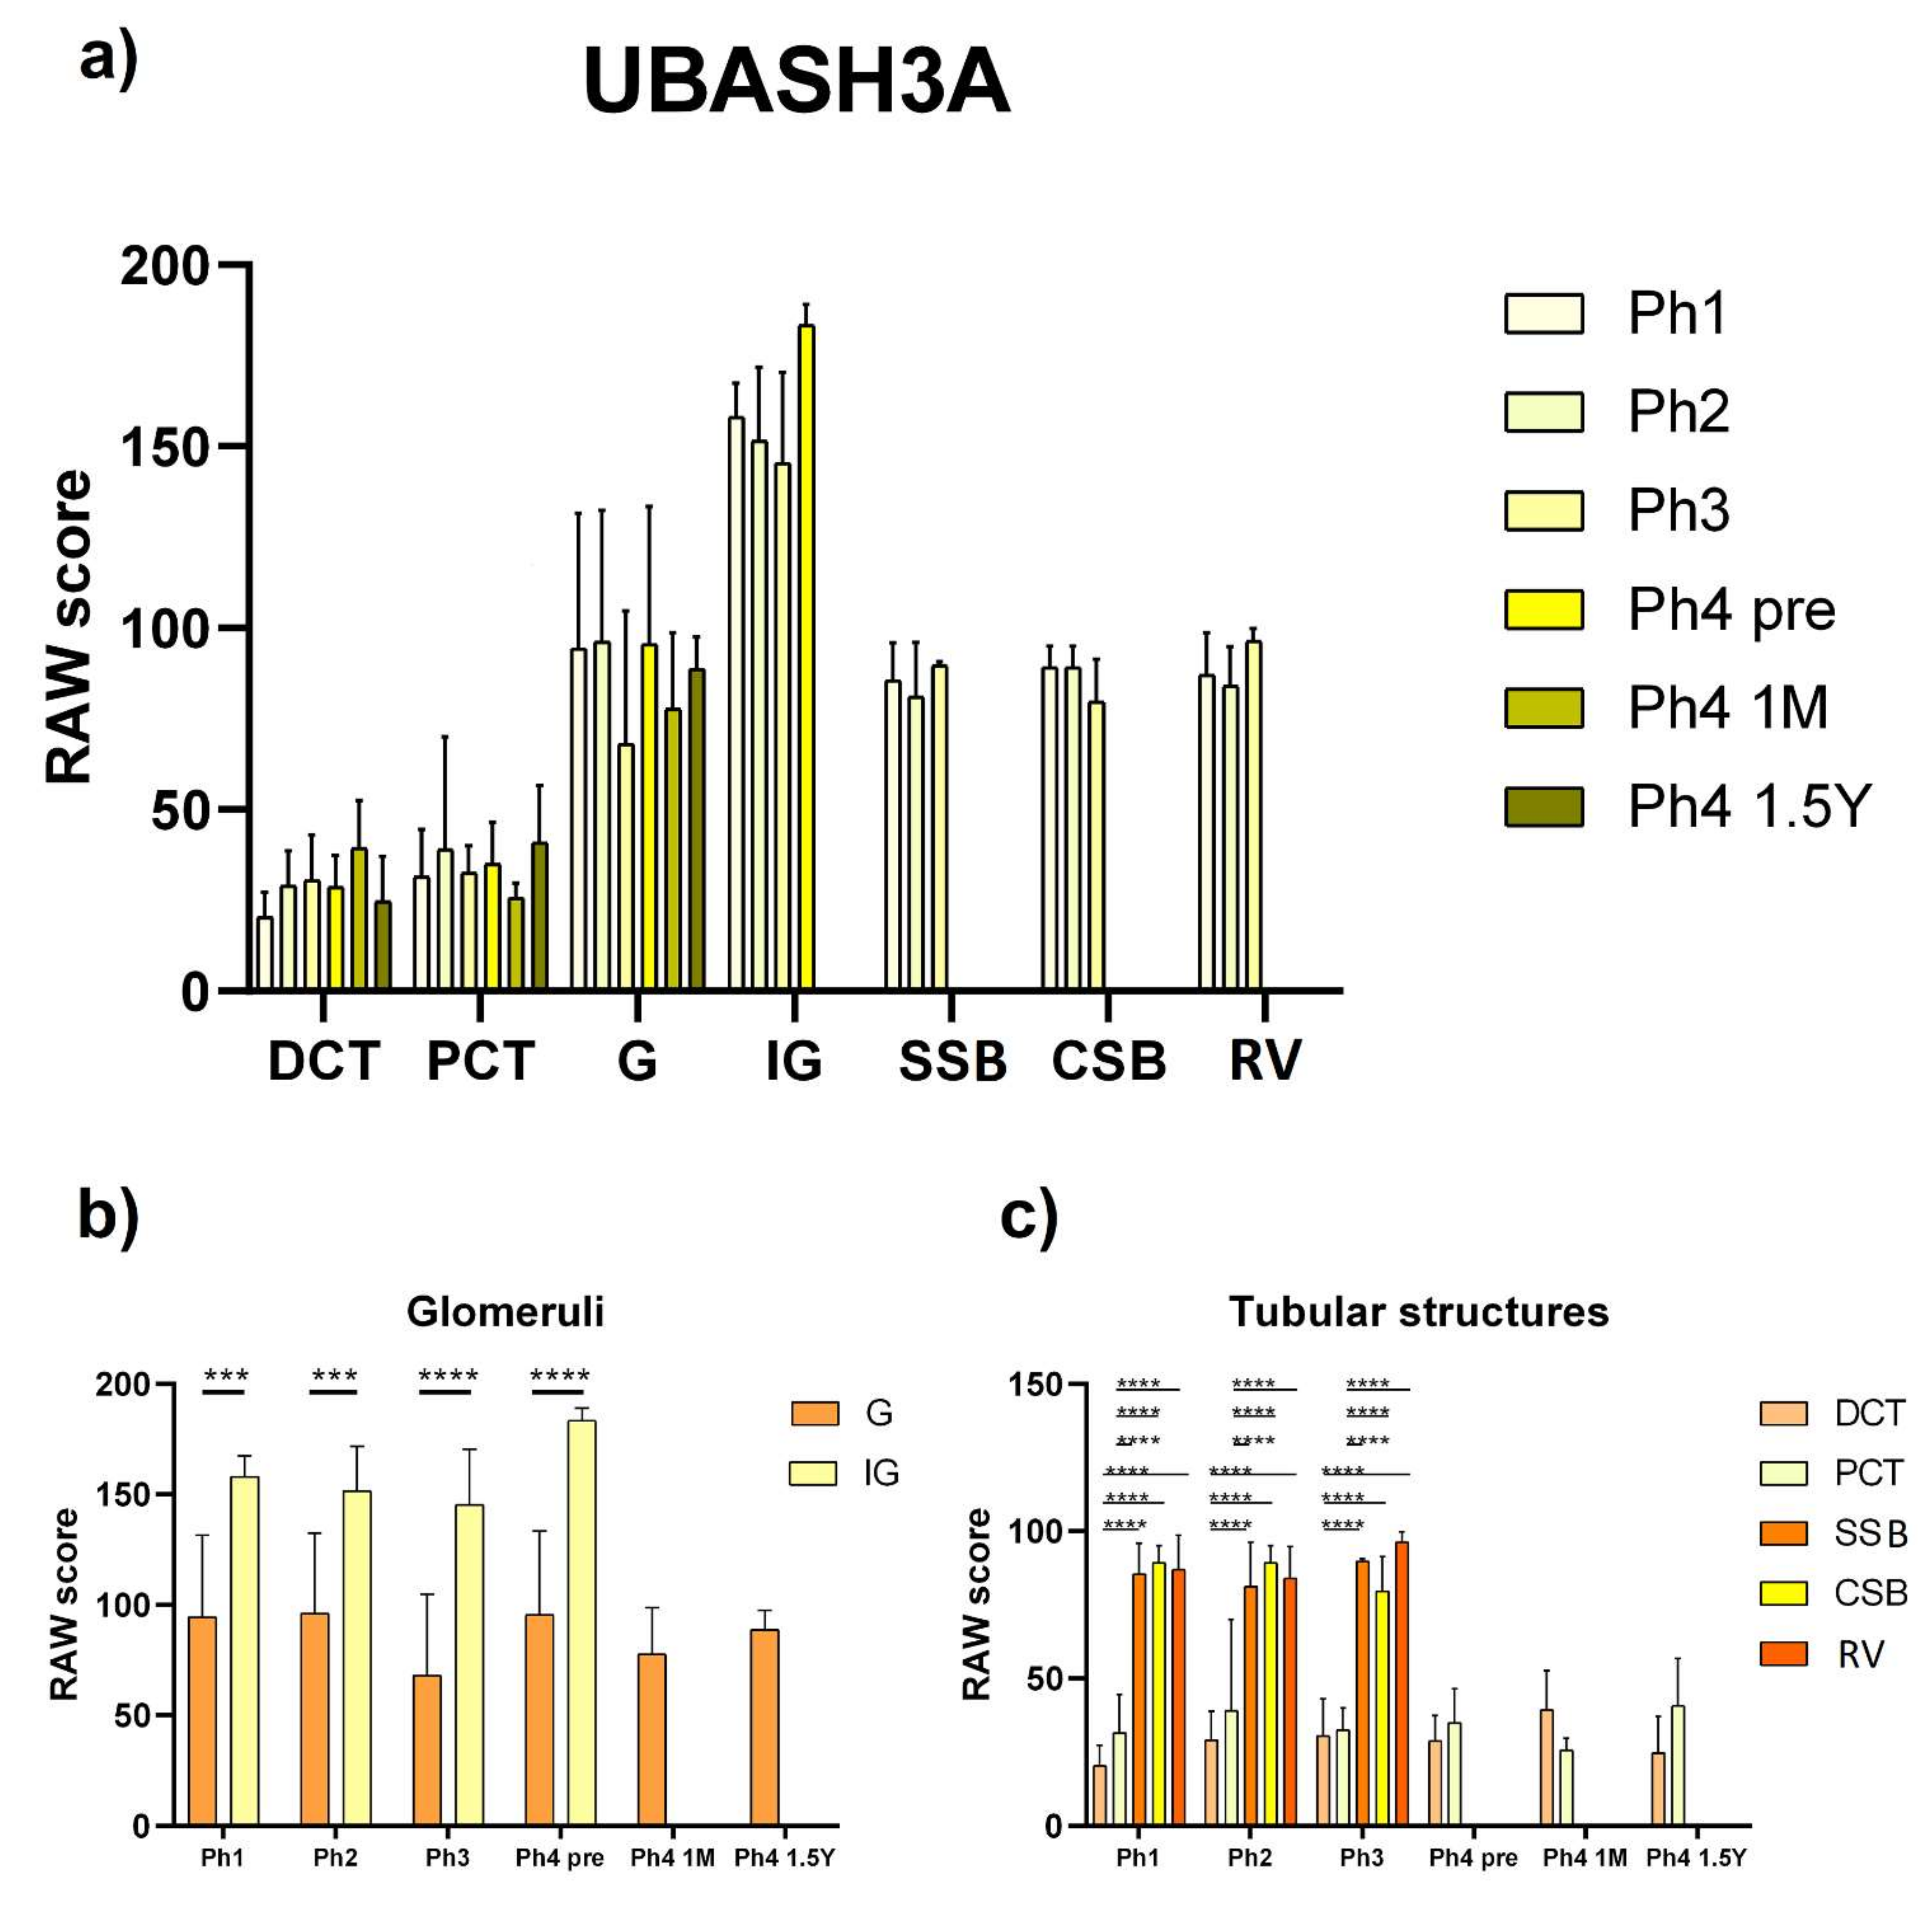
3.3. UBASH3A
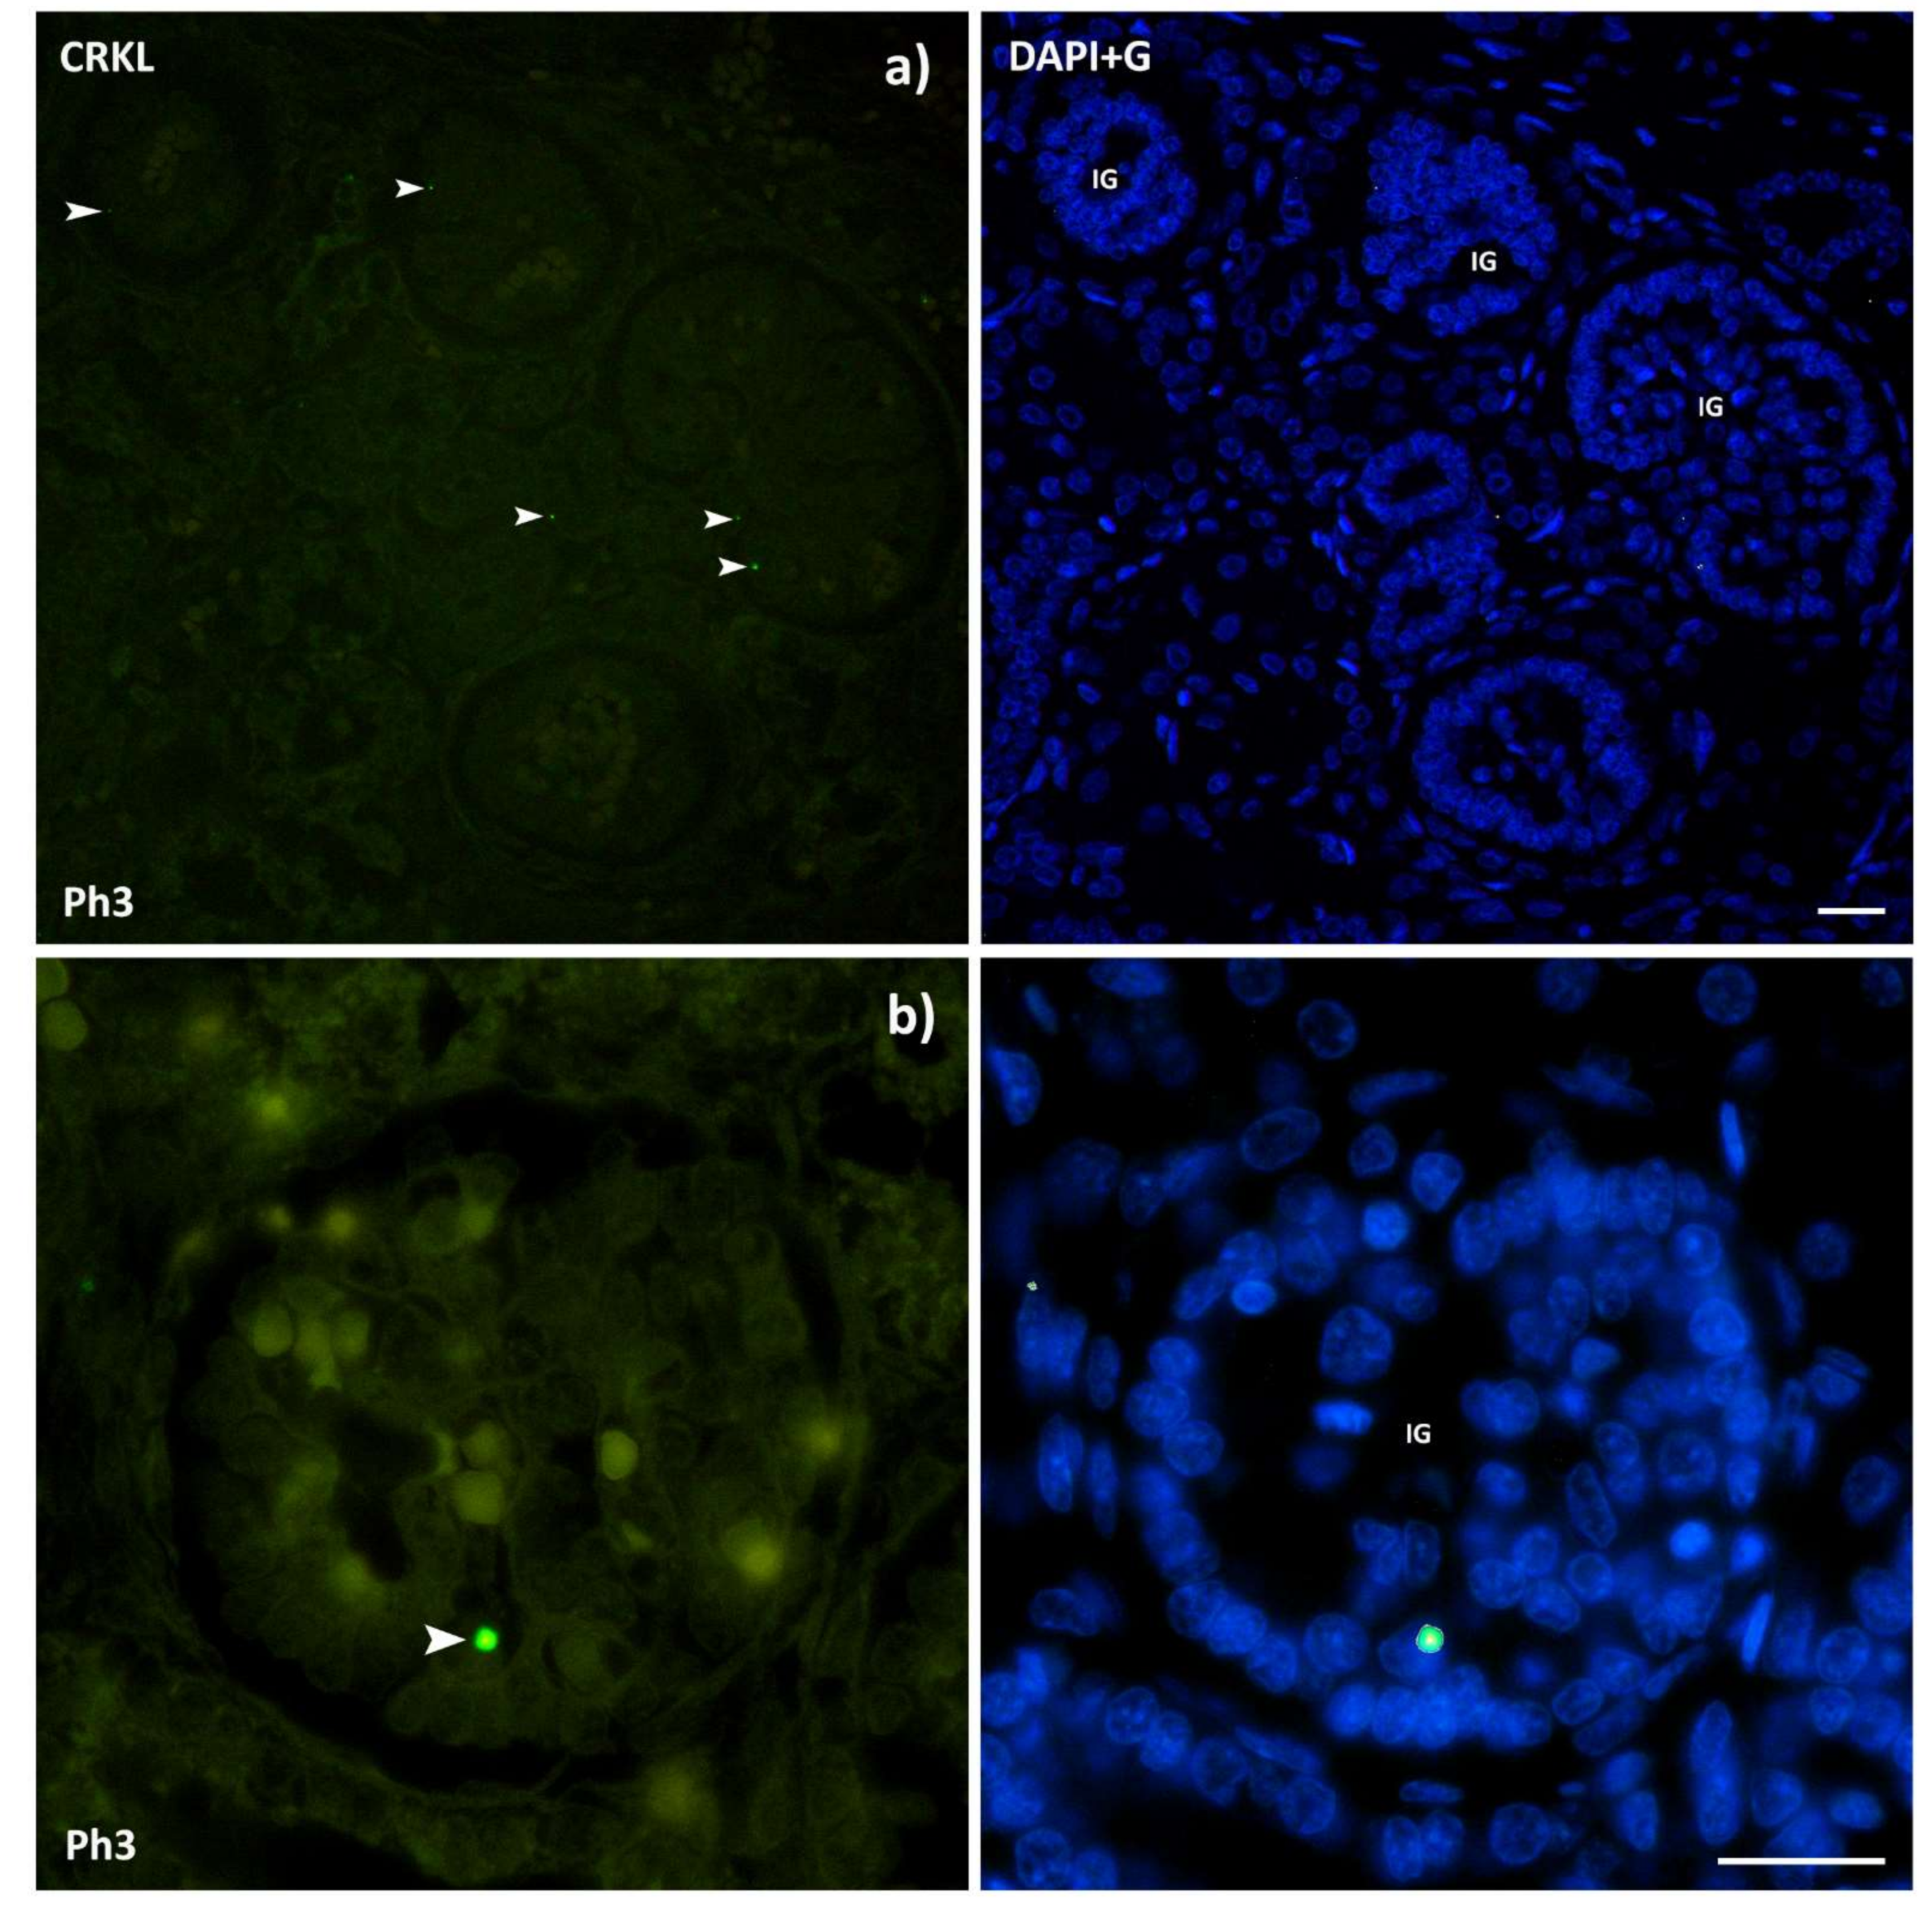
3.4. CRKL
3.5. BCL2
4. Discussion
5. Conclusions
Author Contributions
Funding
Institutional Review Board Statement
Informed Consent Statement
Data Availability Statement
Conflicts of Interest
References
- Rehman, S.; Ahmed, D. Embryology, Kidney, Bladder, and Ureter; StatPearls Publishing: Treasure Island, FL, USA, 2021. Available online: https://www.ncbi.nlm.nih.gov/books/NBK547747/ (accessed on 11 July 2021).
- Potter, E.L. Normal and Abnormal Development of the Kidney; Year Book Medical Publishers: Chicago, IL, USA, 1972. [Google Scholar]
- Little, M.H. Kidney Development, Disease, Repair and Regeneration; Academic Press: Cambridge, MA, USA, 2015; pp. 1–614. [Google Scholar] [CrossRef]
- Quigley, R. Developmental changes in renal function. Curr. Opin. Pediatr. 2012, 24, 184–190. [Google Scholar] [CrossRef]
- Capone, V.P.; Morello, W.; Taroni, F.; Montini, G. Genetics of Congenital Anomalies of the Kidney and Urinary Tract: The Current State of Play. Int. J. Mol. Sci. 2017, 18, 796. [Google Scholar] [CrossRef] [Green Version]
- Chesnaye, N.; Bonthuis, M.; Schaefer, F.; Groothoff, J.W.; Verrina, E.; Heaf, J.G.; Van Stralen, K.J. Demographics of paediatric renal replacement therapy in Europe: A report of the ESPN/ERA-EDTA registry. Pediatr. Nephrol. 2014, 29, 2403–2410. [Google Scholar] [CrossRef]
- Lin, I.; Afshar, Y.; Goldstein, J.; Grossman, J.; Grody, W.W.; Quintero-Rivera, F. Central 22q11.2 deletion (LCR22 B-D) in a fetus with severe fetal growth restriction and a mother with severe systemic lupus erythematosus: Further evidence of CRKL haploinsufficiency in the pathogenesis of 22q11.2 deletion syndrome. Am. J. Med. Genet. A 2021. [Google Scholar] [CrossRef] [PubMed]
- Segovis, C.M.; Schoon, R.A.; Dick, C.J.; Nacusi, L.P.; Leibson, P.J.; Billadeau, D.D. PI3K links NKG2D signaling to a CrkL pathway involved in natural killer cell adhesion, polarity, and granule secretion. J. Immunol. 2009, 182, 6933–6942. [Google Scholar] [CrossRef] [PubMed] [Green Version]
- Senechal, K.; Halpern, J.; Sawyers, C.L. The CRKL adaptor protein transforms fibroblasts and functions in transformation by the BCR-ABL oncogene. J. Biol. Chem. 1996, 271, 23255–23261. [Google Scholar] [CrossRef] [PubMed] [Green Version]
- Senechal, K.; Halpern, J.; Sawyers, C.L. CrkL regulates SDF-1-induced breast cancer biology through balancing Erk1/2 and PI3K/Akt pathways. Med. Oncol. 2015, 32, 1–8. [Google Scholar]
- Yu, M.; Gong, Z.P.; Ma, Z.L.; Yao, Z.F.; Liu, C.; Wang, J.; Zhang, Z.X. CRKL promotes proliferation, migration, invasion of laryngeal squamous cell carcinoma. Eur. Rev. Med. Pharmacol. Sci. 2020, 24, 5473–5480. [Google Scholar]
- Birge, R.B.; Kalodimos, C.; Inagaki, F.; Tanaka, S. Crk and CrkL adaptor proteins: Networks for physiological and pathological signaling. Cell Commun. Signal. 2009, 7, 1–23. [Google Scholar] [CrossRef] [Green Version]
- Moon, A.M.; Guris, D.L.; Seo, J.H.; Li, L.; Hammond, J.; Talbot, A.; Imamoto, A. Crkl deficiency disrupts Fgf8 signaling in a mouse model of 22q11 deletion syndromes. Dev. Cell 2006, 10, 71–80. [Google Scholar] [CrossRef] [Green Version]
- Schedl, A. Renal abnormalities and their developmental origin. Nat. Rev. Genet. 2007, 8, 791–802. [Google Scholar] [CrossRef] [PubMed]
- Haller, M.; Mo, Q.; Imamoto, A.; Lamb, D.J. Murine model indicates 22q11.2 signaling adaptor CRKL is a dosage-sensitive regulator of genitourinary development. Proc. Natl. Acad. Sci. USA 2017, 114, 4981–4986. [Google Scholar] [CrossRef] [Green Version]
- Lopez-Rivera, E.; Liu, Y.P.; Verbitsky, M.; Anderson, B.R.; Capone, V.P.; Otto, E.A.; Sanna-Cherchi, S. Genetic Drivers of Kidney Defects in the DiGeorge Syndrome. N. Engl. J. Med. 2017, 376, 742–754. [Google Scholar] [CrossRef] [PubMed] [Green Version]
- Du, J.; Meng, L.; Pang, L.; Jin, B.; Duan, N.; Huang, C.; Li, H. Crk1/2 and CrkL play critical roles in maintaining podocyte morphology and function. Exp. Cell Res. 2020, 394, 112135. [Google Scholar] [CrossRef]
- George, B.; Fan, Q.; Dlugos, C.P.; Soofi, A.A.; Zhang, J.; Verma, R.; Holzman, L.B. Crk1/2 and CrkL form a hetero-oligomer and functionally complement each other during podocyte morphogenesis. Kidney Int. 2014, 85, 1382–1394. [Google Scholar] [CrossRef] [Green Version]
- Xie, Q.; Lin, T.; Zhang, Y.; Zheng, J.; Bonanno, J.A. Molecular cloning and characterization of a human AIF-like gene with ability to induce apoptosis. J. Biol. Chem. 2005, 280, 19673–19681. [Google Scholar] [CrossRef] [PubMed] [Green Version]
- Novo, N.; Ferreira, P.; Medina, M. The apoptosis-inducing factor family: Moonlighting proteins in the crosstalk between mitochondria and nuclei. IUBMB Life 2021, 73, 568–581. [Google Scholar] [CrossRef]
- Murata, Y.; Furuyama, I.; Oda, S.; Mitani, H. A novel Rieske-type protein derived from an apoptosis-inducing factor-like (AIFL) transcript with a retained intron 4 induces change in mitochondrial morphology and growth arrest. Biochem. Biophys. Res. Commun. 2011, 407, 92–97. [Google Scholar] [CrossRef]
- Zheng, A.; Zhang, L.; Song, X.; Wang, Y.; Wei, M.; Jin, F. Clinical implications of a novel prognostic factor AIFM3 in breast cancer patients. BMC Cancer 2019, 19, 1–11. [Google Scholar] [CrossRef] [PubMed] [Green Version]
- Beaman, G.M.; Woolf, A.S.; Cervellione, R.M.; Keene, D.; Mushtaq, I.; Urquhart, J.E.; Newman, W.G. 22q11.2 duplications in a UK cohort with bladder exstrophy-epispadias complex. Am. J. Med. Genet. A 2019, 179, 404–409. [Google Scholar] [CrossRef] [PubMed]
- Guris, D.L.; Fantes, J.; Tara, D.; Druker, B.J.; Imamoto, A. Mice lacking the homologue of the human 22q11.2 gene CRKL phenocopy neurocristopathies of DiGeorge syndrome. Nat. Genet. 2001, 27, 293–298. [Google Scholar] [CrossRef]
- Bano, D.; Prehn, J.H. Apoptosis-Inducing Factor (AIF) in Physiology and Disease: The Tale of a Repented Natural Born Killer. EBioMedicine 2018, 30, 29–37. [Google Scholar] [CrossRef] [Green Version]
- Delavallée, L.; Mathiah, N.; Cabon, L.; Mazeraud, A.; Brunelle-Navas, M.N.; Lerner, L.K.; Susin, S.A. Mitochondrial AIF loss causes metabolic reprogramming, caspase-independent cell death blockade, embryonic lethality, and perinatal hydrocephalus. Mol. Metab. 2020, 40, 101027. [Google Scholar] [CrossRef] [PubMed]
- Ghezzi, D.; Sevrioukova, I.; Invernizzi, F.; Lamperti, C.; Mora, M.; D’Adamo, P.; Zeviani, M. Severe X-linked mitochondrial encephalomyopathy associated with a mutation in apoptosis-inducing factor. Am. J. Hum. Genet. 2010, 86, 639–649. [Google Scholar] [CrossRef] [PubMed] [Green Version]
- Rinaldi, C.; Grunseich, C.; Sevrioukova, I.F.; Schindler, A.; Horkayne-Szakaly, I.; Lamperti, C.; Fischbeck, K.H. Cowchock syndrome is associated with a mutation in apoptosis-inducing factor. Am. J. Hum. Genet. 2012, 91, 1095–1102. [Google Scholar] [CrossRef] [PubMed] [Green Version]
- Zong, L.; Guan, J.; Ealy, M.; Zhang, Q.; Wang, D.; Wang, H.; Wang, Q. Mutations in apoptosis-inducing factor cause X-linked recessive auditory neuropathy spectrum disorder. J. Med. Genet. 2015, 52, 523–531. [Google Scholar] [CrossRef] [Green Version]
- Kostic, S.; Hauke, T.; Ghahramani, N.; Filipovic, N.; Vukojevic, K. Expression pattern of apoptosis-inducing factor in the kidneys of streptozotocin-induced diabetic rats. Acta Histochem. 2020, 122, 151655. [Google Scholar] [CrossRef]
- Herrmann, J.M.; Riemer, J. Apoptosis inducing factor and mitochondrial NADH dehydrogenases: Redox-controlled gear boxes to switch between mitochondrial biogenesis and cell death. Biol. Chem. 2021, 402, 289–297. [Google Scholar] [CrossRef]
- Carev, D.; Krni, D.; Saraga, M.; Sapunar, D.; Saraga-Babi, M. Role of mitotic, pro-apoptotic and anti-apoptotic factors in human kidney development. Pediatr. Nephrol. 2006, 21, 627–636. [Google Scholar] [CrossRef]
- Borkan, S.C. The Role of BCL-2 Family Members in Acute Kidney Injury. Semin. Nephrol. 2016, 36, 237–250. [Google Scholar] [CrossRef]
- Gobe, G.; Zhang, X.J.; Cuttle, L.; Pat, B.; Willgoss, D.; Hancock, J.; Endre, Z. Bcl-2 genes and growth factors in the pathology of ischaemic acute renal failure. Immunol. Cell Biol. 1999, 77, 279–286. [Google Scholar] [CrossRef]
- Tsygankov, A.Y. TULA-family proteins: Jacks of many trades and then some. J. Cell. Physiol. 2018, 234, 274–288. [Google Scholar] [CrossRef] [PubMed] [Green Version]
- Wattenhofer, M.; Shibuya, K.; Kudoh, J.; Lyle, R.; Michaud, J.; Rossier, C.; Scott, H. Isolation and characterization of the UBASH3A gene on 21q22.3 encoding a potential nuclear protein with a novel combination of domains. Hum. Genet. 2001, 108, 140–147. [Google Scholar] [CrossRef] [PubMed]
- Collingwood, T.S.; Smirnova, E.V.; Bogush, M.; Carpino, N.; Annan, R.S.; Tsygankov, A.Y. T-cell ubiquitin ligand affects cell death through a functional interaction with apoptosis-inducing factor, a key factor of caspase-independent apoptosis. J. Biol. Chem. 2007, 282, 30920–30928. [Google Scholar] [CrossRef] [Green Version]
- Ahn, J.; Han, K.S.; Heo, J.H.; Bang, D.; Kang, Y.H.; Jin, H.A.; Ham, W.S. FOXC2 and CLIP4: A potential biomarker for synchronous metastasis of ≤7-cm clear cell renal cell carcinomas. Oncotarget 2016, 7, 51423–51434. [Google Scholar] [CrossRef] [PubMed]
- Pusic, T.V.; Janjic, T.; Dujmovic, I.; Poljicanin, A.; Soljic, V.; Saraga-Babic, M.; Vukojevic, K. The involvement of proliferation and apoptosis in the early human gonad development. J. Mol. Histol. 2013, 44, 55–63. [Google Scholar] [CrossRef]
- Racetin, A.; Raguž, F.; Durdov, M.G.; Kunac, N.; Saraga, M.; Sanna-Cherchi, S.; Vukojević, K. Immunohistochemical expression pattern of RIP5, FGFR1, FGFR2 and HIP2 in the normal human kidney development. Acta Histochem. 2019, 121, 531–538. [Google Scholar] [CrossRef]
- Vukojevic, K.; Raguz, F.; Saraga, M.; Filipovic, N.; Bocina, I.; Kero, D.; Saraga-Babic, M. Glomeruli from patients with nephrin mutations show increased number of ciliated and poorly differentiated podocytes. Acta Histochem. 2018, 120, 748–756. [Google Scholar] [CrossRef]
- Lozić, M.; Filipović, N.; Jurić, M.; Kosović, I.; Benzon, B.; Šolić, I.; Vukojević, K. Alteration of Cx37, Cx40, Cx43, Cx45, Panx1, and Renin Expression Patterns in Postnatal Kidneys of Dab1-/- (yotari) Mice. Int. J. Mol. Sci. 2021, 22, 1284. [Google Scholar] [CrossRef]
- Park, T.J.; Curran, T. Crk and Crk-like play essential overlapping roles downstream of disabled-1 in the Reelin pathway. J. Neurosci. 2008, 28, 13551–13562. [Google Scholar] [CrossRef] [Green Version]
- Racetin, A.; Filipović, N.; Lozić, M.; Ogata, M.; Gudelj Ensor, L.; Kelam, N.; Vukojević, K. A homozygous dab1−/− is a potential novel cause of autosomal recessive congenital anomalies of the mice kidney and urinary tract. Biomolecules 2021, 11, 609. [Google Scholar] [CrossRef]
- Racetin, A.; Jurić, M.; Filipović, N.; Šolić, I.; Kosović, I.; Durdov, M.G.; Vukojević, K. Expression and localization of DAB1 and Reelin during normal human kidney development. Croat. Med. J. 2019, 60, 521–531. [Google Scholar] [CrossRef] [PubMed]
- Stuart, R.O.; Bush, K.T.; Nigam, S.K. Changes in global gene expression patterns during development and maturation of the rat kidney. Proc. Natl. Acad. Sci. USA 2001, 98, 5649–5654. [Google Scholar] [CrossRef] [PubMed] [Green Version]
- Bard, J.B. Growth and death in the developing mammalian kidney: Signals, receptors and conversations. Bioessays 2002, 24, 72–82. [Google Scholar] [CrossRef] [PubMed]
- Gattineni, J.; Baum, M. Developmental changes in renal tubular transport-an overview. Pediatr. Nephrol. 2015, 30, 2085–2098. [Google Scholar] [CrossRef] [PubMed] [Green Version]
- Boron, W.F.; Boulpaep, E.L. Medical Physiology, 2e Updated Edition: With Student Consult; Online Access; Elsevier Health Sciences: Oxford, UK, 2012. [Google Scholar]
- Schwartz, G.J.; Evan, A.P. Development of solute transport in rabbit proximal tubule. I. HCO3- and glucose absorption. Am. J. Physiol. Ren. Fluid Electrolyte Physiol. 1983, 245, F382–F390. [Google Scholar] [CrossRef]
- Schwartz, G.J.; Evan, A.P. Development of solute transport in rabbit proximal tubule. III. Na-K-ATPase activity. Am. J. Physiol. 1984, 246, F845–F852. [Google Scholar] [CrossRef]
- Schmidt, U.; Horster, M. Na-K-activated ATPase: Activity maturation in rabbit nephron segments dissected in vitro. Am. J. Physiol. Ren. Physiol. 1977, 233, F55–F60. [Google Scholar] [CrossRef]
- Horster, M.; Schmid, H.; Schmidt, U. Aldosterone in vitro restores nephron Na-K-ATPase of distal segments from adrenalectomized rabbits. Pflügers Arch. Eur. J. Physiol. 1980, 384, 203–206. [Google Scholar] [CrossRef]
- Adam-Vizi, V.; Chinopoulos, C. Bioenergetics and the formation of mitochondrial reactive oxygen species. Trends Pharmacol. Sci. 2006, 27, 639–645. [Google Scholar] [CrossRef]
- Zorov, D.B.; Juhaszova, M.; Sollott, S.J. Mitochondrial Reactive Oxygen Species (ROS) and ROS-Induced ROS Release. Physiol. Rev. 2014, 94, 909–950. [Google Scholar] [CrossRef] [PubMed] [Green Version]
- Araki, T.; Saruta, T.; Okano, H.; Miura, M. Caspase Activity Is Required for Nephrogenesis in the Developing Mouse Metanephros. Exp. Cell Res. 1999, 248, 423–429. [Google Scholar] [CrossRef] [PubMed]
- Tsygankov, A.Y. TULA proteins as signaling regulators. Cell. Signal. 2020, 65, 109424. [Google Scholar] [CrossRef]
- Bertelsen, V.; Breen, K.; Sandvig, K.; Stang, E.; Madshus, I.H. The Cbl-interacting protein TULA inhibits dynamin-dependent endocytosis. Exp. Cell Res. 2007, 313, 1696–1709. [Google Scholar] [CrossRef] [PubMed] [Green Version]
- De Jong, R.; ten Hoeve, J.; Heisterkamp, N.; Groffen, J. Crkl is complexed with tyrosine-phosphorylated Cbl in Ph-positive leukemia. J. Biol. Chem. 1995, 270, 21468–21471. [Google Scholar] [CrossRef] [Green Version]


| Gene | Forward Primer | Reverse Primer |
|---|---|---|
| CRKL | 5′-AGC AAT CCA GAA AAG AGT ACC C-3′ | 5′-TTC ACT TCG CCT TCC CAC-3′ |
| AIFM3 | 5′-CAA CCG CAA AGT GAACAT TCC-3′ | 5′-TCC AGA GGT AGG GCA CAG-3′ |
| AIF | 5′-AAG CAG GCTCTA ACA TCT GG-3′ | 5′-TTC TCC AGC CAA TCT TCC AC-3′ |
| BCL2 | 5′-GTG GAT GAC TGA GTA CCT GAA C-3′ | 5′-GCC AGG AGA AAT CAA ACA GAG G-3′ |
| UBASH3A | 5′-GAA TGG ACA AAA TGG GAA GCT G-3′ | 5′-TGT ACT CCT GGT AGC TCT CG-3′ |
| RPS9 | 5′-GGA TTT CTT AGA GAG ACG CCT G-3′ | 5′-GGA CAA TGA AGG ACG GGA TG-3′ |
Publisher’s Note: MDPI stays neutral with regard to jurisdictional claims in published maps and institutional affiliations. |
© 2021 by the authors. Licensee MDPI, Basel, Switzerland. This article is an open access article distributed under the terms and conditions of the Creative Commons Attribution (CC BY) license (https://creativecommons.org/licenses/by/4.0/).
Share and Cite
Lozic, M.; Minarik, L.; Racetin, A.; Filipovic, N.; Saraga Babic, M.; Vukojevic, K. CRKL, AIFM3, AIF, BCL2, and UBASH3A during Human Kidney Development. Int. J. Mol. Sci. 2021, 22, 9183. https://doi.org/10.3390/ijms22179183
Lozic M, Minarik L, Racetin A, Filipovic N, Saraga Babic M, Vukojevic K. CRKL, AIFM3, AIF, BCL2, and UBASH3A during Human Kidney Development. International Journal of Molecular Sciences. 2021; 22(17):9183. https://doi.org/10.3390/ijms22179183
Chicago/Turabian StyleLozic, Mirela, Luka Minarik, Anita Racetin, Natalija Filipovic, Mirna Saraga Babic, and Katarina Vukojevic. 2021. "CRKL, AIFM3, AIF, BCL2, and UBASH3A during Human Kidney Development" International Journal of Molecular Sciences 22, no. 17: 9183. https://doi.org/10.3390/ijms22179183
APA StyleLozic, M., Minarik, L., Racetin, A., Filipovic, N., Saraga Babic, M., & Vukojevic, K. (2021). CRKL, AIFM3, AIF, BCL2, and UBASH3A during Human Kidney Development. International Journal of Molecular Sciences, 22(17), 9183. https://doi.org/10.3390/ijms22179183