Article

Iterated Virtual Screening-Assisted Antiviral and Enzyme Inhibition Assays Reveal the Discovery of Novel Promising Anti-SARS-CoV-2 with Dual Activity

1
Research Institute for Medical and Health Sciences, University of Sharjah, Sharjah 27272, United Arab Emirates
2
Faculty of Pharmacy, Zagazig University, Zagazig 44519, Egypt
3
Chemistry of Natural and Microbial Product Department, National Research Centre, Cairo 12622, Egypt
4
Centre of Scientific Excellence for Influenza Viruses, National Research Centre, Giza 12622, Egypt
5
Manipal College of Pharmaceutical Sciences, Manipal Academy of Higher Education, Manipal 576104, India
6
College of Pharmacy, University of Sharjah, Sharjah 27272, United Arab Emirates
*
Author to whom correspondence should be addressed.
Int. J. Mol. Sci. 2021, 22(16), 9057; https://doi.org/10.3390/ijms22169057
Submission received: 19 July 2021 / Revised: 16 August 2021 / Accepted: 19 August 2021 / Published: 22 August 2021
(This article belongs to the Section Molecular Biophysics)

Abstract

:
Unfortunately, COVID-19 is still a threat to humankind and has a dramatic impact on human health, social life, the world economy, and food security. With the limited number of suggested therapies under clinical trials, the discovery of novel therapeutic agents is essential. Here, a previously identified anti-SARS-CoV-2 compound named Compound 13 (1,2,5-Oxadiazole-3-carboximidic acid, 4,4′-(methylenediimino) bis,bis[[(2-hydroxyphenyl)methylene]hydrazide) was subjected to an iterated virtual screening against SARS-CoV-2 Mpro using a combination of Ligand Designer and PathFinder. PathFinder, a computational reaction enumeration tool, was used for the rapid generation of enumerated structures via default reaction library. Ligand designer was employed for the computerized lead optimization and selection of the best structural modification that resulted in a favorable ligand–protein complex. The obtained compounds that showed the best binding to Mpro were re-screened against TMPRSS2, leading to the identification of 20 shared compounds. The compounds were further visually inspected, which resulted in the identification of five shared compounds M1–5 with dual binding affinity. In vitro evaluation and enzyme inhibition assay indicated that M3, an analogue of Compound 13 afforded by replacing the phenolic moiety with pyridinyl, possesses an improved antiviral activity and safety. M3 displayed in vitro antiviral activity with IC50 0.016 µM and Mpro inhibition activity with IC50 0.013 µM, 7-fold more potent than the parent Compound 13 and potent than the antivirals drugs that are currently under clinical trials. Moreover, M3 showed potent activity against human TMPRSS2 and furin enzymes with IC50 0.05, and 0.08 µM, respectively. Molecular docking, WaterMap analysis, molecular dynamics simulation, and R-group analysis confirmed the superiority of the binding fit to M3 with the target enzymes. WaterMap analysis calculated the thermodynamic properties of the hydration site in the binding pocket that significantly affects the biological activity. Loading M3 on zinc oxide nanoparticles (ZnO NPs) increased the antiviral activity of the compound 1.5-fold, while maintaining a higher safety profile. In conclusion, lead optimized discovery following an iterated virtual screening in association with molecular docking and biological evaluation revealed a novel compound named M3 with promising dual activity against SARS-CoV-2. The compound deserves further investigation for potential clinical-based studies.

1. Introduction

Severe acute respiratory syndrome coronavirus 2 (SARS-CoV-2) has caused an ongoing pandemic, as declared by the World Health Organization (WHO) on 11 March, 2020 [1]. It has become a global crisis with a severe impact on global public health and the economy, with unprecedentedly high mortality rate and ease of transmission [1]. Scientists have been working on developing vaccines and treatments to hinder the pandemic’s progress and lessen the disease’s risk factors. While several vaccines were recently granted emergency use authorization by the FDA, struggling to develop an effective drug against SARS-CoV-2 continues, as it is unlikely that vaccines alone can cease the pandemic because of continuous viral mutations [2,3,4]. In order to develop an anti-SARS-CoV-2 drug, it is necessary to identify possible drug targets for effective treatment with limited toxicity. The spike viral protein, the viral RNA-dependent RNA polymerase (RdRp), the viral main protease (Mpro), the viral papain-like protease (PLpro) and the human furin protease and human transmembrane serine protease 2 (TMPRSS2) are potential targets for developing anti-SARS-CoV-2 drugs [5]. Until now, the only drug with a direct action on viral replication by inhibiting RdRp protein function has been remdesivir. It received an emergency use authorization from the FDA, although some studies have shown that remdesivir has no benefits compared to placebo in treating SARS-CoV-2 infection [6]. Some other drugs are still in clinical trials, such as AT-527, EIDD-2801, favipiravir, PF-07321332, PF-07304814, and niclosamide [4,7,8,9,10]. However, all the drugs mentioned are focused on either RdRp or Mpro. With the recent emergence of several SARS-CoV-2 variants from other continents (the UK, South Africa, Brazil, and India variants) [11], it is important to develop a potential candidate with multiple targeting activities.
Recently, we discovered that Compound 13 is a promising anti-SARS-CoV-2 treatment through dual targeting the activity of SARS-CoV-2 Mpro and human furin proteases [12]. The discovery of the compound was made following a virtual screening of 500,000 compounds, available in databases in association with molecular docking studies, enzyme inhibition screening assay, and in vitro confirmation [12]. Herein, Compound 13 was used as a lead to discover a compound with more efficient binding activity against SARS-CoV-2 Mpro following iterated virtual screening. This was followed by filtering the selected compounds against TMPRSS2 for potential dual activity. The compounds showing potential shared binding activity were purchased and evaluated by in vitro antiviral activity and enzyme inhibition assay.
The limited bioavailability of some potential anti-SARS-CoV-2 drugs, such as PF-00835231 and GC-376, has diminished their efficacy in the clinical trials [10]. Therefore, zinc oxide nanoparticles (ZnO NPs) were employed in this study as a drug carrier [13] to enhance the bioavailability and efficacy of the selected compound.
The high mutation rate of SARS-CoV-2 encourages the use of a combination therapy or dual inhibitor drugs to combat the emerged viral resistance; however, the advantages of a dual inhibitor drug over a combination therapy can include (i) reducing the number of administered drugs, dosing, toxicity, and drug–drug interactions [14,15]; (ii) increasing patient compliance and avoid patient confusion; (iii) enhancing the sustained release of the drug; and (iv) reducing the probability of drug resistance and providing a platform for easier modification for possible future outbreaks [16]. A dual inhibitor approach has been developed against HIV [17] and influenza viruses [18] and showed great activity when compared to FDA-approved antiviral drugs. Furthermore, the encapsulation of a dual inhibitor drug over the formulation of two independent drugs adds more advantages as combination regimens often suffer from variations in the formulation properties, such as (i) particle size and surface charge; (ii) physicochemical properties may effect on formulation, handling, testing the activities in vitro and in vivo; (iii) solubility issue during formulation and bioavailability testing; and (iv) variable pharmacokinetics among different drugs [19].
This work presents the discovery of novel compounds with dual activity against critical SARS-CoV-2 targets, including viral and human proteases, with a proven efficacy in vitro and limited toxicity on normal human cells.

2. Results

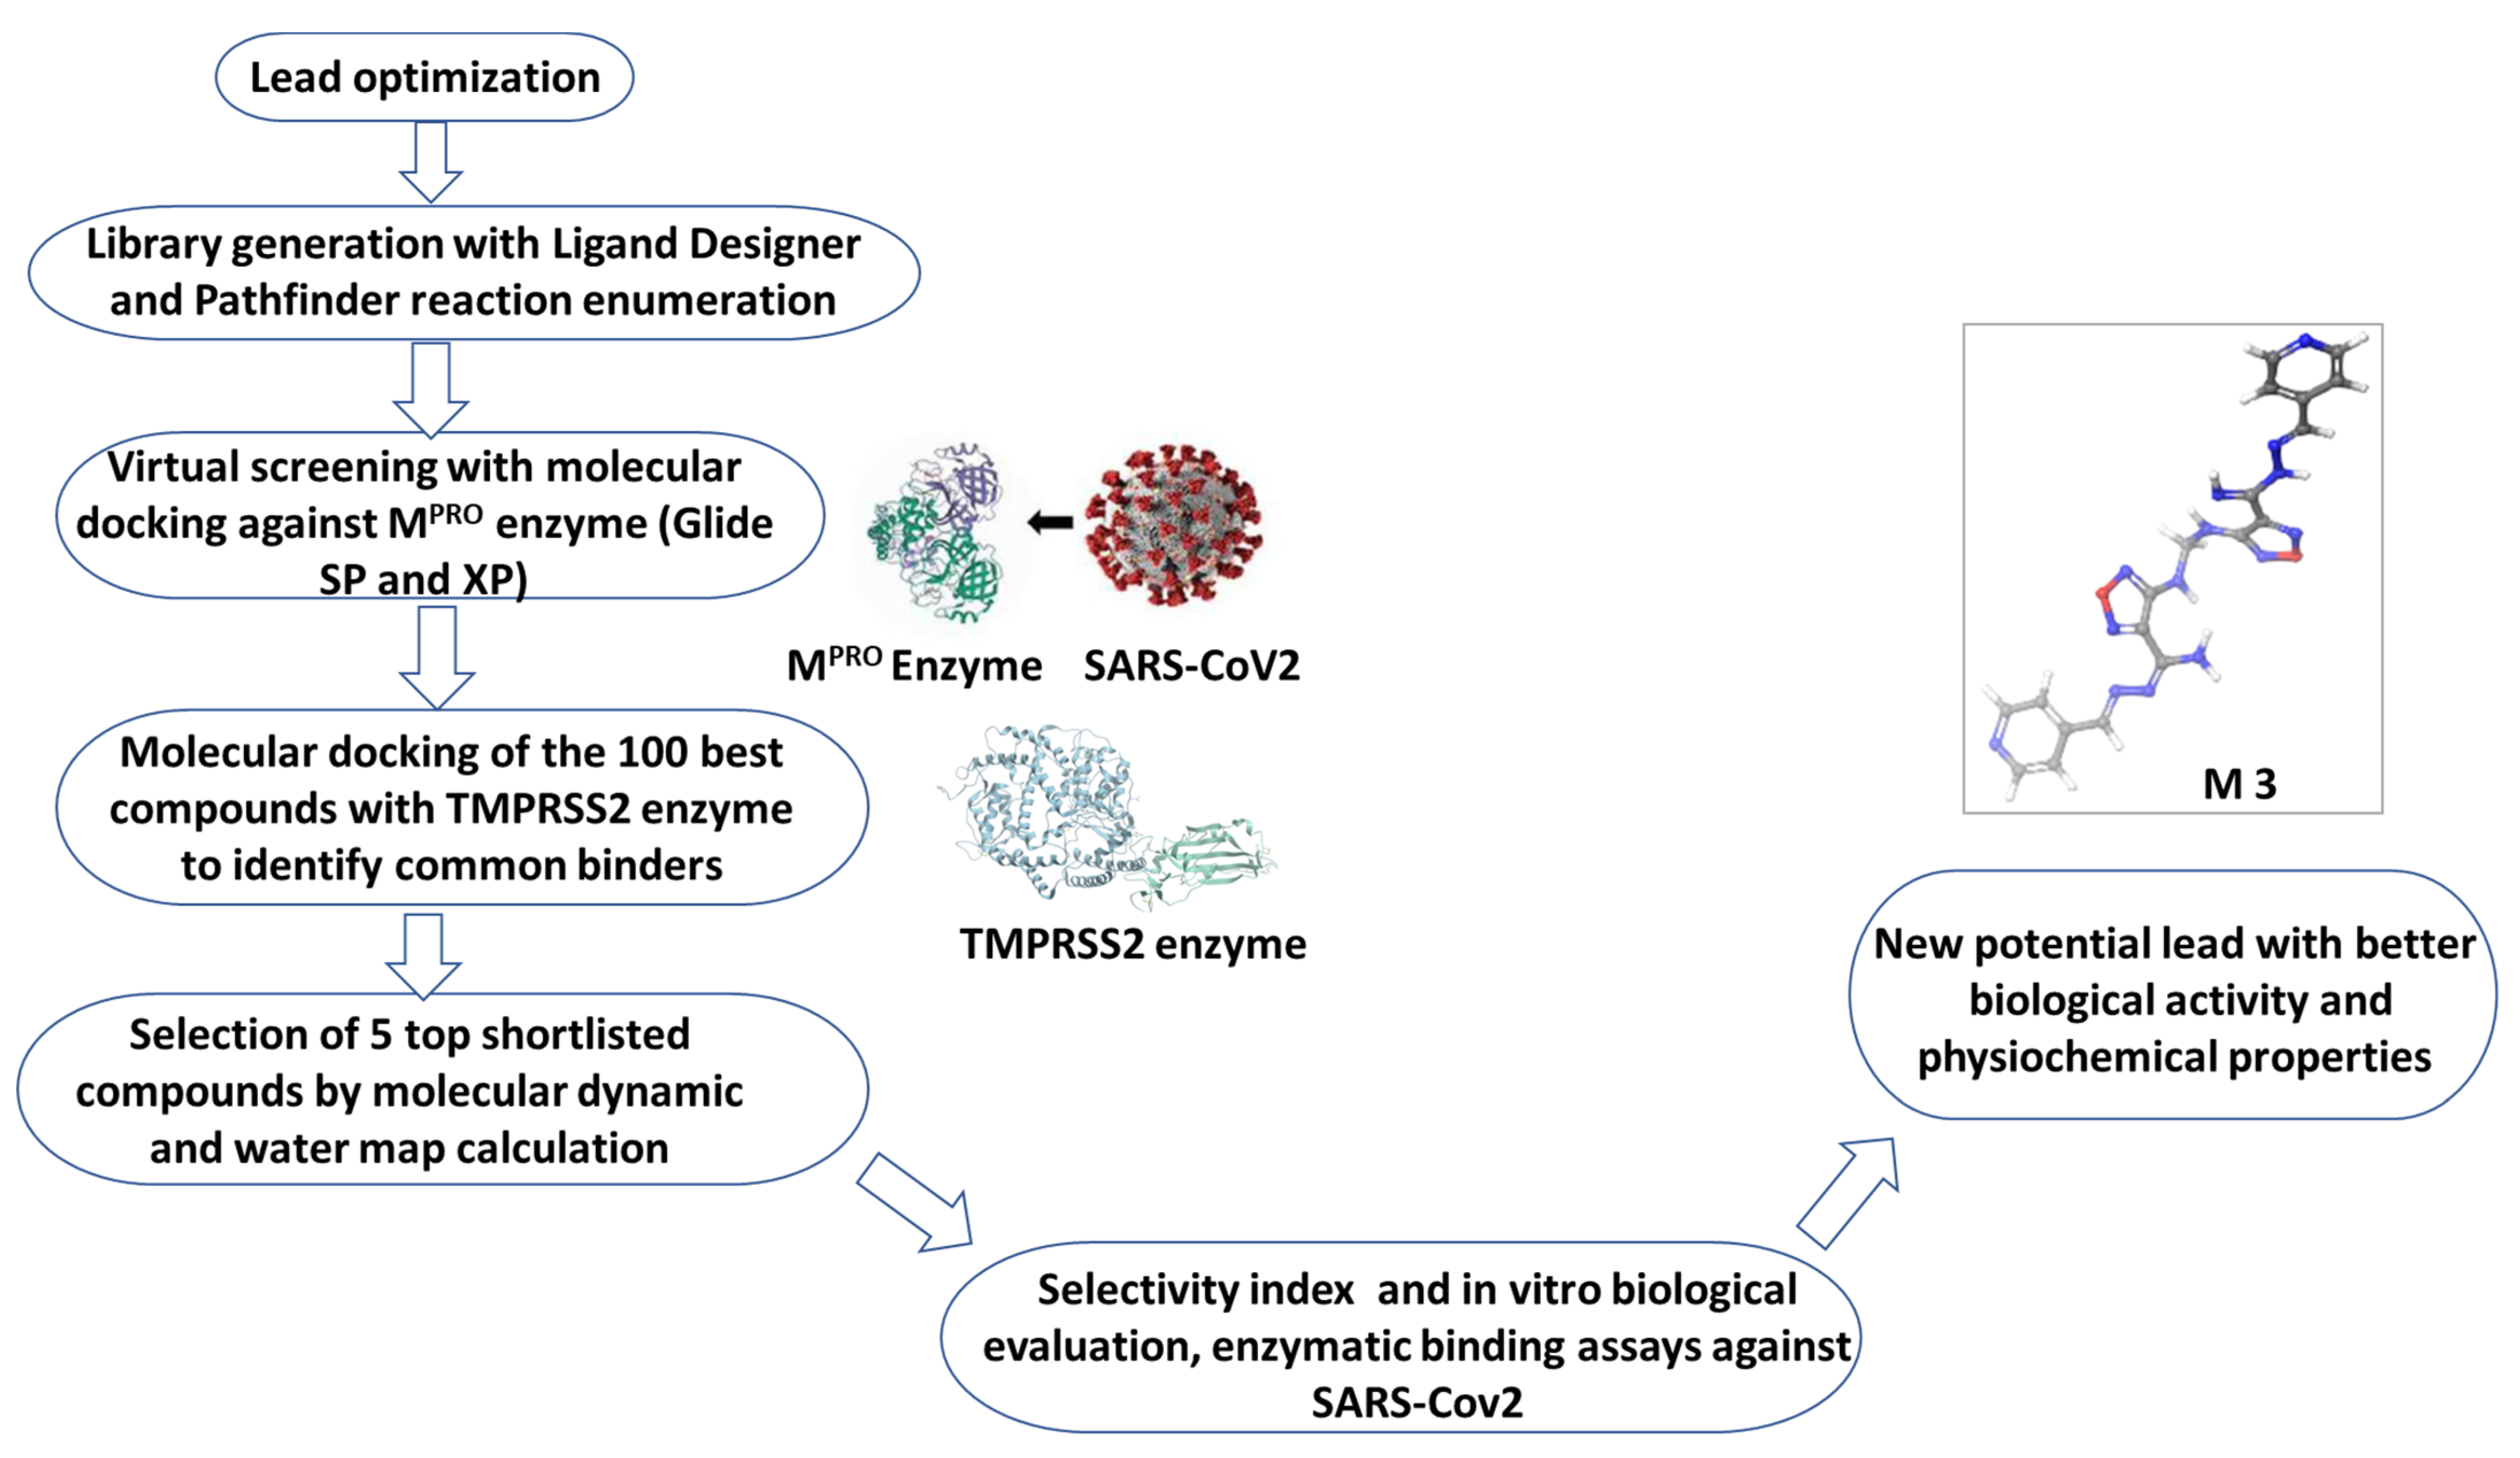
2.1. Rational Lead Discovery of Potential Anti-SARS-CoV-2

Compound 13 showed promising anti-SARS-CoV-2 activity by dual-targeting the activity of Mpro and human furin protease [12], and was employed here as a lead for the discovery of a novel compound with efficient enzyme binding inhibition activity and limited toxicity (Figure 1). The lead optimized discovery depended on the presence of substitutions that can improve the efficacy, enhance the physicochemical properties, limit the off targeting, increase the solubility, and improve the overall pharmacokinetic activity. This was achieved by combining the superior performance of enumerated Ligand Designer tool and the PathFinder reaction enumeration workflow. The combined tools assisted in the iterated annotation of the compound library that can be easily synthetized and conform the 3D geometric structures of target enzymes (Figure 1).
Briefly, a library of 2000 compounds was filtered following Compound 13-based iterated virtual screening against SARS-CoV-2 Mpro enzyme (PDB: 6LU7) using molecular docking studies. The 100 best molecules that satisfied the constraints and the fitting of the desired enzyme binding pocket space were retained. The 100 selected compounds with unique structural features were re-screened against the human TMPRSS2 (PDB ID: 2OQ5) enzyme using molecular docking studies. The best 20 shared compounds against both targets were further elaborated using visual inspection of its position and binding interactions (Supplementary Table S1 and S2). This optimized lead discovery process resulted in the selection of five compounds (M1–5) with potential binding activity to both viral targets (Figure 2 and Table 1). Consequently, compounds M1–5 were investigated using integrated WaterMap analysis and MD tools to ensure their structure superiority, stability, and binding stability. Compounds M1–5 were purchased and evaluated in vitro against SARS-CoV-2 and by enzyme inhibition assay in comparison to the parent, Compound 13.

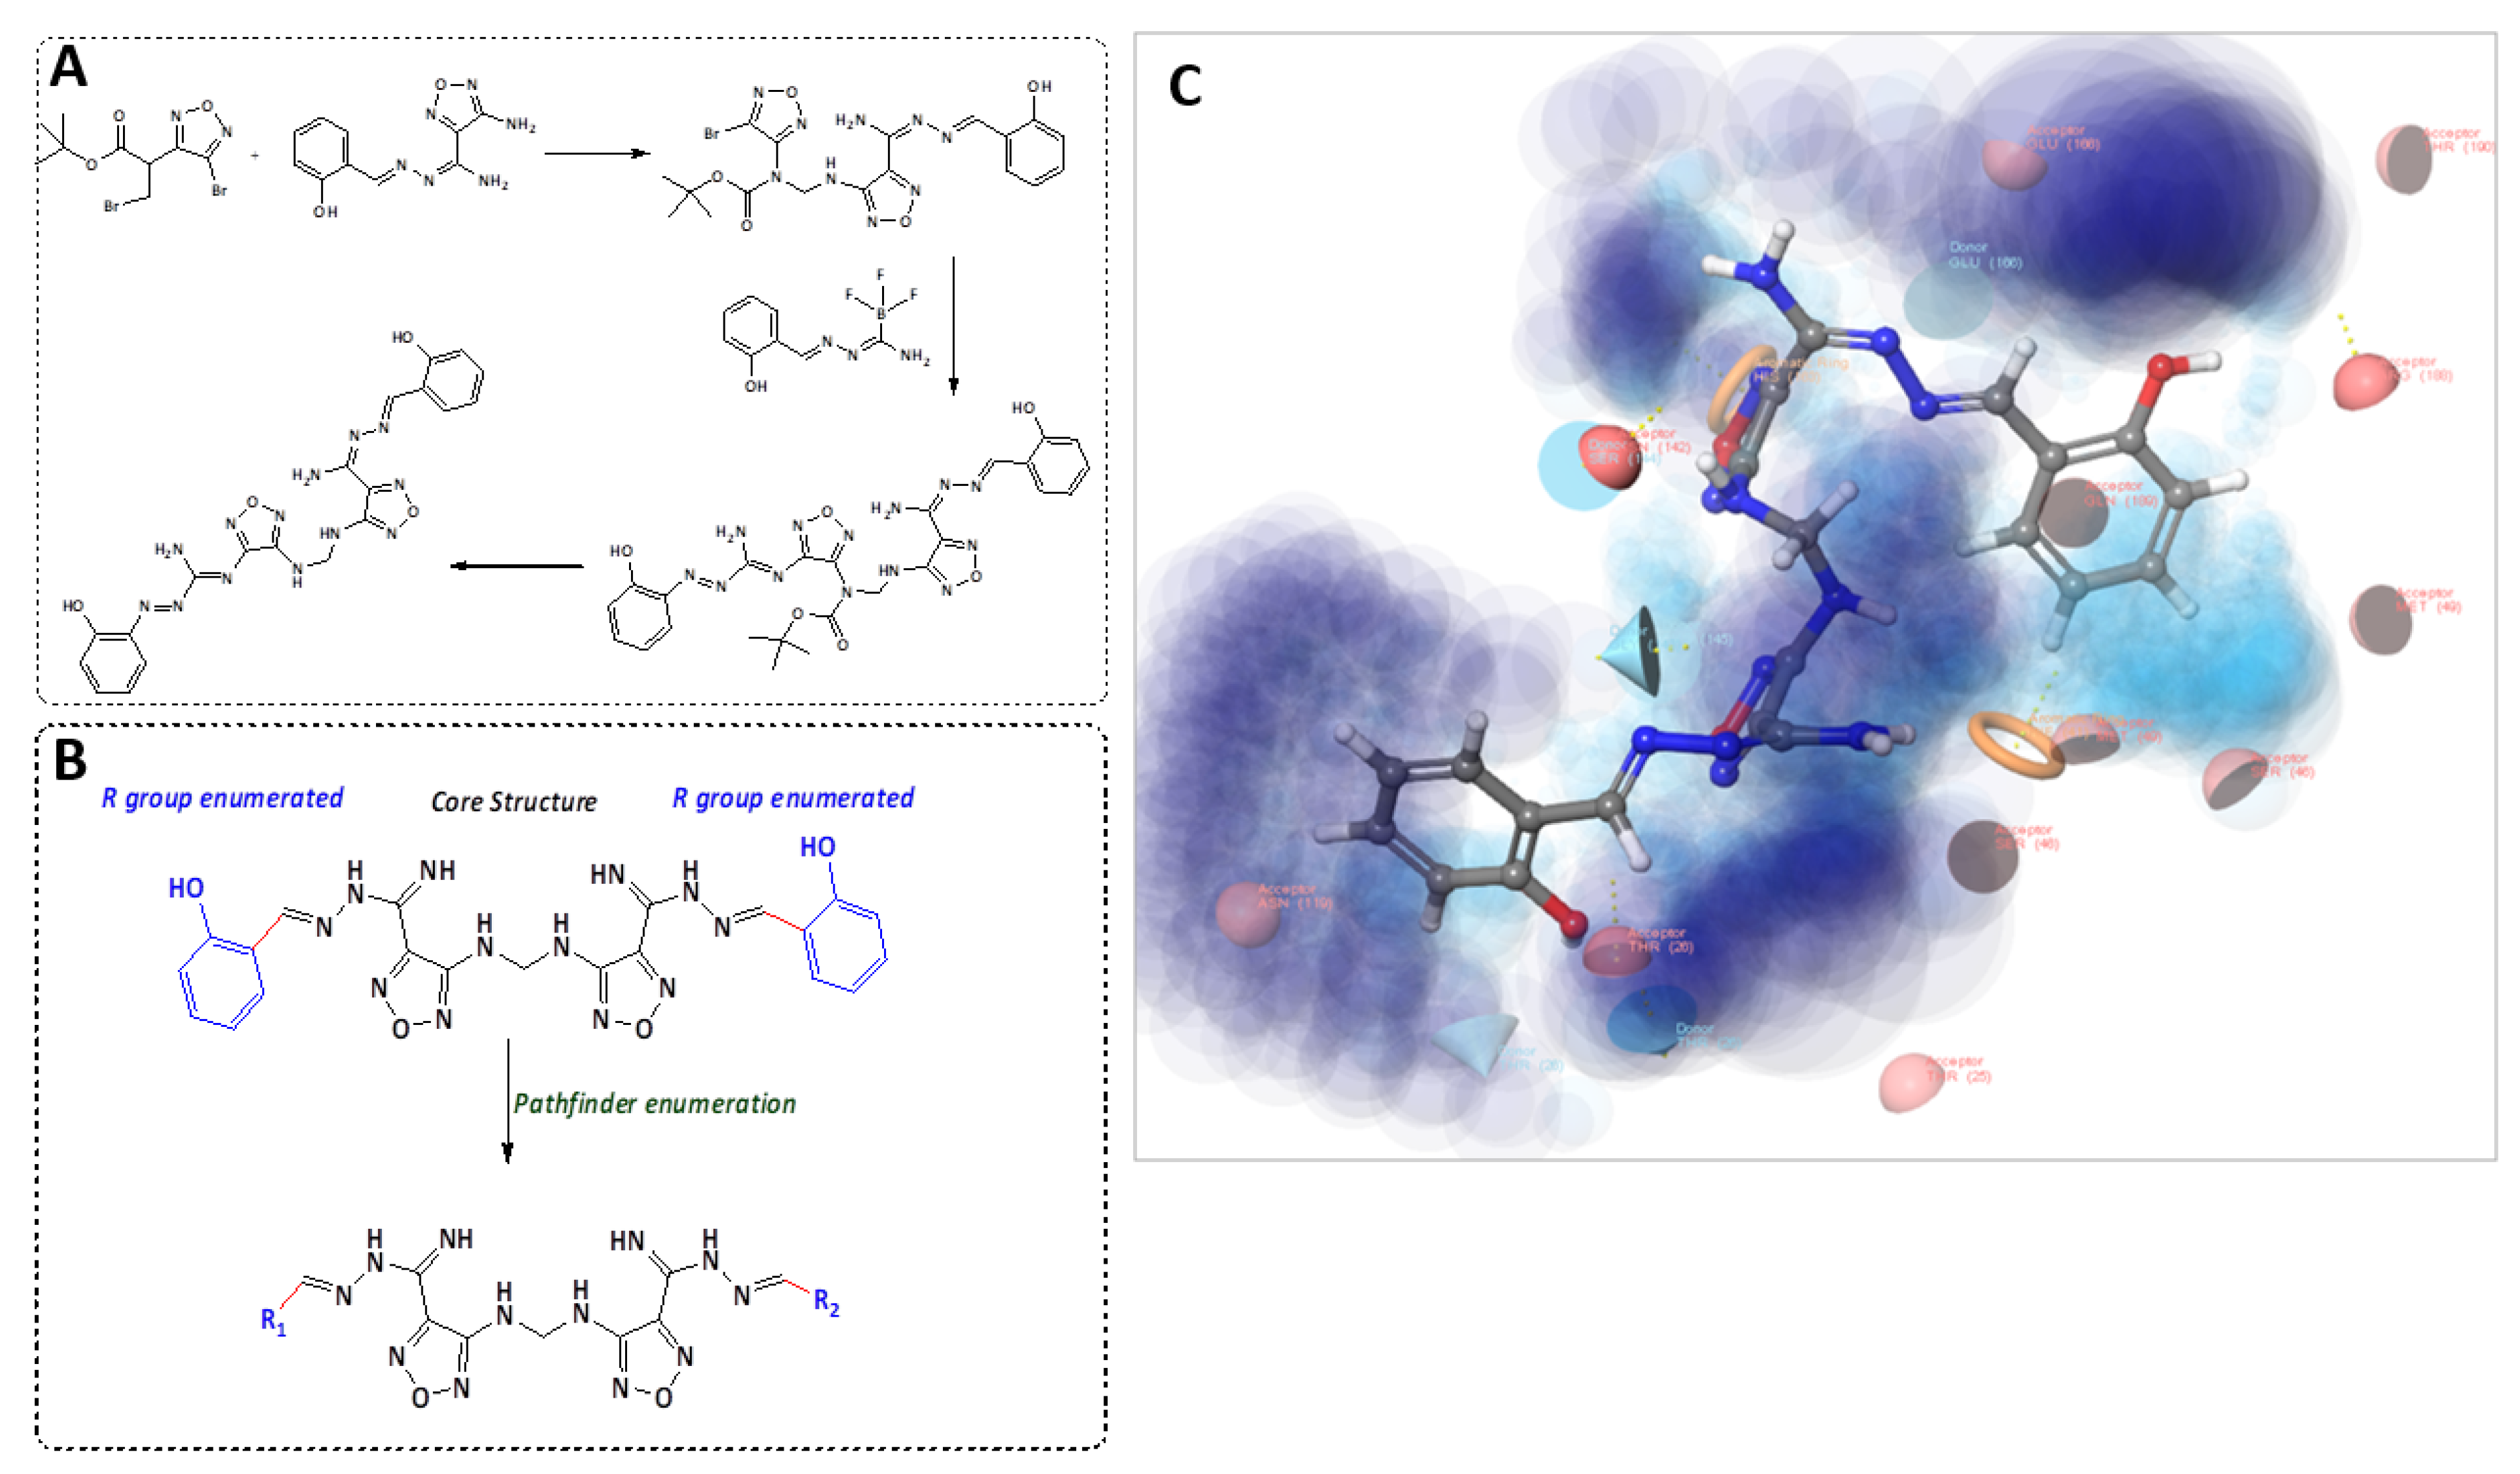
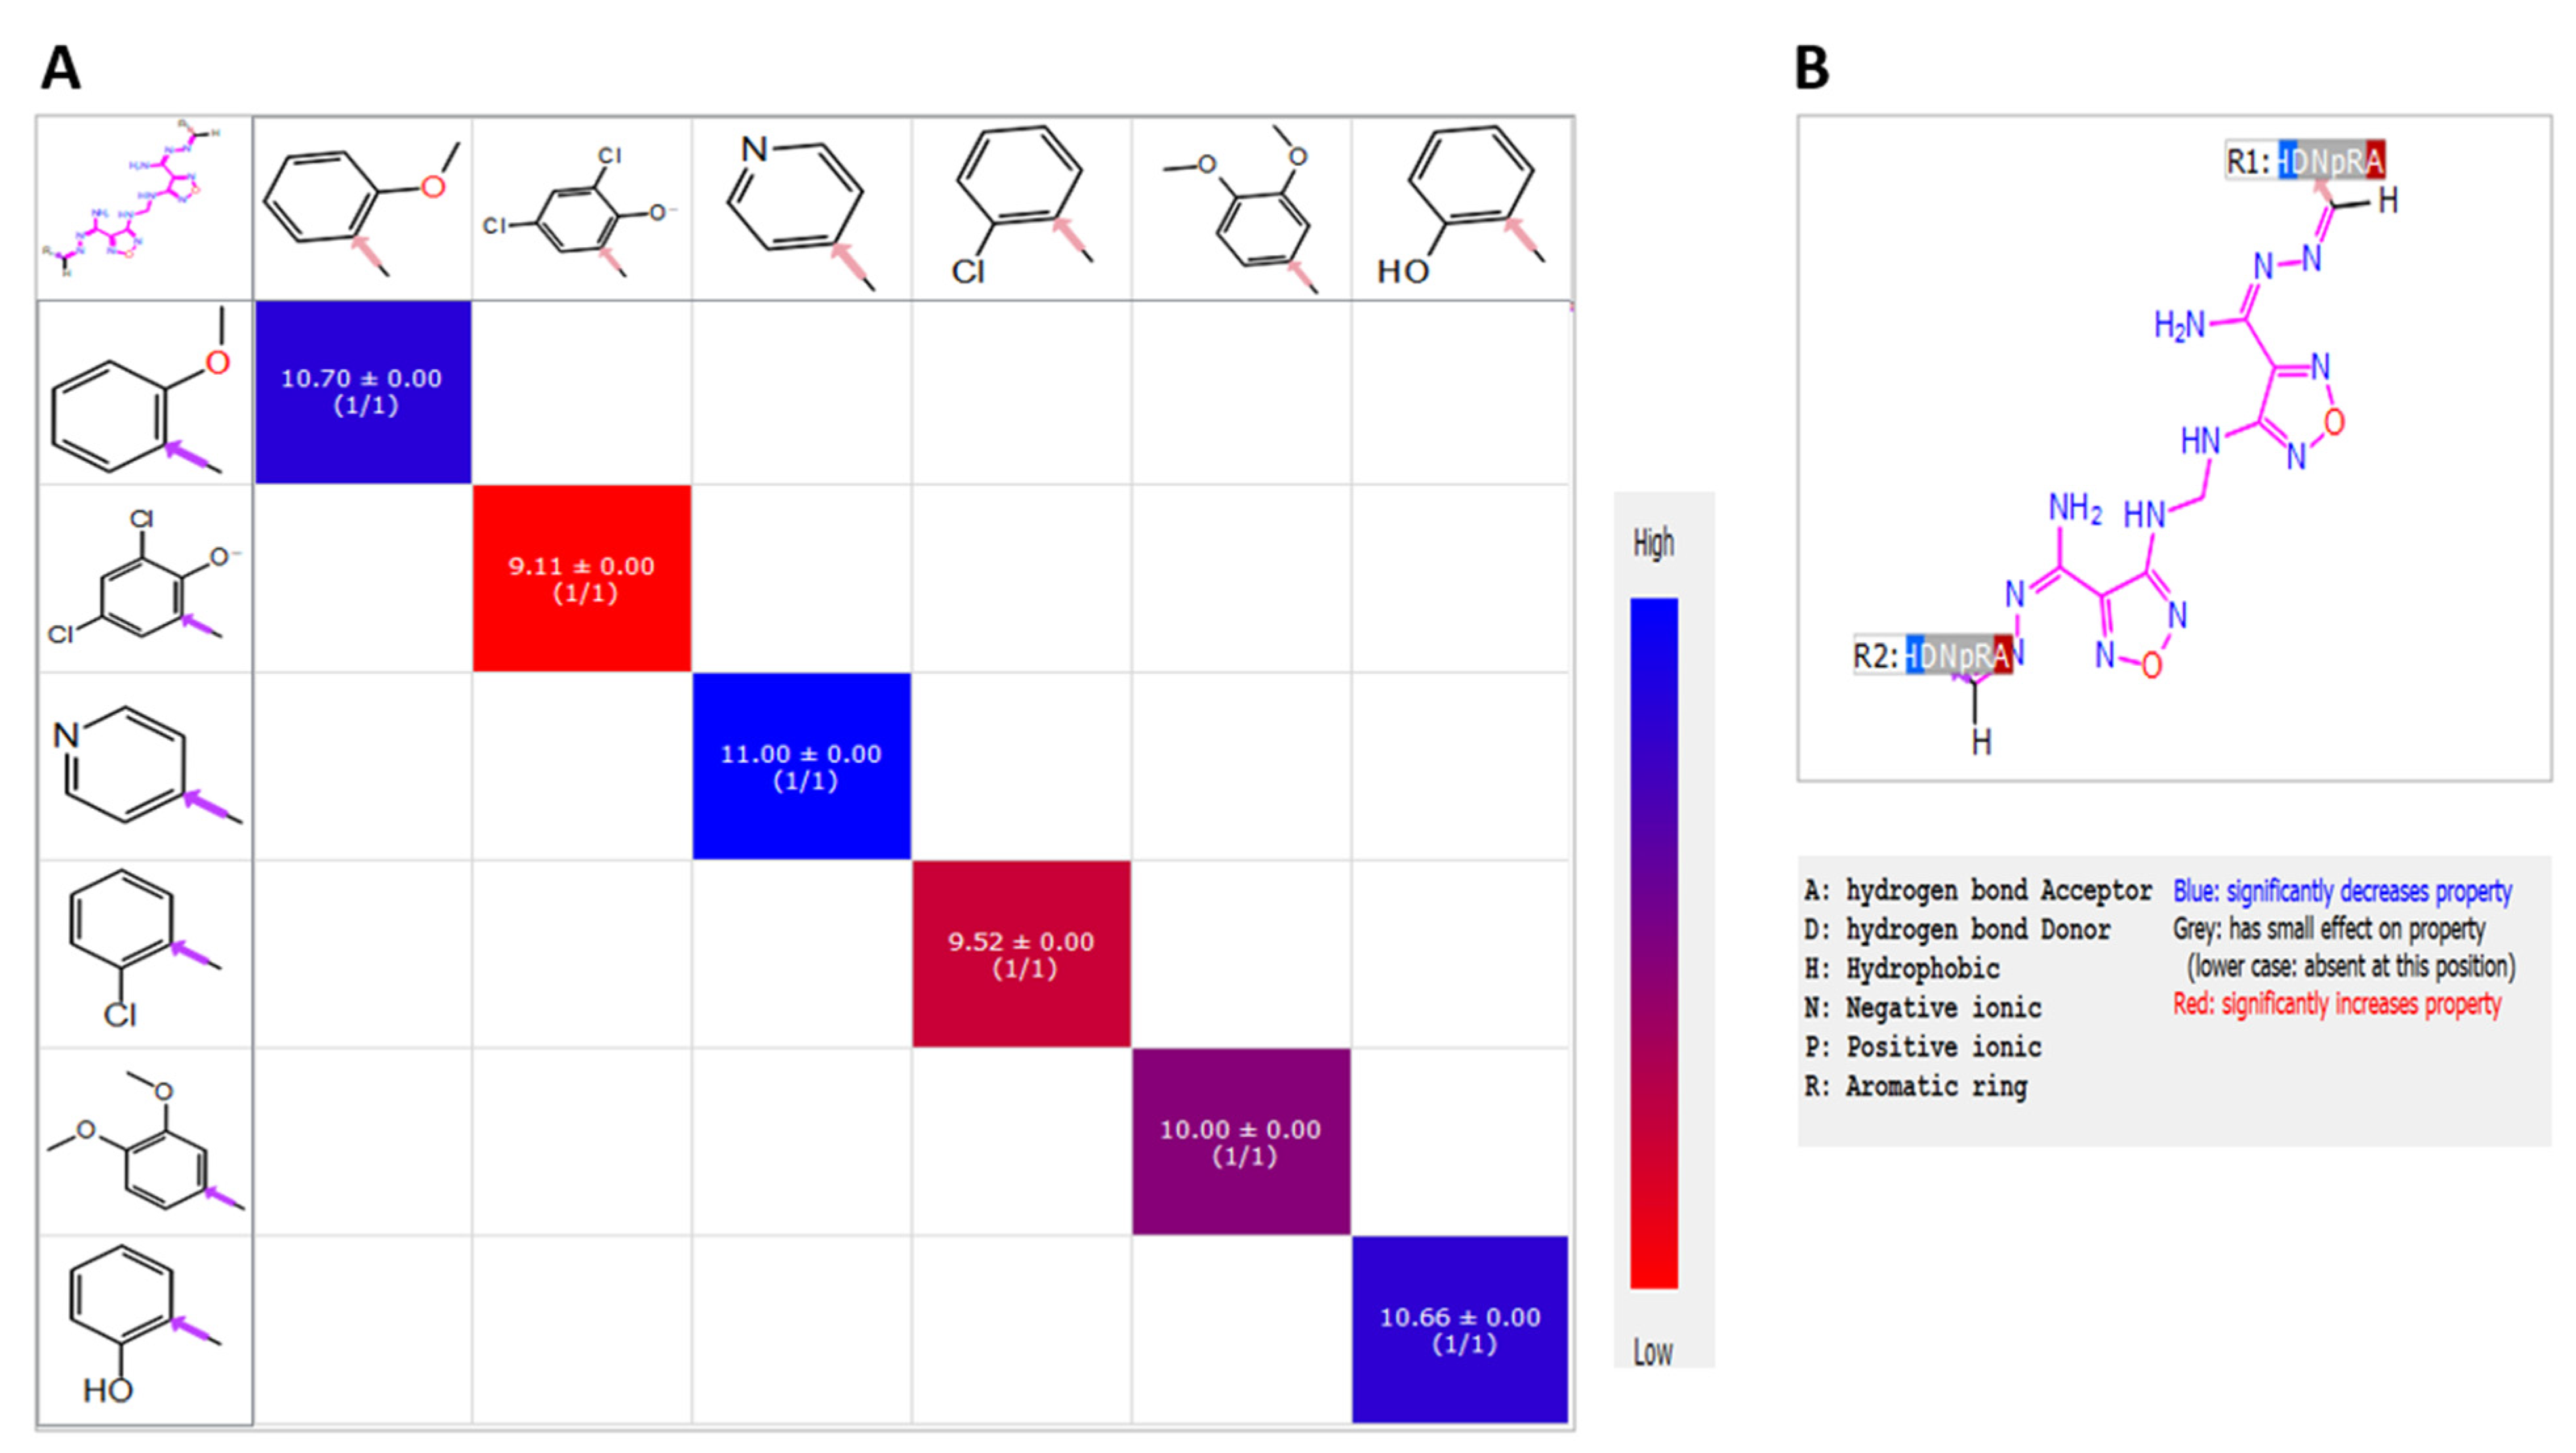
2.2. Candidate Election by Enumerated Structure Ligand Designer

To identify the novel ligands derivatives from Compound 13, PathFinder was used to predict the route of synthesis of Compound 13 and to enumerate the commercially available building blocks of the compound (Figure 3A). The predicted synthetic steps were alkylation of amine followed by Suzuki coupling of the Boc-protected amine and subsequent deprotection. For instance, the novel ligands derivatives were generated by enumerating the building blocks using PathFinder (Figure 3B). The Ligand Designer tool was also used for 3D visualization of the enumerated structures, to analyze the workspace substation, and to select the pharmacophoric features of the predicted inhibitors within SARS-CoV-2 Mpro (Figure 3C). Diverse structures were enumerated with various R-substituted phenyl ring at different positions and an isosteric replacement of the phenyl ring with a heterocyclic ring. Examples of the R groups included various halogen substitutions, substituted amino groups, alkoxy, and alkyl groups. The enumerated compounds were further filtered out using PAINS offenders. The top 100 compounds that showed the best binding interaction with the Mpro enzyme (PDB: 6LU7) were selected. The compounds were further re-screened against TMPRSS2 (PDB ID: 2OQ5) enzyme for the selection of the 20 shared compounds with the highest binding to both protein targets (Supplementary Tables S1 and S2). This was followed by careful visual inspection of the binding interaction, which led to the selection of five compounds, M1–5. Further confirmation of the stability of M1–5-docked complexes with MD simulation was performed to overcome the loophole of the dynamic nature of the protein.

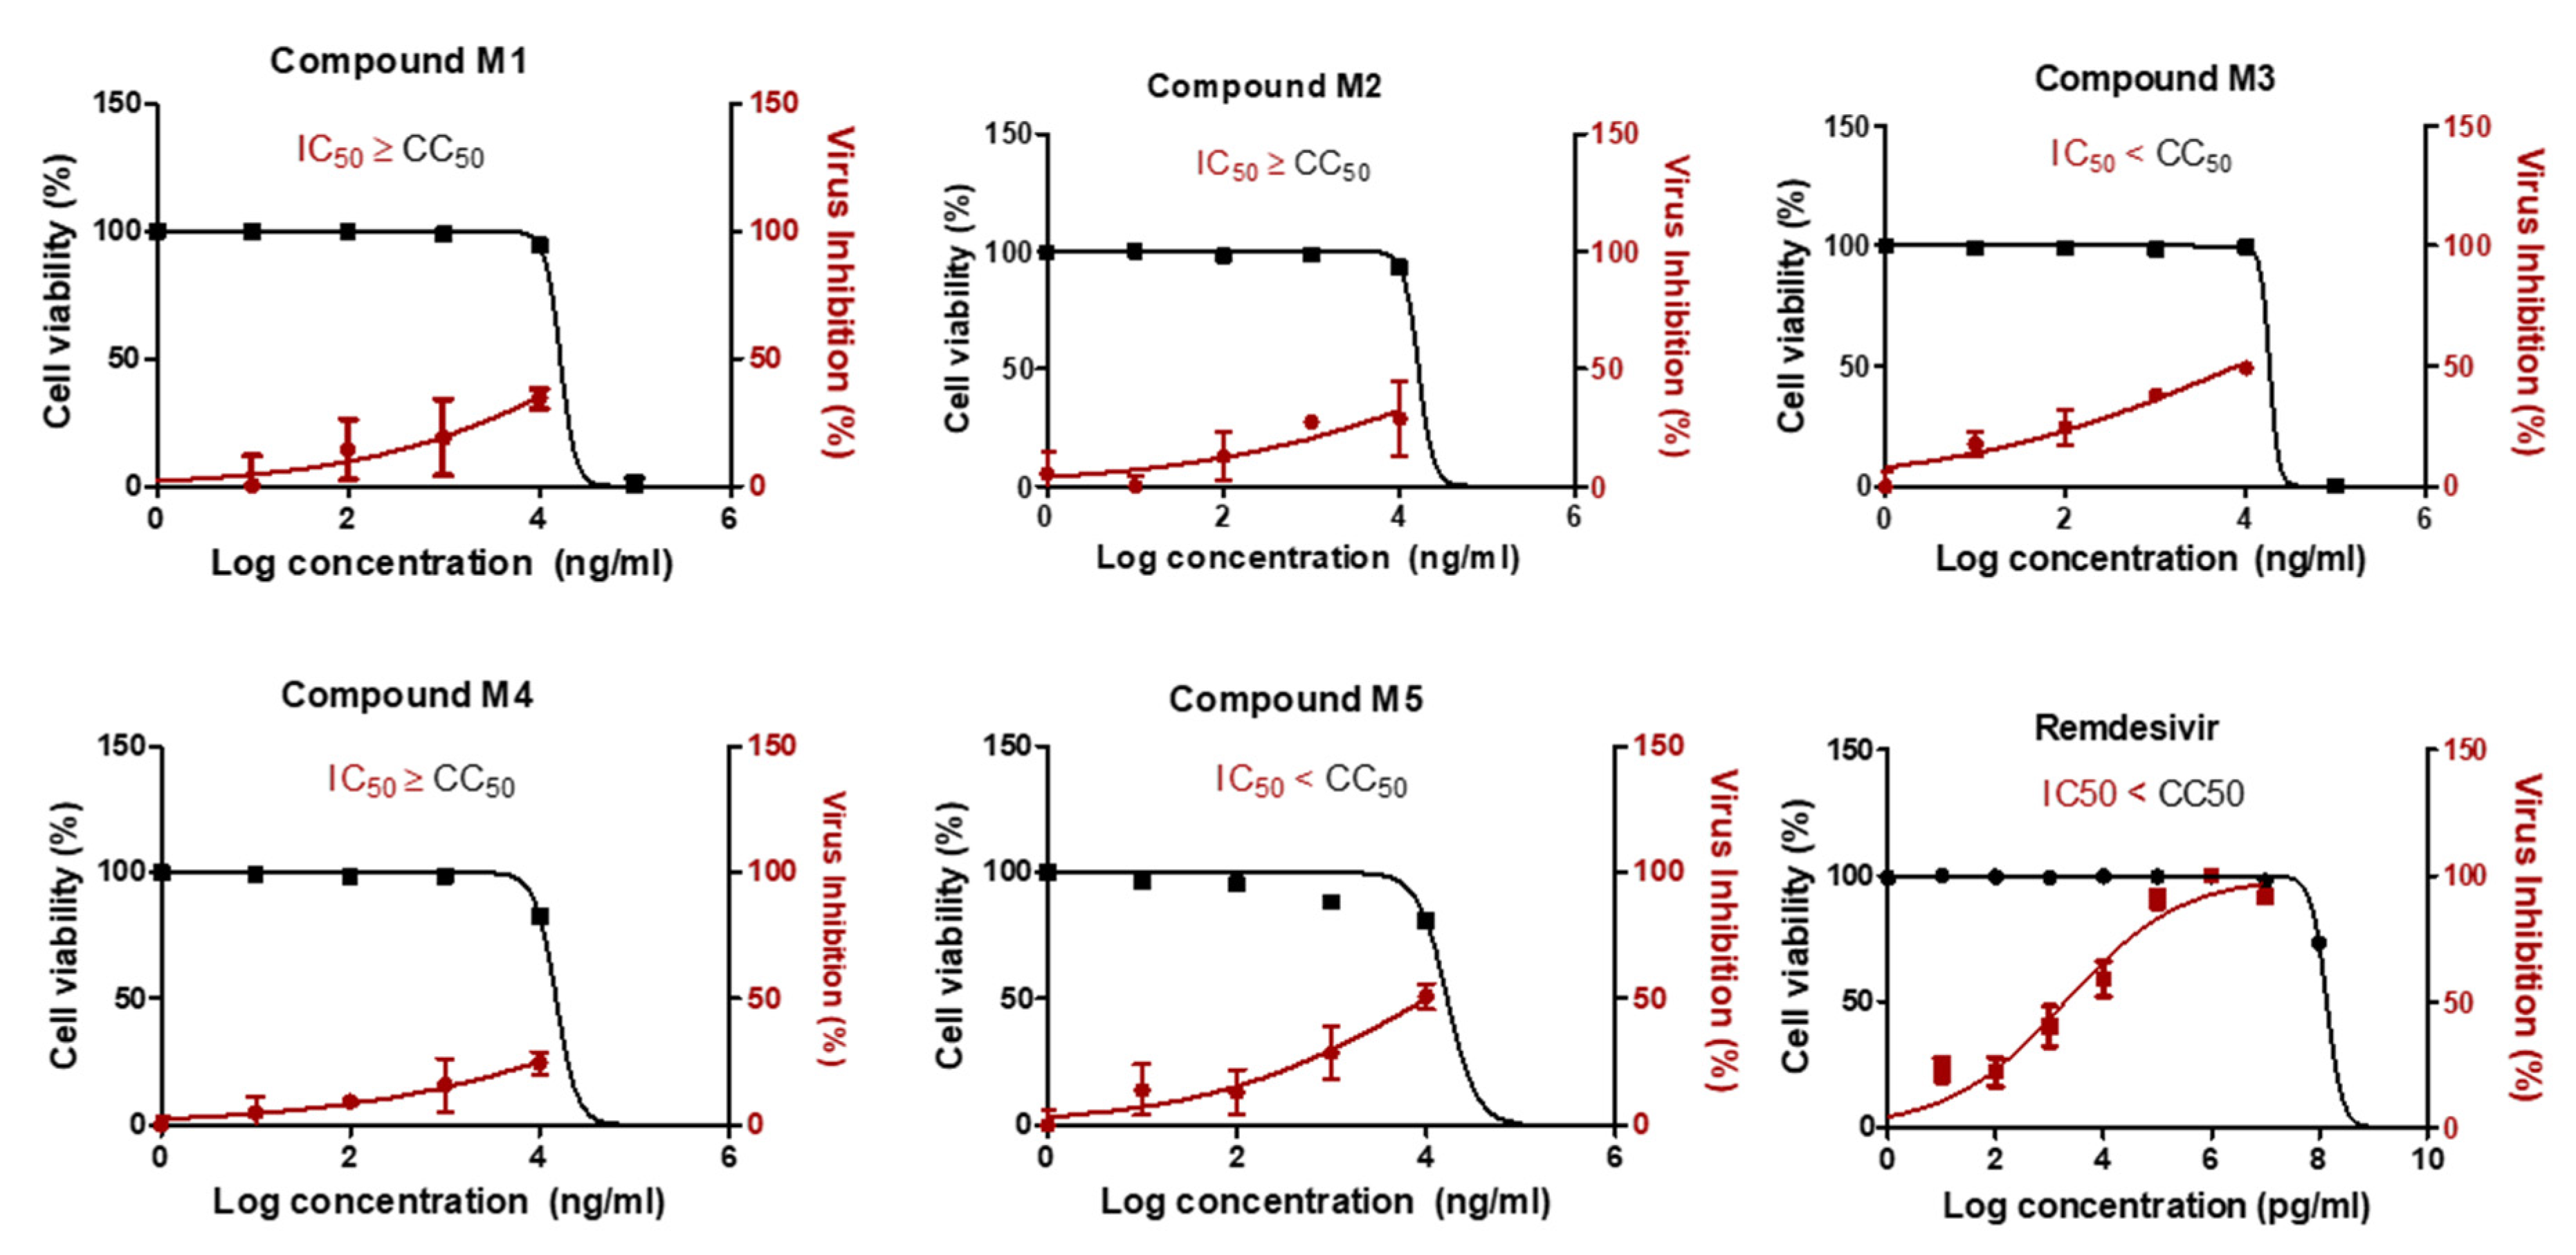
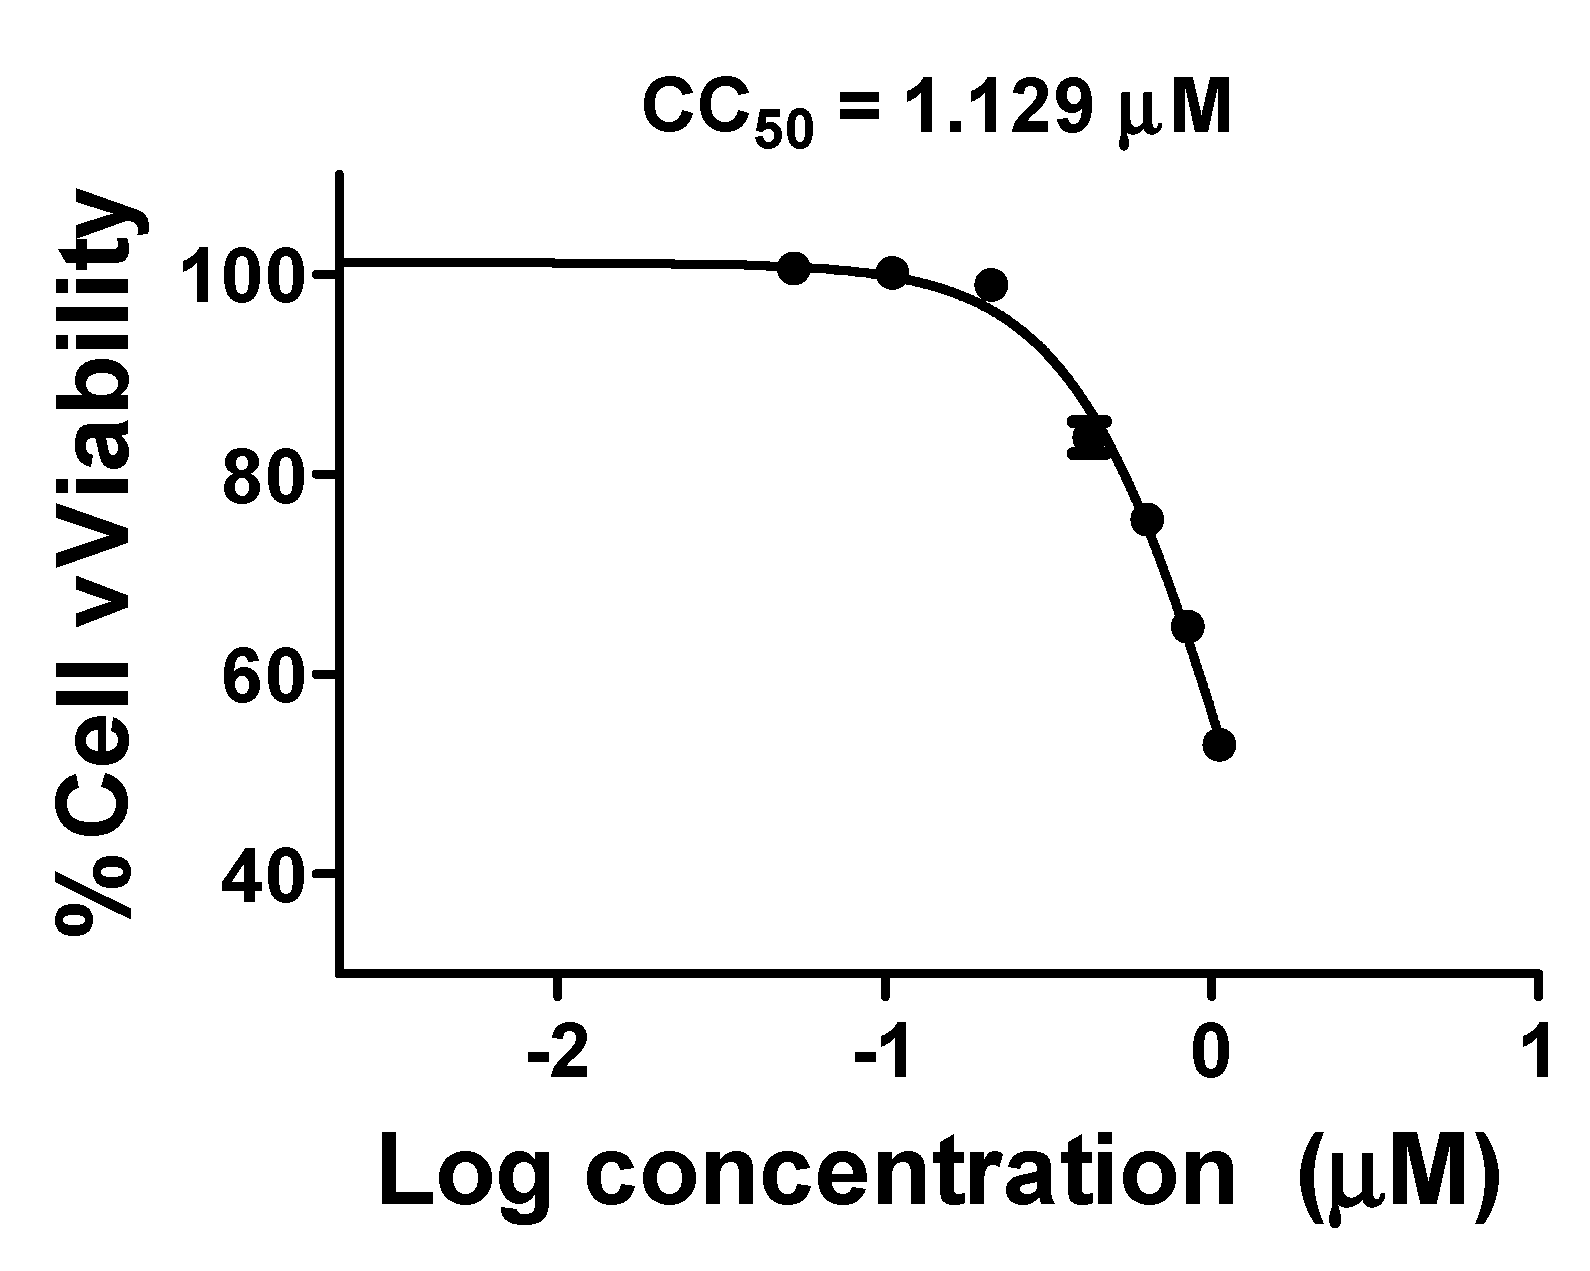
2.3. Two Candidate Compounds (M3 and M5) Showed Promising Anti-SARS-CoV-2 Activity In Vitro

Compared to Compound 13, the in vitro anti-SARS-CoV-2 activity of compounds M1–5 revealed that only M3 and M5 showed a high selectivity index for antiviral activity relative to Vero-E6 cells toxicity with 50% cytotoxic concentration (CC50) higher than the IC50 by 2.3-fold and 1.7-fold, respectively (Figure 4). The IC50 of compounds M3 and M5 were 0.016, and 0.019 µM, respectively. The M3 compound showed improved IC50 against SARS-CoV-2 compared to the previously reported IC50 of Compound 13. However, its IC50 was lower than that of remdesivir as a positive control.
Because M3 showed potent activity with a higher selectivity index, its cytotoxic activity was further tested on HDF cells using MTT assay. Compound M3 (CC50 1.129 µM ± 0.0019 was safe on human cells at ~70-time its IC50(SARS-CoV-2) (Figure 5).

2.4. Compound M3 Possesses Dual Inhibition Activity against SARS-CoV-2 by Targeting Both the Viral and Human Proteases

Enzyme inhibition assay showed that compound M3 notably inhibited the activity of SARS-CoV-2 Mpro enzyme with an IC50 equal to 0.013 ± 0.003 µM (Figure 6A). The inhibition activity of compound M3 was further tested against human TMPRSS2 protease. Interestingly, M3 exhibited significant inhibition activity at IC50 0.05 ± 0.002 µM (Figure 6B). Compound M3 was further validated against furin protease, resulting in a potent activity at IC50 0.09 ± 0.002 µM, 3.3-fold of the parent, Compound 13 (Figure 6C).

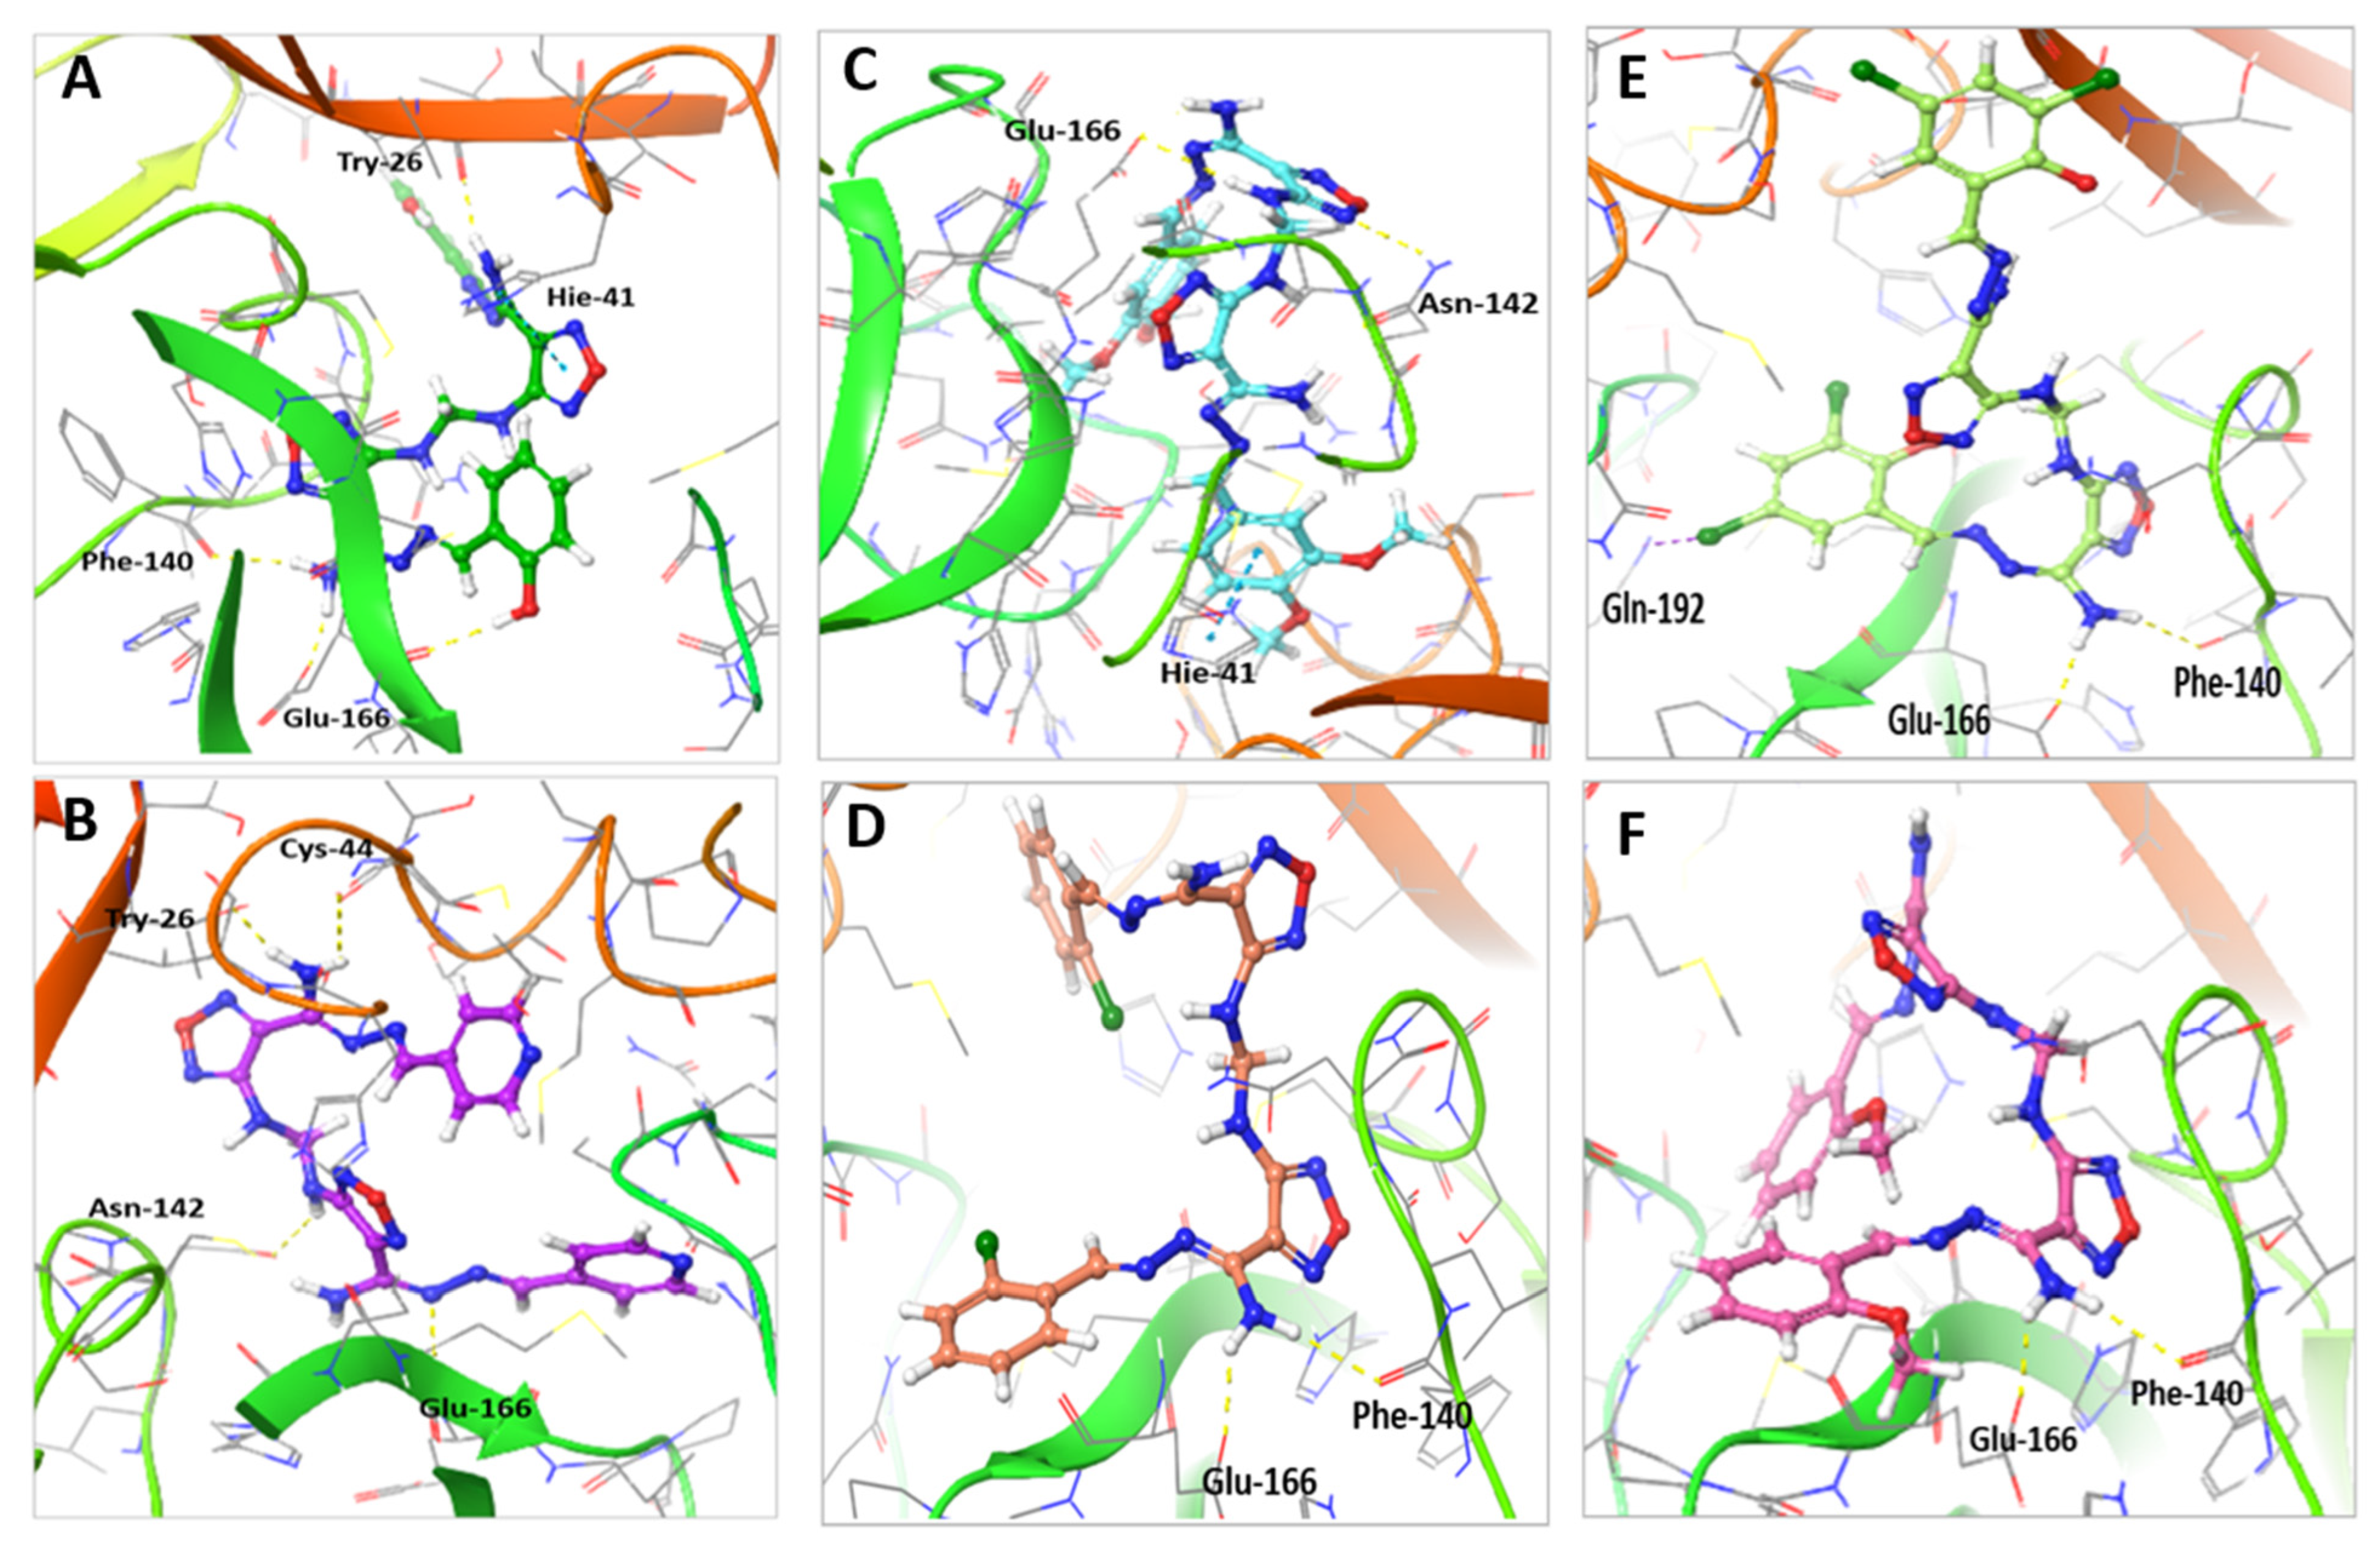
2.5. Molecular Docking Indicated the Binding Efficiency of M3 with SARS-CoV-2 Mpro and TMPRSS2 Protease

Molecular docking study of M1–5 compared to Compound 13, indicated that the interaction of all compounds, except M3, showed a similar binding position to SARS-CoV-2 Mpro (Table 2 and Figure 7). The binding of Compound 13 within the active site of Mpro enzyme showed four H-bonds with Glu-166, Phe-140 and Thr-26 residues along with a pi–pi stacking interaction with His-41 amino acid residue and a hydrophobic interaction with Met-49, Cys-44, and Met-165 residues (Figure 7A). On the other hand, the binding of M3 within the active site of the Mpro enzyme showed a strong interaction made of four H-bonds with Cys-44, Glu-166, Thr-26, and Asn-142 amino acid residues and hydrophobic interactions with Met-44, Cys-44, Glu-166, and Met-165 residues (Figure 7B). Compound M1 showed two H-bonds with Glu-166 and Asn-142 and pi–pi stacking interaction with His-41 and hydrophobic interaction with Met-49, Cys-145, Pro-168, and Met-165 residues (Figure 7C); M2 showed two H-bonds with Glu-166 and Phe-140 and hydrophobic interaction with Met-49, Cys-145, Gln-189, and Met-165 residues (Figure 7D); M4 showed two H-bonds with Glu-166 and Phe-140 and halogen bond with Gln-192 and hydrophobic interaction with Met-49, Cys-145, Gln-189, Gln-192, and Met-165 residues (Figure 7E); and M5 showed two H-bonds with Glu-166 and Phe-140 residues and hydrophobic interaction with His-41, Met-49, Cys-44, Gln-189, and Pro-168 residues (Figure 7F).
The interaction of shortlisted compounds to TMPRSS2 in comparison to Compound 13 was also calculated and showed the unique binding of M3 (Table 3 and Figure 8). The binding of Compound 13 with TMPRSS2 active sites showed four H-bonds with Arg-41, Ser-214, Glu-218, and His-40 amino acid residues, in addition to hydrophobic interaction with Gln-192, Arg-41, Ala-190, Cys-219, Try-36, and Val-213 amino acid residues (Figure 8A). On the other hand, the interaction of M3 with TMPRSS2 showed six H-bonds with Arg-41, Ser-214, Glu-218, Gly-216, and His-99 amino acid residues, in addition to hydrophobic interactions with His-57, Arg-41, and Cys-219 amino acid residues (Figure 8B). M1 showed two H-bonds with Ser-195 and Glu-192, and hydrophobic interaction with Arg-41, Cys-219, Try-149, and Val-213 amino acid residues (Figure 8C); M2 showed two H-bonds with Ser-214 and Glu-192, and hydrophobic interaction with Arg-41, Cys-219, Try-36, Gln-192, and Val-213 amino acid residues (Figure 8D); M4 showed four H-bonds with Ser-39, Glu-192, His-57, and Arg-41 and halogen bond with Ser-214 and Ala-220, and hydrophobic interaction with Arg-41, Cys-219, Try-228, and Val-213 amino acid residues (Figure 8E); M5 showed two H-bonds with Arg-41 and Glu-192, and hydrophobic interaction with Arg-41, Cys-219, Try-149, Ala-190, and Val-213 amino acid residues (Figure 8F).
The results from molecular docking indicated that the docking pose of M3 exhibited stable binding at the active sites of SARS-CoV-2 Mpro and human TMPRSS2 enzymes.

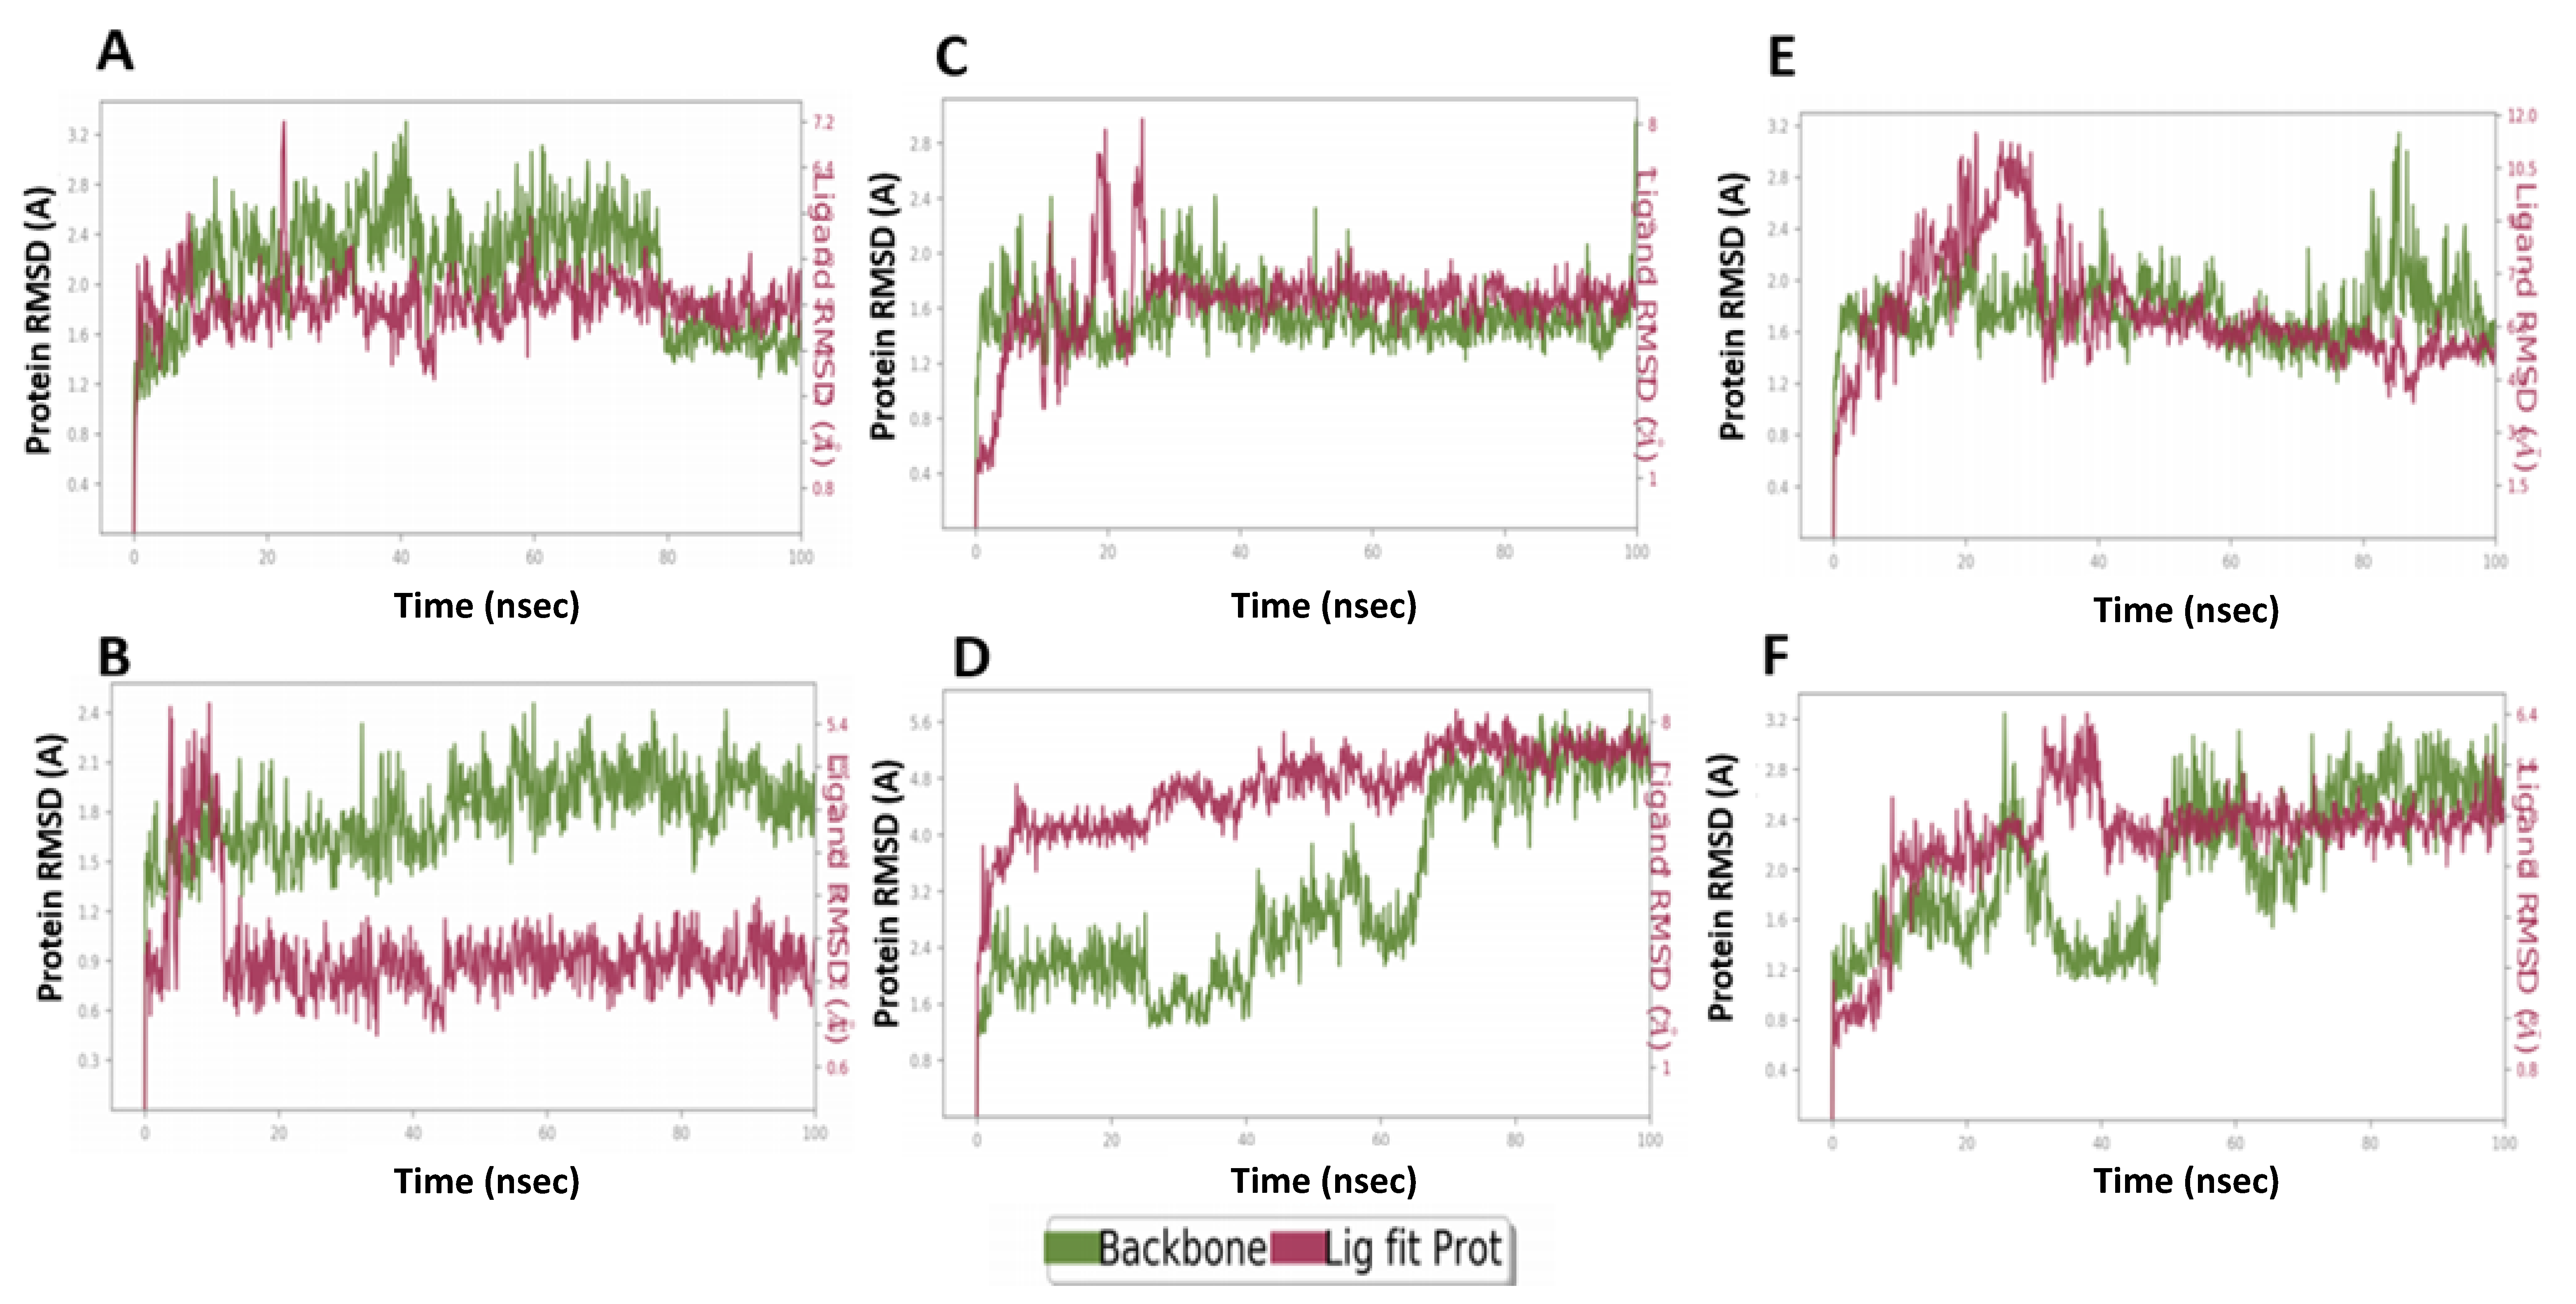
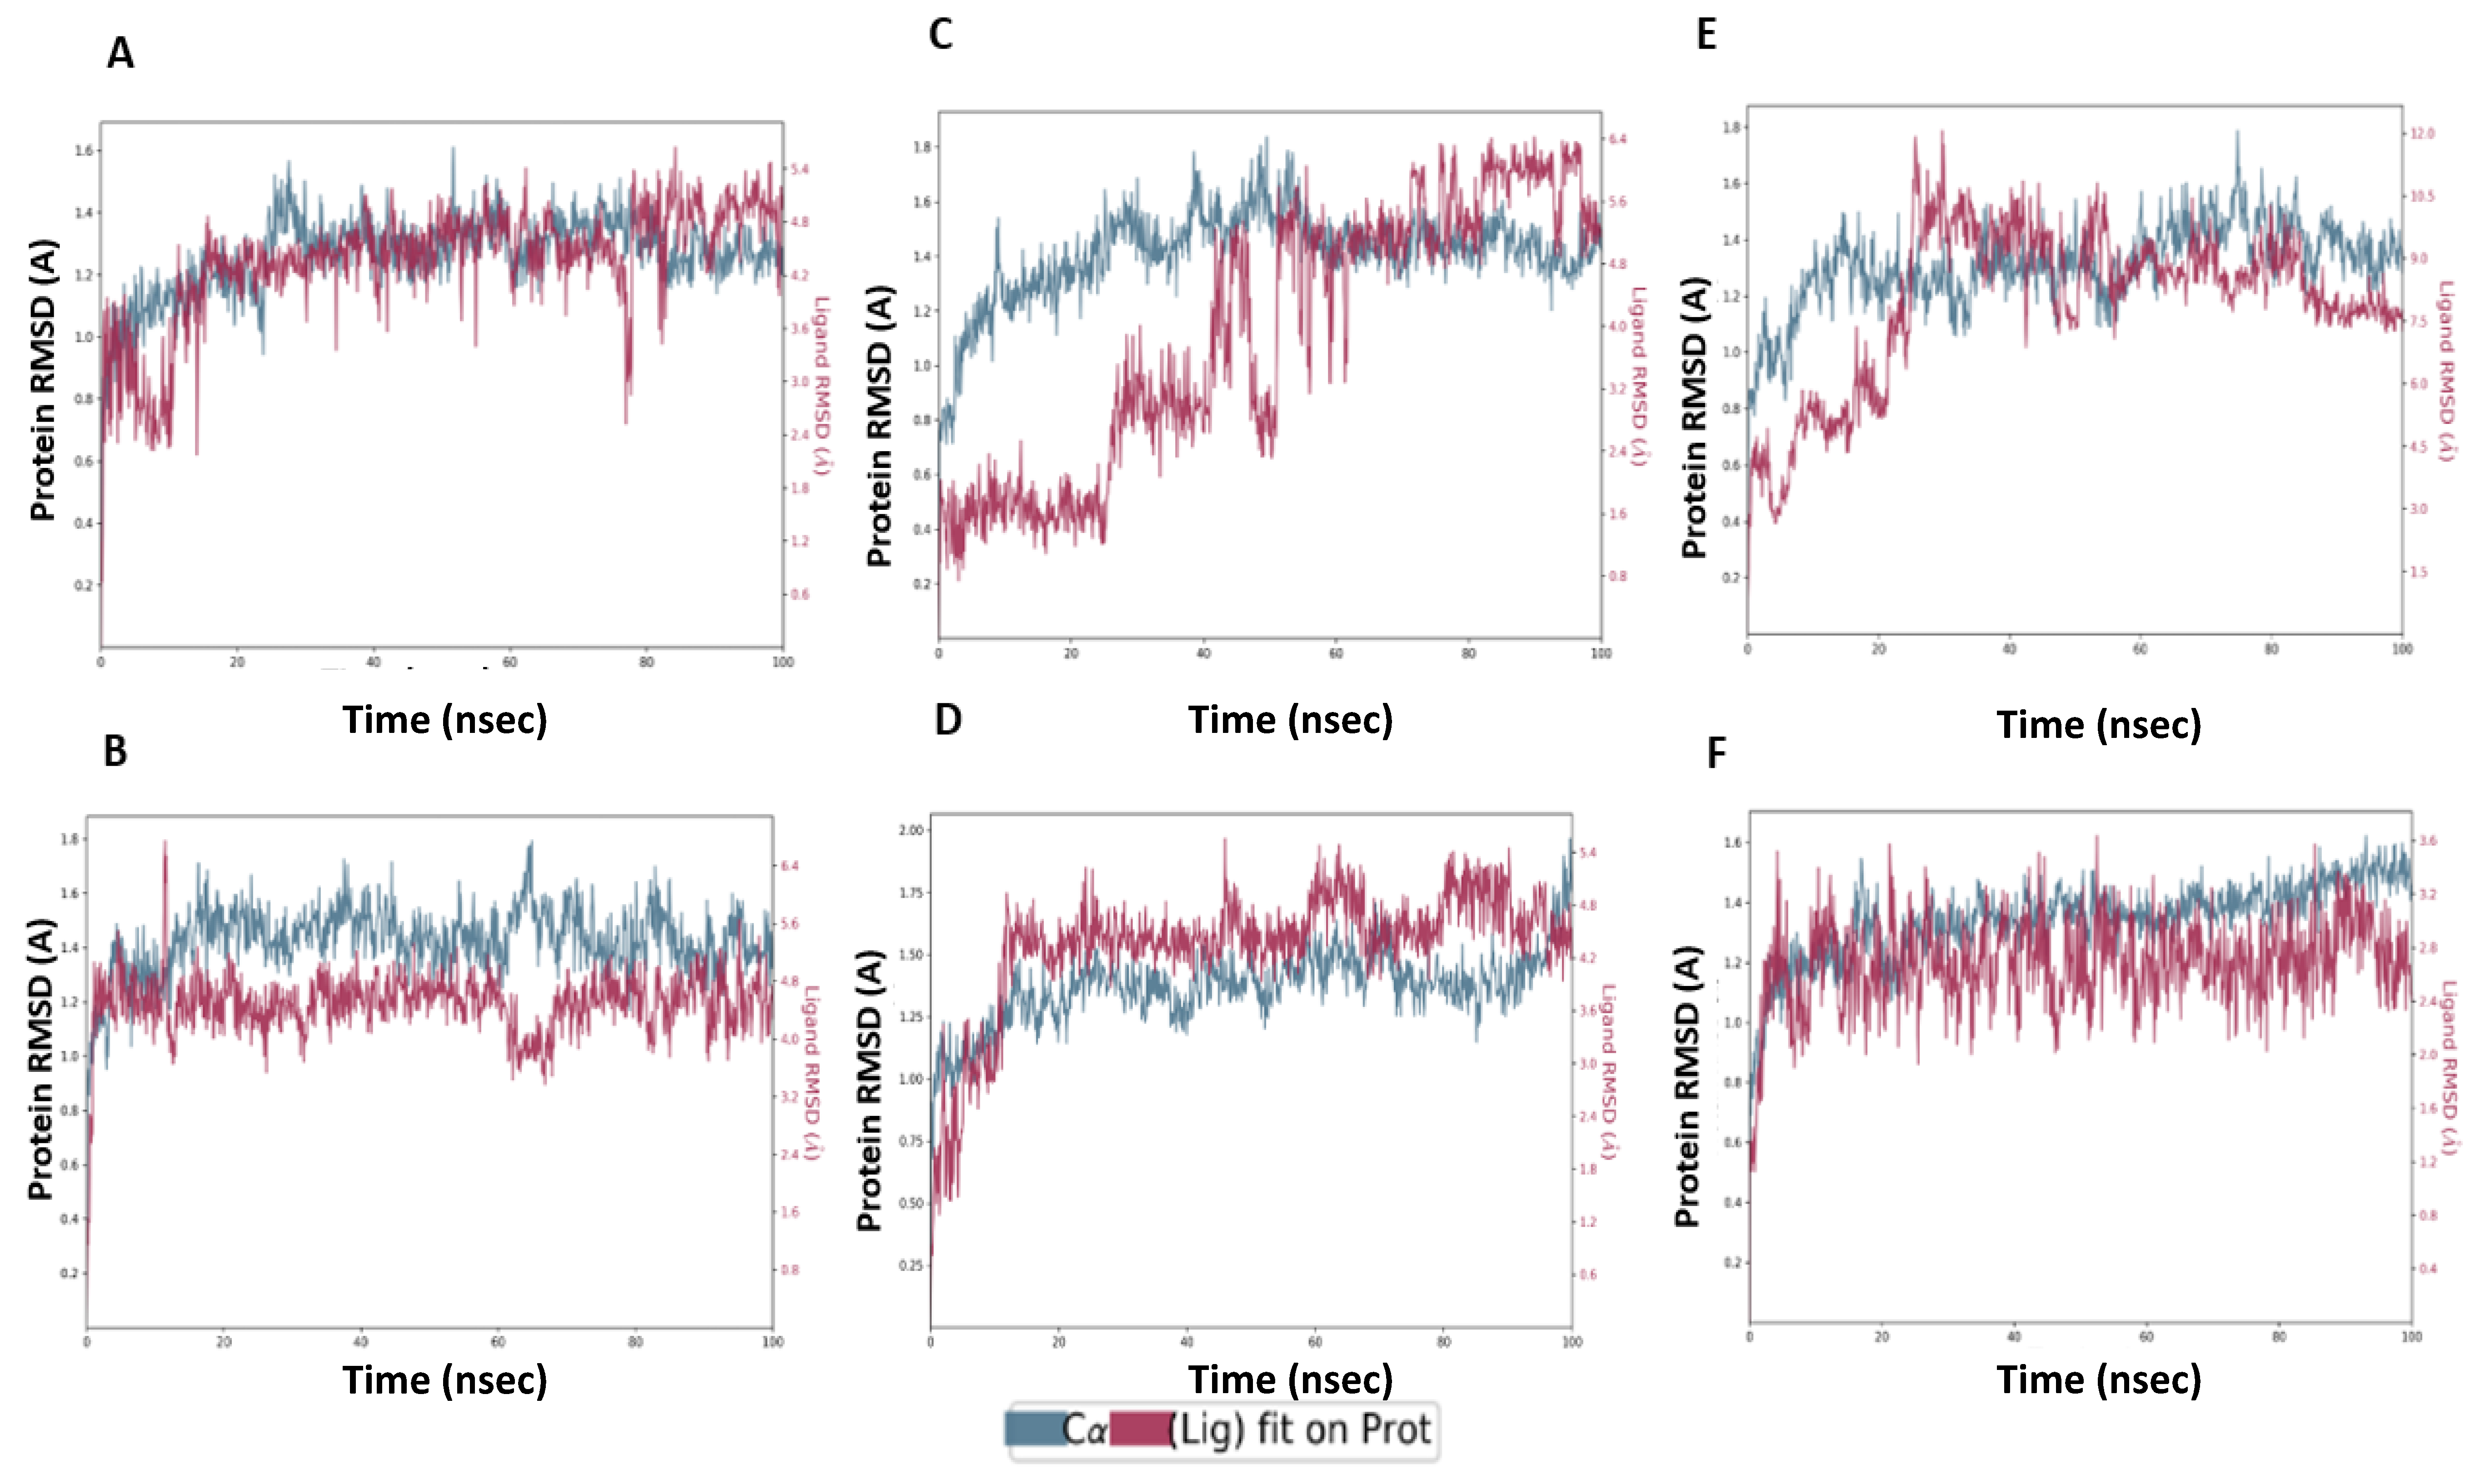
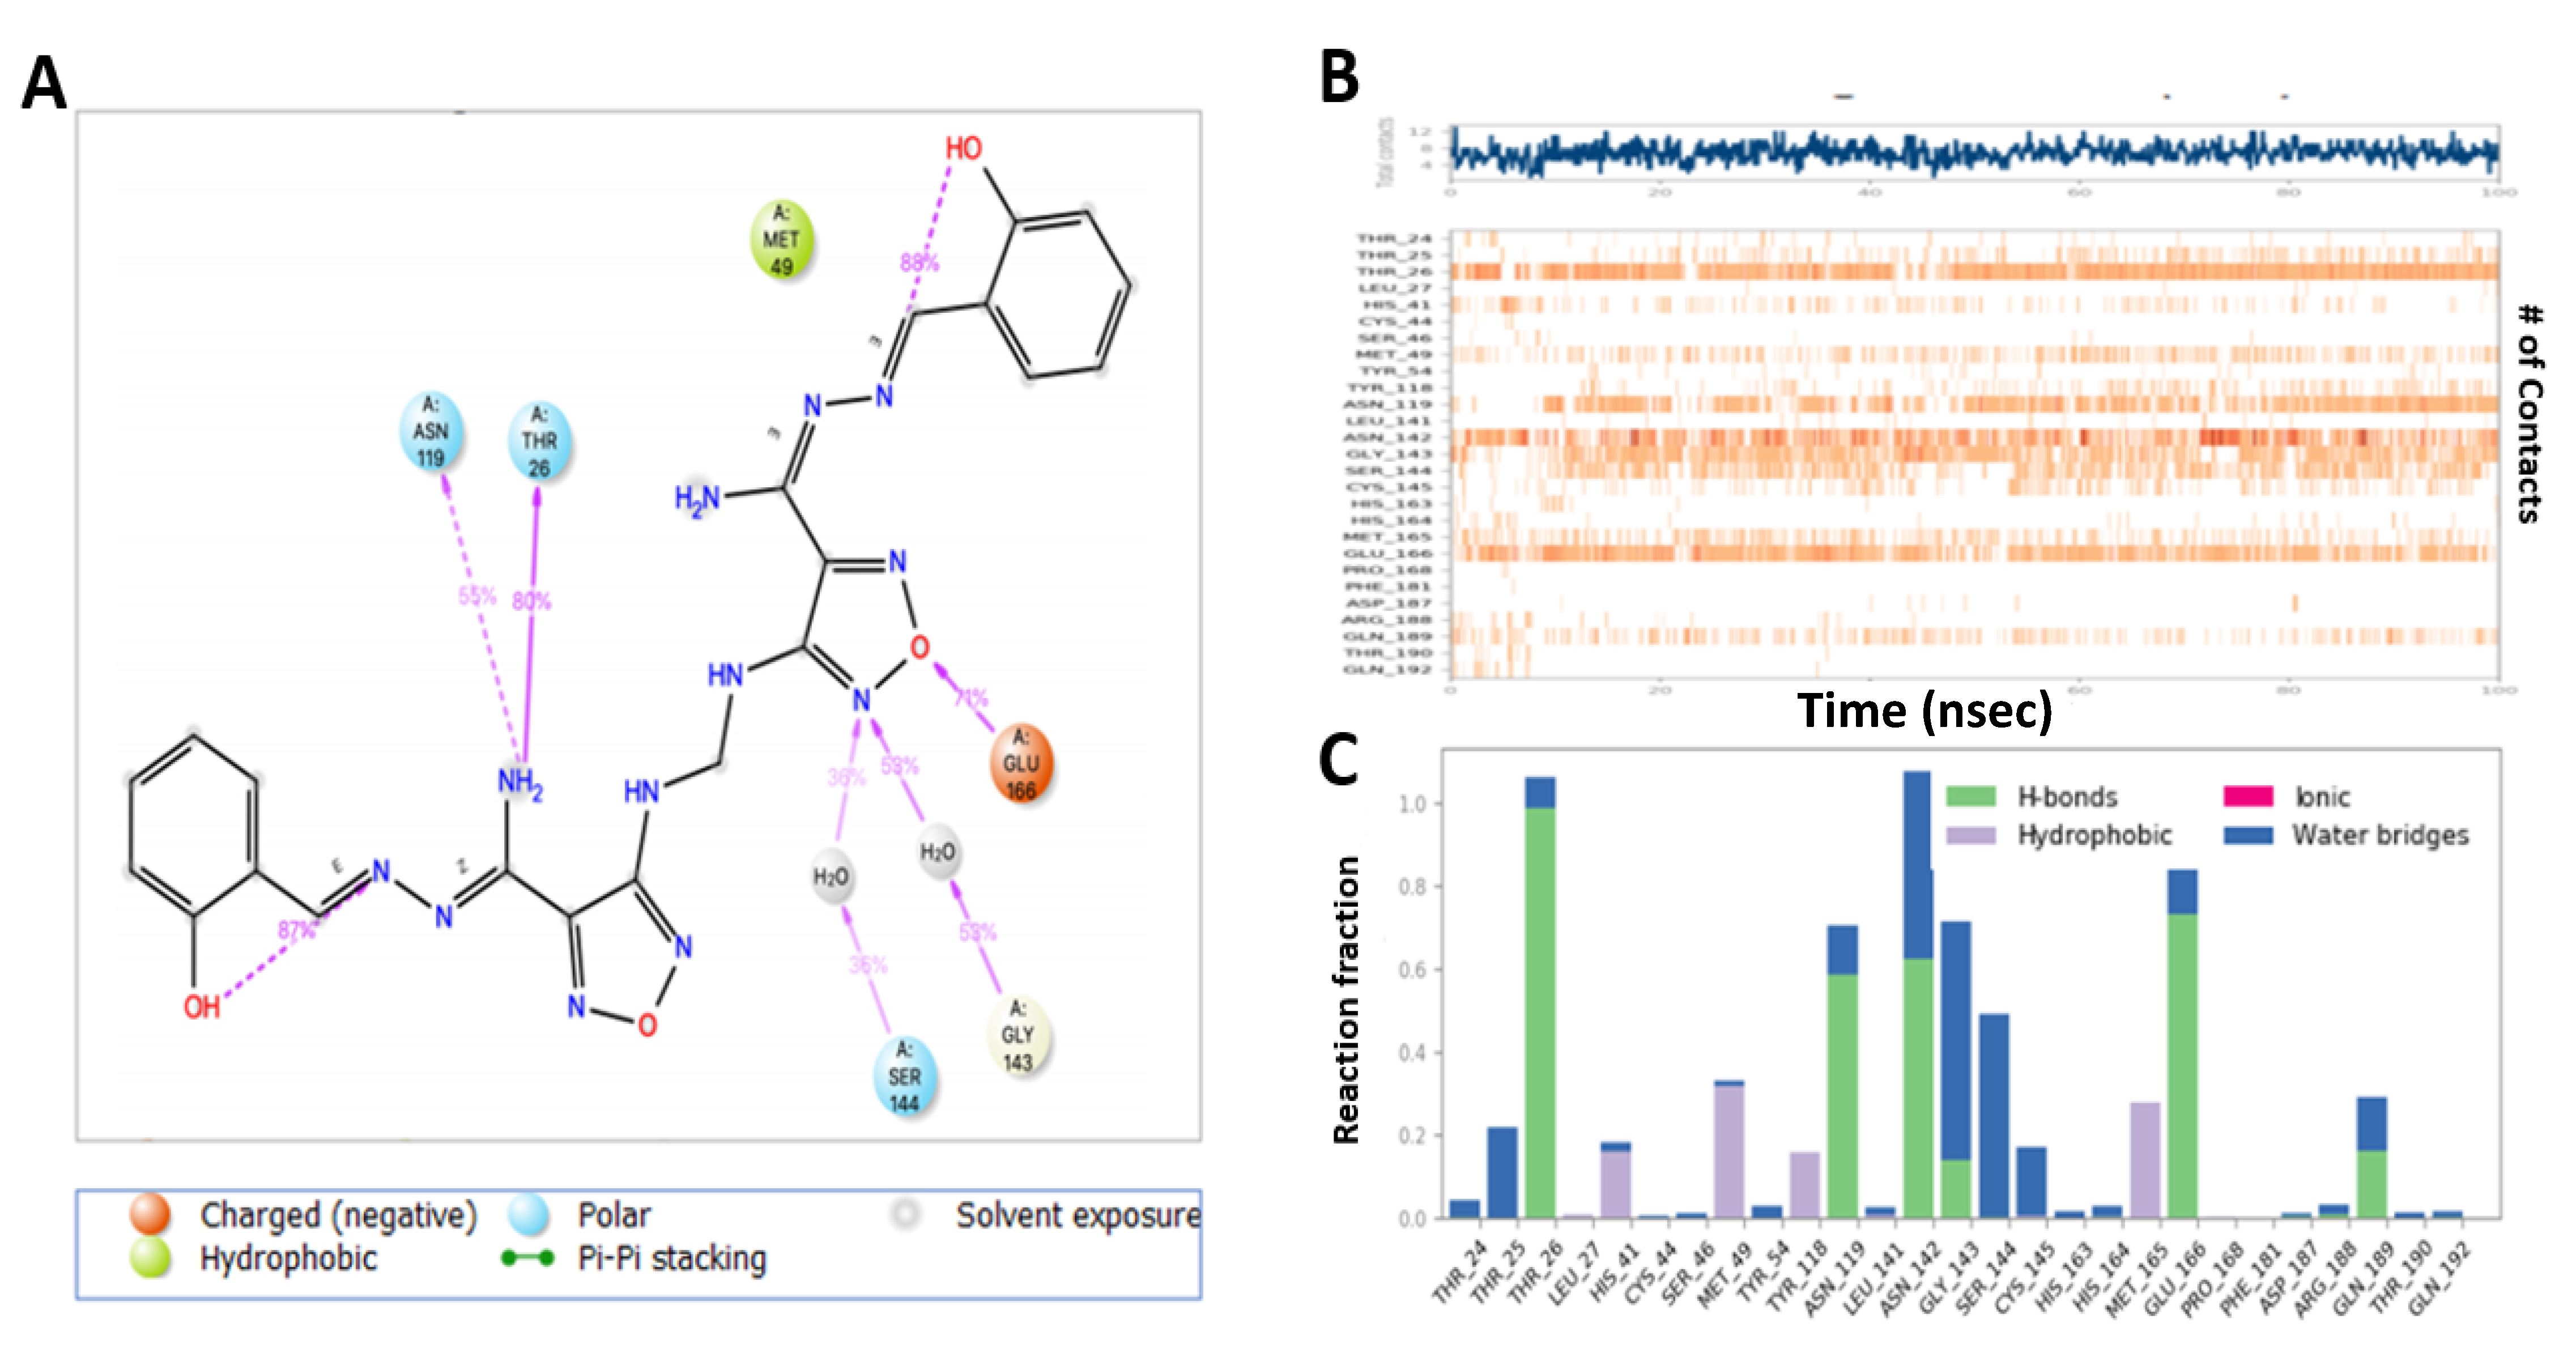
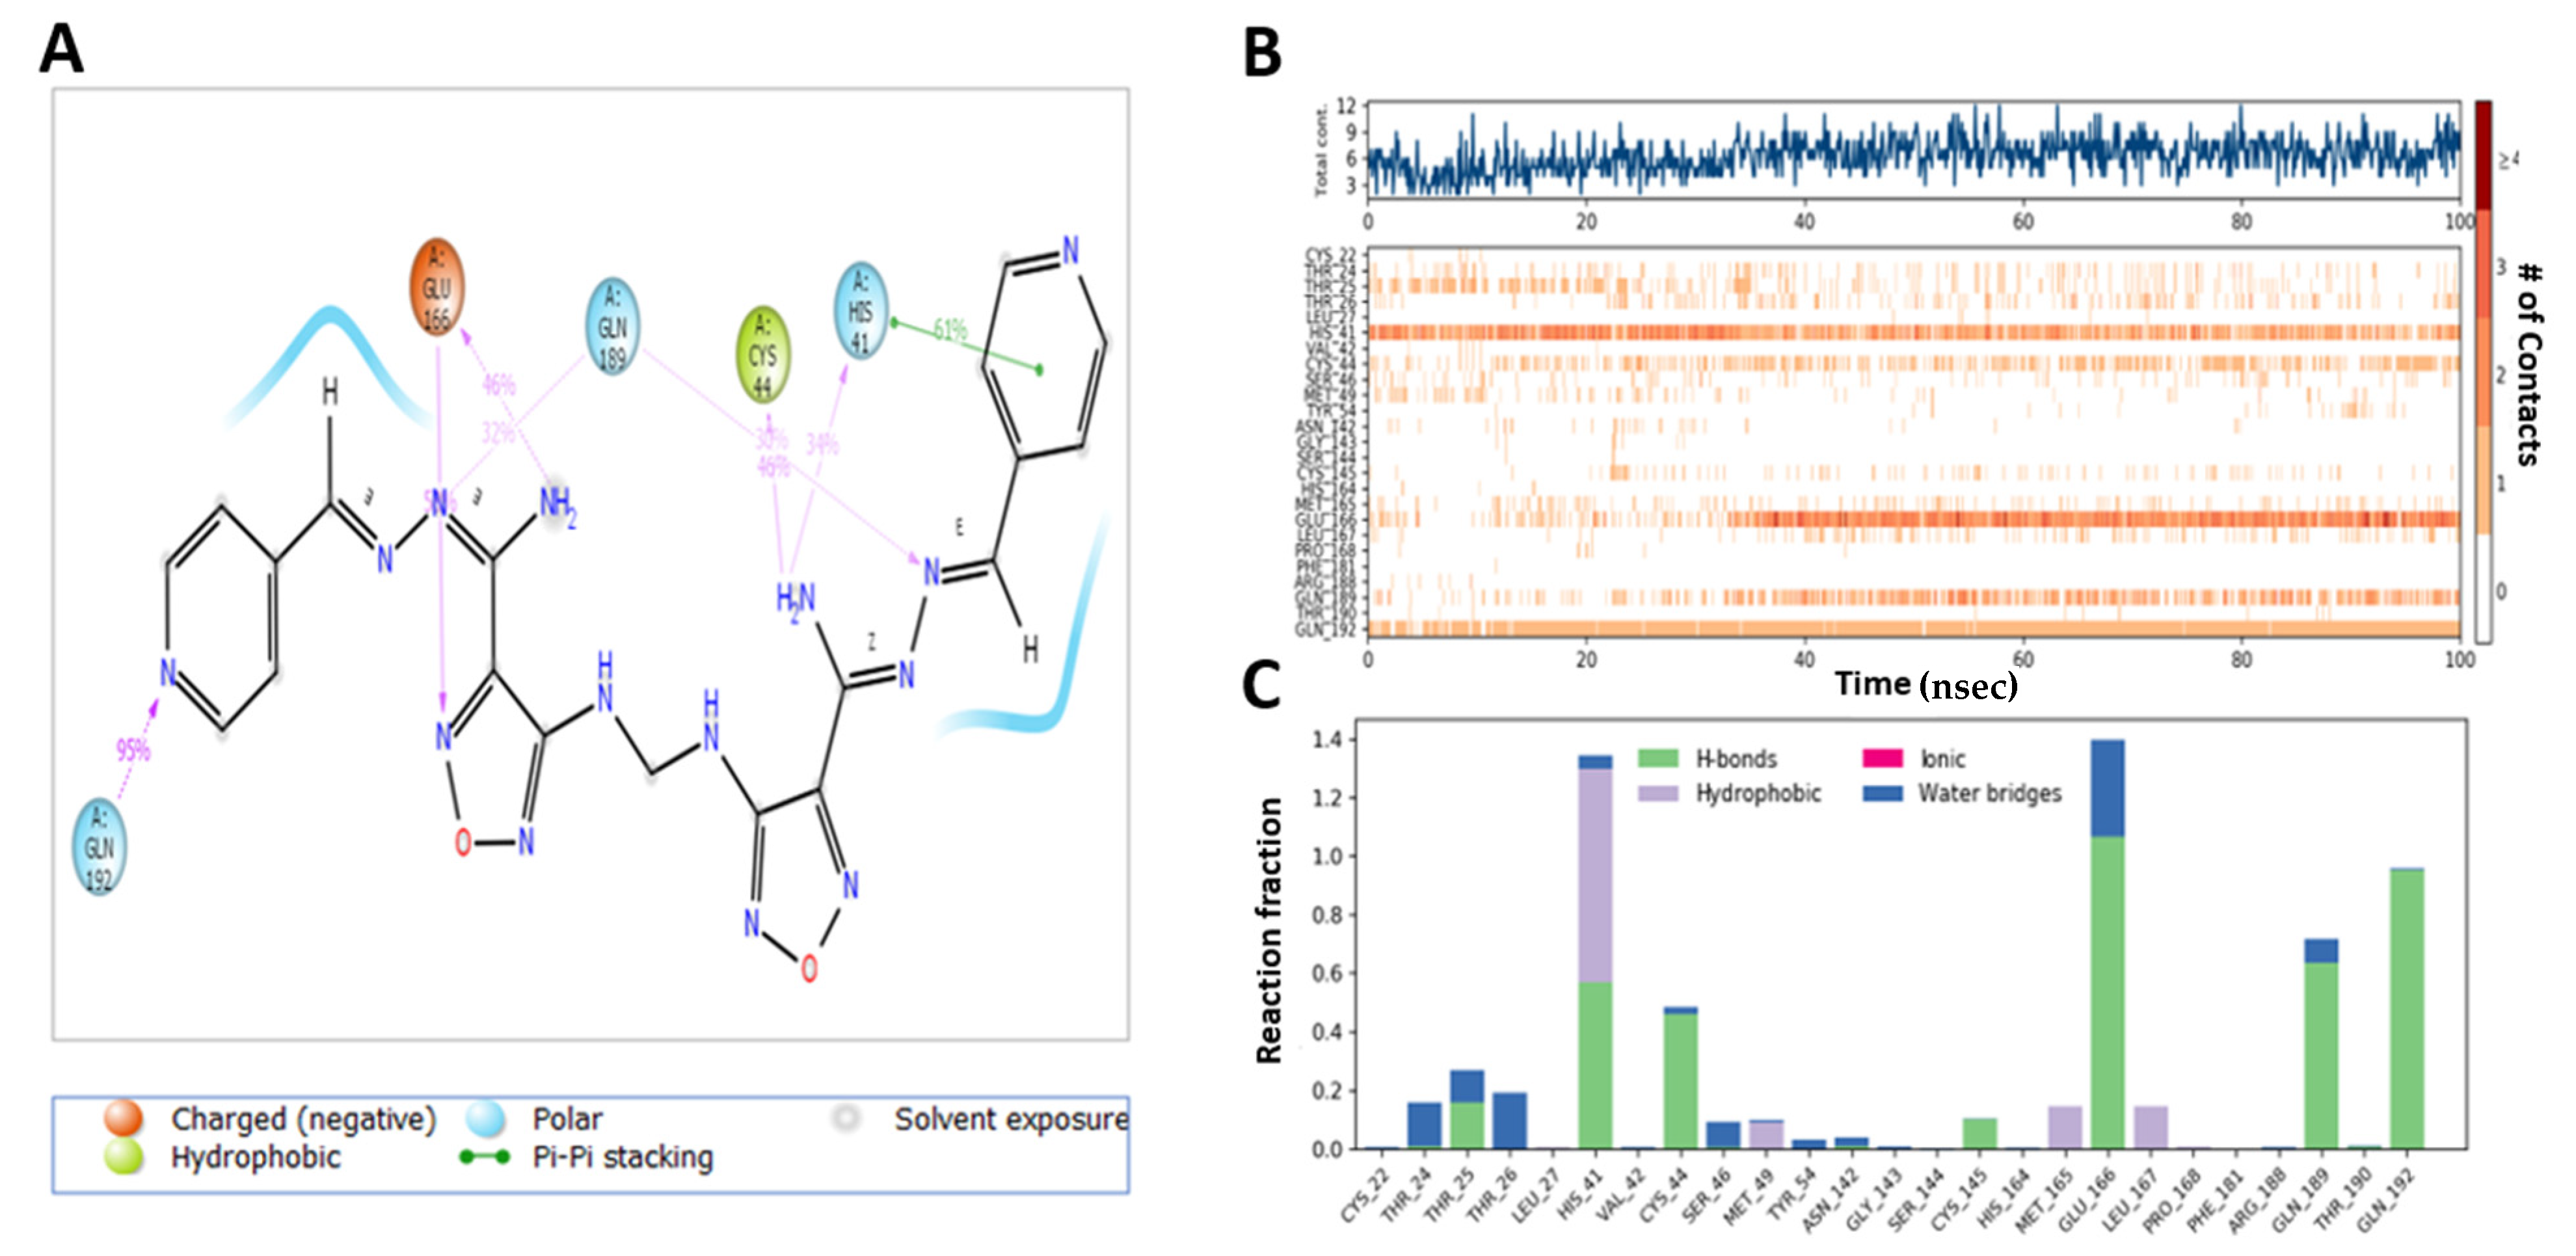
2.6. MD Simulation Confirmed the Stability of M3 Complex with the Target Enzymes, SARS-CoV-2 Mpro and Human TMPRSS2

MD simulations for the shortlisted compounds within the active site of Mpro and TMPRSS2 enzymes indicated the superiority, stability, and stability of the M3 complexes with both enzymes (Figure 9). MD results verified the stability of the compounds based on the fluctuation of root mean square deviation (RMSD) during the simulation. The ligand and protein RMSD were independently measured, where 2Å indicates the stability of the complex. The inhibitory activity was related to the decrease in residues fluctuation within the pocket site.
M3 showed a higher binding stability with catalytic site residues of Mpro compared to Compound 13. The RMSD of Compound 13 complex with Mpro was 1.9 Å compared to 1.6Å for the protein alone (Figure 9A). Compound 13 showed a conformational change that lasted for 15 ns to reach the equilibrium (Figure 9A). Similarly, the M3 complex reached the equilibrium after 15 ns, but showed a lower fluctuation range of 1.1Å (Figure 9B), indicating the stability of a formed complex over the simulations period (Figure 9B).
M1 complex with Mpro showed a fluctuation that lasted for a longer time (25 ns) until reaching equilibrium with RMSD range of 1.2Å compared to 0.7 Å for the protein alone (Figure 9C). M2 protein complex showed higher fluctuation range at 1.3 Å when compared to 1.6 Å for the protein alone and it stabilized after a longer time (60 ns) (Figure 9D). M4 complex required 35 ns to reach the equilibrium and with a relative stability range of 2.1 Å when compared to 1.5 for the protein (Figure 9E). M5 complex required a somewhat longer time for stabilization at 40 ns with a RMSD value of 1.6 Å compared to 1.5 Å for the protein (Figure 9F). This indicated the superiority of the M3 complex during the MD simulation and the highest stability of its complex, M2 showed the lowest stability, while Compound 13 showed moderate stability and M1 and M5 required a longer time for stabilization.
Regarding the binding with TMPRSS2, Compound 13 complex showed fluctuation for the first 25 ns until it reached equilibrium. The obtained RMSD range was 2.4 Å compared to 0.7 for the protein (Figure 10A). M3 complex with TMPRSS2 reached equilibrium after 15 ns and showed low protein and ligand fluctuation of RMSD ranges of 0.5 and 1.8 Å, respectively, indicating the stability of M3 complex over the MD simulation (Figure 10B). M1 protein complex required a longer time (60 ns) to reach equilibrium and showed protein and ligand RMSD fluctuation ranges of 0.6 and 2.1 Å, respectively (Figure 10C). M2 protein complex showed fluctuation of the protein for the first 20 ns to reach the equilibrium with the protein, and the ligand RMSD range was 0.7 and 1.9 Å, respectively (Figure 10D). M4 complex required 30 ns to reach the equilibrium, after that, it showed a relative stability with RMSD values of the protein and ligand ranging from 0.8 and 2.1 Å, respectively (Figure 10E). M5 complex showed certain stability over MD simulation. It required 20 ns for equilibrium with RMSD values of protein and ligand ranging from 0.5 and 1.7 Å, respectively (Figure 10F). Collectively, it is obvious that the M3 protein complex showed stability over the MD simulation, better than the Compound 13 complex (Figure 9 and Figure 10).
Compound 13 complex with Mpro exhibited H-bond formation with NH2 moiety of ligand with Thr-26 (80%), Asn-119 (55%), N of the oxadiazole ring with Gly-143 (59%, 59%) and Ser-144 (30%, 36%) via a water bridge, O of the oxadiazole ring with Glu-166 (71%) (Figure 11A), and hydrophobic contacts with His-41, Met-49, Tyr-119, and Met-164, whereas Thr-61, Tyr-94, Asp-37, Cys-191 Phe-141, and Cys-191 constituted a more flexible region (Figure 11B,C).
MD analysis of the M3 complex with Mpro showed H-bond interactions similar to those predicted by the docking study (Figure 12A). M3 exhibited H-bond interactions between the NH2 of the ligand with His-41 (34%) and Cys-44 (30%), and Glu-166 (46%), N with Gln-189 (46%), N of oxadiazole with Glu-166 (58%), and N of pyridine with Gln-192 (95%), and pi–pi stacking with His-41(61%) and hydrophobic interaction with His-41, Met-49, Met-165, and Leu-167. The region made of Leu-27, Ser-144, His-164, Phe-181, and Ala-191 residues was more flexible and had no hydrogen bond and hydrophobic interactions (Figure 12B,C).
Compound 13-induced docked complex with TMPRSS2 showed similar modes of binding. Compound 13 exhibited an H-bond between NH2 moiety of ligand with His-40 (54%), Ser-214 (36%), and OH with Glu-218 (34%) (Figure 13A). Hydrophobic interactions of the oxadiazole ring with His-57, His-99, Tyr-149, Ala-190, and Val-213 were stable, whereas Thr-61, Tyr-94, Asp-37, Cys-191 Phe-141, and Cys-191 regions were more flexible (Figure 13B,C).
MD analysis of the induced docking fit pose of M3 complexed with TMPRSS2 exhibited a water bridge H-bond of oxadiazole oxygen with Gly-193 (30%, 35%) and Ser-195 (33%, 30%); ionic interaction of oxadiazole N with Asp-147 (43%, 43%); hydrogen bond interaction of NH2 with Gly-216 (92%); and N interaction with Gln-192 (50%) (Figure 14A). Hydrophobic interactions with His-57, Ala-190, Val-213, and Typ-215 were in the stable region, whereas the region made of Thr-61, Phe-141, Gln-152, and Cys-191 was more flexible and had no hydrogen bond and hydrophobic interactions (Figure 14B,C). This indicates the higher stability of M3–protein complexes with Mpro and TMPRSS2 catalytic site residues when compared to Compound 13.
MD simulation of M1 with Mpro binding site showed H-bond interaction of NH2 moiety with Glu-166, NH with Asn-142, N of the oxadiazole with His-163 and with Glu-166 through a water bridge (Supplementary Figure S3A). Further, it showed hydrophobic contacts with Thr-26, Leu-27, His-41, Met-49, and Cys-145, whereas the region made of Thr-26, Leu-50, Asn-119, Phe-140, and Arg-188 was more flexible (Supplementary Figure S3B,C). MDS of M2 complex with Mpro showed H-bonding of oxadiazole N with Glu-166, Gly-143, N with Gln-189 and a halogen bond with His-4 (Supplementary Figure S4A), hydrophobic contacts with Leu-27, His-41, Cys-44, Met-49, and Met-165, whereas His-172 and Pro-168 constituted a more flexible region (Supplementary Figure S4B,C). MD simulation of M4 complex with Mpro exhibited ionic interactions of oxadiazole N and O with His-41 and Cys-44 and N of oxadiazole with Ser-46 (Supplementary Figure S5A); in addition to ionic contacts with Thr-25, Met-49, and Gln-189, the hydrophobic contacts with His-41, Met-49, Met-165, and Pro-168. Gln-192 and Ala-191 constituted a more flexible region with no observed interactions (Supplementary Figure S5B,C). M5-Mpro complex showed hydrogen bonding of NH2 moiety with Glu-166, Asn-142 through a water bridge and N of the oxadiazole with Gly-143 (Supplementary Figure S6A); in addition to hydrophobic interaction with Thr-26, His-41, Cys-44, Met-49 and Met-165. His-172, His-164, Gln-192, and Pro-52 constituted a more flexible region (Supplementary Figure S6B,C).
M1 complex with TMPRSS2 showed H-bonding of NH2 moiety with Gly-216, Gly-148, N of oxadiazole with Arg-41 through a water bridge and hydrophobic interactions of the oxadiazole ring with His-57 (Supplementary Figure S7A). Further, hydrophobic contacts with His-40, Gly-148, Asp-189, Trp-215, and Val-213 constituted the stable region, whereas Thr-61, Lys-145, Cys-191, Asp-37, and Cys-219 was the flexible region (Supplementary Figure S7B,C). Compound M2 complex with TMPRSS2 showed hydrogen bonding of NH2 moiety with Ser-214 and His-57 (Supplementary Figure S8A) and hydrophobic interactions of the oxadiazole ring with His-57. Hydrophobic contacts with Arg-41, His-99, Ala-190, Tyr-149, and Val-213 constituted the stable region, whereas regions Asn-146, Asp-217 and Glu-218 were more flexible (Supplementary Figure S8B,C). MD analysis of the inhibitor M4 with TMPRSS complex exhibited an H-bond of methoxy oxygen with Gln-192 and ionic interaction with Arg-41, NH2 with Gly-148, Gln-192 and ionic interaction with Asp-147 (Supplementary Figure S9A). The region made of Gly-38, Cys-58, Lys-76, His-96, Phe-141, Asn-146, Gly-216, and Asp-217 was more flexible and with no interactions (Supplementary Figure S9B,C). M5–TMPRSS2 complex showed hydrogen bonding of NH2 moiety with Gly-148, Ser-214, and His-57, N of the oxadiazole with Asp-147 through water bridge, N and methoxy showed interaction with Arg-41 through water bridge, N with Gly-216 through a water bridge (Supplementary Figure S10A). Ala-190 and Cys-42 constituted a more flexible region (Supplementary Figure S10B,C).

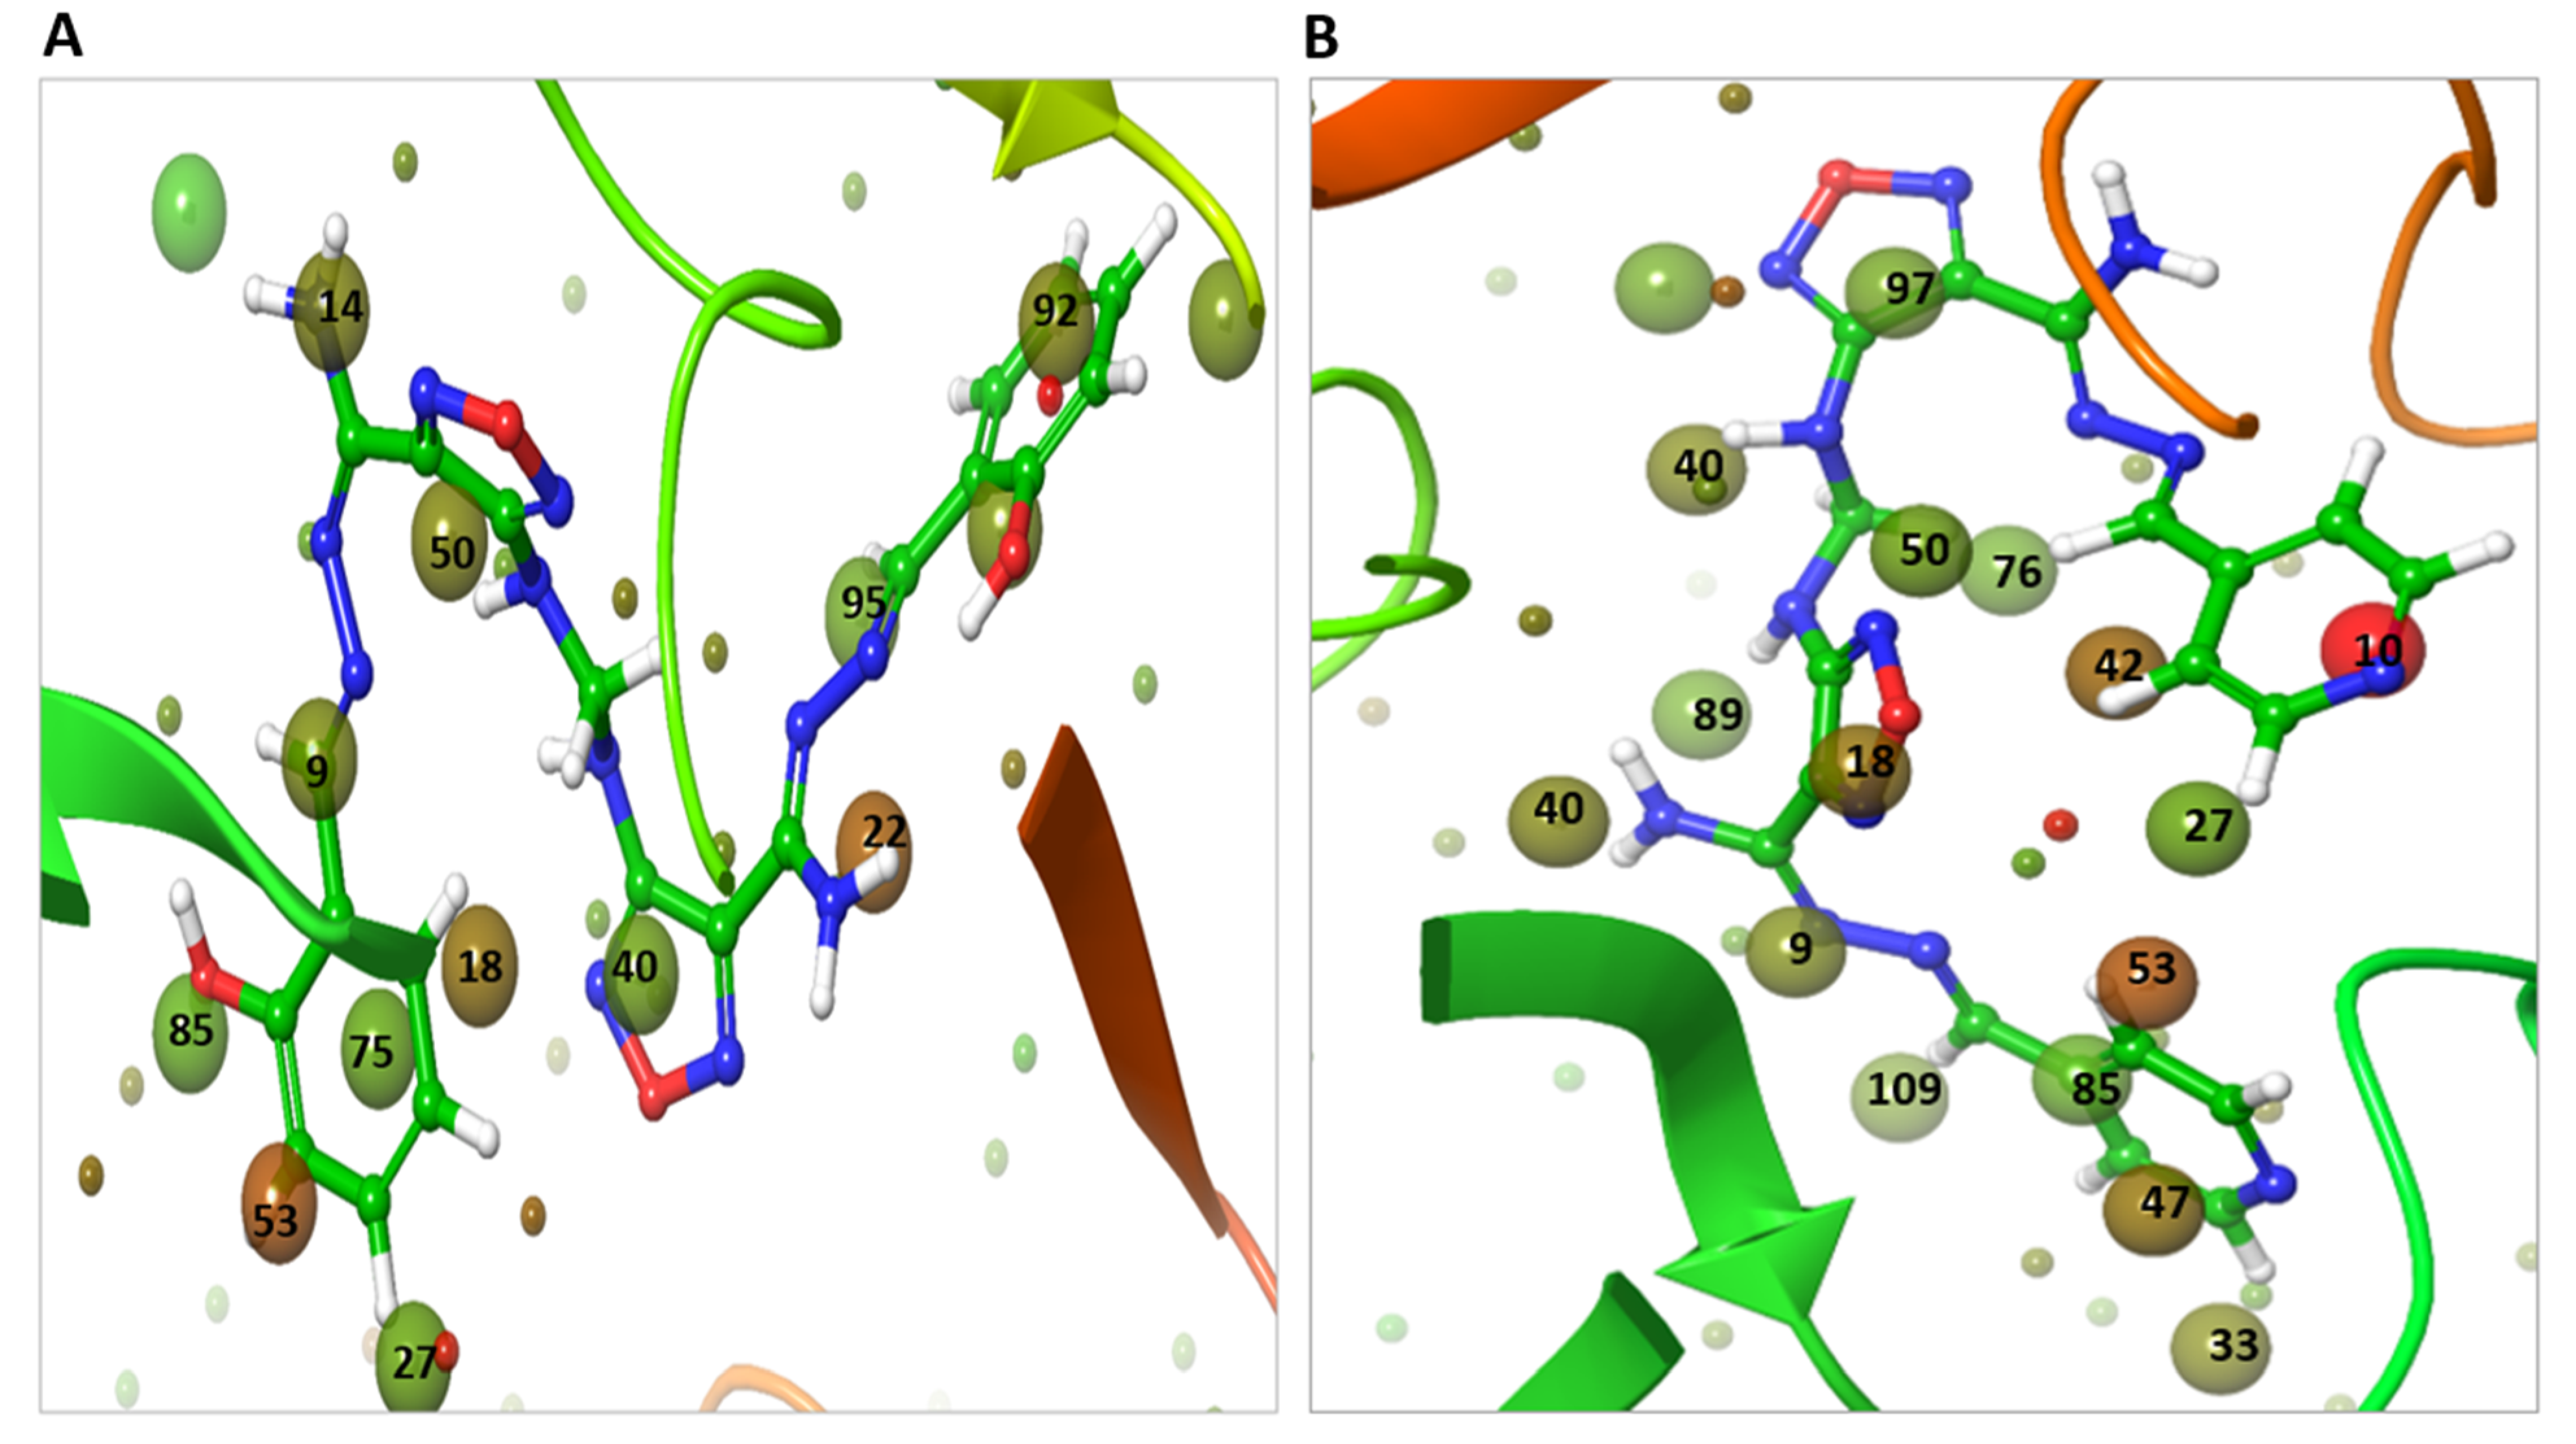
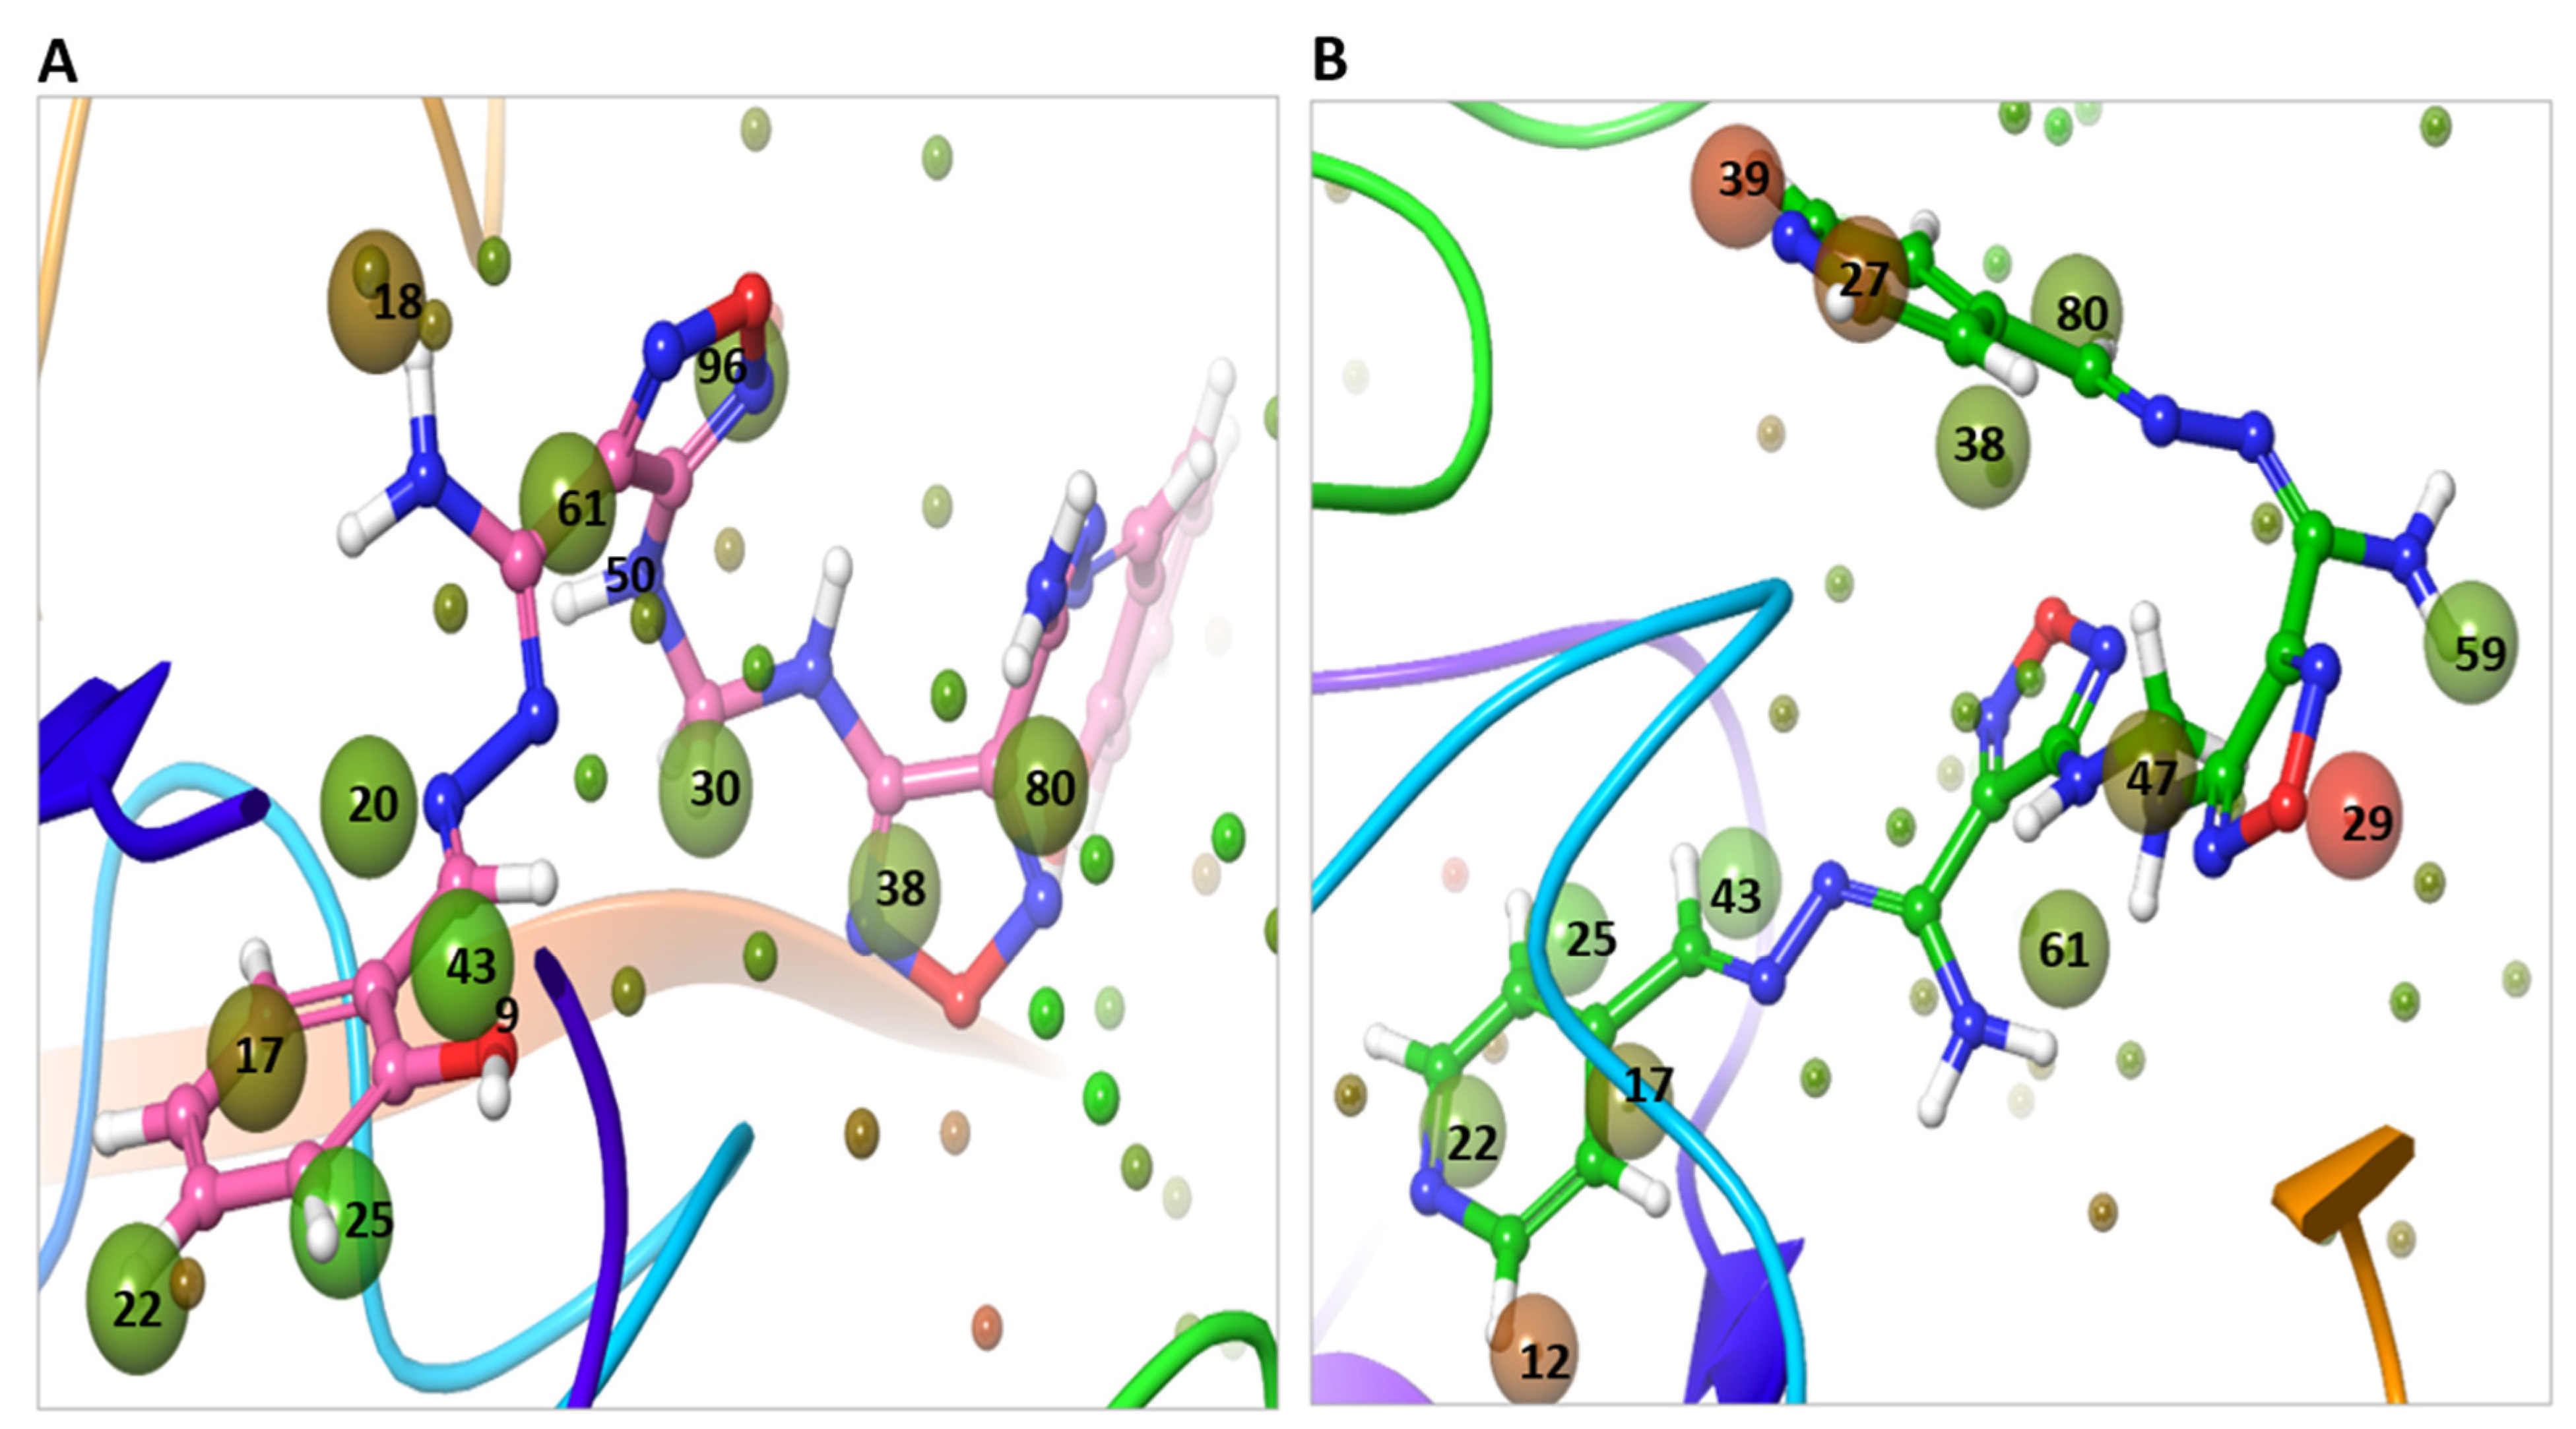
2.7. WaterMap Analysis Showed the Pronounced Efficacy of M3

WaterMap analysis of Mpro binding site showed 111 hydration sites with a sum up free energy of 233.02 kcal/mol, indicating that the site has strong potential for ligand binding pockets (Supplementary Table S3). The number of replaceable water molecules at the dG cut off value −2.0 to +2.0 kcal/mol was 60 kcal/mol. The number of unstable water molecules with dG cut off value > 2.0 kcal/mol was 51 kcal/mol. There was no stable water with dG value < −2.0 kcal/mol (Supplementary Table S3). The WaterMap analysis of the TMPRSS2 binding site showed 105 hydration sites with a sum up free energy 219.34 kcal/mol, indicating that the site has strong potential for ligand binding pockets (Supplementary Table S3). The number of replaceable water molecules was 59, while the number of displaceable unstable water molecules was 47 and there was no stable water. The docked pose of Compound 13 showed displacement and replacement of the Mpro hydration site waters at 9, 14, 18, 22, 27, 35, 40, 50, 53, 55, 66, 75, 85, 89, 92, and 95 with a dG sum up of 29.95 kcal/mol (Figure 15A). On the other hand, M3 showed displacement and replacement of 9, 10, 18, 27, 33, 40, 42, 47, 48, 50, 53, 76, 85, 89, 95, 97, and 109 with a higher dG sum up of 46.29 kcal/mol (Figure 15B). Two of the most unstable water (in red color) at sites 10 and 53 with dGs of 7.52 and 4.4 kcal/mol, respectively, were displaced by the pyridine moiety of M3. Furthermore, the least unstable water at sites 47 and 42 with dG of 3.15, and 3.65 kcal/mol, respectively, were displaced by the pyridine moiety of M3. The water at site 18 with dG 3.19 kcal/mol was displaced by the oxadiazole moiety. In the case of Compound 13, it did not displace any unstable water (in red color) at the binding site, instead, it displaced only less unstable water at 18, 22, and 53 sites with 3.19, 4.02, and 4.4 kcal/mol. This explains the improved potency of M3 over the lead Compound 13.
The WaterMap analysis of the docked position of compound 13 within the TMPRSS2 binding site showed displacement and replacement of waters at hydration sites 17, 18, 22, 25, 30, 38, 43, 61, and 96, with dG 12.40 kcal/mol (Figure 16A). On the other hand, M3 showed displacement and replacement of water at sites 14, 17, 22, 25, 27, 29 31, 38, 39, 43, 47, 59, 61, 77, and 80 with a higher dG, 34.53 kcal/mol (Figure 16B). The most unstable water (in red color) at sites 14, 27, and 39 with dG 4.45, 4.21, and 5.30 kcal/mol were displaced by the pyridine moiety of M3, while the water at site 29 with dG 6.58 kcal/mol was displaced by the oxadiazole moiety of M3. The less unstable water at site 18 with dG of 3.25 kcal/mol was displaced by Compound 13.

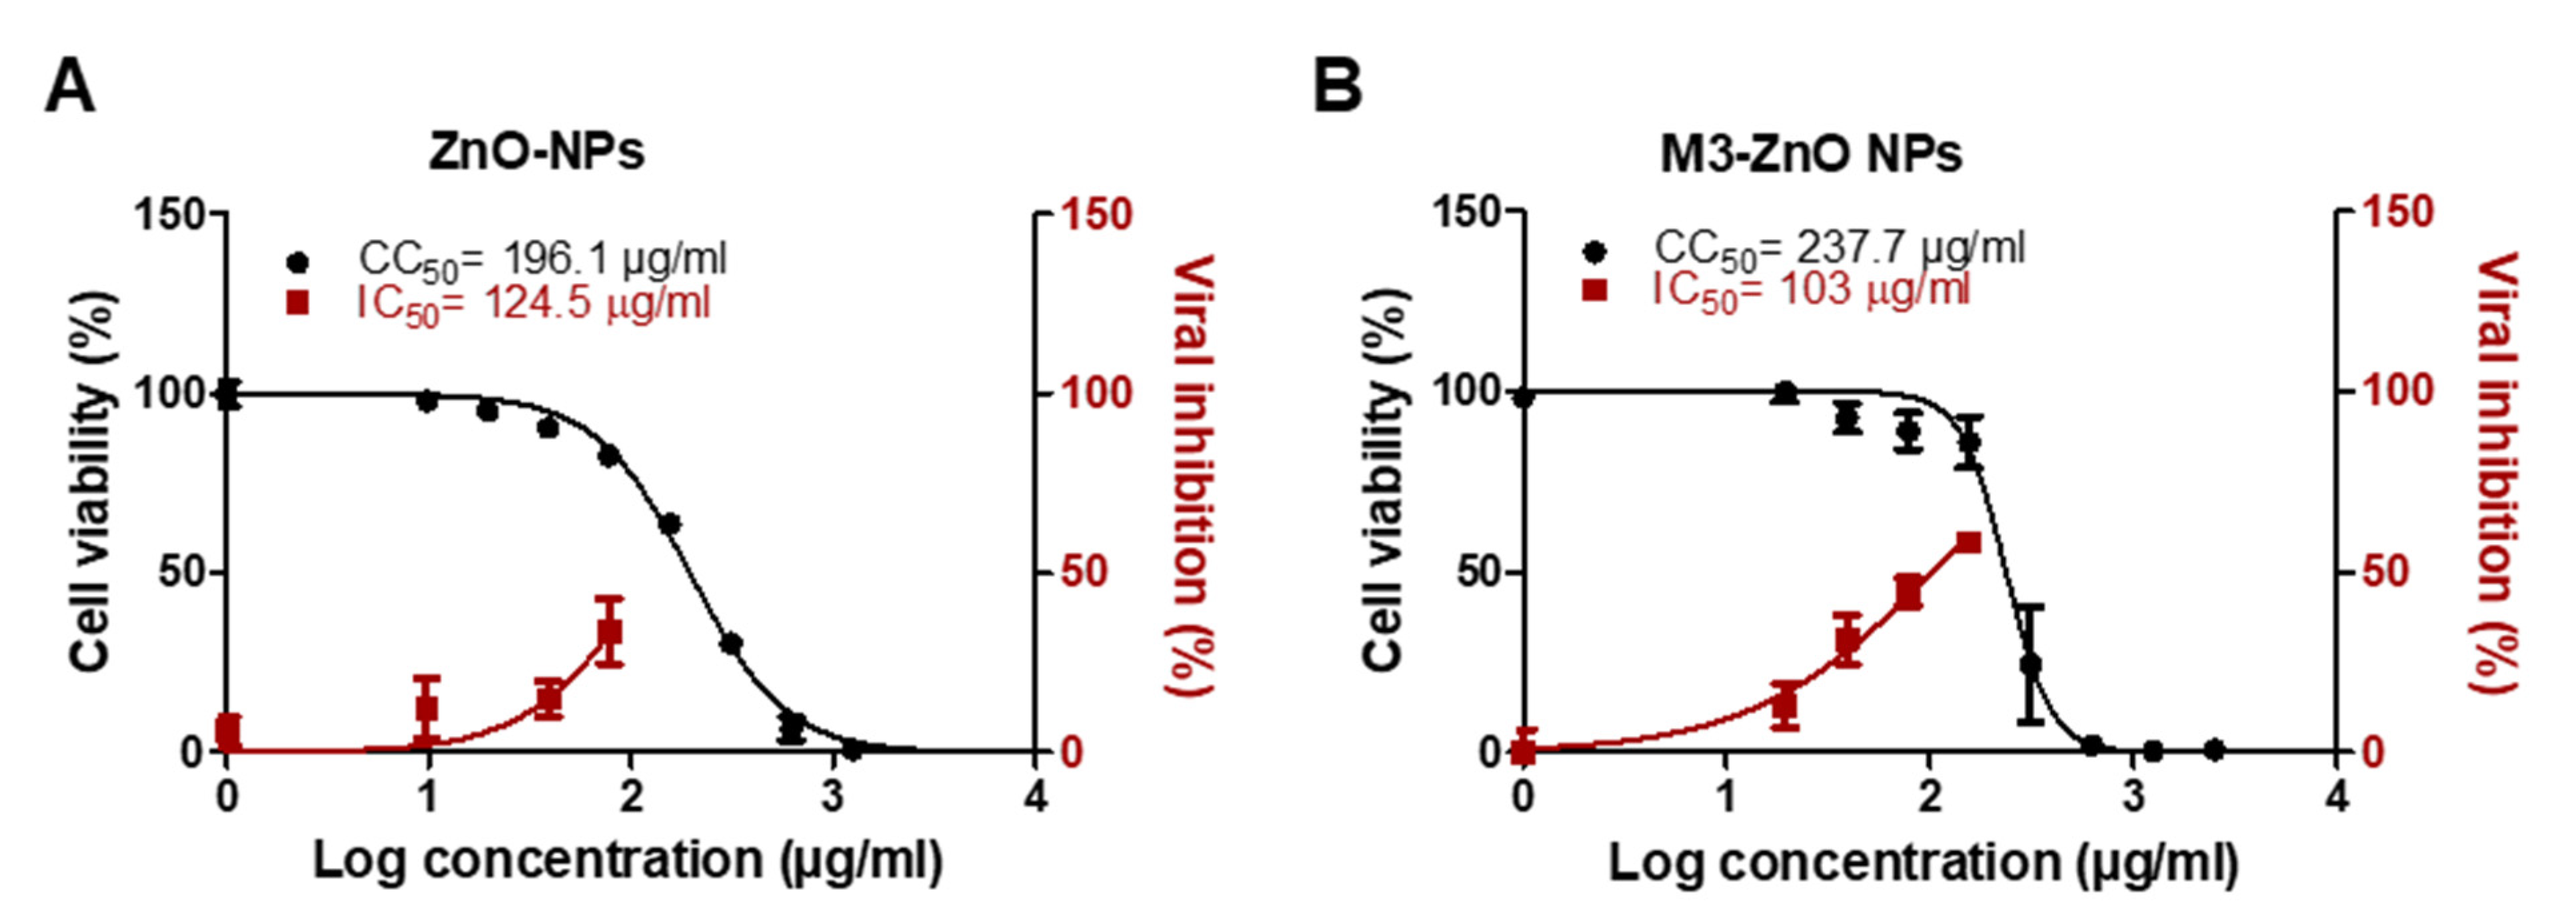
2.8. Adsorption of M3 Compound on ZnO NPs Enhanced the Efficiency against SARS-CoV-2

Compound M3 was successfully adsorbed on ZnO NPs with an entrapment efficiency of 95%. The particle surface charge (Zeta potential) of ZnO NPs before and after M3 loading was −11.3 ± 3.09 and 0.174 ± 7.38 mV, respectively (Figure 17A,B). The surface morphology of the M3-loaded ZnO NPs was well-defined spherical shaped NPs with smooth surfaces and without any surface cracks (Figure 17C). The particle size was < 50 nm (Figure 17C). Compared to drug-free ZnO NPs (Figure 18A), M3-loaded ZnO NPs showed significant antiviral activity at IC50 103 µg/mL (Figure 18B). M3-loaded ZnO NPs showed a high selectivity index for antiviral activity relative to Vero-E6 cells toxicity with CC50 values higher than the IC50 values by 2.3-fold compared to 1.6 for the drug-free ZnO NPs. The developed ZnO NPs contained a lower concentration of M3 (IC50 equal to 0.011 µM, which is ~30% lower than the IC50 of the compound alone) and showed a wider safety profile (CC50 equal to 237.7 µg/mL).

3. Discussion

While the number of confirmed infected cases and deaths due to COVID-19 exceeds ~208 and 4.4 million, respectively, as reported by the WHO on 15 August 2021, with an unprecedented increase worldwide [20], no drug is currently approved by the FDA for SARS-CoV-2 infection except for remdesivir, but with controversial activity [21]. Consequently, the discovery of drugs with antiviral adaptability is crucial. Several candidate drugs against SARS-CoV-2 were proposed, including 519 in the preclinical research and 419 in clinical trials according to April 2021 update [22]. By August 2021, the update of COVID-19 drug development showed (i) 81 antibodies; (ii) 31 antivirals; (iii) 6 RNA-based compounds; (iv) 34 cell-based compounds; and (v) 18 re-purposed compounds [23]. Besides supportive medications including bronchodilator and anti-inflammatory are under clinical trial for the final approval. The first re-purposed FDA drug was hydroxyl-chloroquine that is later discontinued by the WHO in June 2020 [24]. On March 2020, the center for disease control and prevention (CDC) considered remdesivir as an adaptive protocol for hospitalized COVID-19 patients [25]. Several antiviral drugs were investigated to treat COVID-19 disease and currently in phase III clinical trials such as favipiravir (April 2020) [26] and ritonavir/lopinavir (mid-2020) [27]. Novel antibodies, such as Casirivimab/imdevimab cocktail developed in (March 2020) [28] under the brand name REGEN-CoV, was intended to inhibit the mutational escape of the virus, a Bamlanivimab and etesevimab cocktail was granted an FDA emergency use authorization (EUA) approval in November 2020 [29] and Sotrovimab received FDA-EUA in May 2020 to treat moderate to severely infected COVID-19 patients [30]. In early 2021, Pfizer commenced phase I clinical trial for a novel protease inhibitor named PF-07321332 [31].
We have developed a novel anti-SARS-CoV-2 compound (M3) following an iterated virtual screening of our previously reported molecule (Compound 13) [12].
Structure–activity relationships (SAR) of shortlisted compounds identified following iterated virtual screening and molecular docking of Compound 13 were studied using the R-group analysis tool. It showed that a small chemical structural change resulted in a substantial variance in the binding affinity and potency. The different R-groups orientations showed dissimilar experimental values of antiviral PIC50. The superior activity was indicated by the replacement of the 2-hydroxy phenyl moiety of Compound 13 with the 4-pyridinyl moiety of M3. The replacement with 2-OCH3 phenyl of M5 retained an almost similar activity of the lead Compound 13. On the contrary, the replacement with 2-chloro-phenyl of M2 and the 3,5-dichloro-4-hydroxyphenyl moiety of M4 exhibited a negative influence on the activity. The results from SAR heatmap analysis showed the variance activity with colors ranging from red to blue (Figure 19A). Moreover, the pharmacophoric R-QSAR analysis highlighted that the hydrogen bond acceptor (HBA) was significantly increased the activity (Figure 19B); therefore, the chloro-substitution, the weak HBA group, of M2 and M5 showed decreased activity. Hence, the increased activity of M3 and M5 was due to the nitrogen- and oxygen-containing groups, better HBA groups, which would benefit future optimization. Furthermore, the difference in the structural activity between M3 and Compound 13 can be further explained by the incorporation of pyridine moiety in most of the hydrophobic and hydrogen bond interactions with the proteins binding sites that stabilized the complexes. For instance, WaterMap analysis showed that M3 pyridine moiety displaced the most unfavorable hydration site of Mpro and TMPRSS2 proteins with total free energy of 18 and 14 kcal/mole, respectively, which eventually resulted in the significantly improved potency of M3.
The literature is rich with in silico studies for the discovery of molecules with potential activity against SARS-CoV-2 infection [32,33,34,35,36]; however, few studies employing enzyme inhibition assays and/or in vitro experiment supported in silico data. In the present study, compound M3 showed promising in vitro activity against SARS-CoV-2 infected Vero-E6 cells with a potency that was seven-fold higher than the parent compound (Compound 13) and with higher CC50, indicating the validity of the applied virtual screening methodology on developing new analogs with improved efficacy. Additionally, the in vitro antiviral activity of compound M3 showed that it is more potent than many reported anti-SARS-CoV-2 compounds, despite the fact that some of the reported compounds are currently in clinical trials. For instance, the in vitro IC50 of remdesivir (FDA authorized), favipiravir (under clinical trial), and nafamostat against SARS-CoV-2 infected Vero-E6 cells are 0.77, 61.88, and 22.5 µM, respectively, as reported by Wang et al. [37]. Hung et al. assessed the in vitro anti-SARS-CoV-2 activity of the broad spectrum Mpro inhibitor (GC376) and the reported IC50 was 0.91 µM [21]. Furthermore, the IC50(SARS-COV-2) of niclosamide (currently under clinical trials) is 0.28 µM, as claimed by Jeon et al. [38].
The data obtained from the enzyme inhibition assay demonstrated the inhibition efficiency of M3 against SARS-CoV-2 Mpro, human TMPRSS2, and furin enzymes. The aforementioned enzymes are required by SARS-CoV-2 for viral replication and viral entry [39]. Generating compounds to shut down both the viral entry and replication and concurrently acting on viral and human therapeutic targets will boost and expand the arsenal against SARS-CoV-2 by adapting to the viral genetic variants that are currently emerging [39,40]. To initiate infection, SARS-CoV-2 has to attach viral spike proteins to cell receptors, which must be activated by host proteins (TEMPRSS2 and/or furin) in order to fuse with the host cell membrane [41]. Blocking both host proteins (TEMPRSS2 and furin) will prevent the SARS-CoV-2 infection even with viral genetic variants. On the other hand, SARS-CoV-2 replication requires the functional proteins nsp4 that is released through the cleavage of polyproteins pp1a and pp1ab [42]. This cleavage is mediated by Mpro, and consequently, inhibiting Mpro hinders the ability of the virus to replicate within host cells [43]. Targeting Mpro can provide high selectivity as it has a preference for a glutamine substrate, which is missing in the host proteases [44].
The identified IC50 of M3 against Mpro in the present study is 10-times lower than the parent compound (Compound 13) and even lower than the reported Mpro inhibitors in the literature. The most potent Mpro in the literature was reported by Ma et al. and employed the Selleckchem bioactive compound library to screen several protease inhibitors, and GC-376 was found to have a lower Mpro IC50 (0.03 µM) [44]. Li et al. measured the IC50 of 15 compounds selected based on prior virtual screening against Mpro, which showed that the IC50 for the most potent compound (DIP) was 0.6 µM [45]. Another potent Mpro inhibitor (Calpain inhibitor X11) was presented by Sacco et al., with an Mpro IC50 equal to 0.453 µM [5]. Ebselen is a Mpro inhibitor that is acts at IC50 0.67 µM [46]. Finally, Zhang et al. and Dai et al. designed Mpro inhibitors with IC50 values of 0.18, 0.053, and 0.04 µM for compounds 11r, 11a, and 11b, respectively [47,48].
Herein, we also employed ZnO NPs as a nano-therapeutic strategy to enhance the efficacy of compound M3 against SARS-CoV-2 infection. ZnO NPs were selected due to their antiviral activity, ability to enhance drug solubility and bioavailability, cost-effective, biocompatibility with human cells and being approved by FDA as a pharmaceutical excipient [49,50,51,52]. The well-characterized and commercially available ZnO NPs were used in this study with claimed particle sizes of 10–30 nm and a spherical shape. Incubating compound M3 with ZnO NPs under stirring resulted in a significant entrapment efficiency, which could be attributed to the ability of ZnO NPs to set strong electrostatic interactions, chelation, or covalent bonds with a wide range of molecules [53,54,55]. SEM results indicated that the size and shape of the obtained ZnO NPs were similar to the ones claimed by the vendor, while the zeta potential was lowered after incubating the M3 compound with the ZnO NPs, confirming the successful loading of compound M3 on the surface of the ZnO NPs. Our in vitro data indicated that the drug-free ZnO NPs at non-toxic concentrations possess antiviral activity against SARS-Cov-2 and loading the M3 compound on ZnO NPs further enhanced the efficacy against SARS-CoV-2 infected cells. The antiviral activity of the ZnO NPs was reported against influenza virus (H1N1) and herpes simplex virus type 1 [52,56]. The direct antiviral activity of ZnO NPs can be attributed to the nano-size of the ZnO NPs, which enables the NPs to be passively internalized by the cell, together with the ability of ZnO NPs to release Zn2+ ions and reactive oxygen species (ROS) that can damage the lipids, proteins, and nucleic acids of the virus [57,58].

4. Conclusions

Several in silico studies have performed to identify compounds with potential antiviral activity against SARS-CoV-2; however, very limited numbers were biologically validated. This study employed novel computational techniques to carefully shortlist the compounds with potential binding affinity to important SARS-CoV-2 protein targets. Our previously identified Compound 13, which showed significant activity against SARS-CoV-2, was a subject of iterated virtual screening against SARS-CoV-2 Mpro, in addition to R-group enumeration using Ligand Designer and PathFinder tools. The generated derivatives were re-screened against TMPRSS2, in addition to visual inspection leading to the identification of five shared compounds, with compound M3 showing the most binding fit to both enzymes, confirmed by WaterMap analysis and molecular dynamic simulations. The results were validated by in vitro and enzyme inhibition assays, revealing that M3 is a potent anti-SARS-CoV-2 when compared to the parent Compound 13 and other antiviral drugs currently in the clinical trials. Future research studies are planned to overcome the limitations of computational modeling techniques, which may involve in vivo study and validation via crystallography and kinetic studies. The techniques employed in this study are the first, and consequently lead to the discovery of a potent compound, which deserves a careful look, either for further future optimization or clinical studies.

5. Experimental Section

5.1. Material

The compounds used in this study were purchased from https://mcule.com/ (accessed on 3 May 2021), including MCULE-3769246260, MCULE-2110509965, MCULE-8998847154, MCULE-1886473350, and MCULE-7013373725. Assay kits including 3CL Protease (3CLpro), Assay Kit (Cat# 78042-1), furin protease assay kit (Cat # 78040), TMPRSS2 fluorogenic assay kit (Cat# 78083) were purchased from BPS Bioscience, San Diego, CA, USA. ZnO NPs (99+%, 10–30 nm) was purchased from US Research Nanomaterials, Inc, Houston, TX, USA.

5.2. Computational Studies

All computational work was carried on Ubuntu desktop workstation in Intel® Xenon® Gold 6130 CPU @ 2.10 GHz × 64 processors, Quadro P620/PCle/SSE2 graphics card and 134.8 GB RAM on the Maestro graphical user interface of Schrödinger Suite 12.7 available at www.schrodinger.com (accessed on 3 May 2021).

5.2.1. Protein Preparation

The 3D crystal structures of SARS-CoV-2 Mpro (PDB ID: 6LU7) and TMPRSS2 (PDB ID: 2OQ5) enzymes were downloaded from a protein data bank (https://www.rcsb.org/ (accessed on 3 May 2021)). The proteins were prepared and refined using the Protein Preparation Wizard Maestro to ensure structural correctness [59]. Crystallographic water molecules beyond 5Å were removed. All the missing hydrogen atoms were added at pH 7.3 for appropriate ionization and the tautomerization state of amino acid residues and proper bond order were assigned. Next, the refining of the protein structures was performed and the water molecules with <3 hydrogen bonds to non-waters were deleted. Finally, the energy minimization was done using OPLS4 to relieve the steric clashes [60].

5.2.2. Ligand Preparation

The 2D structures of the generated library were converted to 3D structures using LigPrep (Schrodinger) [61]. Hydrogen atoms were added, and the salt ions were removed. The most probable ionization states were calculated at pH 7.3 using the Epik module [62,63]. During the ligand preparation, the specified chirality of the 3D crystal structure was retained. The subsequent energy minimization of each structure was carried out using the OPLS4 force field [60] and was filtered through a relative energy tool to exclude the high energy structures from the given input. Any errors in the ligands were eradicated in order to enhance the accuracy of the molecular docking [64].

5.2.3. Grid Generation

The ligands in the crystal structure of Mpro and TMPRSS2 enzymes were used for grid generation. A grid box was generated at the centroid of the active site for docking studies, and the active site was defined around the ligand crystal structure.

5.2.4. Molecular Docking

Molecular docking was performed within the catalytic pocket site of the proteins using HTVS (high throughput virtual screening) and the standard precision (SP) mode of Grid using Glide [65,66] without applying any constraints. The prepared ligands were docked against grid-generated Mpro (PDB: 6LU7) and TMPRSS2 (PDB ID: 2OQ5) in the SP flexible mode [67]. The DockScore (DSore) representing the affinity of the docked ligands to enzymes was obtained from the project table file of the docked complexes.

5.2.5. Induced Docking Fit (IDF)

IDF is an iterative combination of Glide (docking tool) and Prime (protein structure prediction and refinement). The docking with induced ligand–enzyme relaxation for accurate pose prediction was performed, where the selected ligands, as well as the binding sites, were free to move. Subsequent minimization of the highest-ranked pose was performed. The missing side chains and missing loops were filled using the Prime [68].

5.2.6. Molecular Dynamics Simulation

Molecular dynamics (MD) simulation as a computational tool to monitor the stability and compatibility of the top-ranked ligand-enzyme complexes were performed using Desmond software [69]. The protein was prepared with filling the missing loop and side chains using Prime [68]. Then, the induced docked complex of the compound with protein was used as an initial conformation for MD simulation. The Desmond system builder was used to setup the MD system [70]. The orthorhombic box with periodic boundary conditions was generated with TIP4P solvent model including enzyme-ligand complexes as solute and the system was neutralized by adding suitable number of counter ions. The initial ligand–enzyme complex system was subject to an energy minimization. Simulation was carried out under NPT (constant number of atoms, constant pressure, and constant temperature) ensemble for 100 ns using the MD option of Desmond. Detailed information like protein and ligand root mean square deviation (RMSD) was calculated with respect to the initial frame backbone, root mean square fluctuation (RMSF), and ligand interaction profile were generated from the simulation trajectory of ligand–enzyme complexes. RMSD provides insights into the complex structural conformation throughout the MD simulation. The RMSF indicated the fluctuation along the protein chain.

5.2.7. WaterMap Analysis

WaterMap analysis was employed to predict the profound impact of ligand structural variations on the binding affinity for the target protein [71]. The ligand displayed the hydration solvent that is occupying the binding pocket of the protein [72,73,74], and the WaterMap calculated the thermodynamics properties (dG, Tds, dH) of the hydration site in the binding pocket. The changes in the free energy resulting from displacing the water molecules in the active site can significantly affect the biological activity [75], which helps in understanding the molecular recognition pattern of the protein at the binding site. These were used to rationalize the SAR, drive the potency, and tune the selectivity [71]. WaterMap computed the hydration site properties (location, enthalpy, entropy, and free energy) through a combination of thermodynamic statistical analysis with molecular dynamics and solvent clustering. The MD simulation of the protein solvent without a ligand was run for 2 ns in order to determine the water molecules’ configuration at the binding site. The coordinates of the protein were restrained with 5.0 kcal/mol/Å2 harmonic potential applied to the initial positions of the heavy atoms, which ensures the convergence of the water sampling around the protein conformation. Water from the MD simulation were clustered to form localized hydration sites, and the thermodynamic properties of those sites were computed. The enthalpy was computed as the average nonbonded molecular mechanics interaction energies of the waters at the hydration site with the rest of the system [76]. The entropy was computed by numerically integrating a local expansion of spatial and orientation correlation functions, as described in the inhomogeneous solvation theory [77]. The relevant solvation thermodynamic quantities for the ligand were computed based on the amount of overlap with the hydration sites.

5.2.8. PathFinder R-Group Enumeration

PathFinder is a computationally reaction-based enumeration tool that is used to generate a library of compounds using selected pathways via default or custom reagent libraries. Thus, it provides a facile and efficient tool for the rapid generation of a synthetically tractable library using practical available building blocks of all commercially available chemical reagents [78], and hence it can provide unique structural features required for improved potency, selectivity, and safety of a lead molecule. PathFinder was employed for R-group enumeration and retrosynthetic analysis of the starting hit Compound 13. Maximum depth was set as three to determine the synthetic steps that can be performed, and the maximum number of enumerated libraries were defined. The reaction was performed, while maintaining the core of the active hit and using all the possible reaction routes. In each route, the reagent that contained the core structure was kept, and the other reagents were varied one substitution at a time. The selection of the path that enables the generation of diverse enumerated structures was performed while maintaining the pharmacophoric scaffold.

5.2.9. Ligand Designer

Ligand designer was used to enable relevant options, including a novel grow space to quickly identify the positions where ligand modifications should be. Further, it can be used for the visualization of 3D ligand–protein complexes for the optimum design and evaluation of ligand modifications. Ligand Designer, as an intuitive tool, demonstrated the ability to make a minor modification to the parent ligand in order to increase the potency of the compound. The lead optimization was evaluated with the visual inspection of 3D ligand–protein complex. The Ligand Designer tool analyzed the working places and reorganized the place for space growing. The pharmacophoric features determined the type of modification with favorable interaction for the stability of ligand–protein complex. Thus, it can provide an option for the examination and selection of the best enumerated structures based on multi-parameter optimization (MPO).

5.2.10. R-Group Analysis

R-group mapping analysis was performed in Schrödinger suit. First, the input LigPrep structure with an IC50 value was converted to PIC50 values. The maximum common core was defined with Combi-Glide bond labeling and alignment of the structure for fingerprint similarity of the sidechain to minimize the number of attached R-groups. Heat map analysis displayed the effect of different functional group position with different color ranges, reflecting its pIC50 activity. A QSAR model was generated based on the pharmacophoric features, such as hydrogen bond donor (D), acceptor (A), hydrophobic group (H), negatively ionizable (N), positively ionizable (P), and aromatic ring (R).

5.3. Chemistry

1H NMR spectra were recorded on a Bruker spectrometer at 500 MHz. Chemical shifts were expressed in parts per million (ppm) relative to tetramethylsilane and the values of coupling constant (J) were represented in hertz (Hz). The signals were designated as follows: s, singlet; d, doublet; t, triplet; m, multiplet. Mass spectroscopic data were obtained through electrospray ionization (ESI) mass spectrometry.
M3: 1,2,5-Oxadiazole-3-carboximidic acid, 4,4′-(methylene-di-imino)-bis, bis[[(4-pyridyl)-methylene]-hydrazide. 1H NMR (DMSO-d6) δ: 4.9 (t, 2H, CH2), 7.40 (d, 2H, J= 6.5, ArH), 7.5 (m, 5H, 2ArH, 3NH), 7.62 (t, 2H, NH), 8.40 (d, 3H, J= 8.5, ArH),8.66 (s, 2H, NH), 8.98 (d, 1H, ArH) (Supplementary Figure S1). MS analysis for C19H18N14O2: Calcd mass: 474.14, found (m/z, ES+): 475.26 (Supplementary Figure S2).

5.4. In Vitro Evaluation of Anti-SARS-CoV-2 Activity

The antiviral activity was carried out as previously described [12,79]. Briefly, 2.4 × 10⁴ Vero-E6 cells/well of 96-well tissue culture plates were incubated overnight in Dulbecco’s Modified Eagle’s Medium (DMEM) containing 10% fetal bovine serum (FBS) and 1% penicillin/streptomycin antibiotic mixture in a humidified 37 °C incubator under 5% CO2. The cell monolayers were subjected to SARS-CoV-2 (NRC-03-nhCoV strain, accession # EPI_ISL_430820) viral adsorption and further overlaid with 50 μL DMEM containing varying concentrations of the tested compounds. Following incubation at 37 °C and 5% CO2 for 72 h, the cells were fixed with 100 μL of 4% paraformaldehyde for 20 min and stained with 0.1% crystal violet in distilled water for 15 min at room temperature. The crystal violet dye was then dissolved in 100 μL methanol and the optical density of the obtained color was measured at 570 nm using Anthos Zenyth 200rt plate reader (Anthos Labtec Instruments, Heerhugowaard, Netherlands). The IC50 of the compound was measured using the formula below:
= [ ( O D   t e s t O D   b l a n k ) ÷   ( O D   n e g a t i v e   c o n t r o l O D   b l a n k ) ] × 100

5.5. Cell Viability Assay

The cytotoxic activity was performed using MTT (3-(4, 5-dimethylthiazolyl-2)-2, 5-diphenyltetrazolium bromide) assay according to Soliman et al. (2020) [80,81]. In 96-well plates, normal human dermal fibroblast cell line (HDF, 106-05A, Sigma, EU) were seeded at 4000 cells/100 μL and incubated with the tested compounds for 24 h at 37 °C, and 5% CO2. A 20 µL of sterile-filtered MTT reagent in PBS (5 mg/mL) was added to each well. The developed purple color following the addition of DMSO was measured using Multiskan Go machine (spectrophotometer) at 570 nm. Each experiment was repeated 6 times. The percentage cell viability was calculated following the following formula,
Cell viability   ( % ) = [ ( O D   t e s t O D   b l a n k ) ÷   ( O D   n e g a t i v e   c o n t r o l O D   b l a n k ) ] × 100

5.6. Main Protease (Mpro) Assay

Mpro assay was carried out using 3CL Protease (3CLpro), Untagged (SARS-CoV-2) Assay Kit (CAT # 78042-1, BPS Bioscience, San Diego, CA, USA) according to the supplier’s protocols, following modifications as indicated in our previous publication [12]. The compound, in a total volume 2.5 µL, was incubated with 10 μL Mpro enzyme (1.5 ng/μL) in 384 black flat-bottom well plate. The reaction was performed in a reaction buffer made of 20 mM Tris-HCl pH 7.3, 100 mM NaCl, 1 mM EDTA, 0.01% BSA, and 1 mM 1,4-dithio-D, L-threitol (DTT) and the incubation was performed for 60 min at room temperature with slow shaking. Following incubation, 12.5 µL of 80 mM Mpro substrate (Dabcyl-KTSAVLQSGFRKME-Edans fluorogenic substrate) was added in dark and allowed to incubate for 1 h at room temperature. The fluorescence intensity was measured by a microtiter plate-reader (Synergy H1, Biotek Ltd., Winooski, VT, USA) at emission and excitation wavelengths of 460 and 360 nm, respectively. The inhibition activity of the compound was evaluated at different concentrations (0.003, 0.007, 0.013, 0.026, 0.053, 0.1054, and 0.211 µM), while cysteine protease covalent inhibitor (GC376) was employed as positive control at a concentration 100 µM according to Fu et al. (2020) [82], and the reaction without inhibitor and enzymes was employed as negative control. The inhibitory activity was plotted against the logarithm of inhibitor concentrations to calculate the IC50.

5.7. Furin Protease Assay

Furin protease assay was performed using a furin protease assay kit (Cat # 78040, BPS Bioscience, San Diego, CA, USA) according to the manufacturer’s instructions, following modifications indicated in our previous publication [12]. Initially, 10 µL of the compound at different concentrations (0.007, 0.013, 0.026, 0.053, and 0.1054 µM) was incubated with 50 μL recombinant furin enzyme at 0.5 ng/µL for 30 min at 37 °C in 96 black flat-bottom well plate. Furin protease substrate (40 µL) was then added, and the relative fluorescence value was measured after 1 h with excitation and emission wavelengths 380 and 460 nm, respectively. For positive control, chloro-methyl-ketone at 0.5 µM was employed according to Hoffman et al. (2020) [83], while the reaction without inhibitor was used as negative control.

5.8. TMPRSS2 Fluorogenic Assay

TMPRSS2 fluorogenic assay kit (CAT # 78083, BPS Bioscience, San Diego, CA, USA) was used to evaluate the inhibition activity of the compounds on TMPRSS2 enzyme following the supplier protocol and according to our previous publication [12]. Briefly, 30 µL TMPRSS2 (5 ng/µL) was added to 10 µL of compound at different concentrations (0.007, 0.013, 0.026, 0.053, and 0.1054 µM). Following incubation for 30 min at room temperature, 10 µL of TMPRSS2 substrate (50 µM) was added, and the fluorescence intensity was measured in dark by a microtiter plate-reader (Synergy H1, Biotek Ltd., Winooski, VT, USA) at an emission and excitation wavelengths 383 and 455 nm, respectively. Camostat mesylate (10 µM) was used as a positive control according to Hoffmann et al. (2020) [84], while reaction without inhibitor and enzyme was used as negative control.

5.9. Preparation of Compound-Loaded ZnO Nanoparticles

Loading the compound on ZnO NPs was performed according to Wang et al. (2017) with modifications [85]. Briefly, 25 mg ZnO NPs (99+%, 10–30 nm, US Research Nanomaterials, Inc, Houston, TX, USA) were dispersed in 5 mL distilled water by ultrasonic sonicator bath (Branson, St. Louis, MO, USA) for 5 min, then 3.16 µM of the compound that was dissolved in DMSO was added. The mixture was then stirred for 36 h followed by centrifugation for 20 min at 13,000 rpm. The produced compound-loaded ZnO nanoparticles were washed three times with water and then freeze-dried overnight using a benchtop freeze dryer (Labconco, MO, USA). The amount of compound adsorbed on ZnO NPs was determined by incubating the compound–ZnO NPs with DMSO for 30 min followed by centrifugation for 20 min at 13,000 rpm. The adsorbed amount of the compound was extracted from the compound–ZnO NPs and measured at 330 nm using UV/VIS spectrophotometer (SYNERGY H1, Biotek Ltd., Winooski, VT, USA).
The drug entrapment efficiency (EE) was calculated as follows:
Entrapment efficiency % = (Amount of drug adsorbed/Total amount of drug used) × 100

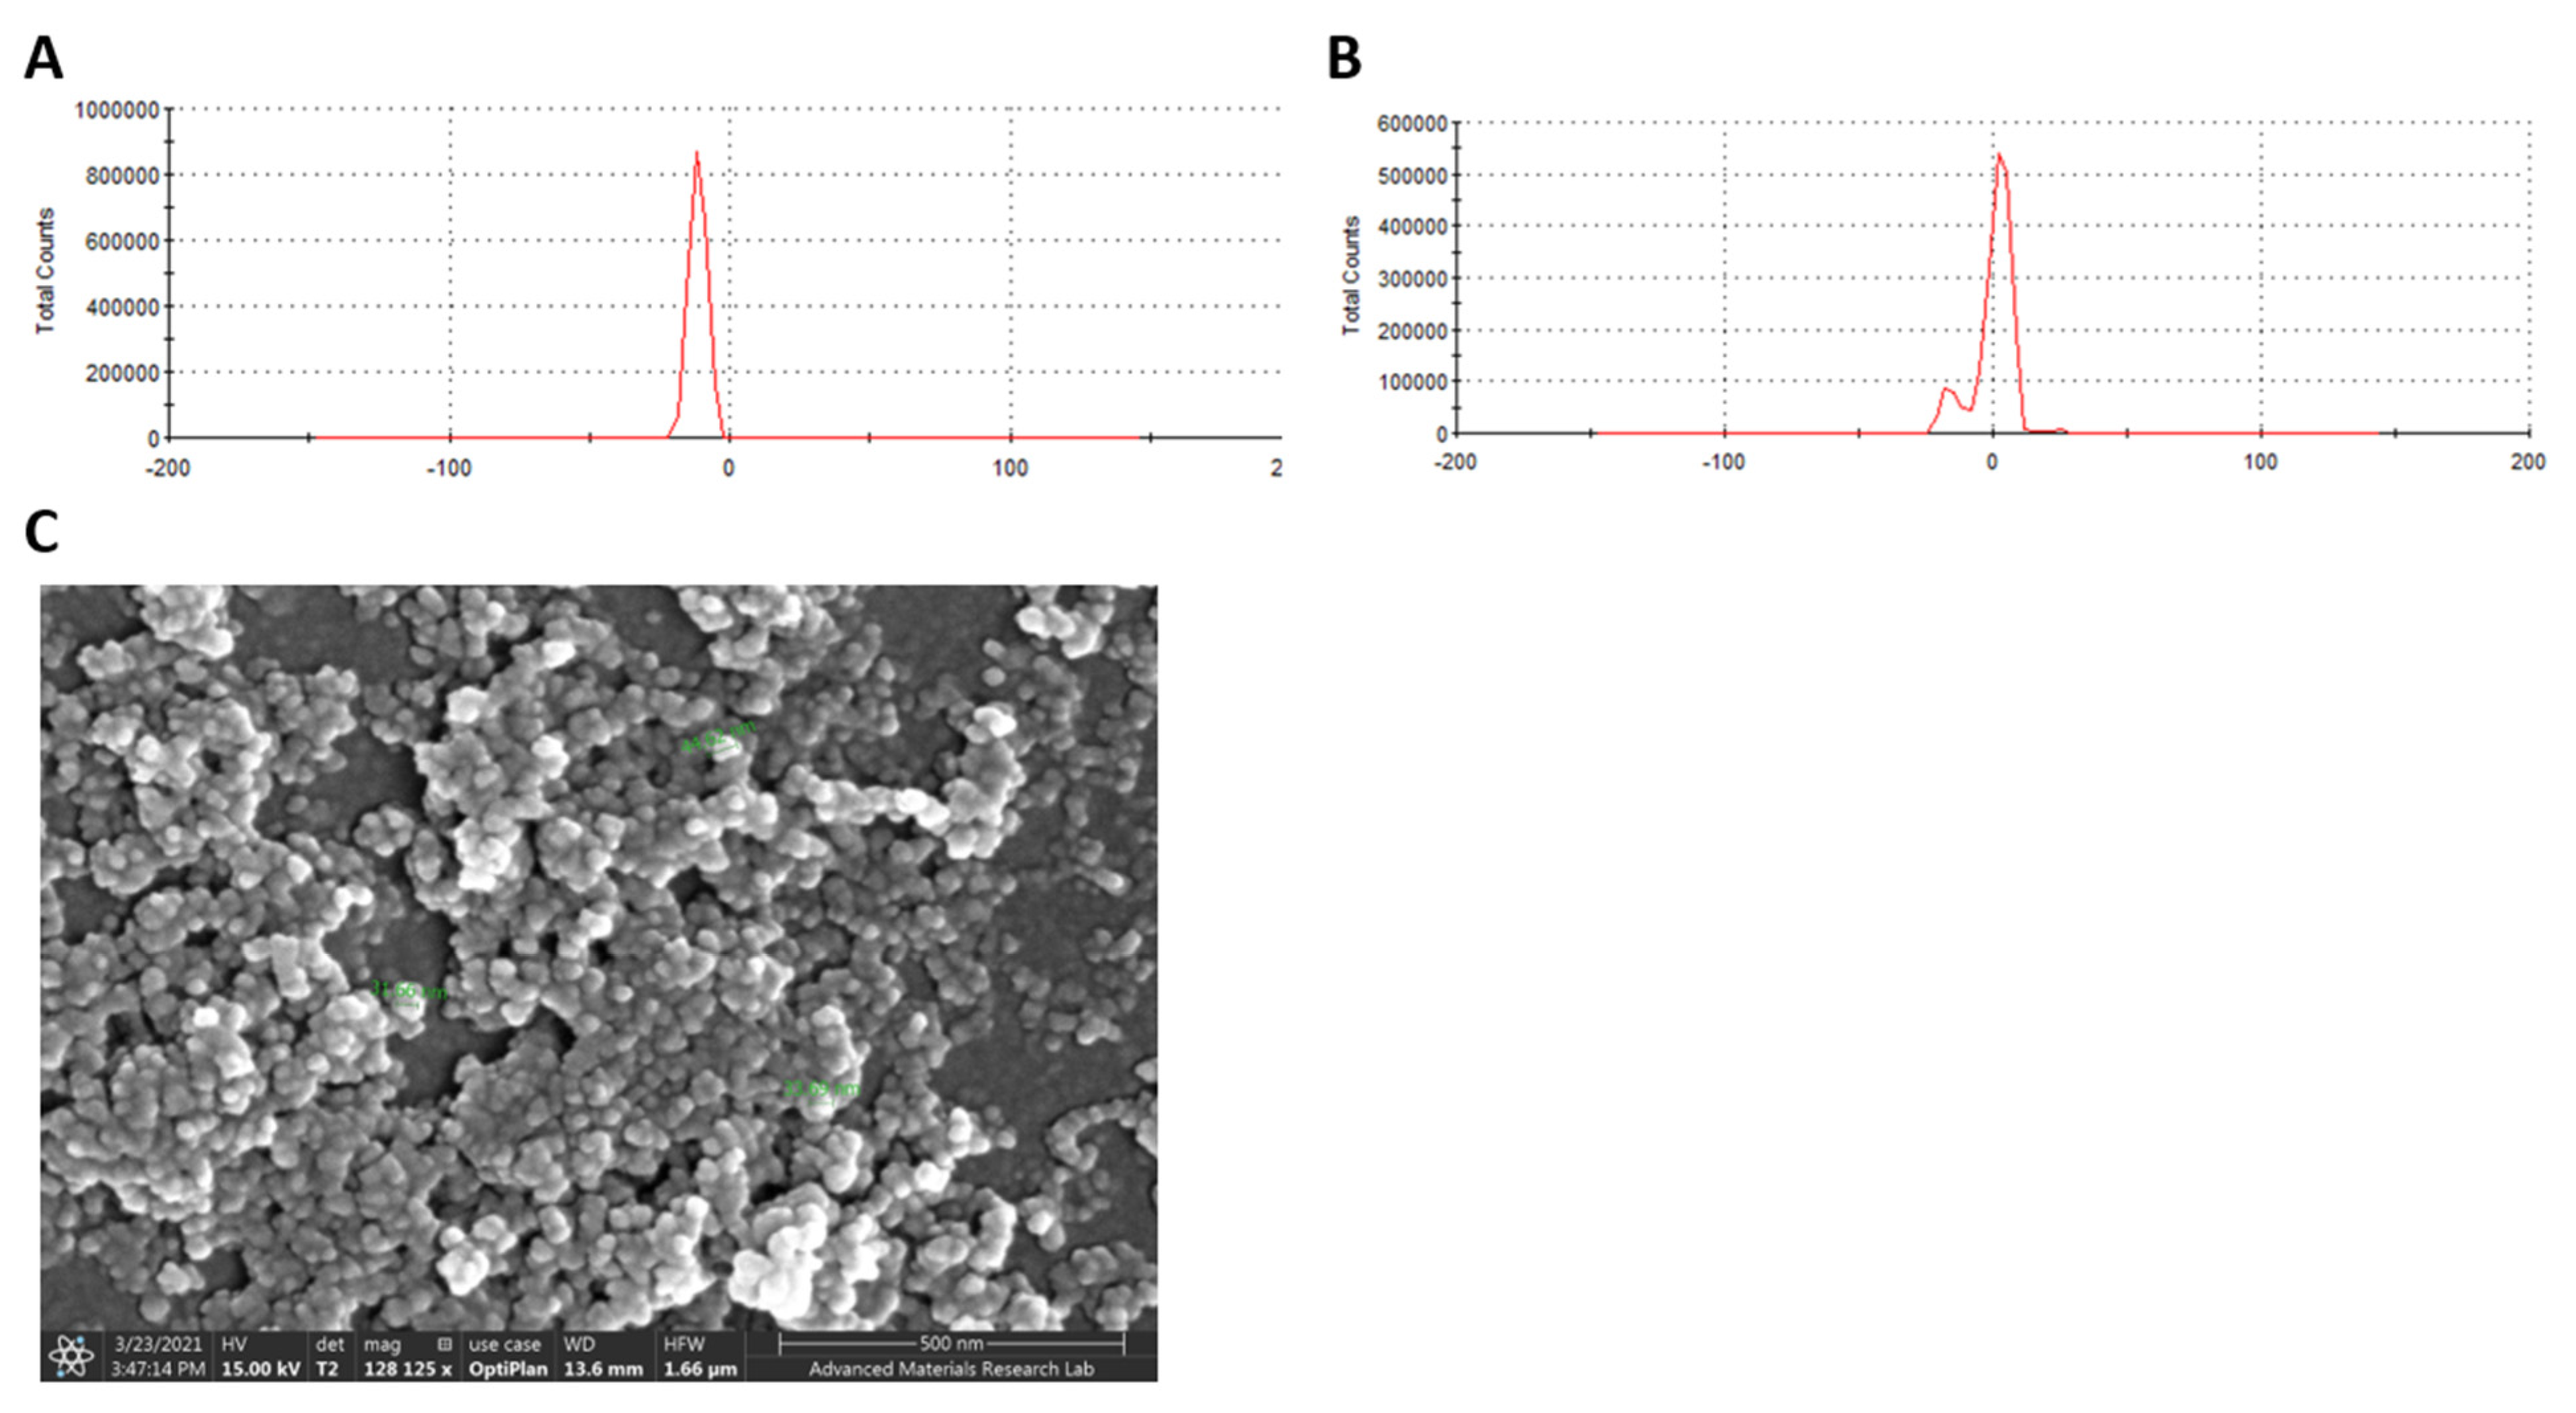
5.10. Characterization of Compound-ZnO Nanoparticles

The zeta-potential of the compound–ZnO NPs were evaluated using Zetasizer (Malvern, Cambridge, UK). NPs were diluted with distilled water and sonicated for 1 h in an ultrasonic sonicator bath (Branson, St. Louis, MO, USA), then the laser doppler velocimetry (LDV) technique was employed to measure the zeta potential (mV). Further, the morphological characteristics of the formed compound–ZnO NPs were examined by a scanning electron microscope (JSM-633OF; JEOL Ltd., Tokyo, Japan). Compound–ZnO NPs samples were initially suspended in distilled water, and then one drop was placed on a clean slide cover and left to dry at room temperature. The dried sample was mounted on carbon tape and sputter-coated with gold. The samples coated with gold were then scanned and photomicrographs were taken at an acceleration voltage of 15 kV. The cell viability and in vitro activity of ZnO NPs and compound–ZnO NPs against SARS-CoV-2 were assessed as mentioned earlier.

5.11. Statistical Analysis

The data were obtained and graphed using GraphPad Prism (8.01, GraphPad Inc., La Jolla, CA, USA). The enzyme inhibition and cytotoxic activities of the compounds were analyzed using one-way analysis of variance (ANOVA) using Bonferroni’s multiple comparisons test. p < 0.05 was considered as significant. The data display the mean ± SEM of 3–6 replicas.

Supplementary Materials

The following are available online at https://www.mdpi.com/article/10.3390/ijms22169057/s1.

Author Contributions

R.H. developed the rationale, conducted the virtual screening and all computational analyses. B.F. ran all enzyme inhibition assays and nanoparticles preparations. A.M., N.M.A.S. and S.H.M. conducted the in vitro study. C.H.M. and Y.N. helped with molecular dynamic and WaterMap analysis. S.S.M.S. supervised the project, obtained the funds, and helped with the rational and project design. R.H., B.F. and S.S.M.S. analyzed and interpreted the data and wrote the first draft and the final version. All authors have read and agreed to the published version of the manuscript.

Funding

The authors acknowledge the generous funding from Sandooq Al-Watan and University of Sharjah to SS under grant #133006 (01/09/2020).

Acknowledgments

The authors acknowledge the technical support provided by Pritesh Bhat, Principal Scientist, Schrödinger, India.

Conflicts of Interest

The authors declare no conflict of interest.

Abbreviations

A; hydrogen bond acceptor, 3CLpro; 3CL-Protease, BSA; bovine serum albumin, CC50; 50% cytotoxic concentration, CDC; Center for Disease Control and Prevention, COVID-19; coronavirus disease-2019, dG; differential Gibbs free energy, DMEM; Dulbecco’s Modified Eagle’s Medium, DMSO; dimethyl sulfoxide, DTT; dithiothreitol, EDTA; ethylene diamine tetra-acetic acid, EE; entrapment efficiency, EUA; emergency use authorization, FDA; Food and Drug Administration, FBS; fetal bovine serum, H; hydrophobic group, H-bond; hydrogen bond, HBA; hydrogen bond acceptor, HDF; human dermal fibroblast, HIV; human immunodeficiency virus, H1N1; influenza virus, HTVS; high throughput virtual screening, IC50; 50% inhibitory concentration, Ligprep; ligand preparation, LDV; laser doppler velocimetry, MD; molecular dynamics, Mpro; main protease, MTT; 3-(4,5-dimethylthiazol-2-yl)-2,5 diphenyl tetrazolium bromide, N; negatively ionizable, NPT; constant number of atoms, constant pressure, and constant temperature, P; positively ionizable, PAINS; pan-assay interference compounds, PBS; phosphate buffered saline, PDB; protein data bank, PLpro; papain-like protease, QSAR; quantitative structure–activity relationship, RCSB; Research Collaboratory for Structural Bioinformatics, R; aromatic ring, RdRp; RNA-dependent RNA polymerase, ROS; reactive oxygen species, RMSD; Root mean square deviation, RMSF; Root mean square fluctuation, SAR; structure–activity relationships, SARS-CoV-2; severe acute respiratory syndrome coronavirus 2, SI; selectivity index, SP; standard precision, TMPRSS2; human transmembrane serine protease 2, WHO; World Health Organization, ZnO NPs; zinc oxide nanoparticles.

References

  1. Lai, C.C.; Shih, T.P.; Ko, W.C.; Tang, H.J.; Hsueh, P.R. Severe acute respiratory syndrome coronavirus 2 (SARS-CoV-2) and coronavirus disease-2019 (COVID-19): The epidemic and the challenges. Int. J. Antimicrob. Agents 2020, 55, 105924. [Google Scholar] [CrossRef]
  2. Forni, G.; Mantovani, A. COVID-19 vaccines: Where we stand and challenges ahead. Cell Death Differ. 2021, 28, 626–639. [Google Scholar] [CrossRef] [PubMed]
  3. Kyriakidis, N.C.; López-Cortés, A.; González, E.V.; Grimaldos, A.B.; Prado, E.O. SARS-CoV-2 vaccines strategies: A comprehensive review of phase 3 candidates. NPJ Vaccines 2021, 6, 1–17. [Google Scholar] [CrossRef]
  4. Kunzelmann, K. Getting hands on a drug for Covid-19: Inhaled and intranasal niclosamide. Lancet Reg. Health Eur. 2021, 4, 100094. [Google Scholar] [CrossRef] [PubMed]
  5. Sacco, M.D.; Ma, C.; Lagarias, P.; Gao, A.; Townsend, J.A.; Meng, X.; Dube, P.; Zhang, X.; Hu, Y.; Kitamura, N.; et al. Structure and inhibition of the SARS-CoV-2 main protease reveal strategy for developing dual inhibitors against Mpro and cathepsin L. Sci. Adv. 2020, 6, eabe0751. [Google Scholar] [CrossRef] [PubMed]
  6. Wang, Y.; Zhang, D.; Du, G.; Du, R.; Zhao, J.; Jin, Y.; Fu, S.; Gao, L.; Cheng, Z.; Lu, Q.; et al. Remdesivir in adults with severe COVID-19: A randomised, double-blind, placebo-controlled, multicentre trial. Lancet 2020, 395, 1569–1578. [Google Scholar] [CrossRef]
  7. Good, S.S.; Westover, J.; Jung, K.H.; Zhou, X.J.; Moussa, A.; La Colla, P.; Collu, G.; Canard, B.; Sommadossi, J.P. AT-527, a double prodrug of a guanosine nucleotide analog, is a potent inhibitor of SARS-CoV-2 in vitro and a promising oral antiviral for treatment of COVID-19. Antimicrob. Agents Chemother. 2021, 65, e02479-20. [Google Scholar] [CrossRef]
  8. Driouich, J.S.; Cochin, M.; Lingas, G.; Moureau, G.; Touret, F.; Petit, P.R.; Piorkowski, G.; Barthélémy, K.; Laprie, C.; Coutard, B.; et al. Favipiravir antiviral efficacy against SARS-CoV-2 in a hamster model. Nat. Commun. 2021, 12, 1–13. [Google Scholar] [CrossRef]
  9. Wahl, A.; Gralinski, L.E.; Johnson, C.E.; Yao, W.; Kovarova, M.; Dinnon, K.H.; Liu, H.; Madden, V.J.; Krzystek, H.M.; De, C.; et al. SARS-CoV-2 infection is effectively treated and prevented by EIDD-2801. Nature 2021, 591, 451–457. [Google Scholar] [CrossRef]
  10. Vandyck, K.; Deval, J. Considerations for the discovery and development of 3-chymotrypsin-like cysteine protease inhibitors targeting SARS-CoV-2 infection. Curr. Opin. Virol. 2021, 49, 36–40. [Google Scholar] [CrossRef]
  11. Fontanet, A.; Autran, B.; Lina, B.; Kieny, M.P.; Karim, S.S.A.; Sridhar, D. SARS-CoV-2 variants and ending the COVID-19 pandemic. Lancet 2021, 397, 952–954. [Google Scholar] [CrossRef]
  12. Elseginy, S.A.; Fayed, B.; Hamdy, R.; Mahrous, N.; Mostafa, A.; Almehdi, A.M.; Soliman, S.S. Promising anti-SARS-CoV-2 drugs by effective dual targeting against the viral and host proteases. Bioorganic Med. Chem. Lett. 2021, 43, 128099. [Google Scholar] [CrossRef]
  13. Jiang, J.; Pi, J.; Cai, J. The advancing of zinc oxide nanoparticles for biomedical applications. Bioinorg. Chem. Appl. 2018, 2018, 1–18. [Google Scholar] [CrossRef] [PubMed]
  14. Chowdhary, M.; Patel, K.R.; Danish, H.H.; Lawson, D.H.; Khan, M.K. BRAF inhibitors and radiotherapy for melanoma brain metastases: Potential advantages and disadvantages of combination therapy. OncoTargets Ther. 2016, 9, 7149. [Google Scholar] [CrossRef] [Green Version]
  15. Gradman, A.H.; Basile, J.N.; Carter, B.L.; Bakris, G.L. Combination therapy in hypertension. J. Am. Soc. Hypertens. 2010, 4, 90–98. [Google Scholar] [CrossRef] [PubMed]
  16. Liu, Z.; Li, X.; Wu, X.; Zhu, C. A dual-inhibitor system for the effective antifibrillation of Aβ40 peptides by biodegradable EGCG–Fe(iii)/PVP nanoparticles. J. Mater. Chem. B 2019, 7, 1292–1299. [Google Scholar] [CrossRef]
  17. Chen, K.; Tan, Z.; He, M.; Li, J.; Tang, S.; Hewlett, I.; Yu, F.; Jin, Y.; Yang, M. Structure-activity relationships (SAR) research of thiourea derivatives as dual inhibitors targeting both HIV-1 capsid and human cyclophilin A. Chem. Biol. Drug Des. 2010, 76, 25–33. [Google Scholar] [CrossRef] [PubMed]
  18. Wu, C.; Wu, K.-J.; Liu, J.-B.; Zhou, X.-M.; Leung, C.-H.; Ma, D.-L. A dual-functional molecular strategy for in situ suppressing and visualizing of neuraminidase in aqueous solution using iridium (iii) complexes. Chem. Commun. 2019, 55, 6353–6356. [Google Scholar] [CrossRef] [PubMed]
  19. Gadde, S. Multi-drug delivery nanocarriers for combination therapy. MedChemComm 2015, 6, 1916–1929. [Google Scholar] [CrossRef]
  20. World Health Organization. WHO Coronavirus Disease (COVID-19) Dashboard. 2021. Available online: https://covid19.who.int/ (accessed on 16 January 2021).
  21. Hung, H.C.; Ke, Y.Y.; Huang, S.Y.; Huang, P.N.; Kung, Y.A.; Chang, T.Y.; Yen, K.J.; Peng, T.T.; Chang, S.E.; Huang, C.T.; et al. Discovery of M protease inhibitors encoded by SARS-CoV-2. Antimicrob. Agents Chemother. 2020, 64, e00872-20. [Google Scholar] [CrossRef] [PubMed]
  22. Corum, J.; Grady, D.; Wee, S.-L.; Zimmer, C. Coronavirus vaccine tracker. The New York Times, 15 April 2020. [Google Scholar]
  23. Mbunge, E.; Akinnuwesi, B.; Fashoto, S.G.; Metfula, A.S.; Mashwama, P. A critical review of emerging technologies for tackling COVID-19 pandemic. Hum. Behav. Emerg. 2021, 3, 25–39. [Google Scholar] [CrossRef] [PubMed]
  24. Belayneh, A. Off-label use of chloroquine and hydroxychloroquine for COVID-19 treatment in Africa against WHO recommendation. Res. Rep. Trop. Med. 2020, 11, 61. [Google Scholar] [CrossRef] [PubMed]
  25. Eastman, R.T.; Roth, J.S.; Brimacombe, K.R.; Simeonov, A.; Shen, M.; Patnaik, S.; Hall, M.D. Remdesivir: A review of its discovery and development leading to emergency use authorization for treatment of COVID-19. ACS Cent. Sci. 2020, 6, 672–683. [Google Scholar] [CrossRef]
  26. Cai, Q.; Yang, M.; Liu, D.; Chen, J.; Shu, D.; Xia, J.; Liao, X.; Gu, Y.; Cai, Q.; Yang, Y. Experimental treatment with favipiravir for COVID-19: An open-label control study. Engineering 2020, 6, 1192–1198. [Google Scholar] [CrossRef]
  27. Horby, P.W.; Mafham, M.; Bell, J.L.; Linsell, L.; Staplin, N.; Emberson, J.; Palfreeman, A.; Raw, J.; Elmahi, E.; Prudon, B. Lopinavir–ritonavir in patients admitted to hospital with COVID-19 (RECOVERY): A randomised, controlled, open-label, platform trial. The Lancet 2020, 396, 1345–1352. [Google Scholar] [CrossRef]
  28. Ganesh, R.; Philpot, L.M.; Bierle, D.M.; Anderson, R.J.; Arndt, L.L.; Arndt, R.F.; Culbertson, T.L.; Destro Borgen, M.J.; Hanson, S.N.; Kennedy, B.D. Real-World Clinical Outcomes of Bamlanivimab and Casirivimab-Imdevimab among High-Risk Patients with Mild to Moderate Coronavirus Disease 2019. J. Infect. Dis. 2021, jiab377. [Google Scholar] [CrossRef]
  29. Orders, M. An EUA for Bamlanivimab and Etesevimab for COVID-19. Med. Lett. Drugs Ther. 2021, 63, 49. [Google Scholar]
  30. Orders, M. An EUA for Sotrovimab for Treatment of COVID-19. Med. Lett. Drugs Ther. 2021, 63, 97. [Google Scholar]
  31. Ramos-Guzmán, C.A.; Ruiz-Pernía, J.J.; Tuñón, I. Computational simulations on the binding and reactivity of a nitrile inhibitor of the SARS-CoV-2 main protease. ChemComm 2021. [Google Scholar] [CrossRef]
  32. Choudhary, S.; Malik, Y.S.; Tomar, S. Identification of SARS-CoV-2 cell entry inhibitors by drug repurposing using in silico structure-based virtual screening approach. Front. Immunol. 2020, 11, 1664. [Google Scholar] [CrossRef]
  33. Ke, Z.; Oton, J.; Qu, K.; Cortese, M.; Zila, V.; McKeane, L.; Nakane, T.; Zivanov, J.; Neufeldt, C.J.; Cerikan, B. Structures and distributions of SARS-CoV-2 spike proteins on intact virions. Nature 2020, 588, 498–502. [Google Scholar] [CrossRef] [PubMed]
  34. Jaiswal, G.; Kumar, V. In-silico design of a potential inhibitor of SARS-CoV-2 S protein. PLoS ONE 2020, 15, e0240004. [Google Scholar] [CrossRef]
  35. Teli, D.M.; Shah, M.B.; Chhabria, M.T. In silico screening of natural compounds as potential inhibitors of SARS-CoV-2 main protease and spike RBD: Targets for COVID-19. Front. Mol. Biosci. 2020, 7, 429. [Google Scholar]
  36. Wei, T.Z.; Wang, H.; Wu, X.Q.; Lu, Y.; Guan, S.H.; Dong, F.Q.; Zhu, G.L.; Bao, Y.Z.; Zhang, J.; Wang, G.Y.; et al. In silico screening of potential spike glycoprotein inhibitors of SARS-CoV-2 with drug repurposing strategy. Chin. J. Integr. Med. 2020, 26, 663–669. [Google Scholar] [CrossRef]
  37. Wang, M.; Cao, R.; Zhang, L.; Yang, X.; Liu, J.; Xu, M.; Shi, Z.; Hu, Z.; Zhong, W.; Xiao, G. Remdesivir and chloroquine effectively inhibit the recently emerged novel coronavirus (2019-nCoV) in vitro. Cell Res. 2020, 30, 269–271. [Google Scholar] [CrossRef]
  38. Jeon, S.; Ko, M.; Lee, J.; Choi, I.; Byun, S.Y.; Park, S.; Shum, D.; Kim, S. Identification of antiviral drug candidates against SARS-CoV-2 from FDA-approved drugs. Antimicrob. Agents Chemother. 2020, 64, e00819-20. [Google Scholar] [CrossRef]
  39. Murgolo, N.; Therien, A.G.; Howell, B.; Klein, D.; Koeplinger, K.; Lieberman, L.A.; Adam, G.C.; Flynn, J.; McKenna, P.; Swaminathan, G.; et al. SARS-CoV-2 tropism, entry, replication, and propagation: Considerations for drug discovery and development. PLoS Pathog. 2021, 17, e1009225. [Google Scholar] [CrossRef] [PubMed]
  40. Abdool Karim, S.S.; de Oliveira, T. New SARS-CoV-2 variants—Clinical, public health, and vaccine implications. N. Eng. J. Med. 2021, 384, 1866–1868. [Google Scholar] [CrossRef] [PubMed]
  41. Bestle, D.; Heindl, M.R.; Limburg, H.; Pilgram, O.; Moulton, H.; Stein, D.A.; Hardes, K.; Eickmann, M.; Dolnik, O.; Rohde, C.; et al. TMPRSS2 and furin are both essential for proteolytic activation of SARS-CoV-2 in human airway cells. Life Sci. Alliance 2020, 3, e202000786. [Google Scholar] [CrossRef] [PubMed]
  42. Adedeji, A.O.; Sarafianos, S.G. Antiviral drugs specific for coronaviruses in preclinical development. Curr. Opin. Virol. 2014, 8, 45–53. [Google Scholar] [CrossRef] [PubMed]
  43. Jena, N.R. Drug targets, mechanisms of drug action, and therapeutics against SARS-CoV-2. Chem. Phys. Impact 2021, 2, 100011. [Google Scholar] [CrossRef]
  44. Ma, C.; Sacco, M.D.; Hurst, B.; Townsend, J.A.; Hu, Y.; Szeto, T.; Zhang, X.; Tarbet, B.; Marty, M.T.; Chen, Y.; et al. Boceprevir, GC-376, and calpain inhibitors II, XII inhibit SARS-CoV-2 viral replication by targeting the viral main protease. Cell Res. 2020, 30, 678–692. [Google Scholar] [CrossRef]
  45. Li, Z.; Li, X.; Huang, Y.Y.; Wu, Y.; Liu, R.; Zhou, L.; Lin, Y.; Wu, D.; Zhang, L.; Liu, H.; et al. Identify potent SARS-CoV-2 main protease inhibitors via accelerated free energy perturbation-based virtual screening of existing drugs. Proc. Natl. Acad. Sci. USA 2020, 117, 27381–27387. [Google Scholar] [CrossRef]
  46. Wang, K.Y.; Liu, F.; Jiang, R.; Yang, X.; You, T.; Liu, X.; Xiao, C.Q.; Shi, Z.; Jiang, H.; Rao, Z.; et al. Structure of Mpro from COVID-19 virus and discovery of its inhibitors. Nature 2020, 289–293. [Google Scholar]
  47. Kumar, V.; Dhanjal, J.K.; Bhargava, P.; Kaul, A.; Wang, J.; Zhang, H.; Kaul, S.C.; Wadhwa, R.; Sundar, D. Withanone and Withaferin-A are predicted to interact with transmembrane protease serine 2 (TMPRSS2) and block entry of SARS-CoV-2 into cells. J. Biomol. Struct. Dyn. 2020, 1–13. [Google Scholar] [CrossRef]
  48. Dai, W.; Zhang, B.; Jiang, X.M.; Su, H.; Li, J.; Zhao, Y.; Xie, X.; Jin, Z.; Peng, J.; Liu, F.; et al. Structure-based design of antiviral drug candidates targeting the SARS-CoV-2 main protease. Science 2020, 368, 1331–1335. [Google Scholar] [CrossRef] [Green Version]
  49. Zhang, Y.; Nayak, T.R.; Hong, H.; Cai, W. Biomedical applications of zinc oxide nanomaterials. Curr. Mol. Med. 2013, 13, 1633–1645. [Google Scholar] [CrossRef] [PubMed] [Green Version]
  50. Dhivya, R.; Ranjani, J.; Rajendhran, J.; Mayandi, J.; Annaraj, J. Enhancing the anti-gastric cancer activity of curcumin with biocompatible and pH sensitive PMMA-AA/ZnO nanoparticles. Mater. Sci. Eng. 2018, 82, 182–189. [Google Scholar] [CrossRef]
  51. El-Megharbel, S.M.; Alsawat, M.; Al-Salmi, F.A.; Hamza, R.Z. Utilizing of (zinc oxide nano-spray) for disinfection against “SARS-CoV-2” and testing its biological effectiveness on some biochemical parameters during (COVID-19 pandemic)—“ZnO nanoparticles have antiviral activity against (SARS-CoV-2)”. Mater. Sci. 2021, 11, 388. [Google Scholar]
  52. Tavakoli, A.; Ataei-Pirkooh, A.; Sadeghi, G.M.; Bokharaei-Salim, F.; Sahrapour, P.; Kiani, S.J.; Moghoofei, M.; Farahmand, M.; Javanmard, D.; Monavari, S.H. Polyethylene glycol-coated zinc oxide nanoparticle: An efficient nanoweapon to fight against herpes simplex virus type 1. Nanomedicine 2018, 13, 2675–2690. [Google Scholar] [CrossRef] [PubMed]
  53. Anders, C.B.; Chess, J.J.; Wingett, D.G.; Punnoose, A. Serum proteins enhance dispersion stability and influence the cytotoxicity and dosimetry of ZnO nanoparticles in suspension and adherent cancer cell models. Nanoscale Res. Lett. 2015, 10, 1–22. [Google Scholar] [CrossRef] [PubMed] [Green Version]
  54. Taratula, O.; Galoppini, E.; Wang, D.; Chu, D.; Zhang, Z.; Chen, H.; Saraf, G.; Lu, Y. Binding studies of molecular linkers to ZnO and MgZnO nanotip films. J. Phys. Chem. B 2006, 110, 6506–6515. [Google Scholar] [CrossRef]
  55. Hariharan, R.; Senthilkumar, S.; Suganthi, A.; Rajarajan, M. Synthesis and characterization of doxorubicin modified ZnO/PEG nanomaterials and its photodynamic action. J. Photochem. Photobiol. B Biol. 2012, 116, 56–65. [Google Scholar] [CrossRef] [PubMed]
  56. Ghaffari, H.; Tavakoli, A.; Moradi, A.; Tabarraei, A.; Bokharaei-Salim, F.; Zahmatkeshan, M.; Farahmand, M.; Javanmard, D.; Kiani, S.J.; Esghaei, M.; et al. Inhibition of H1N1 influenza virus infection by zinc oxide nanoparticles: Another emerging application of nanomedicine. J. Biomed. Sci. 2019, 26, 1–10. [Google Scholar] [CrossRef] [PubMed]
  57. Rosa, S.; Connolly, C.; Schettino, G.; Butterworth, K.T.; Prise, K.M. Biological mechanisms of gold nanoparticle radiosensitization. Cancer Nanotechnol. 2017, 8, 1–25. [Google Scholar] [CrossRef] [PubMed] [Green Version]
  58. Siddiqi, K.S.; Rahman, A.U.; Husen, A. Properties of zinc oxide nanoparticles and their activity against microbes. Nanoscale Res. Lett. 2018, 13, 1–13. [Google Scholar] [CrossRef] [PubMed]
  59. Sastry, G.M.; Adzhigirey, M.; Day, T.; Annabhimoju, R.; Sherman, W. Protein and ligand preparation: Parameters, protocols, and influence on virtual screening enrichments. J. Comput. Mol. Des. 2013, 27, 221–234. [Google Scholar] [CrossRef]
  60. Harder, E.; Damm, W.; Maple, J.R.; Wu, C.; Reboul, M.; Xiang, J.Y.; Wang, L.; Lupyan, D.; Dahlgren, M.K.; Knight, J.L.; et al. OPLS3: A force field providing broad coverage of drug-like small molecules and proteins. J. Chem. Theory Comput. 2016, 12, 281–296. [Google Scholar] [CrossRef]
  61. Giardina, S.F.; Werner, D.S.; Pingle, M.; Feinberg, P.B.; Foreman, K.W.; Bergstrom, D.E.; Arnold, L.D.; Barany, F. Novel, self-assembling dimeric inhibitors of human β tryptase. J. Med. Chem. 2020, 63, 3004–3027. [Google Scholar] [CrossRef]
  62. Shelley, J.C.; Cholleti, A.; Frye, L.L.; Greenwood, J.R.; Timlin, M.R.; Uchimaya, M. Epik: A software program for pK a prediction and protonation state generation for drug-like molecules. J. Comput. Mol. Des. 2007, 21, 681–691. [Google Scholar] [CrossRef]
  63. Greenwood, J.R.; Calkins, D.; Sullivan, A.; Shelley, J.C. Towards the comprehensive, rapid, and accurate prediction of the favorable tautomeric states of drug-like molecules in aqueous solution. J. Comput. Mol. Des. 2010, 24, 591–604. [Google Scholar] [CrossRef]
  64. Ganai, S.A.; Abdullah, E.; Rashid, R.; Altaf, M. Combinatorial in silico strategy towards identifying potential hotspots during inhibition of structurally identical HDAC1 and HDAC2 enzymes for effective chemotherapy against neurological disorders. Front. Mol. Neurosci. 2017, 10, 357. [Google Scholar] [CrossRef]
  65. Halgren, T.A.; Murphy, R.B.; Friesner, R.A.; Beard, H.S.; Frye, L.L.; Pollard, W.T.; Banks, J.L. Glide: A new approach for rapid, accurate docking and scoring. 2. Enrichment factors in database screening. J. Med. Chem. 2004, 47, 1750–1759. [Google Scholar] [CrossRef] [PubMed]
  66. Friesner, R.A.; Banks, J.L.; Murphy, R.B.; Halgren, T.A.; Klicic, J.J.; Mainz, D.T.; Repasky, M.P.; Knoll, E.H.; Shelley, M.; Perry, J.K.; et al. Glide: A new approach for rapid, accurate docking and scoring. 1. Method and assessment of docking accuracy. J. Med. Chem. 2004, 47, 1739–1749. [Google Scholar] [CrossRef]
  67. Friesner, R.A.; Murphy, R.B.; Repasky, M.P.; Frye, L.L.; Greenwood, J.R.; Halgren, T.A.; Sanschagrin, P.C.; Mainz, D.T. Extra precision glide: Docking and scoring incorporating a model of hydrophobic enclosure for protein-ligand complexes. J. Med. Chem. 2006, 49, 6177–6196. [Google Scholar] [CrossRef] [PubMed] [Green Version]
  68. Jacobson, M.P.; Pincus, D.L.; Rapp, C.S.; Day, T.J.F.; Honig, B.; Shaw, D.E.; Friesner, R.A. A hierarchical approach to all-atom protein loop prediction. Proteins Struct. Funct. Bioinform. 2004, 55, 351–367. [Google Scholar] [CrossRef] [PubMed] [Green Version]
  69. Chow, E.; Rendleman, C.A.; Bowers, K.J.; Dror, R.O.; Hughes, D.H.; Gullingsrud, J.; Sacerdoti, F.D.; Shaw, D.E. Desmond Performance on a Cluster of Multicore Processors, D. E. Shaw Research Technical Report DESRES/TR--2008-01; D. E. Shaw: New York, NY, USA, 2008. [Google Scholar]
  70. Zeiske, T.; Stafford, K.; Friesner, R.A.; Palmer, A.G. Starting-structure dependence of nanosecond timescale intersubstate transitions and reproducibility of MD-derived order parameters. Proteins Struct. Funct. Bioinform. 2013, 81, 499–509. [Google Scholar] [CrossRef] [PubMed] [Green Version]
  71. Pearlstein, R.A.; Sherman, W.; Abel, R. Contributions of water transfer energy to protein-ligand association and dissociation barriers: Watermap analysis of a series of p38α MAP kinase inhibitors. Proteins Struct. Funct. Bioinform. 2013, 81, 1509–1526. [Google Scholar] [CrossRef]
  72. Cappel, D.; Sherman, W.; Beuming, T. Calculating water thermodynamics in the binding site of proteins—Applications of WaterMap to drug discovery. Curr. Top. Med. Chem. 2017, 17, 2586–2598. [Google Scholar] [CrossRef]
  73. Abel, R.; Young, T.; Farid, R.; Berne, B.J.; Friesner, R.A. Role of the active-site solvent in the thermodynamics of factor Xa ligand binding. J. Am. Chem. Soc. 2008, 130, 2817–2831. [Google Scholar] [CrossRef] [Green Version]
  74. Young, T.; Abel, R.; Kim, B.; Berne, B.J.; Friesner, R.A. Motifs for molecular recognition exploiting hydrophobic enclosure in protein-ligand binding. Proc. Natl. Acad. Sci. USA 2007, 104, 808–813. [Google Scholar] [CrossRef] [Green Version]
  75. Horbert, R.; Pinchuk, B.; Johannes, E.; Schlosser, J.; Schmidt, D.; Cappel, D.; Totzke, F.; Schächtele, C.; Peifer, C. Optimization of potent DFG-in inhibitors of platelet derived growth factor receptorβ (PDGF-Rβ) guided by water thermodynamics. J. Med. Chem. 2014, 58, 170–182. [Google Scholar] [CrossRef]
  76. Lazaridis, T. Inhomogeneous fluid approach to solvation thermodynamics. 1. Theory. J. Phys. Chem. B 1998, 102, 3531–3541. [Google Scholar] [CrossRef]
  77. Lazaridis, T. Inhomogeneous fluid approach to solvation thermodynamics. 2. Applications to simple fluids. J. Phys. Chem. B 1998, 102, 3542–3550. [Google Scholar] [CrossRef]
  78. Konze, K.D.; Bos, P.H.; Dahlgren, M.K.; Leswing, K.; Tubert-Brohman, I.; Bortolato, A.; Robbason, B.; Abel, R.; Bhat, S. Reaction-based enumeration, active learning, and free energy calculations to rapidly explore synthetically tractable chemical space and optimize potency of cyclin-dependent kinase 2 inhibitors. J. Chem. Inf. Model. 2019, 59, 3782–3793. [Google Scholar] [CrossRef]
  79. Mostafa, A.; Kandeil, A.; Elshaier, Y.A.M.M.; Kutkat, O.; Moatasim, Y.; Rashad, A.A.; Shehata, M.; Gomaa, M.R.; Mahrous, N.; Mahmoud, S.H.; et al. FDA-approved drugs with potent in vitro antiviral activity against severe acute respiratory syndrome coronavirus 2. Pharmaceuticals 2020, 13, 443. [Google Scholar] [CrossRef]
  80. Soliman, S.S.M.; Alhamidi, T.B.; Abdin, S.; Almehdi, A.M.; Semreen, M.H.; Alhumaidi, R.B.; Shakartalla, S.B.; Haider, M.; Husseiny, M.I.; Omar, H.A. Effective targeting of breast cancer cells (MCF7) via novel biogenic synthesis of gold nanoparticles using cancer-derived metabolites. PLoS ONE 2020, 15, e0240156. [Google Scholar] [CrossRef] [PubMed]
  81. Soliman, S.S.M.; Saeed, B.Q.; Elseginy, S.A.; Al-Marzooq, F.; Ahmady, I.M.; El-Keblawy, A.A.; Hamdy, R. Critical discovery and synthesis of novel antibacterial and resistance-modifying agents inspired by plant phytochemical defense mechanisms. Chem. Biol. Interact. 2020, 333, 109318. [Google Scholar] [CrossRef] [PubMed]
  82. Fu, L.; Ye, F.; Feng, Y.; Yu, F.; Wang, Q.; Wu, Y.; Zhao, C.; Sun, H.; Huang, B.; Niu, P.; et al. Both Boceprevir and GC376 efficaciously inhibit SARS-CoV-2 by targeting its main protease. Nat. Commun. 2020, 11, 4417. [Google Scholar] [CrossRef] [PubMed]
  83. Hoffman, R.L.; Kania, R.S.; Brothers, M.A.; Davies, J.F.; Ferre, R.A.; Gajiwala, K.S.; He, M.; Hogan, R.J.; Kozminski, K.; Li, L.Y.; et al. Discovery of ketone-based covalent inhibitors of coronavirus 3CL proteases for the potential therapeutic treatment of COVID-19. J. Med. Chem. 2020, 63, 12725–12747. [Google Scholar] [CrossRef] [PubMed]
  84. Hoffmann, M.; Kleine-Weber, H.; Schroeder, S.; Krüger, N.; Herrler, T.; Erichsen, S.; Schiergens, T.S.; Herrler, G.; Wu, N.H.; Nitsche, A.; et al. SARS-CoV-2 cell entry depends on ACE2 and TMPRSS2 and is blocked by a clinically proven protease inhibitor. Cell 2020, 181, 271–280. [Google Scholar] [CrossRef]
  85. Wang, J.; Lee, J.S.; Kim, D.; Zhu, L. Exploration of zinc oxide nanoparticles as a multitarget and multifunctional anticancer nanomedicine. ACS Appl. Mater. Interfaces 2017, 9, 39971–39984. [Google Scholar] [CrossRef]
Figure 1. Flowchart of rational lead design and drug discovery of M3.
Ijms 22 09057 g001
Figure 2. Chemical structures of the shortlisted compounds M1–5 and Compound 13 with potential inhibitory activity to SARS-CoV-2.
Ijms 22 09057 g002
Figure 3. Enumerated structure design by PathFinder. (A) Proposed synthetic route for the synthesis of Compound 13. (B) R-group enumeration. (C) Ligand designer of Compound 13 with Mpro binding pocket. Light blue shows the cavity space and dark blue shows the solvent exposure workflow.
Ijms 22 09057 g003
Figure 4. In vitro antiviral activity of compounds M1–M5. The antiviral activities of the compounds were screened on NRC-03-nhCoV strain (Accession # EPI_ISL_430820) co-cultured with Vero-E6 cells. To determine the most effective and safer compounds, selectivity index (SI) was measured, and the compounds with high SI were selected. Values of inhibitory concentration 50% (IC50) on viral cells and cytotoxic concentration 50% (CC50) on Vero cells were calculated using nonlinear regression analysis by plotting log inhibitor concentration versus normalized response (variable slope). The data display the mean of cell viability percentage ± SEM of 4 replicas.
Ijms 22 09057 g004
Figure 5. Cytotoxic activities of M3. The cytotoxic activity of M3 compound was tested on normal human cells at different concentrations (0.105, 0.211, 0.422, 0.632, 0.843, and 1.054 µM). The data display the mean of cell viability percentage ± SEM of 3 replicas.
Ijms 22 09057 g005
Figure 6. Inhibition activity of M3 against selected critical SARS-CoV-2 targets. (A). IC50 calculation of M3 against SARS-CoV-2 Mpro enzyme. (B) IC50 calculation of M3 against human TMPRSS2 enzyme. (C) IC50 calculation of M3 against human furin enzyme. The data display the mean of the percentage of the enzyme inhibition ± SEM of 3 replicas.
Ijms 22 09057 g006
Figure 7. Molecular docking of compounds M1–5 compared to Compound 13 with SARS-CoV-2 Mpro (PDB: 6LU7). (A) The interaction of Compound 13 (green stick) within the active site of MPRO. (B) The interaction of M3 (purple stick) within the active site of Mpro. (C) The interaction of M1 (cyan stick) within the active site of MPRO. (D) The interaction of M2 (orange stick) within the active site of Mpro. (E) The interaction of M4 (light green stick) within the active site of Mpro. (F) The interaction of M5 (pink stick) within the active site of Mpro.
Ijms 22 09057 g007
Figure 8. Molecular docking of compounds M1–5 compared to Compound 13 with TMPRSS2 (PDB:2OQ5) protein. (A) The interaction of Compound 13 (green stick) within the active site of TMPRSS2. (B) The interaction of M3 (gray stick) within the active site of TMPRSS2. (C) The interaction of M1 (cyan stick) within the active site of TMPRSS2. (D) The interaction of M2 (orange stick) within the active site of TMPRSS2. (E) The interaction of M4 (light green stick) within the active site of TMPRSS2. (F) The interaction of M5 (pink stick) within the active site of TMPRSS2.
Ijms 22 09057 g008
Figure 9. The root mean square deviation (RMSD) plots of compounds M1–5 compared to Compound 13 with SARS-CoV-2 MPRO (PDB: 6LU7). (A) RMSDs of Compound 13. (B) RMSDs of M3. (C) RMSDs of M1. (D) RMSDs of M2. (E) RMSDs of M4. (F) RMSDs of M5. Green represents the protein backbone fluctuations, while the red represents the ligand fluctuations.
Ijms 22 09057 g009
Figure 10. The root mean square deviations (RMSD) plots of compounds M1–5 compared to Compound 13 with human TMPRSS2 (PDB ID: 2OQ5). (A) RMSDs of Compound 13. (B) RMSDs of M3. (C) RMSDs of M1. (D) RMSDs of M2. (E) RMSDs of M4. (F) RMSDs of M5. Green represents the protein backbone fluctuations, while the red represents the ligand fluctuations.
Ijms 22 09057 g010
Figure 11. Interaction diagram of Compound 13 with Mpro observed during the molecular dynamic simulation. (A) The protein–ligand interaction diagram. (B) The top panel showed the specific contact of Mpro protein with Compound 13 in each trajectory course, the bottom panel showed the amino acid residues that interact with the ligand in the trajectory time frame. The residues making more than one contact were shown in a darker color shade. (C) Schematic diagram of ligand interaction with the amino acid residues of protein during MD simulation.
Ijms 22 09057 g011
Figure 12. Interaction diagram of M3 with Mpro observed during the molecular dynamic simulation. (A) The protein–ligand interaction diagram. (B) The top panel showed the specific contact of Mpro protein with M3 in each trajectory course, the bottom panel showed the amino acid residues that interact with the ligand in the trajectory time frame. The residues making more than one contact were shown in a darker color shade. (C) Schematic diagram of ligand interaction with the amino acid residues of protein during MD simulation.
Ijms 22 09057 g012
Figure 13. Interaction diagram of Compound 13 with TMPRSS2 observed during the molecular dynamic simulation. (A) The protein–ligand interaction diagram. (B) The top panel showed the specific contact of TMPRSS2 protein with Compound 13 in each trajectory course, the bottom panel showed the amino acid residues that interact with the ligand in the trajectory time frame. The residues making more than one contact were shown in a darker color shade. (C) Schematic diagram of ligand interaction with the amino acid residues of protein during MD simulation.
Ijms 22 09057 g013
Figure 14. Interaction diagram of M3 with TMPRSS2 observed during the molecular dynamic simulation. (A) The protein–ligand interaction diagram. (B) The top panel showed the specific contact of TMPRSS2 protein with M3 in each trajectory course, the bottom panel showed the amino acid residues that interact with the ligand in the trajectory time frame. The residues making more than one contact were shown in a darker color shade. (C) Schematic diagram of ligand interaction with the amino acid residues of protein during MD simulation.
Ijms 22 09057 g014
Figure 15. WaterMap analysis of the hydration sites of Mpro binding pocket with the docked of pose compounds. (A) The overlay and displacement of unstable and replaceable water with Compound 13. (B) The overlay and displacement of unstable and replaceable water with M3. The hydration sites were shown with small spheres. The color spectrum ranged from red (most unfavorable) to green (least unfavorable).
Ijms 22 09057 g015
Figure 16. WaterMap analysis of the hydration sites of TMPRSS2 binding pocket with the docked pose of compounds. (A) The overlay and displacement of unstable and replaceable water with Compound 13. (B) The overlay and displacement of unstable and replaceable water with M3. The hydration sites were shown with small spheres. The color spectrum ranged from red (most unfavorable) to green (least unfavorable).
Ijms 22 09057 g016
Figure 17. Characterization of compound-loaded ZnO NPs. Zeta potential measurement for (A) drug-free ZnO NPs and (B) ZnO NPs loaded with compound M3. NPs samples were diluted with distilled water and zeta potential were determined using Laser Doppler Velocimetry (LDV) mode. (C) SEM micrographs of ZnO NPs loaded with M3. ZnO NPs samples were placed on carbon tape after dryness then coated with gold prior to measurement.
Ijms 22 09057 g017
Figure 18. In vitro antiviral activity of (A) drug-free ZnO NPs compared to (B) M3-loaded ZnO NPs. The antiviral activity was assessed using NRC-03-nhCoV strain (Accession # EPI_ISL_430820) co-cultured with Vero-E6 cells. IC50 and CC50 on viral and Vero cells were calculated using nonlinear regression analysis by plotting log inhibitor concentration versus normalized response (variable slope). The data display the mean of cell viability percentage ± SEM of 4 replicas.
Ijms 22 09057 g018
Figure 19. SAR Heatmap analysis. (A) PIC50 values were displayed as colors ranging from red to blue, as shown in the key. (B) QSAR analysis, and pharmacophoric features were displayed as colors of red, grey, and blue as shown in the key.
Ijms 22 09057 g019
Table 1. Docking score of shortlisted compounds against Mpro and TMPRSS2.
Compound Docking Score with
MPRO TMPRSS2
M1−9.97−8.11
M2−8.16−8.53
M3−8.79−9.81
M4−9.67−9.32
M5−7.37−6.32
Compound 13−7.01−9.86
Table 2. Molecular modeling of the shortlisted compounds (M1M5) within the binding active site of SARS-CoV-2 Mpro when compared to Compound 13.
Compound Moiety Interaction Amino Acid Residue
M1NH
N of oxadiazole
Phenyl ring
H-bond
H-bond
pi-pi stacking bond
Hydrophobic bond
Glu-166
Asn-142
His-41
His-41, Met-49, Cys-145, Met-165 and Pro-168
M2NH22H-bonds
Hydrophobic bond
Phe-140 and Glu-166
His-41, Met-49, Cys-145, Met-165 and Gln-189
M3NH2
NH
N
pyridyl moiety and CH
2H-bonds
H-bond
H-bond
Hydrophobic bond
Cys-44 and Thr-25
Asn-142
Glu-166
Met-49, Cys-44, Glu-166 and Met-165
M4NH2
Cl
2- H-bonds
Halogen bond
Hydrophobic bond
Glu-166 and Phe-140
Gln-192
Met-49, Glu-166, Cys-145, Met-165, Gln-189, Gln-192 and Pro-168
M5NH2 2H-bonds
Hydrophobic bond
Glu-166 and Phe-140
Cys-44, His-41, Met-49, Gln-189 and Pro-168
Compound 13Phenolic OH
NH2
NH2
N
Phenolic OH
Phenyl ring and CH
H-bond
H-bond
H-bond
pi-pi stacking bond
Hydrophobic bond
Glu-166
Phe-140
Thr-26
His-40
Met-44, Cys-44 and Met-165.
Table 3. Molecular modeling of the shortlisted compounds (M1M5) within the binding active site of human TMPRSS2 when compared to Compound 13.
Compound Moiety Interaction Amino Acid Residue
M1NH
N
H-bond
H-bond
Hydrophobic bond
Gln-192
Ser-195
Arg-41, Cys-219 and Tyr-228
M2NH2
NH
H-bond
H-bond
Hydrophobic bond
Gln-192
Ser-214
Tyr-36, Arg-41, Gln-192, Val-213 and Cys-219
M32-NH
N of 4-pyridyl moiety
N
pyridinyl moiety and CH
2H-bonds
H-bond
H-bond
Hydrophobic bond
Ser-214
Arg-41
Glu-218
His-57, Arg-41 and Cys-219 and Cys-42
M4NH2
Cl
N
3-H-bonds
3-Halogen bond
H-bond
Hydrophobic bond
His-57, Ser-214, Gln-192
Ala-220, Ser-214, Ser-39
Arg-41
Arg-41, Val-213, Cys-219 and Tyr-228
M5OCH3
NH
H-bond
H-bond
Hydrophobic bond
Arg-41
Gln-192
Arg-41, Tyr-149, Ala-190, Val-213 and Cys-219
Compound 13Phenolic OH
NH2
NH2
N
Phenolic OH
Phenyl ring and CH
H-bond
H-bond
H-bond
H-bond
H-bond
Hydrophobic bond
His-40
Gln-192
Ser-214
Arg-41
Glu-218
Arg-41, Ala-190, Val-213, Cys-42 and Trp-36
Publisher’s Note: MDPI stays neutral with regard to jurisdictional claims in published maps and institutional affiliations.

