
Effect of Active Lengthening and Shortening on Small-Angle X-ray Reflections in Skinned Skeletal Muscle Fibres

 , ,
, ,  ,
,  and
and 
Abstract
1. Introduction
2. Results
2.1. Active Lengthening Experiments
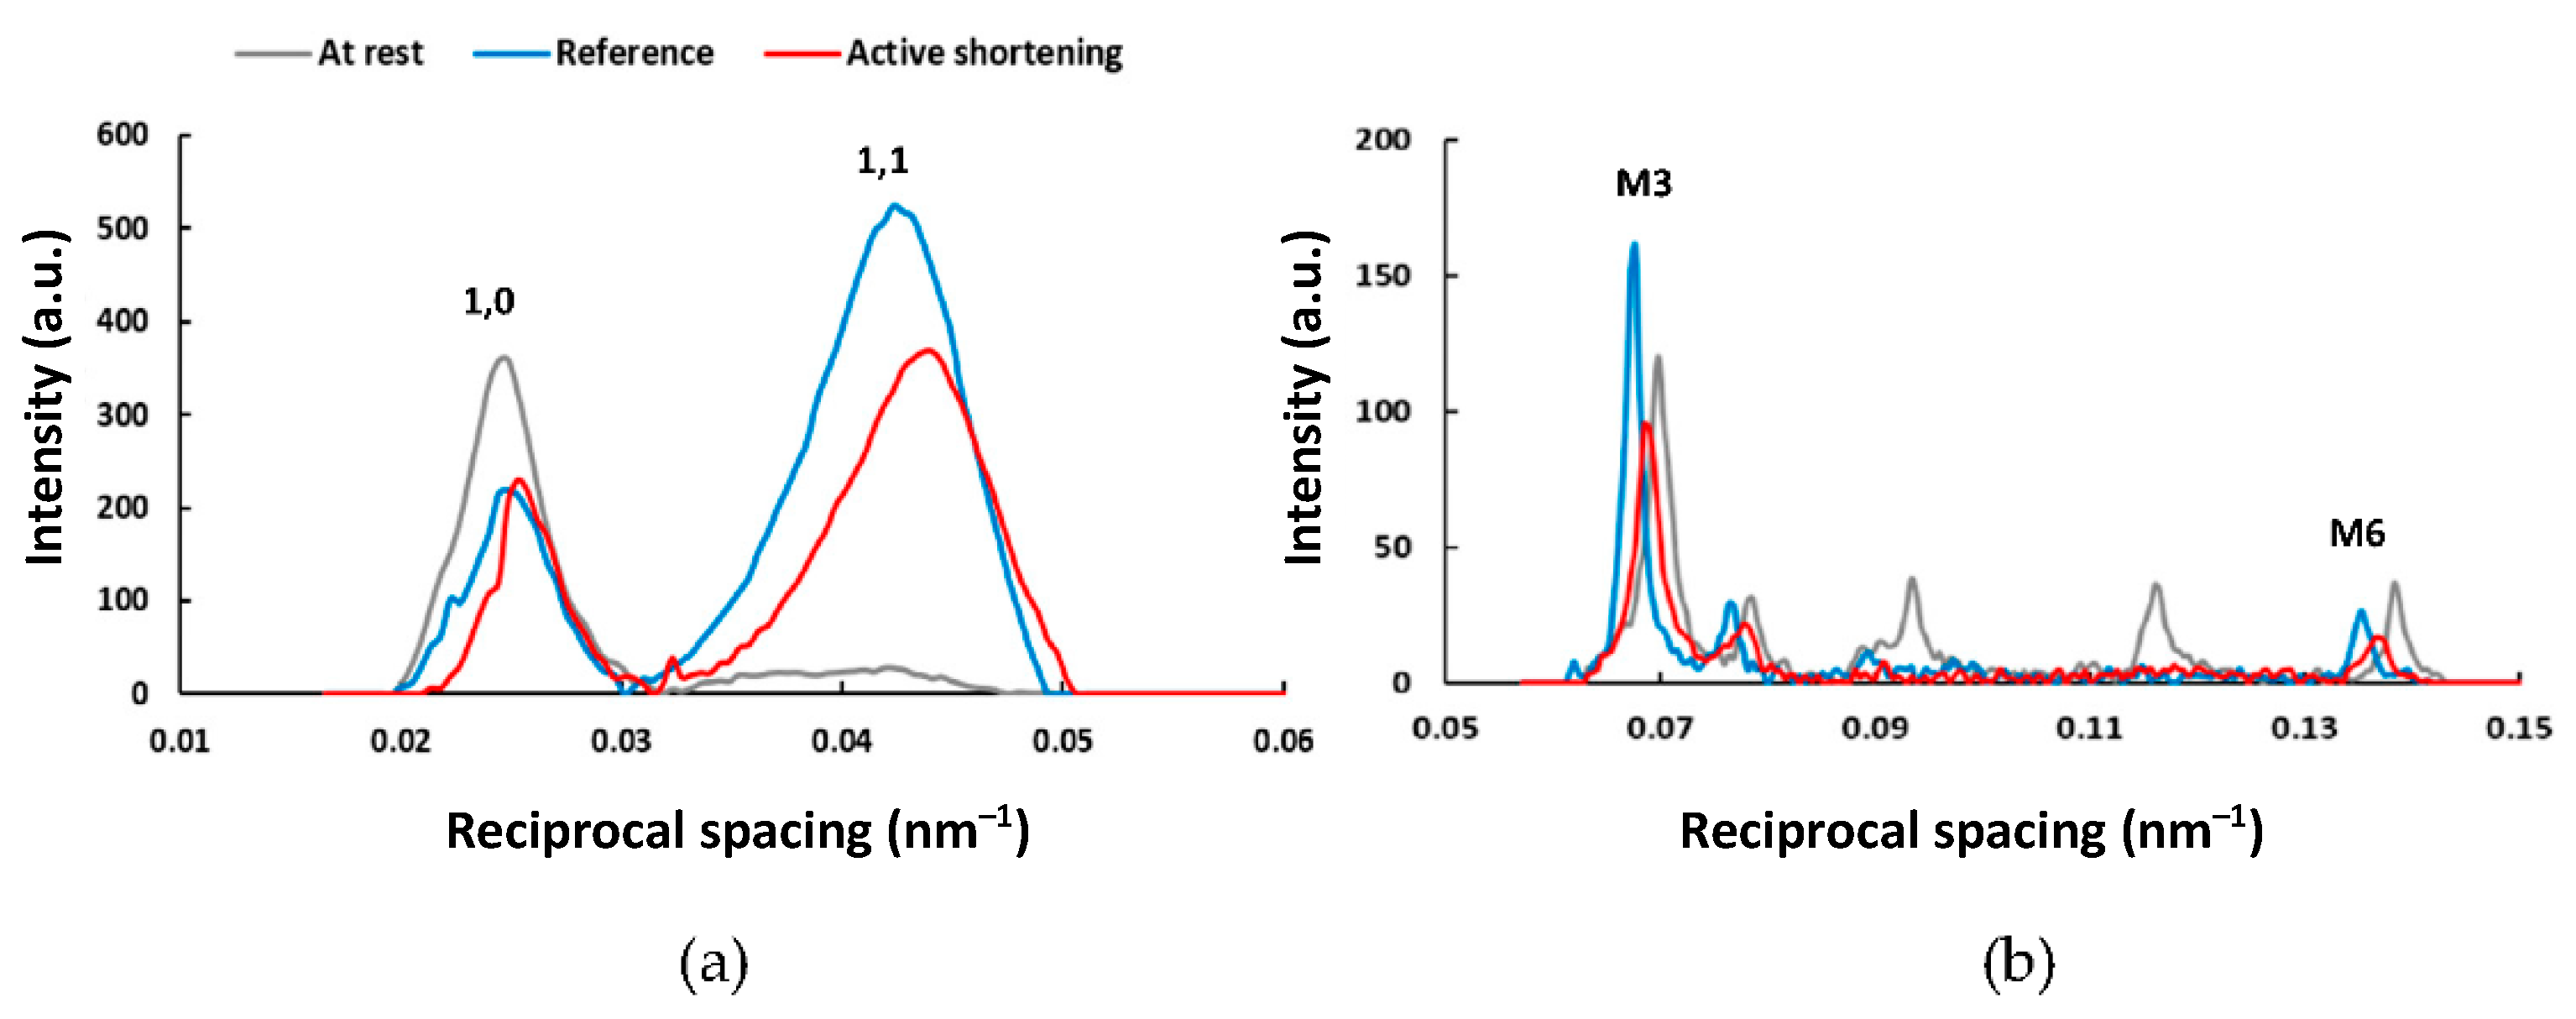
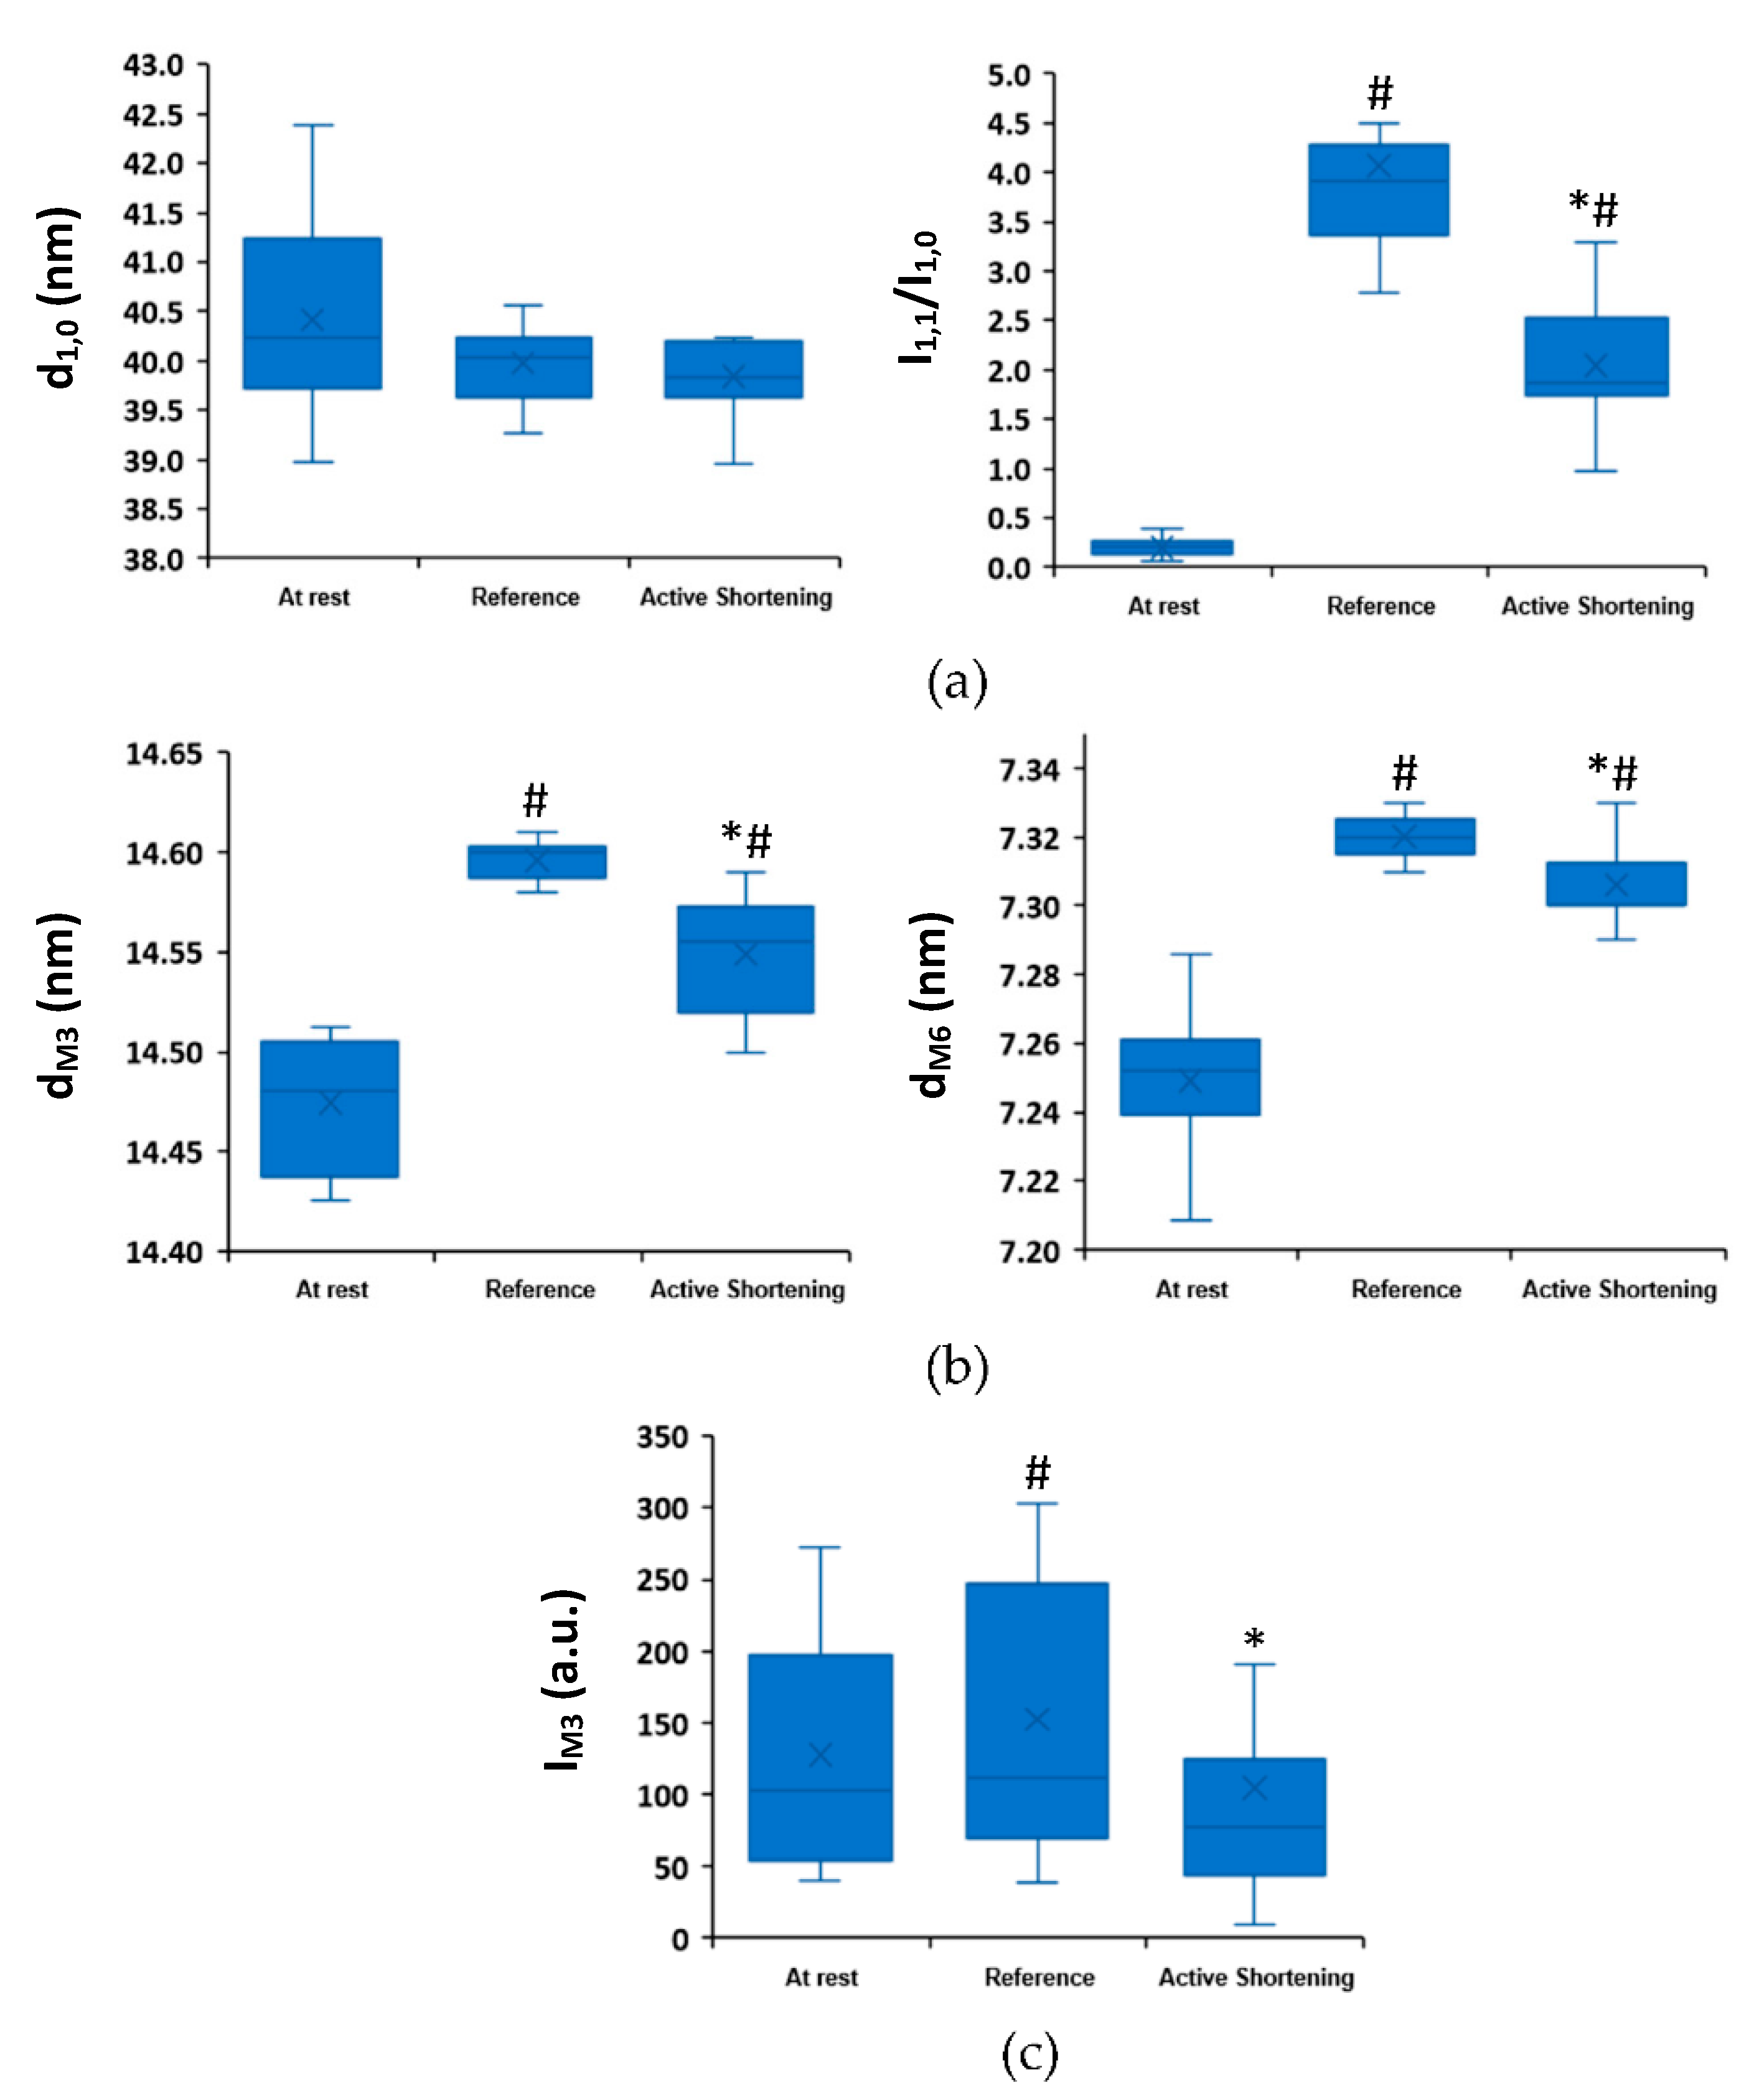
2.2. Active Shortening Experiments
3. Discussion
4. Materials and Methods
4.1. Skinned Muscle Bundle Preparation
4.2. Mechanical Testing Protocols
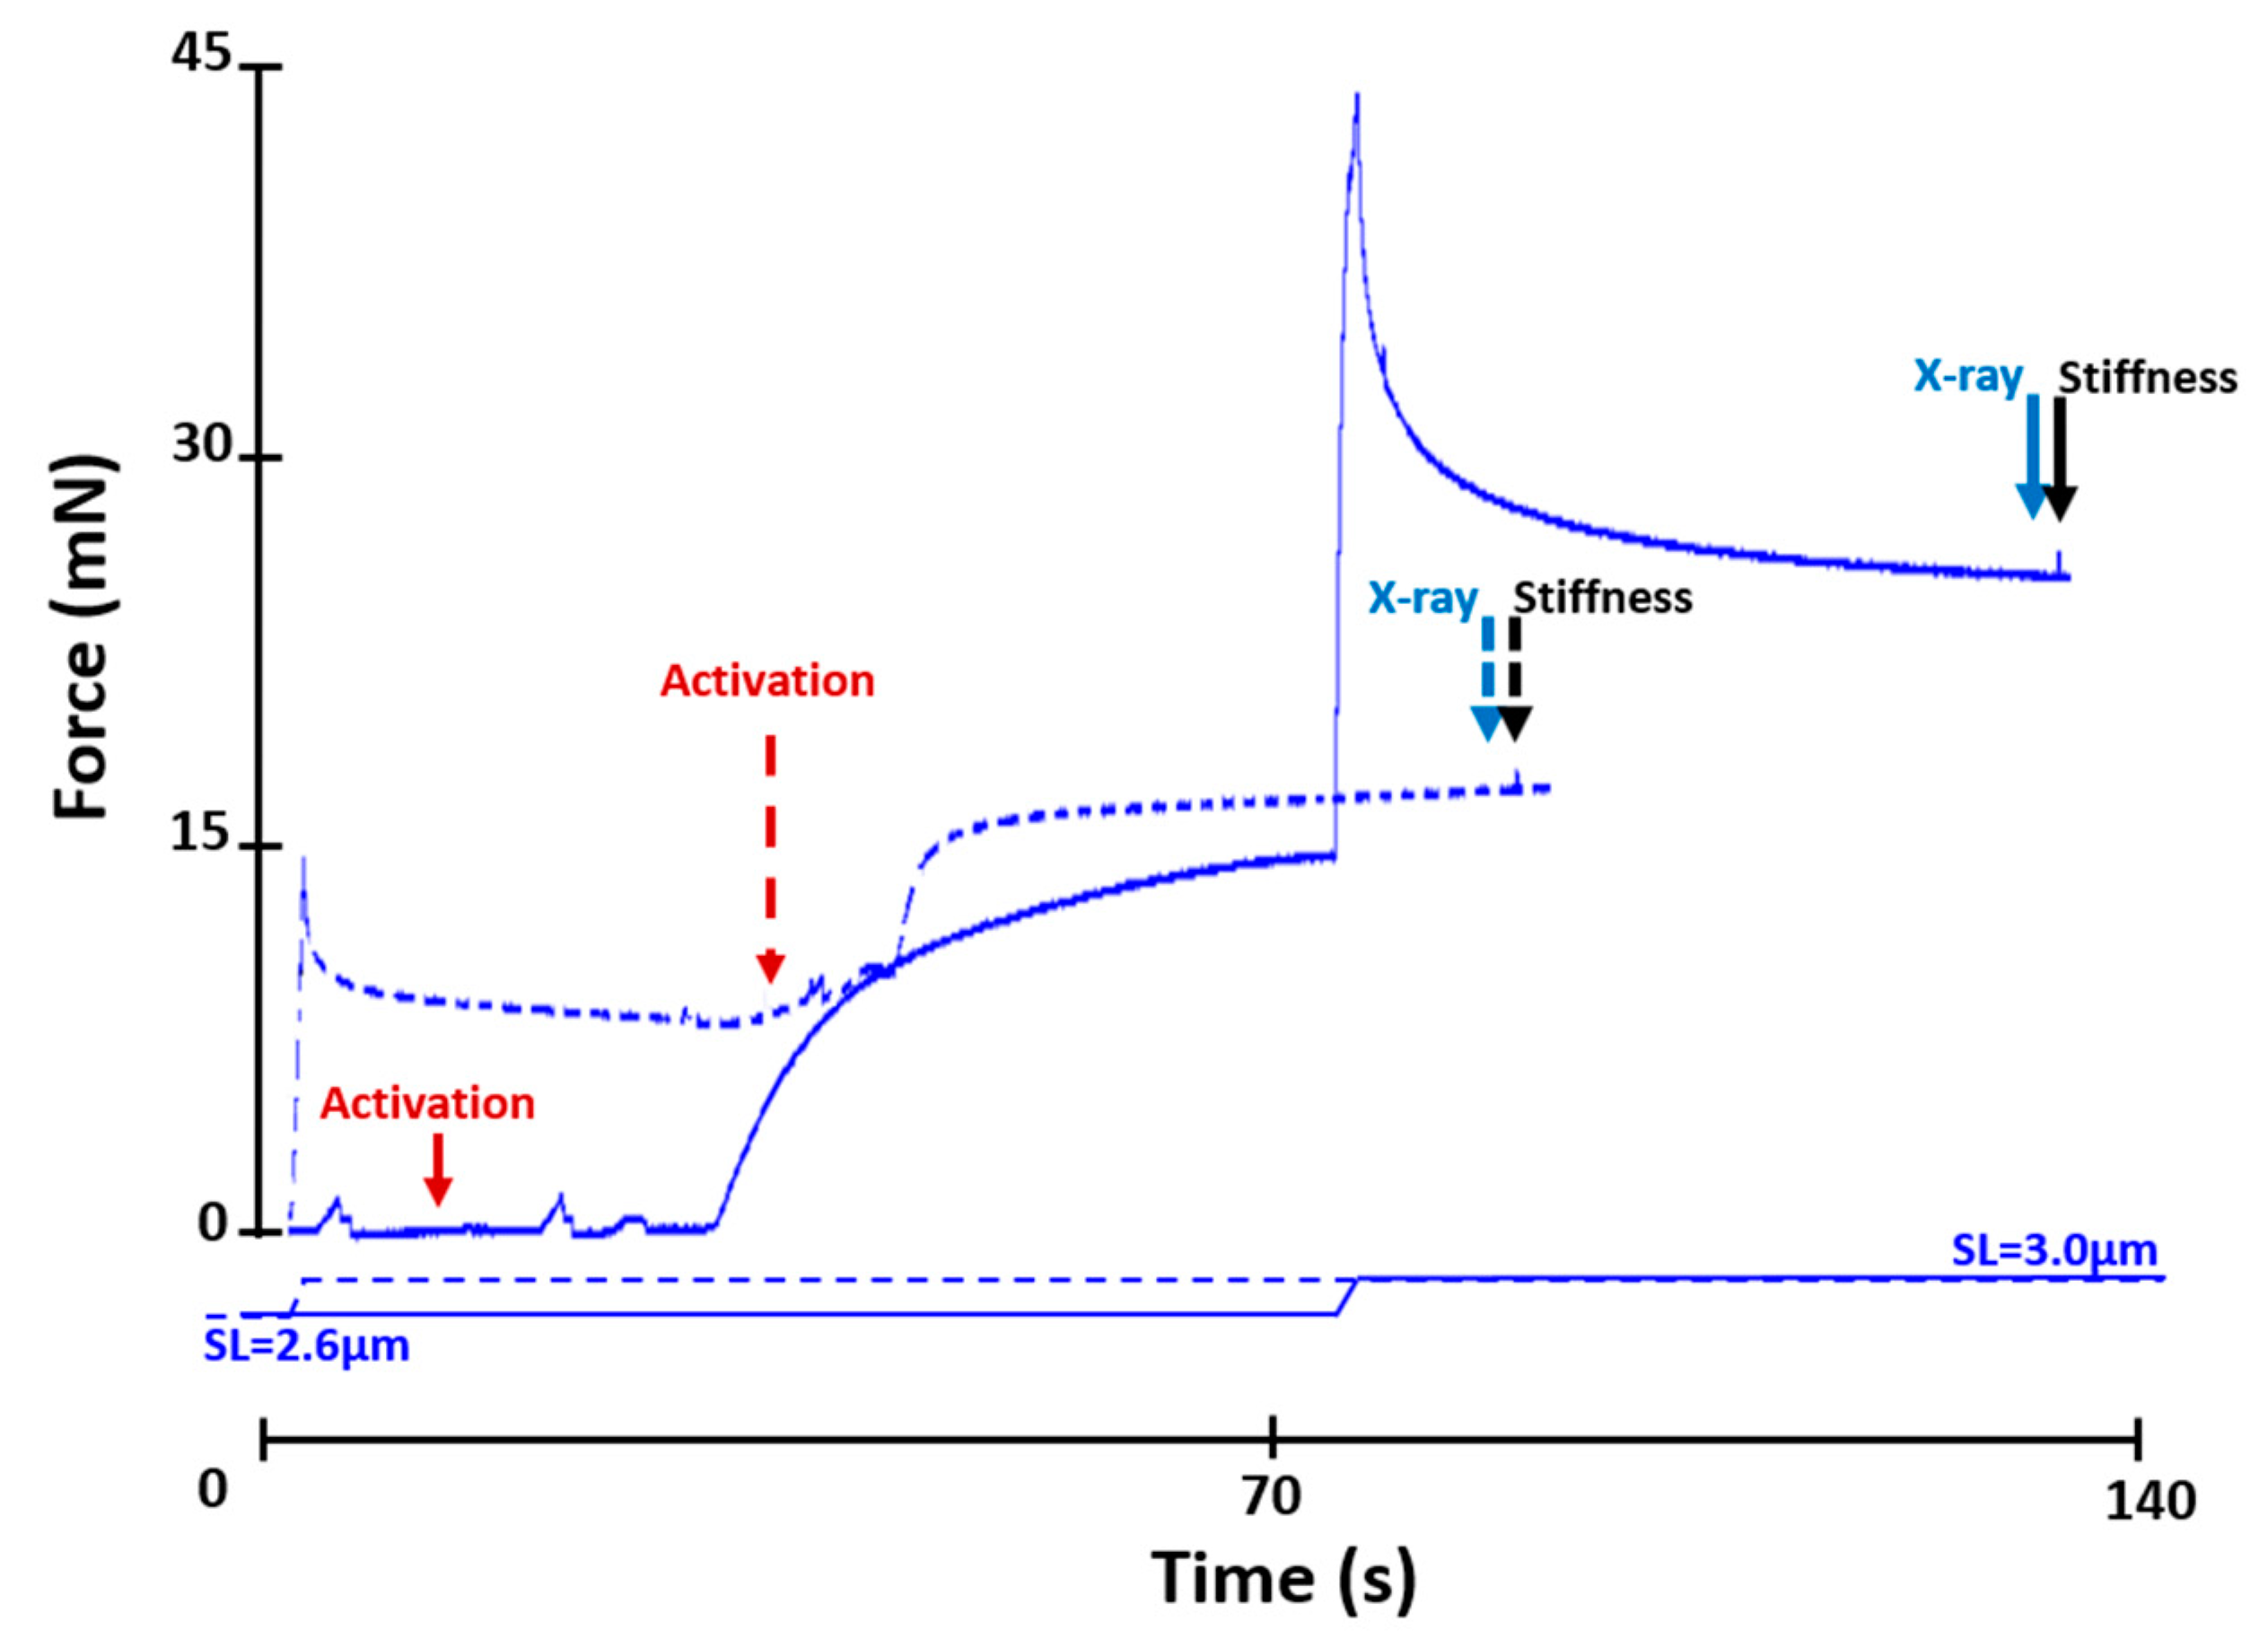
4.2.1. Active Lengthening Experiments (n = 11)
- Passive lengthening from an average SL of 2.6 µm to an average SL of 3.0 µm
- Activation at an average SL of 2.6 µm and active lengthening to an average SL of 3.0 µm
- Activation at an average SL of 3.0 µm
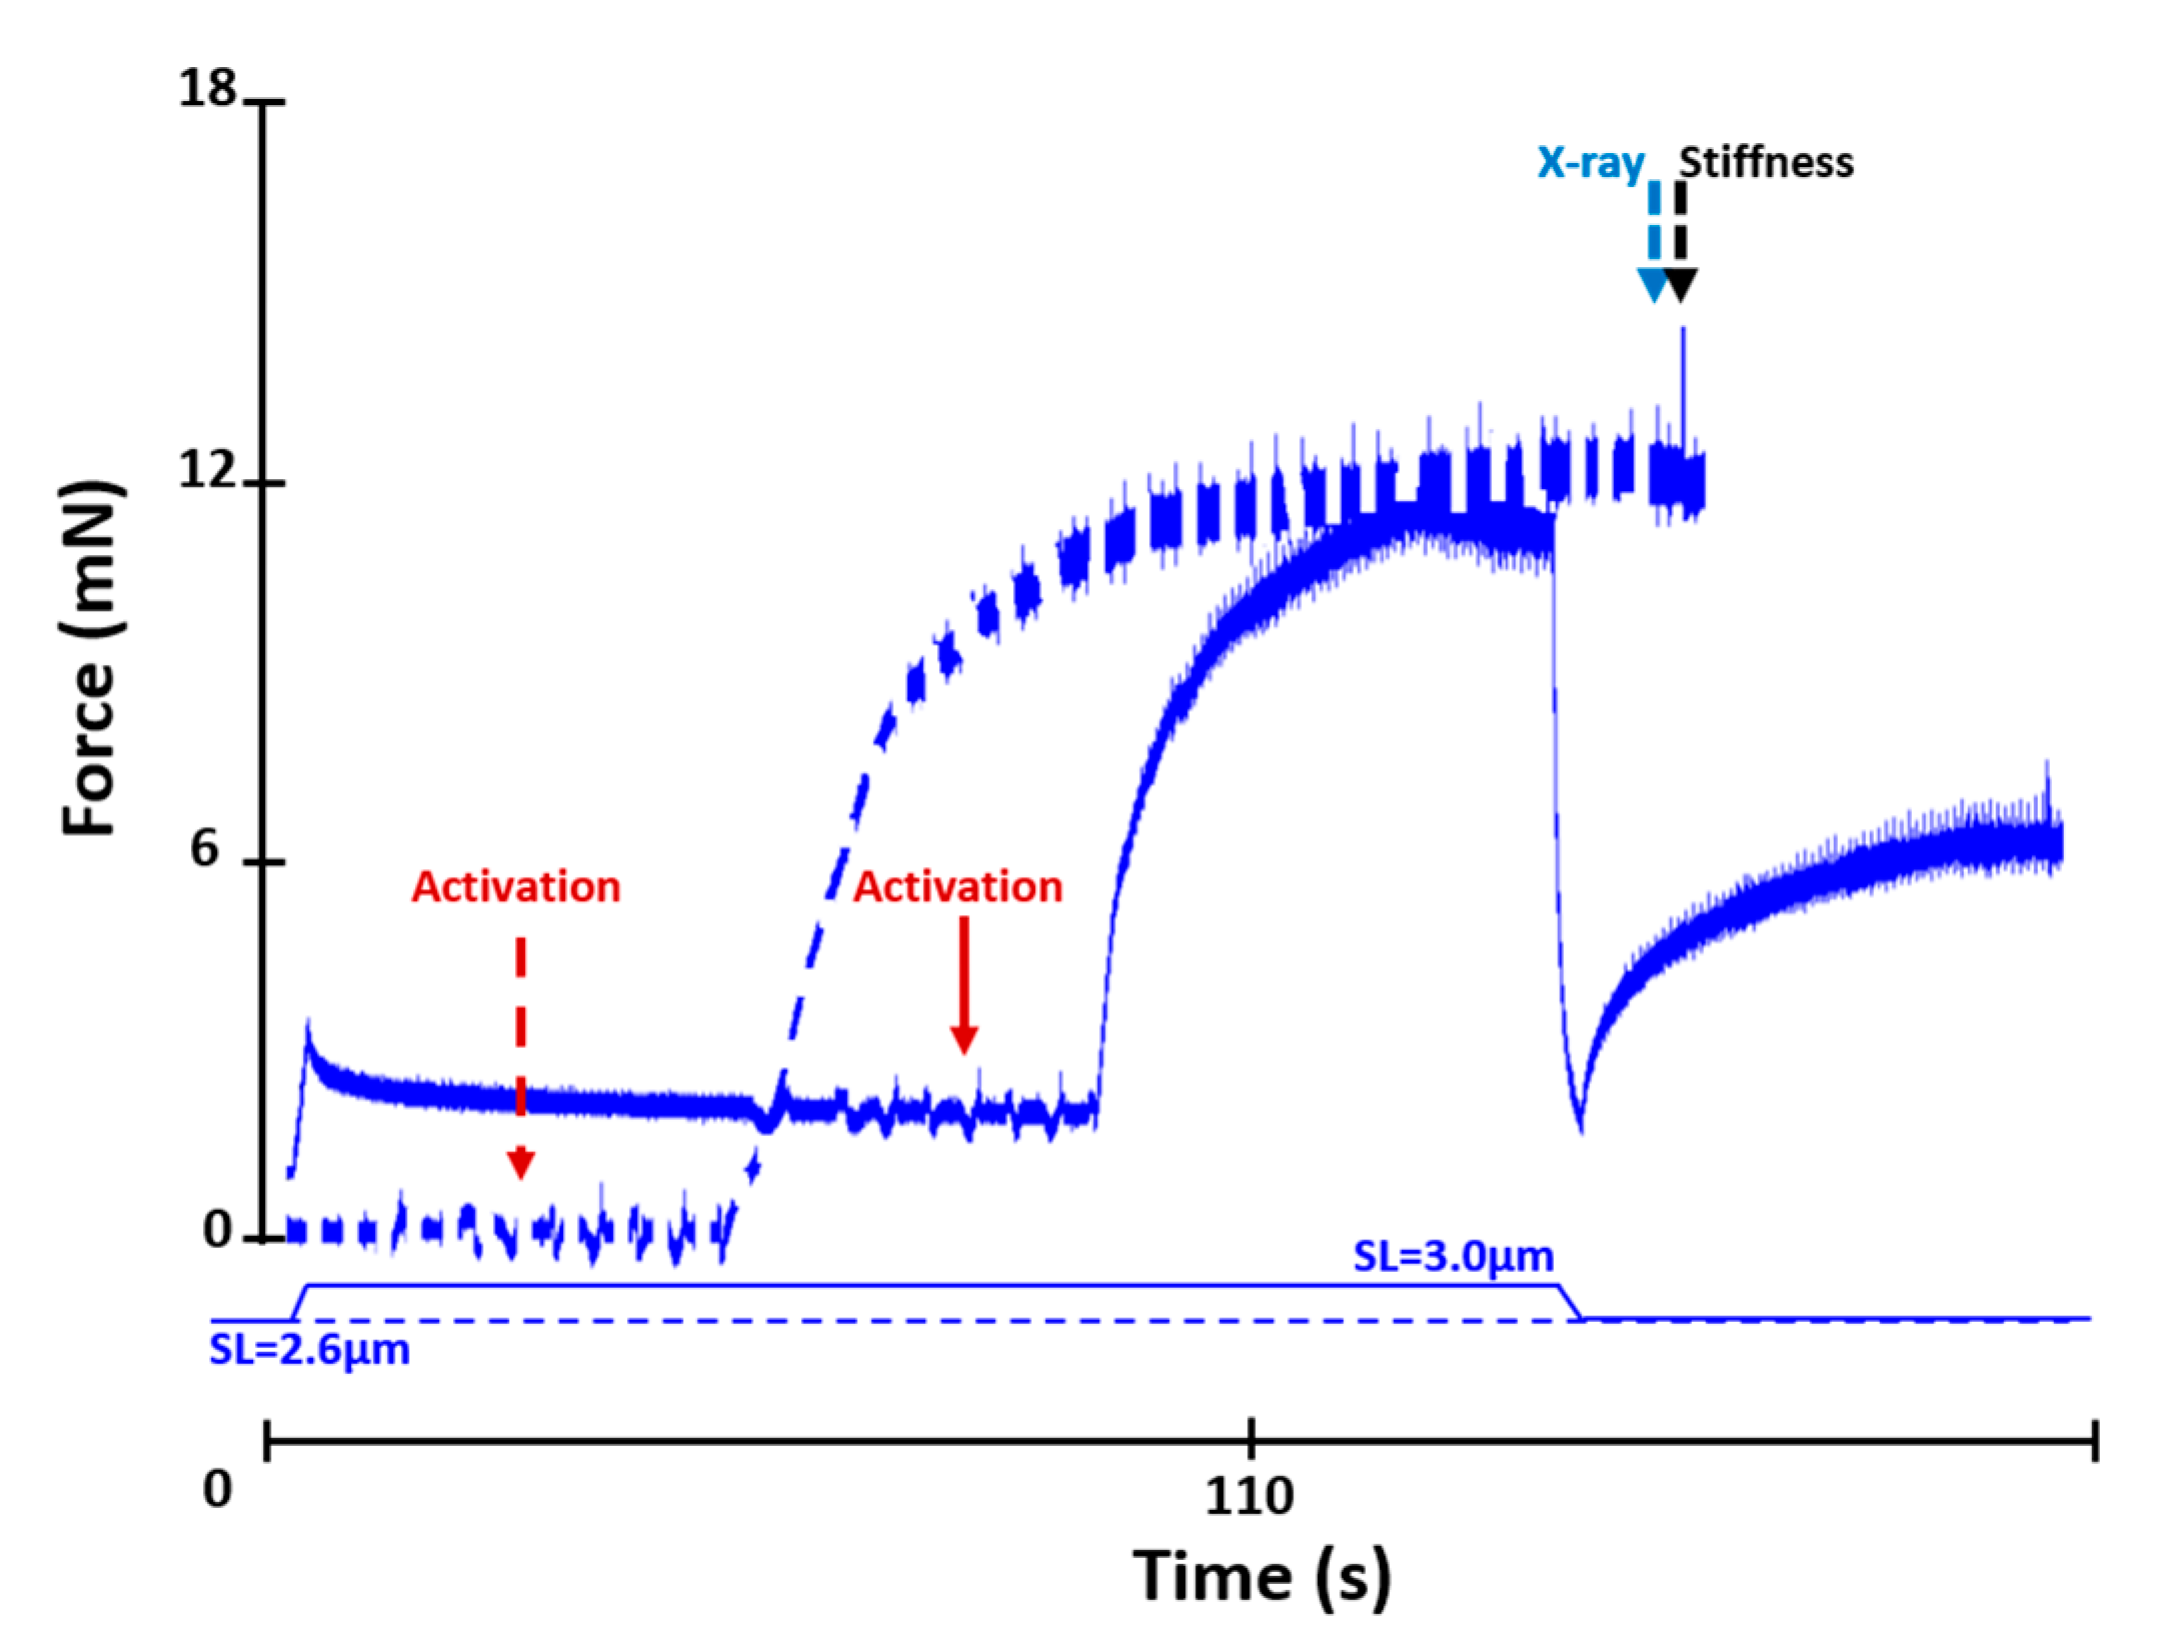
4.2.2. Active Shortening Experiments (n = 10)
- At rest at an average SL of 2.6 µm
- Activation at an average SL of 3.0 µm and active shortening to an average SL of 2.6 µm
- Activation at an average SL of 2.6 µm
4.2.3. Stiffness Measurements
4.3. X-ray Data Collection and Analysis
Analysis of X-ray Diffraction Patterns
4.4. Statistical Analysis
4.5. Solutions
5. Conclusions
Author Contributions
Funding
Institutional Review Board Statement
Data Availability Statement
Conflicts of Interest
References
- Abbott, B.C.; Aubert, X.M. The Force Exerted by Active Striated Muscle during and after Change of Length. J. Physiol. 1952, 117, 77–86. [Google Scholar]
- Edman, K.A.; Elzinga, G.; Noble, M.I. Residual Force Enhancement after Stretch of Contracting Frog Single Muscle Fibers. J. Gen. Physiol. 1982, 80, 769–784. [Google Scholar] [CrossRef] [PubMed]
- Fukutani, A.; Misaki, J.; Isaka, T. Both the Elongation of Attached Crossbridges and Residual Force Enhancement Contribute to Joint Torque Enhancement by the Stretch-Shortening Cycle. R. Soc. Open Sci. 2017, 4, 161036. [Google Scholar] [CrossRef]
- Herzog, W.; Powers, K.; Johnston, K.; Duvall, M. A New Paradigm for Muscle Contraction. Front. Physiol. 2015, 6, 174. [Google Scholar] [CrossRef] [PubMed]
- Joumaa, V.; Herzog, W. Force Depression in Single Myofibrils. J. Appl. Physiol. 2010, 108, 356–362. [Google Scholar] [CrossRef] [PubMed]
- Joumaa, V.; Leonard, T.R.; Herzog, W. Residual Force Enhancement in Myofibrils and Sarcomeres. Proc. Biol. Sci. 2008, 275, 1411–1419. [Google Scholar] [CrossRef]
- Leonard, T.R.; Herzog, W. Regulation of Muscle Force in the Absence of Actin-Myosin-Based Cross-Bridge Interaction. Am. J. Physiol. Cell Physiol. 2010, 299, C14–C20. [Google Scholar] [CrossRef]
- Power, G.A.; Makrakos, D.P.; Stevens, D.E.; Herzog, W.; Rice, C.L.; Vandervoort, A.A. Shortening-Induced Torque Depression in Old Men: Implications for Age-Related Power Loss. Exp. Gerontol. 2014, 57C, 75–80. [Google Scholar] [CrossRef] [PubMed]
- Seiberl, W.; Power, G.A.; Hahn, D. Residual Force Enhancement in Humans: Current Evidence and Unresolved Issues. J. Electromyogr. Kinesiol. 2015, 25, 571–580. [Google Scholar] [CrossRef]
- Edman, K.A.; Elzinga, G.; Noble, M.I. Enhancement of Mechanical Performance by Stretch during Tetanic Contractions of Vertebrate Skeletal Muscle Fibres. J. Physiol. 1978, 281, 139–155. [Google Scholar] [CrossRef]
- Herzog, W.; Leonard, T.R. Force Enhancement Following Stretching of Skeletal Muscle: A New Mechanism. J. Exp. Biol. 2002, 205, 1275–1283. [Google Scholar] [CrossRef] [PubMed]
- Herzog, W.; Leonard, T.R. Depression of Cat Soleus-Forces Following Isokinetic Shortening. J. Biomech. 1997, 30, 865–872. [Google Scholar] [CrossRef]
- Marechal, G.; Plaghki, L. The Deficit of the Isometric Tetanic Tension Redeveloped after a Release of Frog Muscle at a Constant Velocity. J. Gen. Physiol. 1979, 73, 453–467. [Google Scholar] [CrossRef] [PubMed]
- Leonard, T.R.; Herzog, W. Does the Speed of Shortening Affect Steady-State Force Depression in Cat Soleus Muscle? J. Biomech. 2005, 38, 2190–2197. [Google Scholar] [CrossRef] [PubMed]
- Morgan, D.L.; Whitehead, N.P.; Wise, A.K.; Gregory, J.E.; Proske, U. Tension Changes in the Cat Soleus Muscle Following Slow Stretch or Shortening of the Contracting Muscle. J. Physiol. 2000, 522, 503–513. [Google Scholar] [CrossRef]
- Huxley, A.F. Muscle Structure and Theories of Contraction. Prog. Biophys. Biophys. Chem. 1957, 7, 255–318. [Google Scholar] [CrossRef]
- Gordon, A.M.; Huxley, A.F.; Julian, F.J. The Variation in Isometric Tension with Sarcomere Length in Vertebrate Muscle Fibres. J. Physiol. 1966, 184, 170–192. [Google Scholar] [CrossRef]
- Hill, A.V. The Mechanics of Active Muscle. Proc. R. Soc. Lond. B Biol. Sci. 1953, 141, 104–117. [Google Scholar] [PubMed]
- Julian, F.J.; Morgan, D.L. The Effect on Tension of Non-Uniform Distribution of Length Changes Applied to Frog Muscle Fibres. J. Physiol. 1979, 293, 379–392. [Google Scholar] [CrossRef]
- Johnston, K.; Jinha, A.; Herzog, W. The Role of Sarcomere Length Non-Uniformities in Residual Force Enhancement of Skeletal Muscle Myofibrils. R. Soc. Open Sci. 2016, 3, 150657. [Google Scholar] [CrossRef]
- Telley, I.A.; Stehle, R.; Ranatunga, K.W.; Pfitzer, G.; Stussi, E.; Denoth, J. Dynamic Behaviour of Half-Sarcomeres during and after Stretch in Activated Rabbit Psoas Myofibrils: Sarcomere Asymmetry but No “Sarcomere Popping”. J. Physiol. 2006, 573, 173–185. [Google Scholar] [CrossRef]
- Leonard, T.R.; DuVall, M.; Herzog, W. Force Enhancement Following Stretch in a Single Sarcomere. Am. J. Physiol. Cell Physiol. 2010, 299, C1398–C1401. [Google Scholar] [CrossRef] [PubMed]
- Joumaa, V.; Fitzowich, A.; Herzog, W. Energy Cost of Isometric Force Production after Active Shortening in Skinned Muscle Fibres. J. Exp. Biol. 2017, 220, 1509–1515. [Google Scholar] [CrossRef] [PubMed]
- Sugi, H.; Tsuchiya, T. Stiffness Changes during Enhancement and Deficit of Isometric Force by Slow Length Changes in Frog Skeletal Muscle Fibres. J. Physiol. 1988, 407, 215–229. [Google Scholar] [CrossRef] [PubMed]
- Joumaa, V.; Herzog, W. Energy Cost of Force Production Is Reduced after Active Stretch in Skinned Muscle Fibres. J. Biomech. 2013, 46, 1135–1139. [Google Scholar] [CrossRef] [PubMed]
- Huxley, H.E. Memories of Early Work on Muscle Contraction and Regulation in the 1950′s and 1960’s. Biochem. Biophys. Res. Commun. 2008, 369, 34–42. [Google Scholar] [CrossRef]
- Huxley, H.E.; Faruqi, A.R. Time-Resolved X-Ray Diffraction Studies on Vertebrate Striated Muscle. Annu. Rev. Biophys. Bioeng. 1983, 12, 381–417. [Google Scholar] [CrossRef] [PubMed]
- Huxley, H.E.; Stewart, A.; Sosa, H.; Irving, T. X-Ray Diffraction Measurements of the Extensibility of Actin and Myosin Filaments in Contracting Muscle. Biophys. J. 1994, 67, 2411–2421. [Google Scholar] [CrossRef]
- Irving, T.C. Bright Prospects for Biological Non-Crystalline Diffraction. Nat. Struct. Biol. 1998, 5, 648–650. [Google Scholar] [CrossRef]
- Lombardi, V.; Piazzesi, G.; Reconditi, M.; Linari, M.; Lucii, L.; Stewart, A.; Sun, Y.-B.; Boesecke, P.; Narayanan, T.; Irving, T.; et al. X-ray Diffraction Studies of the Contractile Mechanism in Single Muscle Fibres. Philos. Trans. R. Soc. Lond. Ser. B Biol. Sci. 2004, 359, 1883–1893. [Google Scholar] [CrossRef]
- Xu, S.G.; Kress, M.; Huxley, H.E. X-ray Diffraction Studies of the Structural State of Crossbridges in Skinned Frog Sartorius Muscle at Low Ionic Strength. J. Muscle Res. Cell Motil. 1987, 8, 39–54. [Google Scholar] [CrossRef]
- Haselgrove, J.C. X-ray Evidence for Conformational Changes in the Myosin Filaments of Vertebrate Striated Muscle. J. Mol. Biol. 1975, 92, 113–143. [Google Scholar] [CrossRef]
- Squire, J.M.; Knupp, C.; Roessle, M.; AL-Khayat, H.A.; Irving, T.C.; Eakins, F.; Mok, N.-S.; Harford, J.J.; Reedy, M.K. X-ray Diffraction Studies of Striated Muscles. In Sliding Filament Mechanism in Muscle Contraction; Sugi, H., Ed.; Springer: Boston, MA, USA, 2005; Volume 565, pp. 45–60. ISBN 978-0-387-24989-6. [Google Scholar]
- Griffiths, P.J.; Bagni, M.A.; Colombini, B.; Amenitsch, H.; Bernstorff, S.; Ashley, C.C.; Cecchi, G. Changes in Myosin S1 Orientation and Force Induced by a Temperature Increase. Proc. Natl. Acad. Sci. USA 2002, 99, 5384–5389. [Google Scholar] [CrossRef]
- Linari, M.; Lucii, L.; Reconditi, M.; Casoni, M.E.; Amenitsch, H.; Bernstorff, S.; Piazzesi, G.; Lombardi, V. A Combined Mechanical and X-ray Diffraction Study of Stretch Potentiation in Single Frog Muscle Fibres. J. Physiol. 2000, 526, 589–596. [Google Scholar] [CrossRef]
- Ma, W.; Gong, H.; Kiss, B.; Lee, E.-J.; Granzier, H.; Irving, T. Thick-Filament Extensibility in Intact Skeletal Muscle. Biophys. J. 2018, 115, 1580–1588. [Google Scholar] [CrossRef] [PubMed]
- Reconditi, M.; Linari, M.; Lucii, L.; Stewart, A.; Sun, Y.-B.; Narayanan, T.; Irving, T.; Piazzesi, G.; Irving, M.; Lombardi, V. Structure-Function Relation of the Myosin Motor in Striated Muscle. Ann. N. Y. Acad. Sci. 2005, 1047, 232–247. [Google Scholar] [CrossRef] [PubMed]
- Huxley, H.; Reconditi, M.; Stewart, A.; Irving, T. X-ray Interference Studies of Crossbridge Action in Muscle Contraction: Evidence from Muscles During Steady Shortening. J. Mol. Biol. 2006, 363, 762–772. [Google Scholar] [CrossRef] [PubMed]
- Chen, J.; Hahn, D.; Power, G.A. Shortening-Induced Residual Force Depression in Humans. J. Appl. Physiol. 2019, 126, 1066–1073. [Google Scholar] [CrossRef]
- Pinniger, G.J.; Cresswell, A.G. Residual Force Enhancement after Lengthening Is Present during Submaximal Plantar Flexion and Dorsiflexion Actions in Humans. J. Appl. Physiol. 2007, 102, 18–25. [Google Scholar] [CrossRef] [PubMed]
- Goldman, Y.E.; Huxley, A.F. Actin Compliance: Are You Pulling My Chain? Biophys. J. 1994, 67, 2131–2133. [Google Scholar] [CrossRef]
- Kojima, H.; Ishijima, A.; Yanagida, T. Direct Measurement of Stiffness of Single Actin Filaments with and without Tropomyosin by in Vitro Nanomanipulation. Proc. Natl. Acad. Sci. USA 1994, 91, 12962–12966. [Google Scholar] [CrossRef] [PubMed]
- Brenner, B.; Yu, L.C. Equatorial X-ray Diffraction from Single Skinned Rabbit Psoas Fibers at Various Degrees of Activation. Changes in Intensities and Lattice Spacing. Biophys. J. 1985, 48, 829–834. [Google Scholar] [CrossRef]
- Iwamoto, H. Effects of Myosin Inhibitors on the X-ray Diffraction Patterns of Relaxed and Calcium-Activated Rabbit Skeletal Muscle Fibers. Biophys. Phys. 2018, 15, 111–120. [Google Scholar] [CrossRef] [PubMed]
- Millman, B.M. The Filament Lattice of Striated Muscle. Physiol. Rev. 1998, 78, 359–391. [Google Scholar] [CrossRef] [PubMed]
- Podolsky, R.J.; St Onge, H.; Yu, L.; Lymn, R.W. X-ray Diffraction of Actively Shortening Muscle. Proc. Natl. Acad. Sci. USA 1976, 73, 813–817. [Google Scholar] [CrossRef] [PubMed]
- Ma, W.; Gong, H.; Irving, T. Myosin Head Configurations in Resting and Contracting Murine Skeletal Muscle. Int. J. Mol. Sci. 2018, 19, 2643. [Google Scholar] [CrossRef] [PubMed]
- Matsubara, I. X-ray Diffraction Studies of the Heart. Annu. Rev. Biophys. Bioeng. 1980, 9, 81–105. [Google Scholar] [CrossRef]
- Matsubara, I.; Maughan, D.W.; Saeki, Y.; Yagi, N. Cross-Bridge Movement in Rat Cardiac Muscle as a Function of Calcium Concentration. J. Physiol. 1989, 417, 555–565. [Google Scholar] [CrossRef] [PubMed]
- Bagni, M.A.; Cecchi, G.; Griffiths, P.J.; Maéda, Y.; Rapp, G.; Ashley, C.C. Lattice Spacing Changes Accompanying Isometric Tension Development in Intact Single Muscle Fibers. Biophys. J. 1994, 67, 1965–1975. [Google Scholar] [CrossRef]
- Cecchi, G.; Bagni, M.; Griffiths, P.; Ashley, C.; Maeda, Y. Detection of Radial Crossbridge Force by Lattice Spacing Changes in Intact Single Muscle Fibers. Science 1990, 250, 1409–1411. [Google Scholar] [CrossRef] [PubMed]
- Rao, V.S.; Korte, F.S.; Razumova, M.V.; Feest, E.R.; Hsu, H.; Irving, T.C.; Regnier, M.; Martyn, D.A. N-Terminal Phosphorylation of Cardiac Troponin-I Reduces Length-Dependent Calcium Sensitivity of Contraction in Cardiac Muscle: Phosphorylation Effects on the Frank-Starling Relationship. J. Physiol. 2013, 591, 475–490. [Google Scholar] [CrossRef] [PubMed]
- Amemiya, Y.; Iwamoto, H.; Kobayashi, T.; Sugi, H.; Tanaka, H.; Wakabayashi, K. Time-Resolved X-ray Diffraction Studies on the Effect of Slow Length Changes on Tetanized Frog Skeletal Muscle. J. Physiol. 1988, 407, 231–241. [Google Scholar] [CrossRef] [PubMed]
- Reconditi, M.; Brunello, E.; Fusi, L.; Linari, M.; Martinez, M.F.; Lombardi, V.; Irving, M.; Piazzesi, G. Sarcomere-Length Dependence of Myosin Filament Structure in Skeletal Muscle Fibres of the Frog: Myosin Filament Structure in Skeletal Muscle. J. Physiol. 2014, 592, 1119–1137. [Google Scholar] [CrossRef] [PubMed]
- Irving, M.; Piazzesi, G.; Lucii, L.; Sun, Y.B.; Harford, J.J.; Dobbie, I.M.; Ferenczi, M.A.; Reconditi, M.; Lombardi, V. Conformation of the Myosin Motor during Force Generation in Skeletal Muscle. Nat. Struct. Biol. 2000, 7, 482–485. [Google Scholar] [CrossRef]
- Brunello, E.; Reconditi, M.; Elangovan, R.; Linari, M.; Sun, Y.-B.; Narayanan, T.; Panine, P.; Piazzesi, G.; Irving, M.; Lombardi, V. Skeletal Muscle Resists Stretch by Rapid Binding of the Second Motor Domain of Myosin to Actin. Proc. Natl. Acad. Sci. USA 2007, 104, 20114–20119. [Google Scholar] [CrossRef]
- Ferenczi, M.A.; Bershitsky, S.Y.; Koubassova, N.A.; Kopylova, G.V.; Fernandez, M.; Narayanan, T.; Tsaturyan, A.K. Why Muscle Is an Efficient Shock Absorber. PLoS ONE 2014, 9, e85739. [Google Scholar] [CrossRef]
- Smith, D.A.; Geeves, M.A.; Sleep, J.; Mijailovich, S.M. Towards a Unified Theory of Muscle Contraction. I: Foundations. Ann. Biomed. Eng. 2008, 36, 1624–1640. [Google Scholar] [CrossRef]
- Matsubara, I.; Yagi, N. Movements of Cross-Bridges during and after Slow Length Changes in Active Frog Skeletal Muscle. J. Physiol. 1985, 361, 151–163. [Google Scholar] [CrossRef]
- Sugi, H.; Amemiya, Y.; Hashizume, H. X-ray Diffraction of Active Frog Skeletal Muscle Before and After a Slow Stretch. Proc. Jpn. Acad. Ser. B Phys. Biol. Sci. 1977, 53, 178–182. [Google Scholar] [CrossRef][Green Version]
- Yagi, N.; Matsubara, I. Cross-Bridge Movements during a Slow Length Change of Active Muscle. Biophys. J. 1984, 45, 611–614. [Google Scholar] [CrossRef]
- Brunello, E.; Fusi, L.; Reconditi, M.; Linari, M.; Bianco, P.; Panine, P.; Narayanan, T.; Piazzesi, G.; Lombardi, V.; Irving, M. Structural Changes in Myosin Motors and Filaments during Relaxation of Skeletal Muscle. J. Physiol. 2009, 587, 4509–4521. [Google Scholar] [CrossRef]
- Mijailovich, S.M.; Kayser-Herold, O.; Stojanovic, B.; Nedic, D.; Irving, T.C.; Geeves, M.A. Three-Dimensional Stochastic Model of Actin–Myosin Binding in the Sarcomere Lattice. J. Gen. Physiol. 2016, 148, 459–488. [Google Scholar] [CrossRef]
- Cazorla, O.; Wu, Y.; Irving, T.C.; Granzier, H. Titin-Based Modulation of Calcium Sensitivity of Active Tension in Mouse Skinned Cardiac Myocytes. Circ. Res. 2001, 88, 1028–1035. [Google Scholar] [CrossRef]
- Mijailovich, S.M.; Stojanovic, B.; Nedic, D.; Svicevic, M.; Geeves, M.A.; Irving, T.C.; Granzier, H.L. Nebulin and Titin Modulate Cross-Bridge Cycling and Length-Dependent Calcium Sensitivity. J. Gen. Physiol. 2019, 151, 680–704. [Google Scholar] [CrossRef]
- Herzog, W.; Lee, E.J.; Rassier, D.E. Residual Force Enhancement in Skeletal Muscle. J. Physiol. 2006, 574, 635–642. [Google Scholar] [CrossRef] [PubMed]
- Lombardi, V.; Piazzesi, G. The Contractile Response during Steady Lengthening of Stimulated Frog Muscle Fibres. J. Physiol. 1990, 431, 141–171. [Google Scholar] [CrossRef] [PubMed]
- Månsson, A. Tension Transients in Skeletal Muscle Fibres of the Frog at Varied Tonicity of the Extracellular Medium. J. Muscle Res. Cell Motil. 1993, 14, 15–25. [Google Scholar] [CrossRef]
- DuVall, M.M.; Gifford, J.L.; Amrein, M.; Herzog, W. Altered Mechanical Properties of Titin Immunoglobulin Domain 27 in the Presence of Calcium. Eur. Biophys. J. 2013, 42, 301–307. [Google Scholar] [CrossRef] [PubMed]
- Joumaa, V.; Rassier, D.E.; Leonard, T.R.; Herzog, W. The Origin of Passive Force Enhancement in Skeletal Muscle. Am. J. Physiol. Cell Physiol. 2008, 294, C74–C78. [Google Scholar] [CrossRef]
- Labeit, D.; Watanabe, K.; Witt, C.; Fujita, H.; Wu, Y.; Lahmers, S.; Funck, T.; Labeit, S.; Granzier, H. Calcium-Dependent Molecular Spring Elements in the Giant Protein Titin. Proc. Natl. Acad. Sci. USA 2003, 100, 13716–13721. [Google Scholar] [CrossRef]
- Tatsumi, R.; Maeda, K.; Hattori, A.; Takahashi, K. Calcium Binding to an Elastic Portion of Connectin/Titin Filaments. J. Muscle Res. Cell Motil. 2001, 22, 149–162. [Google Scholar] [CrossRef]
- Kellermayer, M.S.; Granzier, H.L. Elastic Properties of Single Titin Molecules Made Visible through Fluorescent F-Actin Binding. Biochem. Biophys. Res. Commun. 1996, 221, 491–497. [Google Scholar] [CrossRef]
- Linke, W.A.; Ivemeyer, M.; Labeit, S.; Hinssen, H.; Ruegg, J.C.; Gautel, M. Actin-Titin Interaction in Cardiac Myofibrils: Probing a Physiological Role. Biophys. J. 1997, 73, 905–919. [Google Scholar] [CrossRef]
- Dutta, S.; Tsiros, C.; Sundar, S.L.; Athar, H.; Moore, J.; Nelson, B.; Gage, M.J.; Nishikawa, K. Calcium Increases Titin N2A Binding to F-Actin and Regulated Thin Filaments. Sci. Rep. 2018, 8, 14575. [Google Scholar] [CrossRef]
- Irving, T.C.; Wu, Y.; Bekyarova, T.; Farman, G.P.; Fukuda, N.; Granzier, H. Thick-Filament Strain and Interfilament Spacing in Passive Muscle: Effect of Titin-Based Passive Tension. Biophys. J. 2011, 100, 1499–1508. [Google Scholar] [CrossRef] [PubMed]
- Hessel, A.L.; Monroy, J.A.; Nishikawa, K.C. Non-Cross Bridge Viscoelastic Elements Contribute to Muscle Force and Work During Stretch-Shortening Cycles: Evidence From Whole Muscles and Permeabilized Fibers. Front. Physiol. 2021, 12, 648019. [Google Scholar] [CrossRef] [PubMed]
- Cooke, R.; Pate, E. The Effects of ADP and Phosphate on the Contraction of Muscle Fibers. Biophys. J. 1985, 48, 789–798. [Google Scholar] [CrossRef]
- Edman, K.A.; Caputo, C.; Lou, F. Depression of Tetanic Force Induced by Loaded Shortening of Frog Muscle Fibres. J. Physiol. 1993, 466, 535–552. [Google Scholar]
- Fischetti, R.; Stepanov, S.; Rosenbaum, G.; Barrea, R.; Black, E.; Gore, D.; Heurich, R.; Kondrashkina, E.; Kropf, A.J.; Wang, S.; et al. The BioCAT Undulator Beamline 18ID: A Facility for Biological Non-Crystalline Diffraction and X-ray Absorption Spectroscopy at the Advanced Photon Source. J. Synchrotron Rad. 2004, 11, 399–405. [Google Scholar] [CrossRef]
- Irving, T.C.; Konhilas, J.; Perry, D.; Fischetti, R.; de Tombe, P.P. Myofilament Lattice Spacing as a Function of Sarcomere Length in Isolated Rat Myocardium. Am. J. Physiol. Heart Circ. Physiol. 2000, 279, H2568–H2573. [Google Scholar] [CrossRef]
- Jiratrakanvong, J.; Shao, J.; Menendez, M.; Li, X.; Li, J.; Ma, W.; Agam, G.; Irving, T. MuscleX: Software Suite for Diffraction X-ray Imaging V1. 13.1; BioCAT: Chicago, IL, USA, 2018. [Google Scholar]


Publisher’s Note: MDPI stays neutral with regard to jurisdictional claims in published maps and institutional affiliations. |
© 2021 by the authors. Licensee MDPI, Basel, Switzerland. This article is an open access article distributed under the terms and conditions of the Creative Commons Attribution (CC BY) license (https://creativecommons.org/licenses/by/4.0/).
Share and Cite
Joumaa, V.; Smith, I.C.; Fukutani, A.; Leonard, T.R.; Ma, W.; Mijailovich, S.M.; Irving, T.C.; Herzog, W. Effect of Active Lengthening and Shortening on Small-Angle X-ray Reflections in Skinned Skeletal Muscle Fibres. Int. J. Mol. Sci. 2021, 22, 8526. https://doi.org/10.3390/ijms22168526
Joumaa V, Smith IC, Fukutani A, Leonard TR, Ma W, Mijailovich SM, Irving TC, Herzog W. Effect of Active Lengthening and Shortening on Small-Angle X-ray Reflections in Skinned Skeletal Muscle Fibres. International Journal of Molecular Sciences. 2021; 22(16):8526. https://doi.org/10.3390/ijms22168526
Chicago/Turabian StyleJoumaa, Venus, Ian C. Smith, Atsuki Fukutani, Timothy R. Leonard, Weikang Ma, Srboljub M. Mijailovich, Thomas C. Irving, and Walter Herzog. 2021. "Effect of Active Lengthening and Shortening on Small-Angle X-ray Reflections in Skinned Skeletal Muscle Fibres" International Journal of Molecular Sciences 22, no. 16: 8526. https://doi.org/10.3390/ijms22168526
APA StyleJoumaa, V., Smith, I. C., Fukutani, A., Leonard, T. R., Ma, W., Mijailovich, S. M., Irving, T. C., & Herzog, W. (2021). Effect of Active Lengthening and Shortening on Small-Angle X-ray Reflections in Skinned Skeletal Muscle Fibres. International Journal of Molecular Sciences, 22(16), 8526. https://doi.org/10.3390/ijms22168526