Article

Asymmetric Solvation of the Zinc Dimer Cation Revealed by Infrared Multiple Photon Dissociation Spectroscopy of Zn2+(H2O)n (n = 1–20)

Institut für Ionenphysik und Angewandte Physik, Universität Innsbruck, Technikerstraße 25, 6020 Innsbruck, Austria
*
Authors to whom correspondence should be addressed.
These authors contributed equally to this work.
Int. J. Mol. Sci. 2021, 22(11), 6026; https://doi.org/10.3390/ijms22116026
Submission received: 28 April 2021 / Revised: 20 May 2021 / Accepted: 26 May 2021 / Published: 2 June 2021
(This article belongs to the Special Issue Spectroscopic Probes of Ion-Molecule Interactions in the Gas Phase)

Abstract

:
Investigating metal-ion solvation—in particular, the fundamental binding interactions—enhances the understanding of many processes, including hydrogen production via catalysis at metal centers and metal corrosion. Infrared spectra of the hydrated zinc dimer (Zn2+(H2O)n; n = 1–20) were measured in the O–H stretching region, using infrared multiple photon dissociation (IRMPD) spectroscopy. These spectra were then compared with those calculated by using density functional theory. For all cluster sizes, calculated structures adopting asymmetric solvation to one Zn atom in the dimer were found to lie lower in energy than structures adopting symmetric solvation to both Zn atoms. Combining experiment and theory, the spectra show that water molecules preferentially bind to one Zn atom, adopting water binding motifs similar to the Zn+(H2O)n complexes studied previously. A lower coordination number of 2 was observed for Zn2+(H2O)3, evident from the highly red-shifted band in the hydrogen bonding region. Photodissociation leading to loss of a neutral Zn atom was observed only for n = 3, attributed to a particularly low calculated Zn binding energy for this cluster size.

1. Introduction

Metal–metal bonds have received much interest over the years; however, homonuclear metal bonds have received particular attention. There have been numerous experimental and theoretical studies on homonuclear transition metal dimers, including Zn2, with particular attention on the nature of the metal–metal bonding [1,2,3,4,5,6,7,8,9,10,11,12,13,14,15,16,17,18,19,20,21,22,23,24,25]. Atomic zinc, a group-12 metal, has an electron configuration of [Ar]3d104s2, and because of its closed d-shell, it is often not considered a transition metal. Many chemical and spectroscopic properties of zinc are more similar to those of the alkaline earth metals when compared to other transition metals [26].
As Zn has a closed electronic configuration, the neutral dimer, Zn2, is only bound by weak van der Waals interactions [3]. Whereas the Zn2 anion is considered to be unstable towards autodetachment [7]. The first compound containing a stable Zn–Zn bond came from the synthesis of decamethyldizincocene in 2004, which was heralded a “new frontier” for the Zn–Zn bond quoting a bond distance of 2.305 Å from X-ray measurements [17,27]. Andrews and co-workers employed matrix isolation to study HZnZnH, the infrared spectra of which were consistent with two equivalent Zn atoms [28]. Later, the same group discovered that the Zn–Zn bond can be stabilized by different isomeric forms of the same ligand: cyanide and isocyanide [29].
In 1988, Buckner et al. investigated the Zn2+ cation in the gas phase and discussed an ion-induced dipole bonding interaction between the two Zn atoms vs. covalent bonding with a bond order of one half [4]. Further reactivity investigations from the same study by Buckner showed that the Zn2+ displays rapid displacement of Zn, forming Zn+–molecule complexes, consistent with a weak binding interaction in Zn2+ [4]. In 2003, Gutsev et al. computed electronic and geometrical structures of homonuclear 3d neutral metal dimers, as well as the cations and anions [7]. Their results confirmed the suggestion of a 4s–4s bond in Zn2+, reporting a bond length of 2.60 Å and a value for the dissociation energy D0(Zn+–Zn) of 1.73 eV. In 2019, Tarento et al. conducted a theoretical study on charge localization in small group 12 clusters and found that Znn+ (2 ≤ n ≤ 7) clusters have a regular, compact shape, with charge delocalized over the whole cluster [24]. A study on the fragmentation patterns of Zn2Ln+ (L = pyrrole and furan, n = 1–5) was performed in 2005 by Wu et al. observing that the primary fragmentation routes are either the loss of a neutral Zn atom or loss of a single ligand molecule [12]. The loss of the neutral Zn atom becomes less likely with increasing ligand number, which the authors rationalize as decreasing ligand binding energy. More recently, the possibility of Zn=Zn double bonds in certain complexes has become an interest in theoretical chemistry [30,31].
In this work we present an infrared spectroscopic study of hydrated zinc dimer ions, Zn2+(H2O)n. Studying hydrated metal ions in the gas phase provides the opportunity to investigate solvation at a molecular level and to study various chemical processes such as hydrogen production via catalysis at metal centers [32] and corrosion effects [33] in a well-defined environment. Our group has an extended history in studying these systems [34,35,36,37,38,39,40,41,42,43,44,45,46,47,48,49,50,51]. Infrared action spectroscopy, coupled with quantum chemical calculations, is a powerful technique used to investigate the structures of gas-phase molecular complexes, [52,53,54,55,56,57,58,59,60] in particular hydrated metal ions [61,62,63,64,65,66,67,68,69]. We recently published a study investigating hydrated zinc monomer ions Zn+(H2O)n with up to 35 water molecules, [70] where we found evidence for surface solvation of Zn+, which was previously established by Duncan and co-workers for n ≤ 4 [71]. Here we investigate the solvation evolution of the zinc dimer cation up to 20 water molecules utilizing infrared multiple photon dissociation (IRMPD) spectroscopy. The focus of this study is to investigate how water molecules bind to Zn2+. Do water molecules bind symmetrically to both Zn atoms, or do they preferentially bind to one Zn atom, and at which cluster sizes are different binding sites observed? By size-selecting each complex, a detailed investigation answering such questions can be carried out. To the best of our knowledge, this is the first experimental IRMPD study on hydrated metal dimers. Going to large cluster sizes up to 20 water molecules, the evolution of infrared spectra with increasing cluster size is a first step towards understanding metal dimer solvation.

2. Results and Discussion

Infrared spectra of size-selected clusters were recorded via action spectroscopy, Reaction (1):
Zn 2 + ( H 2 O ) n + m   h ν Zn 2 + ( H 2 O ) n x + x ( H 2 O )
However, for n = 3, a competing fragmentation channel was observed; photodissociation of the neutral zinc atom is represented by Reaction (2):
Zn 2 + ( H 2 O ) 3 + m   h ν Zn + ( H 2 O ) 3 + Zn
Very weak photodissociation of neutral Zn + (H2O) was also observed for n = 4, most likely in a sequential reaction, initial H2O evaporation followed by Zn loss upon absorption of further IR photons. Figure 1 shows the experimental IRMPD photodissociation spectra of size-selected zinc dimer water complexes (Zn2+(H2O)n; n = 1–8, 10, 16, and 20), assuming a one-photon process for the calculated cross-sections. At least for the larger clusters, this is realistic, since the photon energy is close to the typical binding energy of a water molecule in water clusters—0.45 eV [72,73]. The spectrum of the smallest cluster, n = 1, presents one band centered at 3580 cm−1. For n = 2, the experimental spectrum is different to that of monatomic Zn+(H2O)2, investigated previously [70]. In the case of the dimer, there is a weak and broad red-shifted band at 2965 cm−1, along with an intense narrow band at 3590 cm−1, presenting a shoulder at 3680 cm−1. The n = 3 complex presents two different photodissociation channels: (i) loss of intact water molecules and (ii) loss of a neutral Zn atom (Figure 1, blue and red spectra, respectively). Both channels present similar spectra, showing two intense bands at 3110 and 3680 cm−1, with a weak feature centered at 3445 cm−1 (blue) and 3460 cm−1 (red). At n = 4, the most intense band is the red-shifted band centered at 3210 cm−1, along with weaker features centered at 3490 and 3710 cm−1. Similar to the zinc monomer–water complexes, [70] the bands at cluster sizes as low as n = 4 present increased spectral broadening, which signifies several isomers contributing to the experimental spectrum. A broad, unresolved red-shifted band at 3230 cm−1, along with a shoulder at 3270 cm−1 is presented for n = 5. This red-shifted feature decreases in red-shift upon increasing cluster size, from 3240 cm−1 for n = 6−10, before red-shifting to 3220 cm−1 for n = 16 and 20. The shoulder feature at 3270 cm−1 for n = 5 also decreases in red-shift upon addition of water molecules from 3320 cm−1 in n = 6 to the broad, unresolved feature centered at 3470 cm−1 for n = 20.
Similar to the monatomic zinc water complexes [70], all cluster sizes present a band between the symmetric and asymmetric O–H stretching regions, starting as a weak feature at 3710 cm−1 for n = 1, a shoulder at 3680 cm−1 for n = 2, increasing in intensity to a band at 3680 cm−1 for n = 3, and staying within 3690–3710 cm−1 for n = 4–20. Table 1 presents the experimental IRMPD bands for all cluster sizes, with most bands red-shifted from the symmetric and asymmetric O–H bands of isolated water [74].

2.1. Zn2+(H2O)1–6

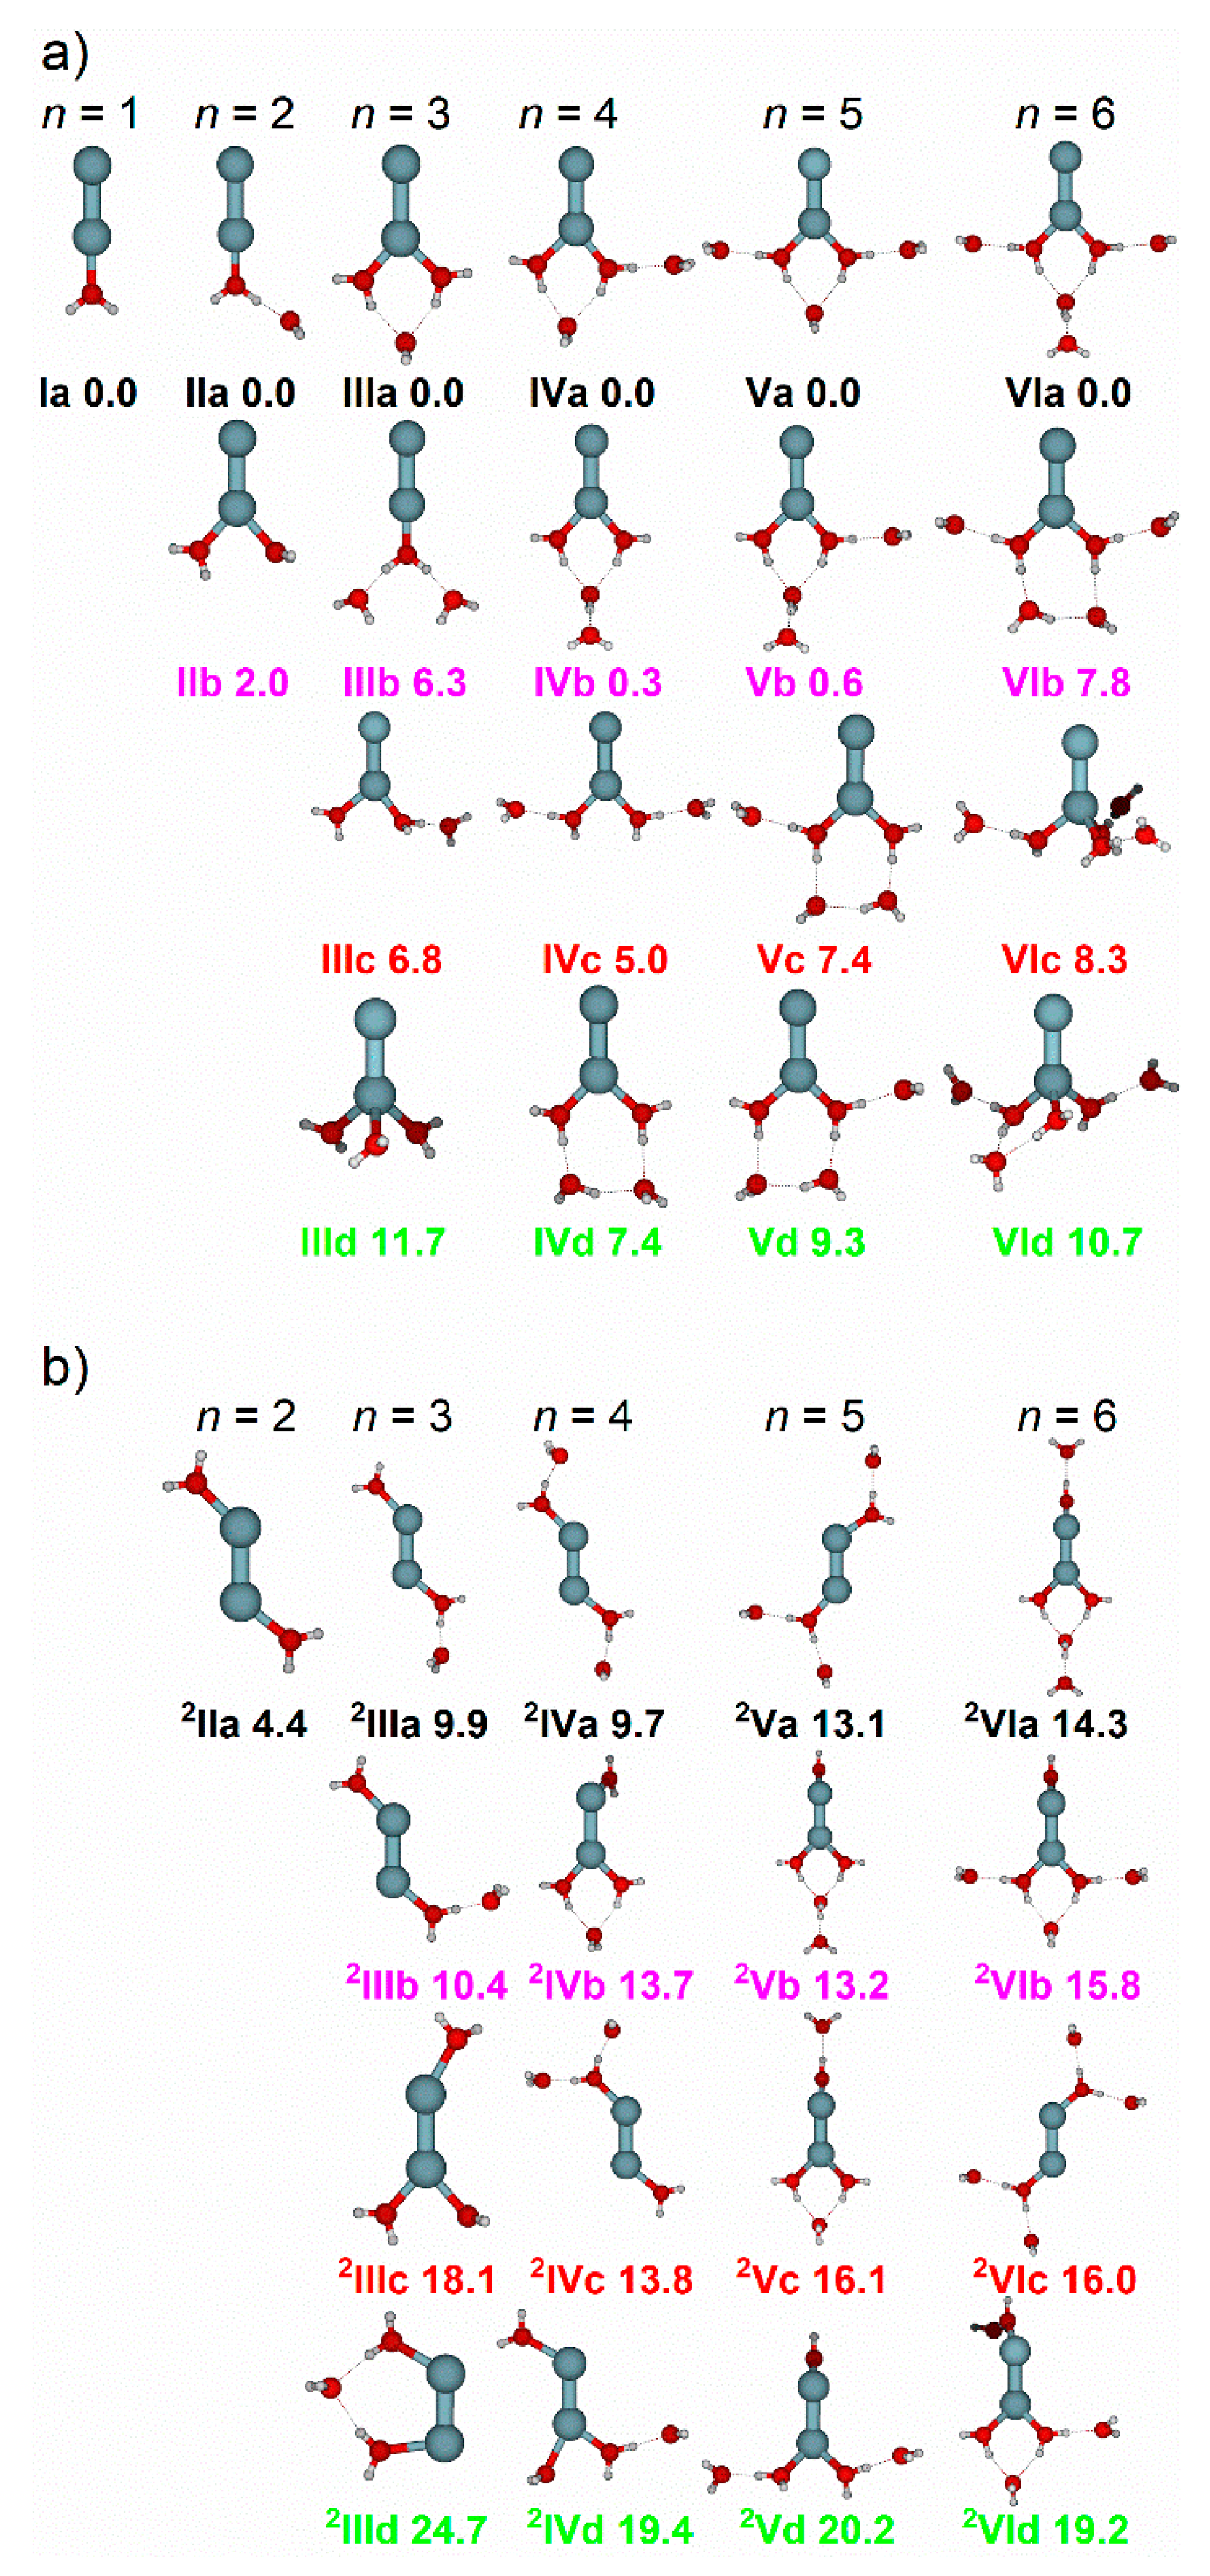
To support the IRMPD spectra, density functional theory calculations were performed in search of low-lying isomers for cluster sizes n = 1–6. For all cluster sizes, isomers were selected where water molecules are coordinated to either (a) one Zn atom or (b) both Zn atoms, as shown in Figure 2. For clarity, Roman Numerals are used to denote the cluster size, letters the energetic ordering, and a number to denote the number of zinc atoms coordinated. Using n = 2 as an example, IIa denotes the lowest-lying isomer with water molecules coordinated to one Zn atom, and 2IIa to both Zn atoms. Throughout the discussion, water binding motifs are also labelled. Water molecules which are directly bound to Zn are denoted core water molecules. Outer water molecules can bind to core water molecules via single, or double hydrogen bonds, denoted single acceptor (SA) and double acceptor (DA) motifs, respectively. Other binding motifs (shown schematically in Supplementary Materials Schemes S1–S3) are also outlined, including S*A, whereby the core water molecule is bound to a single outer water molecule, but also involved in a double-acceptor configuration. Moreover, oDA denotes the “outer” double-acceptor motif, whereby the outer water molecule in a DA motif is bound to another outer water. The “outer” single-acceptor motif (oSA) denotes the O–H stretch in the outer water, and D*A an outer water bound to oSA and a core water. Water binding motifs have been outlined previously [70]. Each binding motif absorbs at a characteristic frequency, as shown by Johnson and co-workers [75].

2.1.1. H2O Coordinated to One Zn Atom

Figure 3a–f presents the experimental photodissociation spectra of cluster sizes n = 1–6, along with the simulated spectra of low-lying isomers, with water molecules bound to one Zn atom in the Zn2+ dimer. For every cluster size, n = 1–6, (with the exception of IIId) the lowest-lying isomers have water molecules coordinated to one zinc atom. In this sense, one could expect that the water molecules will solvate one zinc atom in a similar fashion to the monatomic complexes, Zn+(H2O)n [70]. However, taking n = 3 as an example, the addition of the Zn atom to Zn+(H2O)3 (forming Zn2+(H2O)3) changes the energetic ordering of isomers, shown in Figure 2a. In the case of Zn+(H2O)3, all three water molecules are directly bound to the central Zn atom, representing the lowest energy structure found. For Zn2+(H2O)3, this analogue (isomer IIId, Figure 2a) lies 11.7 kJ mol−1 above the putative global minimum, which presents a coordination number of two (isomer IIIa). Interestingly, isomer IIIb, presenting one core and two outer water molecules, is the second lowest lying isomer (+6.3 kJ mol−1). In contrast, this analogue in Zn+(H2O)3 was calculated to lie 22.3 kJ mol−1 above the global minimum. These energetic differences between monatomic and dimer water complexes are observed in sizes n = 2–6, and are reflected in the observed IRMPD spectra. For the low-lying calculated isomers n = 4–6 in Figure 2a, the range of energies is much greater when compared to their monatomic counterparts. This signifies that the addition of the second zinc atom not only changes the energetic ordering of the isomers, but also increases the energy differences between them.
For n = 1 (Figure 3a) only one isomer is considered, where the water molecule is bound to one Zn atom, adopting a C2v configuration (Figure 2a, isomer Ia). The simulated spectrum of Ia presents two bands: one weak centered at 3568 cm−1, and one strong centered at 3670 cm−1, representing the symmetric and asymmetric stretches of water, respectively. These bands agree with the experimental band at 3580 cm−1, along with the weak shoulder at 3710 cm−1. However, the IRMPD band at 3580 cm−1 is strong and sharp, whereas the band at 3710 cm−1 is weak and broad. This is most likely an IRMPD effect, since two photons are typically required to dissociate Zn+(H2O), with a binding energy of 85 kJ mol−1. In this small system, intramolecular vibrational energy redistribution (IVR) is difficult. We may speculate that IVR works well for the symmetric band, so that both the first and second photon are absorbed in the vibrational ground state of the band, while IVR is accidentally hindered due to the sparse density of states for the asymmetric stretch. In this case, either the band position shifts due to anharmonicity from the fundamental to the hot band excitation, or the system cools by IR emission. Both effects can explain the experimental spectrum.
In the case of n = 2, two isomers are considered, IIa and IIb. Different to the case of the zinc monomer reported previously, [70] for the zinc dimer, the putative global minimum structure shows an outer water molecule adopting a single-acceptor (SA) configuration, binding to the core water molecule via a single hydrogen bond. This is also reflected in the IRMPD spectrum, Figure 3b, showing a weak, highly red-shifted feature centered at 2965 cm−1, the signature of the SA motif in isomer IIa. No such red-shifted bands were observed in the monomer analogue, Zn+(H2O)2 [70]. It should be noted that isomers of n = 2 calculated at the CCSD/aug-cc-pVDZ//B3LYP/aug-cc-pVDZ level show that the 2-coordinate structure (IIb) is the lower-lying isomer by 6.5 kJ mol−1. Two more weaker bands are presented for isomer IIa at 3651 and 3726 cm−1, assigned to the localized core “free” O–H stretch and asymmetric outer O–H stretch, respectively. These bands are in reasonable agreement with the broad feature centered at 3680 cm−1. Isomer IIb presents one band at 3580 cm−1, along with two stronger bands at 3673 and 3695 cm−1, due to the symmetric O–H stretch and localized asymmetric O–H stretches of the two core water molecules, respectively. Similar to Zn+(H2O)2, the observed spectrum shows more intense symmetric O–H bands relative to the asymmetric O–H bands, along with increased broadening of the asymmetric bands. As described before, [70] we attribute these observations to the IRMPD process, whereby the first absorbed photon heats the cluster, exciting internal rotations of the water molecules and, potentially, the O–Zn–O bending mode. This assumes that the asymmetric stretch is sensitive to the relative positions of the water molecules, explaining the reduced intensity and band broadening. However, the symmetric stretch remains sharp, implying this band is less sensitive to this effect. Thus, with these observed bands, along with the red-shifted feature at 2965 cm−1, the IRMPD spectrum is composed of contributions from both isomers, IIa and IIb.
Figure 3c shows the IRMPD spectrum of n = 3, along with the simulated spectra of the four lowest lying isomers, with water coordinated to one Zn atom, IIIaIIId. The intense band at 3110 cm−1 is in good agreement with the simulated bands at 3105 cm−1 (IIIc; isolated O–H stretch of the core water) and 3129 cm−1 (IIIb; symmetric O–H stretch of the core water) assigned to the SA motif. This observed band shows a shoulder at 3160 cm−1, presenting excellent agreement with the asymmetric O–H stretch in the core water in isomer IIIb at 3164 cm−1. Isomer IIIa presents an intense band at 3427 cm−1, a weaker band at 3387 cm−1 assigned as the in-phase, and out-of-phase core water molecules in the DA motif, respectively. These two bands are in good agreement with the broad experimental feature, displaying a maximum centered at 3445 cm−1. Spectral signatures of DA motifs were unobserved in Zn+(H2O)3. The strong band at 3680 cm−1 is in agreement with the simulated bands at 3680 cm−1 (IIIa; O–H core water), 3686 cm−1 (IIId; O–H core water), 3646 cm−1 (IIIc; isolated O–H stretch of core water within the SA motif), 3701 cm−1 (IIIc; asymmetric stretch of isolated core water), and 3730 cm−1 (IIIc; asymmetric stretch of outer water). Given that isomer IIId is calculated to lie 11.7 kJ mol−1 above IIIa, it is more likely that isomers IIIaIIIc are higher in abundance and contribute more to the overall IRMPD spectrum.
The IRMPD spectrum for n = 4, along with the simulated spectra of low-lying isomers IVaIVd, are shown in Figure 3d. Evidence of more SA and DA signatures are observed, reflected as band broadening of the former along with an increase in relative intensity for the latter. For n ≥ 4, it is more informative to discuss the spectra in terms of binding motifs, rather than individual isomers. Water binding motifs are outlined in the supplementary material. The strong, broad band at 3210 cm−1 is in good agreement with SA and an outer water bound to a double acceptor site (oDA) binding motifs in isomers IVaIVc.
The very broad feature centered at 3490 cm−1 matches the absorption of the DA binding motif in isomer IVa. The broad band at 3710 cm−1 presents satisfactory agreement with the simulated bands from isolated core, and outer waters in oDA, DA and S*A motifs present in isomers IVaIVc. As observed, the simulated spectra in this wavelength region, between the symmetric and asymmetric stretches of isolated water (3657 and 3756 cm−1), become spectrally congested. Thus, this region is less diagnostic when assigning particular isomers and water binding motifs. Based on the red-shifted bands below 3650 cm−1, i.e., the spectral signatures of DA and SA motifs, the observed spectrum is composed of contributions from isomers IVaIVc.
Figure 3e shows the IRMPD spectrum of n = 5, along with the simulated spectra of low-lying isomers VaVd. Similar to the IRMPD spectrum of n = 4, the observed spectrum of n = 5 shows an intense red-shifted broad band centered at 3230 cm−1, along with an intense shoulder at 3270 cm−1. The intense feature is in good agreement with SA motifs in Va and Vb, and with the oDA motif in Vb. A DA/oDA combination band in Vb agrees with the shoulder at 3270 cm−1. The S*A motif in Vc is also in good agreement, however the red-shifted band at 3050 cm−1 (core oSA) presents less clear agreement. Another band at 3445 cm−1 (O–H stretch of outer water in oSA) in Vc shows some agreement, and could contribute to the overall broad region between the observed bands at 3230 and 3490 cm−1. The SA signature at 3278 cm−1 in isomer Vd is also in good agreement with the observed band at 3270 cm−1; however, the simulated band at 3183 cm−1 (core oSA) presents less agreement. Signatures of DA motifs in Va also fit with the observed bands at 3490 and 3540 cm−1. Outer single acceptor (oSA) motifs in Vc and Vd present agreement with the band at 3540 cm−1. All four isomers VaVd present bands within the observed features between 3230 and 3540 cm−1, assigned to SA, DA, oDA, and oSA binding motifs. The observed bands show an onset starting at ca. 3010 cm−1, which could be due to the most red-shifted band at 3050 cm−1 in isomer Vc (core O–H bound to the oSA motif). Isomer Vc is calculated to lie 7.4 kJ mol−1 above isomer Va, so will give a minor contribution to the observed spectrum, supporting the presence of the weak onset at ca. 3010 cm−1. Thus, the observed IRMPD spectrum mostly consists of isomers Va and Vb, with minor contributions from isomers Vc and Vd, along with other low-lying isomers we have not considered.
Figure 3f presents the observed spectrum for n = 6, along with simulated spectra of low-lying isomers VIaVId. The observed spectrum shows an intense band at 3320 cm−1, with a shoulder to the red at 3240 cm−1. Based on spectral assignments of Zn+(H2O)n, n = 2–6, [70] along with n = 2–5 in this study, this would imply a lower abundance of isomers with SA waters (most red-shifted), and a higher abundance of isomers with S*A waters (second most red-shifted). This assignment is supported when considering the strong out-of-phase S*A signature in VIa at 3283 cm−1. Another strong band at 3285 cm−1, the oDA signature, is also present in isomer VIa. DA signatures in VIa are in reasonable agreement with the observed broad feature between 3320 and 3445 cm−1. The most red-shifted band at 3193 cm−1 (core water bound to outer water in oSA) in VIb is in good agreement with the red-shifted shoulder at 3240 cm−1. Isomer VIb also presents bands at 3289 and 3317 cm−1 (core O–H in two SA motifs, respectively) which are in good agreement with the observed intense feature at 3320 cm−1, and two more bands at 3458 cm−1 (core bound to outer water in D*A) and 3529 cm−1 (oSA) which present good agreement with the broad features between 3445 and 3540 cm−1. The observed shoulder at 3240 cm−1 is thus assigned to the core O–H bound to oSA in isomer VIb, in addition to the same binding motif in isomers we have not considered. Given that isomer VIb is still higher-lying, calculated as 7.8 kJ mol−1 above VIa, this isomer offers a minor contribution, reflected as an observed weaker shoulder band. Isomers VIc and VId are calculated to lie above VIa at 8.3 and 10.4 kJ mol−1, respectively, so are predicted to play a minor role.
In each cluster size n = 4–6, the bands in the region between 3657 and 3756 cm−1 are due to the asymmetric O–H stretches of different water binding motifs (core, DA, oDA, SA, S*A, and oSA) giving a crowded and relatively less intense feature, thus this spectral range is less diagnostic when assigning the different binding motifs to the observed IRMPD spectrum.

2.1.2. H2O Coordinated to Both Zn Atoms

Figure 3b–f presents the experimental IRMPD spectra of cluster sizes n = 2–6 along with the simulated spectra of isomers with water molecules coordinated to both Zn atoms. The structures of these isomers are presented in Figure 2b. Beginning with n = 2, Figure 3b shows the observed IRMPD spectrum, along with the simulated spectrum of isomer 2IIa, presenting two bands at 3583 and 3687 cm−1, due to the symmetric and asymmetric O–H stretching bands, respectively. Both types of stretch are localized to one water, resulting in two pairs of bands, with each pair coalescing forming a band (two in total). These simulated bands are in good agreement with the experimental bands at 3590 and 3680 cm−1. Similar to the spectrum of IIb, the asymmetric bands are more intense than the symmetric, with the opposite shown in the experimental spectrum. The experimental IRMPD spectrum of n = 2 was assigned to contributions from isomers IIa and IIb. However, given that the spectrum for 2IIa is in good agreement with the observed spectrum, and is calculated to lie only 4.4 kJ mol−1 above IIa, we cannot rule out contributions from 2IIa.
Figure 3c shows the observed spectrum of n = 3, along with simulated spectra from isomers 2IIIa2IIId. Simulated bands at 3095 cm−1 (2IIIa, black) and 3083 cm−1 (2IIIb, magenta) agree well with the experimental band at 3110 cm−1, assigned as core O–H stretches in SA motifs. However, none of these simulated spectra can reproduce the observed feature at 3160 cm−1. Isomers 2IIIa and 2IIIb however, are in good agreement with the SA signature at 3110 cm−1, and are calculated to lie 9.9 and 10.4 kJ mol−1 above IIIa, respectively. Thus, isomers 2IIIa and 2IIIb could offer a minor contribution to the IRMPD spectrum, with major contributions from isomers IIIaIIIc.
The IRMPD spectrum, along with the simulated spectra of 2IVa2IVd, is shown for n = 4 in Figure 3d. Isomer 2IVa presents a red-shifted band at 3147 cm−1, assigned as the two equivalent SA motifs, and agrees well with the observed band at 3210 cm−1. Simulated bands at 3206 and 3252 cm−1 in 2IVc, the in-phase and out-of-phase core DA O–H stretches, respectively, present good agreement with the broad feature at 3210 cm−1. The simulated band at 3184 cm−1 in isomer 2IVd, the SA motif, is also in agreement with this observed band. Evidence of the DA signature is also presented in the simulated spectrum for 2IVb at 3452 cm−1. Though these simulated bands present agreement with the observed spectrum, isomers 2IVa2IVd lie ≥ 9.7 kJ mol−1 above IVa, so are expected to have a minor contribution to the IRMPD spectrum.
Upon addition of another water molecule, the IRMPD spectrum for n = 5, along with the simulated spectra of 2Va2Vd, is presented in Figure 3e. As observed in the simulated isomers, Figure 2b, the difference between the global minimum and the lowest-lying doubly coordinated isomer increases at five water molecules (from 9.7 kJ mol−1 in IVa and 2IVa to 13.1 kJ mol−1 in Va and 2Va). Thus, given the large energy differences between isomers VaVd and 2Va2Vd, the observed IRMPD spectrum largely consists of singly coordinated zinc isomers, namely Va and Vb, with minor contributions from other singly coordinated, as well as doubly coordinated, isomers.
The IRMPD spectrum of n = 6, along with the simulated spectra of 2VIa2VId, is presented in Figure 3f. Similar to n = 5, the doubly coordinated isomers (Figure 2b) of n = 6 are calculated to lie significantly higher than the singly coordinated isomers, at ≥14.3 kJ mol−1 above VIa. Indeed, upon increasing cluster size, the energy difference between singly and doubly coordinated isomers remains high (see Supplementary Materials Figure S8). Thus, the doubly coordinated isomers are expected to be lower in abundance and will offer a very minor contribution to the observed IRMPD spectrum for n > 5.

2.1.3. Zn Dissociation

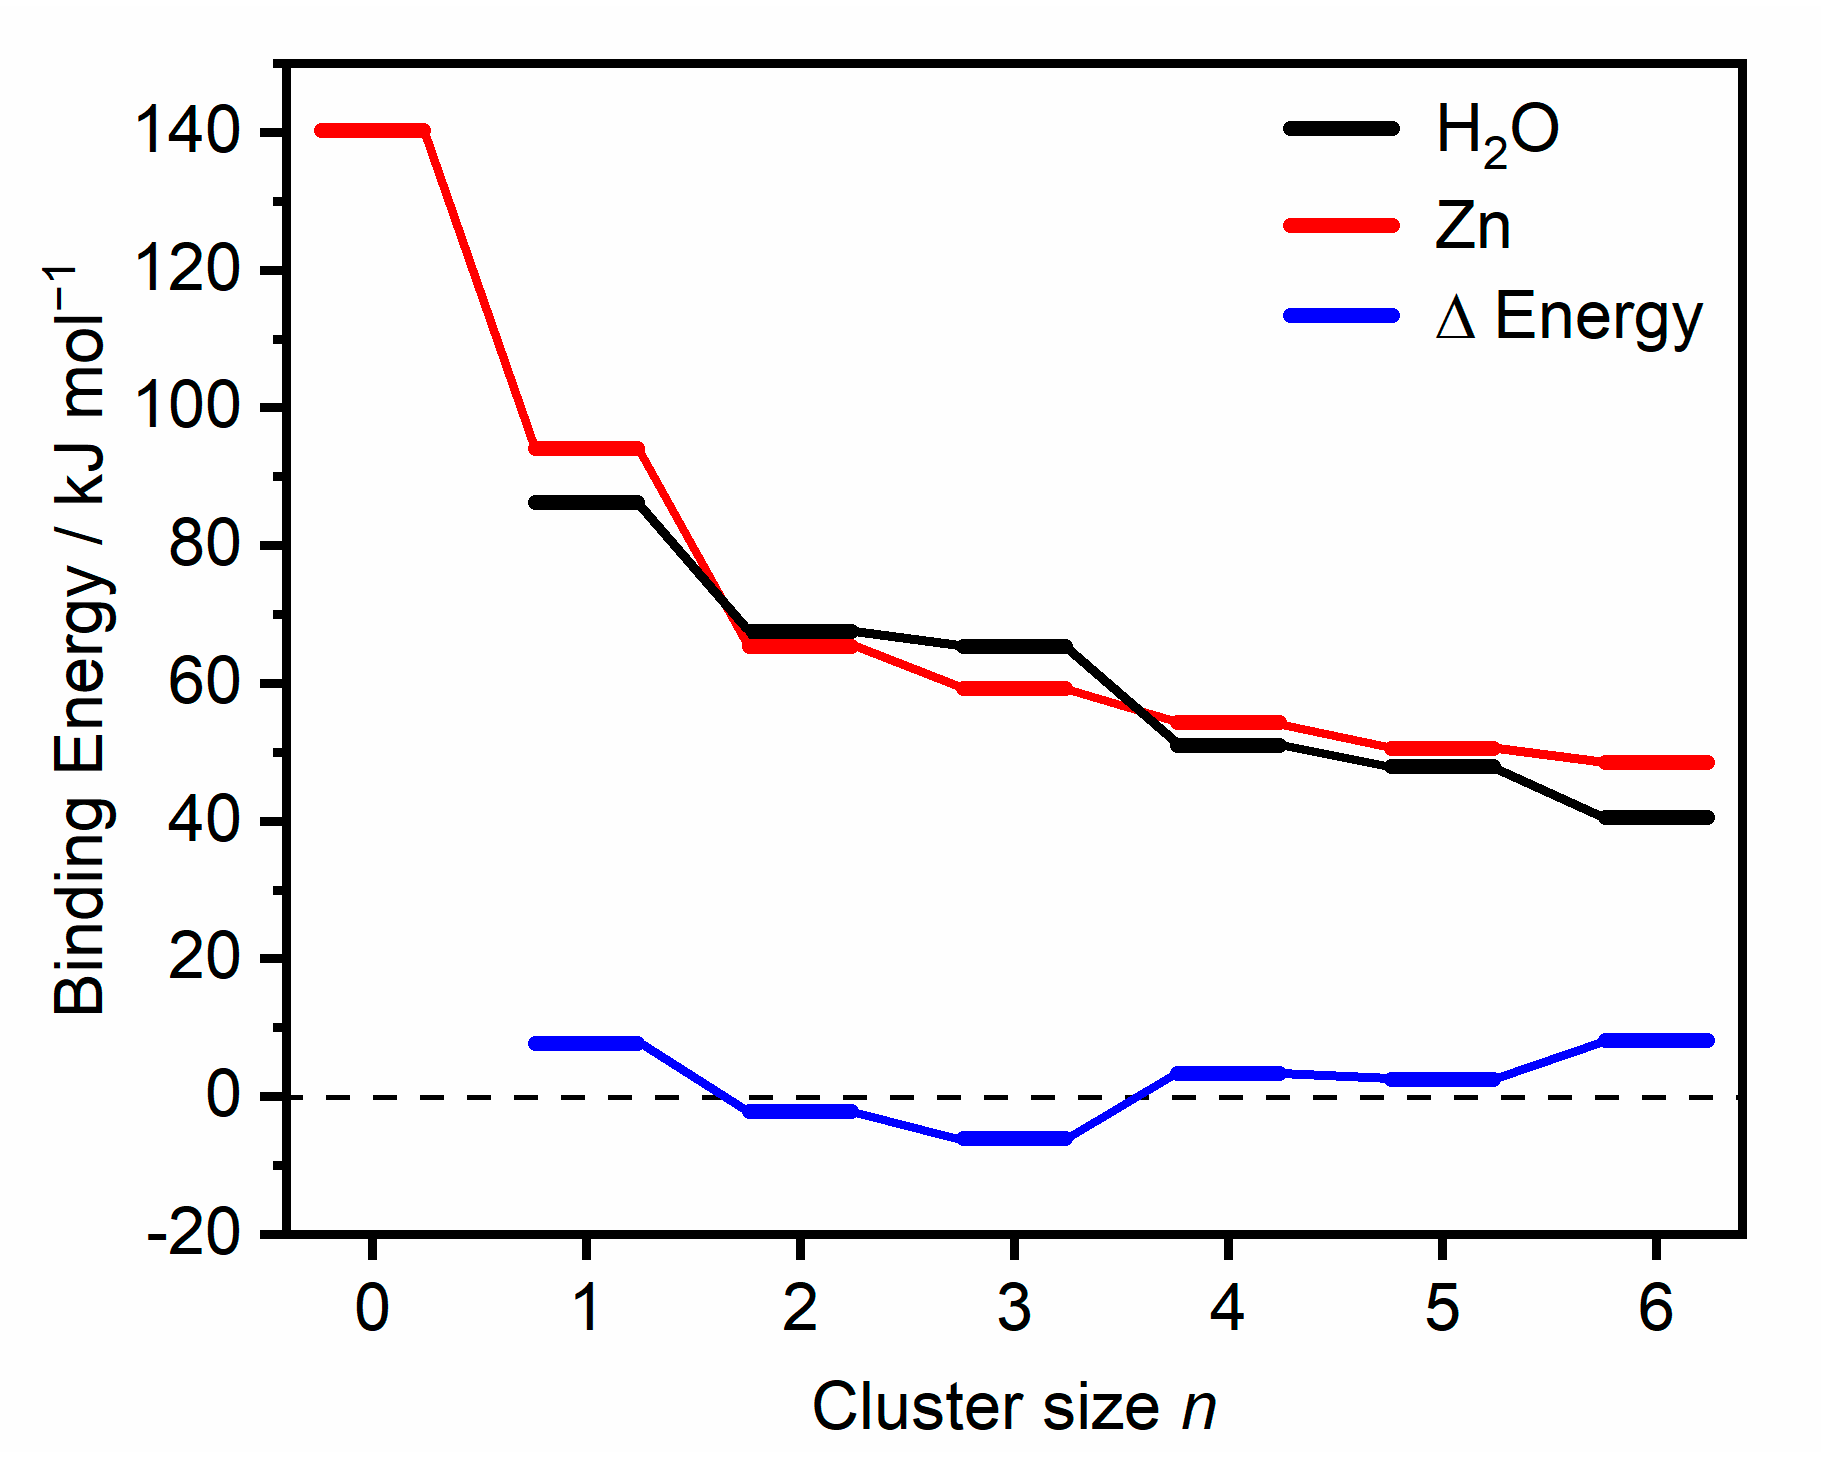
In addition to dissociation of water molecules, we also observe the loss of a neutral zinc atom for Zn2+(H2O)3 (Figure 1). This channel seems to be independent of the IR wavelength, presenting a qualitatively similar spectrum to that of water loss, only with a lower relative intensity. The main factor proposed for this observation arises when considering energetic contributions. Figure 4 presents the calculated binding energies of one neutral zinc atom and one water molecule, along with the energy difference as function of cluster size for the lowest-lying isomer in each case, calculated at the CCSD/aug-cc-pVDZ//B3LYP/aug-cc-pVDZ level. Calculated binding energies of Zn and water at the B3LYP/aug-cc-pVDZ level of theory were also carried out for comparison and are presented in the supplementary material (Supplementary Materials Figure S1). Beginning with n = 0 (i.e., Zn2+), Zn dissociation is calculated as 141 kJ mol−1 (1.46 eV), lower than the previous calculations from Gutsev [7] (1.73 eV) but higher than the experimental value of 0.56 eV by Buckner. [4] The experimental value, however, was estimated from the bond dissociation energy of the neutral dimer, which in turn was estimated from Zn vapor viscosity data, [76] and the ionization potentials of Zn and Zn2, the latter determined by gas-phase charge transfer bracketing experiments [4]. Buckner et al. also estimated the bond length of Zn2+, assuming solely ion-induced dipole bonding interactions, giving an internuclear distance of 3.00 Å, which is much higher than the Zn–Zn distance calculated by Gutsev [7] (2.60 Å) and in our calculations, 2.62 Å. The respective dissociation energy and bond length at the CCSD/aug-cc-pVDZ level, i.e., after CCSD optimization, amount to 1.46 eV and 2.62 Å, respectively. The binding in Zn2+ is most likely due to covalent bonding, primarily with 4sσ bonding character. This would imply minor contributions from 3d orbitals, yielding a bond order of 0.5 and an equal charge distribution on both Zn atoms. Similar bonding mechanisms have been proposed in collision-induced dissociation measurements of Mn2+, [77] in addition to photoelectron spectra of Cu2, [78] which is isoelectronic to Zn2+. For almost all cluster sizes the binding energy of zinc is higher than the binding energy of a water molecule, and for both Zn dissociation and water dissociation, the binding energy (BE) decreases with increasing cluster size. Blue bars in Figure 4 show the binding energy differences (BE(Zn)—BE(H2O)), which for cluster sizes n = 1 and 4–6 present a positive energy difference. Given these positive binding energy differences, we expect water dissociation dominates, which is concordant with our IRMPD spectra of n = 1 and 4–6. For cluster sizes n = 2 and 3, the binding energy of neutral Zn is lower than that of water, presenting negative energy differences (−2.1 and −6.0 kJ mol−1, respectively) in Figure 4. Subtle energy differences between the CCSD (Figure 4) and B3LYP (Supplementary Materials Figure S1) calculated binding energies are observed. Only CCSD calculations yield negative binding energy differences for n = 2 and 3. Given that we observe only water dissociation in the IRMPD spectrum of Zn2+(H2O)2, we believe that the binding energy difference is not sufficiently large in order for the Zn dissociation channel to be observed experimentally. The small binding energy difference of −2.1 kJ mol−1 in n = 2 is also within error of our calculations. For n = 3, however, the dominant channel is water dissociation, with Zn dissociation presenting a weaker, but prominent, spectrum. We attribute the appearance of the Zn channel to the binding energy difference of −6.0 kJ mol−1, which, although a weaker channel, is enough to be observed in the IRMPD spectrum. In larger clusters, n > 3, further factors suppressing the Zn dissociation channel could be attributed to the decrease in water binding energies, resulting in the dissociation of weakly bound outer shell water molecules, preferred over Zn dissociation.

2.2. Zn2+(H2O)8 and Zn2+(H2O)10

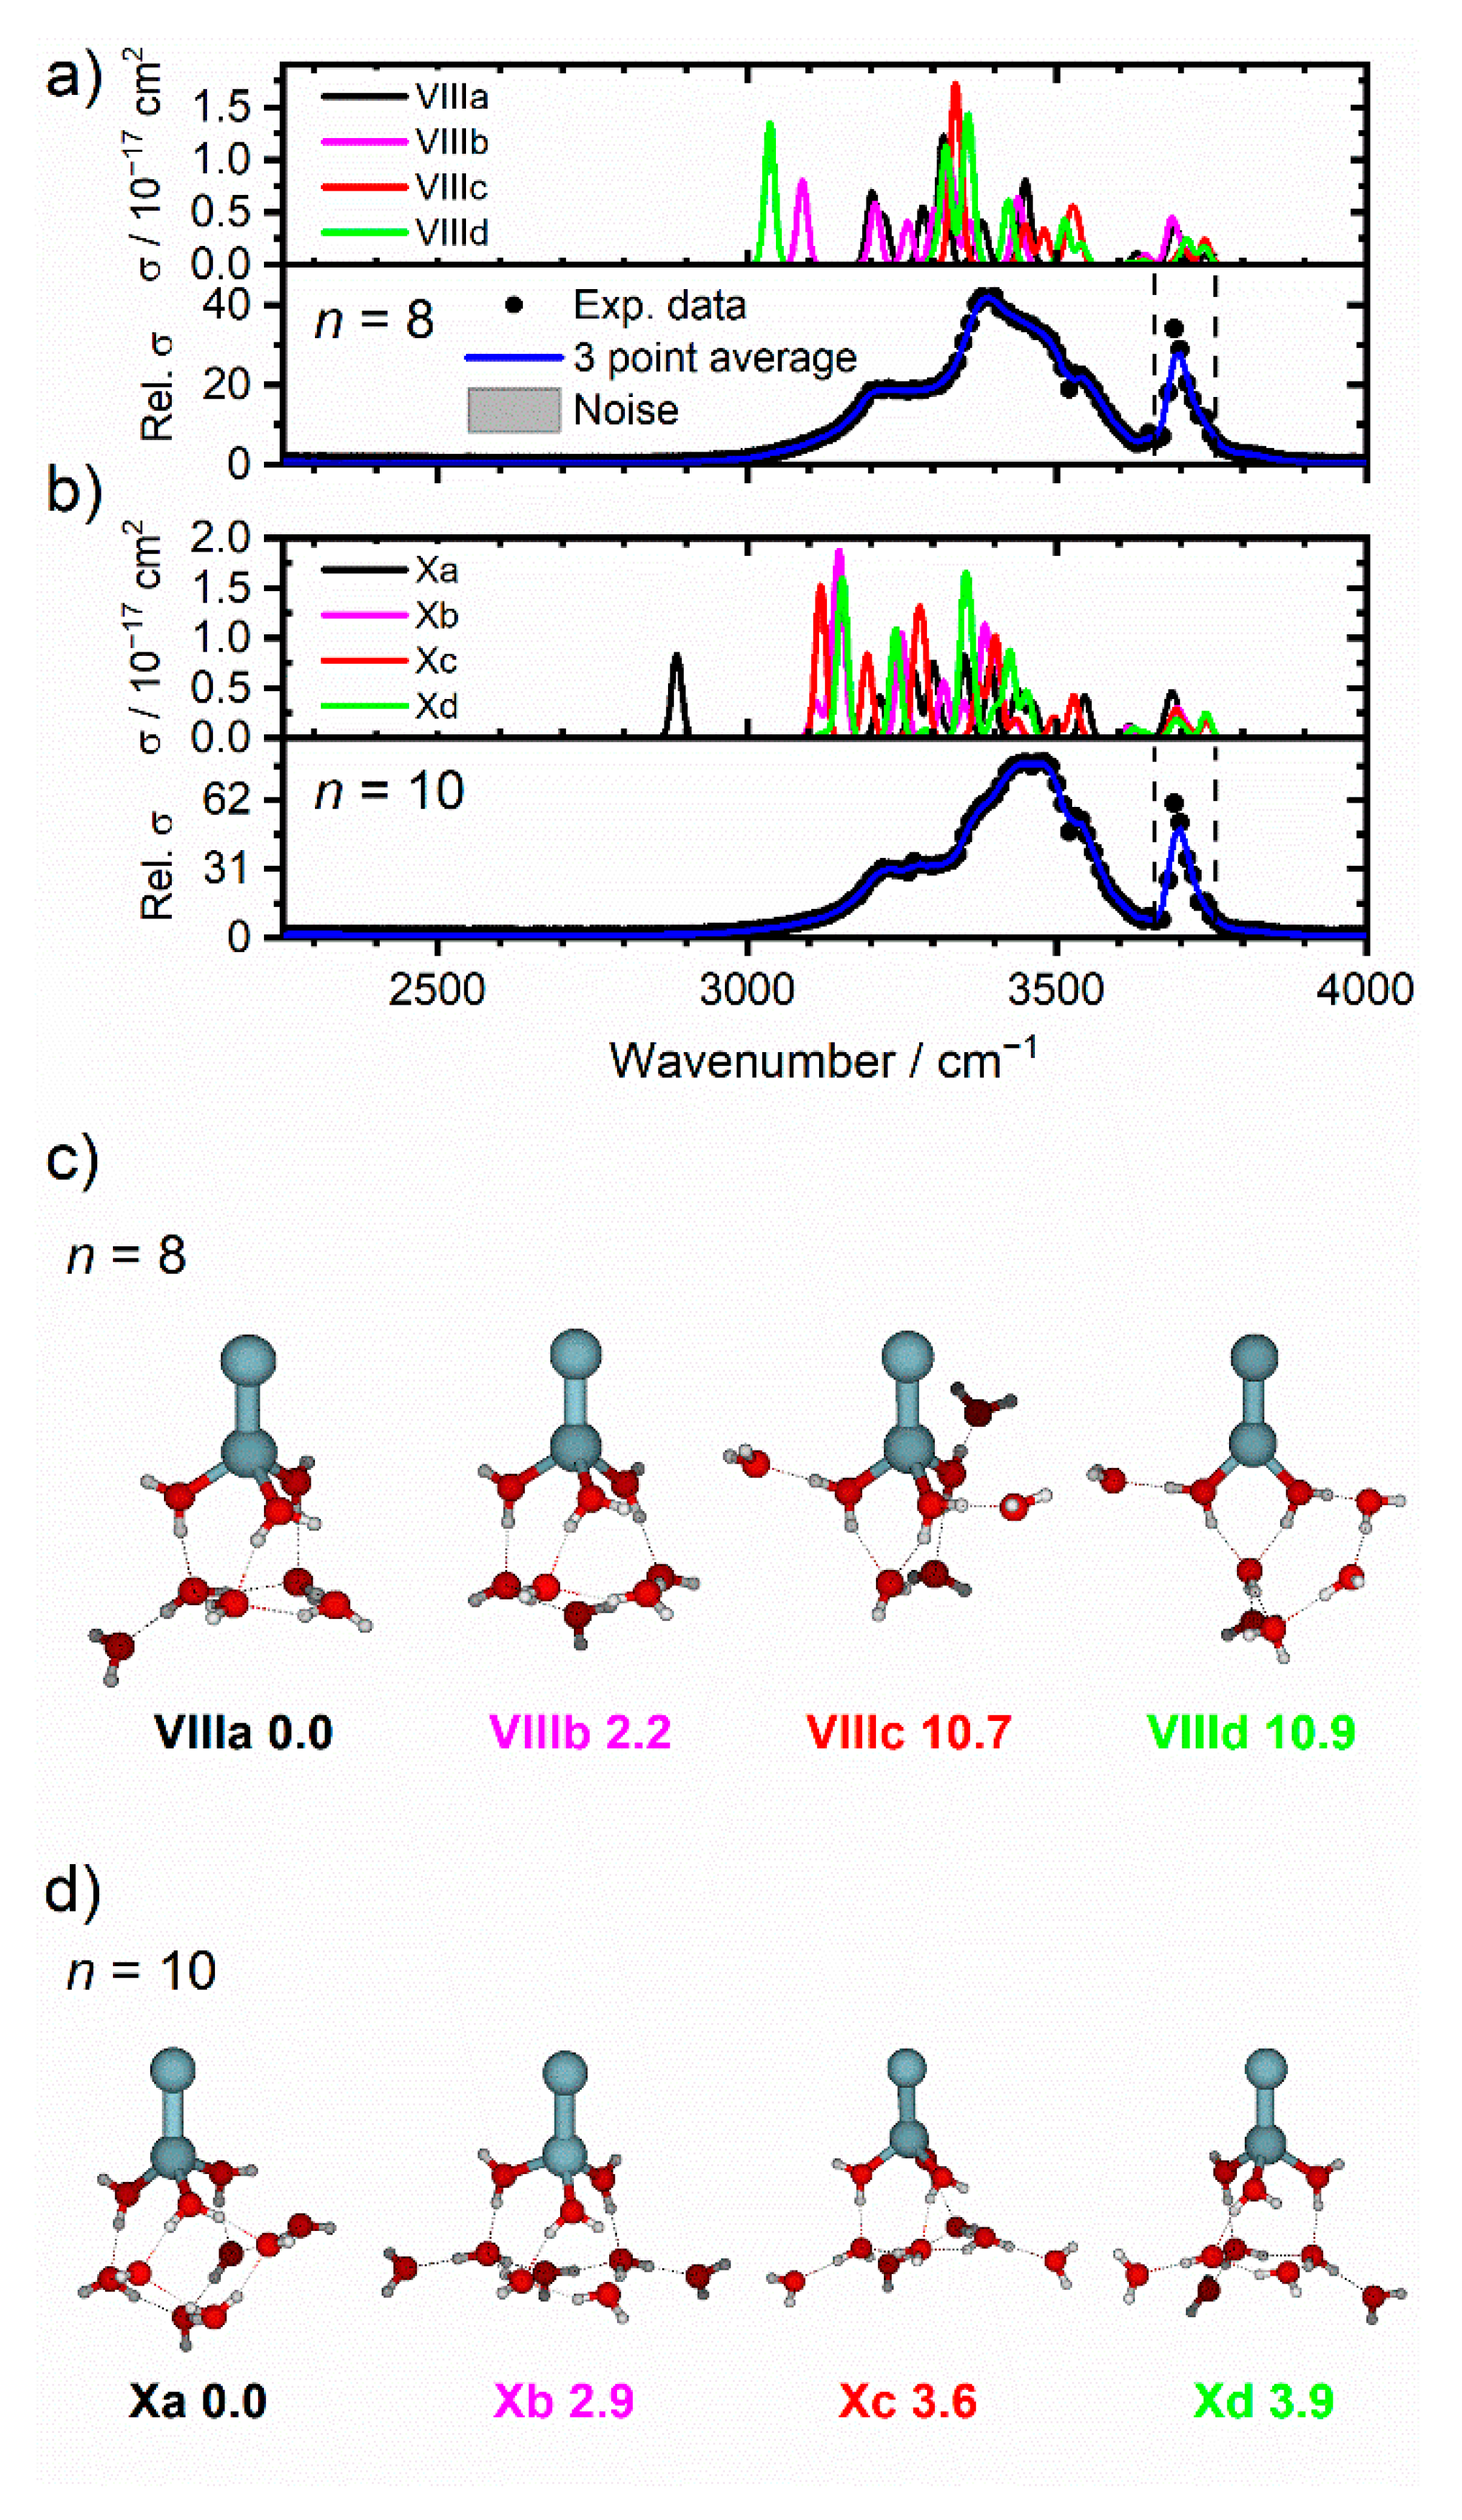
Figure 5 presents the IRMPD spectra of cluster sizes n = 8 and 10, along with simulated spectra of low-lying isomers, Figure 5a,b, respectively. Figure 5c,d also shows the structures of low-lying isomers of n = 8 and 10. Similar to the smaller clusters, the lowest-lying isomers are those with the water molecules coordinated to one Zn atom. In contrast to smaller clusters, however, is the coordination number, which has increased from two to three at n = 8. This would suggest that for smaller clusters, the hydrogen bonding between water molecules is favored over three-coordinate structures, while for n ≥ 8, enough water molecules are available to form a compact hydrogen bonded network with three molecules coordinating to a Zn atom, without imposing too much strain on the geometry of three coordinate complex as well as the hydrogen bonds. The IRMPD spectrum for n = 8 (Figure 5a) presents a broad feature between 3050 and 3640 cm−1, with a pronounced maximum at 3390 cm−1, along with a shoulder feature to the red at 3220 cm−1 and two shoulders to the blue at 3460 and 3540 cm−1. A sharper band, assigned to the asymmetric free O–H stretches, is shown at 3670 cm−1. These features are in agreement with the simulated spectra of isomer VIIIa, especially the intense feature at 3316 cm−1. Given the broad, unresolved features in the observed spectrum, simulated spectra of all four isomers, VIIIaVIIId, show agreement with the IRMPD spectrum. However, given the calculated energies of isomers VIIIc and VIIId exceed 10.7 kJ mol−1, these isomers are likely to only give a minor contribution to the overall spectrum. The spectral congestion and overlap of bands in the two lowest-lying isomers VIIIa and VIIIb contributes to the broad unresolved features in the observed spectrum. As the number of water molecules increases, the potential energy landscape becomes ever-increasingly complicated, whereby water ligands can change position across isomeric structures separated by shallow energetic barriers. Thus, for larger sizes these clusters represent fluxional systems exploring the potential energy landscape, whereby the spectra represent structural binding motifs, rather than individual isomers. Observed in monatomic Zn+(H2O)n clusters [70], the retention of a coordination number of three was caused by the ns1 valence electron configuration, which caused incoming ligands to experience repulsion from the occupied s orbital. Thus, water molecules bind to the same side of the metal center, even at larger cluster sizes. A similar effect is observed in Zn2+(H2O)n clusters, whereby incoming water molecules bind to one Zn atom and avoid binding to the second Zn atom.
The IRMPD spectrum of n = 10 is presented in Figure 5b, which also shows a broad absorption between 3050 and 3645 cm−1, with a maximum at 3460 cm−1, along with a shoulder to the red at 3280 cm−1, and a blue shoulder at 3530 cm−1. A sharper band to the blue at 3700 cm−1 is also shown. The low-lying isomers of Zn2+(H2O)10 are presented in Figure 5d, whereby the difference in energy between each isomer is much lower (all four are within 3.9 kJ mol−1) when compared to the smaller clusters. The simulated spectra of all four isomers present many bands, which accounts for the broad absorption in the observed spectrum. The spectrum of Xa, however, presents a red-shifted band at 2885 cm−1, assigned to the O–H stretch of an outer water hydrogen-bonded to three other outer water molecules, which is not observed experimentally. This red-shifted band was also calculated in the simulated spectrum of the putative global minimum structure for Zn+(H2O)10, and signifies significant weakening of the O–H bond and emergence of the mobile proton. Just as is the case in this study, this red-shifted band was not observed in monatomic zinc-water clusters. Isomers XbXd do not present such red-shifted bands, and instead show more outer water molecules in SA binding motifs. This would suggest that warmer isomers (i.e., the cluster ensemble allowed to reach thermal equilibrium at 80 K) are present in the ICR cell. This is concordant with our previous study on Zn+(H2O)n clusters, whereby entropic effects (higher presence of less rigidly bound SA motifs) dominate enthalpic effects at higher temperatures [70]. Each mass-selected cluster (ensemble of different isomers) is exposed to 80 K black-body infrared radiation in the ICR cell, thus more entropically favored isomers are present and more prominent in the observed spectrum.
The IRMPD spectra of larger clusters n = 16 and 20 (Figure 1) look qualitatively similar to the spectrum of n = 10, presenting a broad absorption between 2950 and 3650 and between 2920 and 3660 cm−1, respectively. The feature at 3220 cm−1 is more prominent for n = 16 and 20. Given there are no significant spectral changes at these larger cluster sizes, we believe there are no significant structural changes; a coordination of three is most likely retained, with asymmetric solvation at one Zn atom. Similar to Zn+(H2O)n [70], there are no highly red-shifted bands, which would signify the emergence of a mobile proton within this size regime.
The infrared signature of the mobile proton; a weak, broad, structureless absorption between 2800 and 3500 cm−1 was observed previously in the D2 “tagged” vibrational predissociation spectra of M2+OH(H2O)n=1–5 (M = Mg, Ca) by Johnson and co-workers [79]. This signature, unobserved in Zn+(H2O)n [70], is also not present in the IRMPD spectra of Zn2+(H2O)16,20; thus, we rule out formation of the Zn–HZnOH+ motif in larger clusters.

3. Experimental and Computational Details

All experimental measurements were performed on a modified 4.7 Tesla Bruker/Spectrospin CMS47X FT-ICR mass spectrometer [80,81,82,83,84] equipped with a Bruker infinity cell [85] and laser vaporization source [86,87]. To briefly summarize, a frequency-doubled Litron Nano S 60-30 Nd:YAG laser (532 nm, 5 mJ/pulse, 30 Hz) is focused onto a rotating solid disc of isotopically enriched zinc (64Zn 99.4%, STB Isotope Germany, GmbH), producing a plasma. This plasma is then entrained into a pulse of the desired gas mixture (H2O in helium) produced via a homebuilt piezoelectric valve. The ensuing pulse is cooled via supersonic jet expansion into the source chamber. The gas pulse traverses through a skimmer (forming the molecular beam), and ions are guided via an electrostatic lens setup into the center of the ICR cell. Ions of the composition Zn2+(H2O)n (n = 1–20) are then stored and mass-selected within the 4.7 T magnetic field [88] under ultrahigh vacuum conditions (ca. 5 × 10⁻¹⁰ mbar). The ICR cell is surrounded by a copper jacket, whereby the temperature of the cell is controlled and cooled to ca. 80 K via liquid nitrogen [89,90] for all measurements, minimizing the effects of black body infrared radiative dissociation (BIRD) [91,92,93,94,95,96].
On the opposite side of the magnet, the output radiation of a tunable IR OPO laser system (EKSPLA NT277, 1000 Hz repetition rate, pulse duration <10 ns) is aligned into the cell through a CaF2 window [97]. Absorption of infrared photons, leading to photodissociation events is measured via mass spectrometry [98]. Monitoring the precursor and fragment intensities as a function of wavenumber yields the infrared spectrum of the complex of interest. Infrared spectra were recorded in the 2250–4000 cm−1 region, probing the O–H symmetric and asymmetric stretching modes. Specific details on the laser setup can be found in previous publications [97,99]. To account for laser energy and irradiation time, single-photon cross-sections, σ, are calculated by using a modified Beer–Lambert equation:
I 0 = ( i = 0 n I i ) exp ( σ λ P t h c A k )
where I0 represents the intensity of the precursor ion, Ii the fragment ion intensity, λ the laser wavelength, P the laser power, t the irradiation time, h the Planck constant, A the area of the laser beam and k an empirical factor which corrects for any contributions due to BIRD.
To complement the experimental findings, the structures, along with their corresponding infrared spectra, of Zn2+(H2O)n were calculated using density functional theory (DFT). Calculations were performed by using the B3LYP functional coupled with the aug-cc-pVDZ basis set. Simulated infrared spectra were generated by implementing Gaussian functions to the band positions, each with a full width at half maximum (FWHM) of 20 cm−1, using a scaling factor of 0.96. All structures considered represent local minima and are in the doublet spin multiplicity corresponding to the ground state. Other multiplicities, such as quartet or sextet, lie considerably higher in energy (487 and 1647 kJ mol−1, respectively). Binding energies for the low-lying structures for n = 0–6 were calculated through single-point recalculation of B3LYP/aug-cc-pVDZ at the coupled cluster singles and doubles (CCSD) level with the aug-cc-pVDZ basis set. Charges on atoms were calculated by using the CHELPG scheme, [100] with the radius of 1.39 Å chosen for Zn. Calculations were performed using the Gaussian16 software package [101].

4. Conclusions

Cationic zinc dimer–water complexes (Zn2+(H2O)n, n = 1–20) were formed in the gas-phase by laser vaporization, size-selected, and stored in the center of an ICR cell cooled to ca. 80 K. Infrared multiple photon dissociation spectra were recorded for each cluster size revealing structural information and the nature of water binding sites to Zn2+. Photodissociation of intact water molecules is the dominant channel for every cluster size, with the exception of n = 3, whereby Zn photodissociation is also observed as a weaker channel.
IRMPD spectra are in agreement with simulated spectra of low-lying isomers, whereby different structural motifs can be assigned to bands based on the relative red-shift in band position. In all sizes, asymmetric solvation to one Zn atom in the dimer present the energetically lower-lying isomers. Based on the relative energy of calculated structural isomers, along with infrared band assignments, asymmetric solvation, whereby water molecules bind exclusively to one Zn atom, dominates the observed spectra even at larger cluster sizes. Spectroscopy experiments in the ultraviolet/visible (UV/VIS) region may help to further support these claims of asymmetric solvation.
Zn photodissociation observed in n = 3 is rationalized by an interplay of water and Zn binding energy. Calculated binding energies show subtle differences in water binding energy vs. Zn binding energy for smaller clusters, with a significant decrease in Zn binding at n = 3. This anomalous Zn binding energy at n = 3 helps to rationalize the observed Zn dissociation in the infrared spectrum.

Supplementary Materials

The following are available online at https://www.mdpi.com/article/10.3390/ijms22116026/s1. Figures S1 and S2: Calculated binding energies. Figures S3 and S4: Calculated charges, spin densities, and bond distances of Zn–Zn. Figure S5: IRMPD cross-sections. Schemes S1–S3: Outer water binding motifs. Figures S6–S8: Additional calculated structures and Cartesian coordinates of the optimized structures. IRMPD spectra in ASCII format for n = 1–8, 10, 16 and 20.

Author Contributions

Conceptualization, M.O. and M.K.B.; data curation, M.O. and C.v.d.L.; formal analysis, E.M.C.; funding acquisition, M.K.B.; investigation, E.M.C., T.T., and J.H.; methodology, M.O., C.v.d.L., and M.K.B.; project administration, C.v.d.L.; software, J.H.; supervision, M.O. and M.K.B.; validation, E.M.C., M.O., and C.v.d.L.; visualization, E.M.C. and T.T.; writing—original draft, E.M.C.; writing—review and editing, T.T., J.H., M.O., C.v.d.L., and M.K.B. All authors have read and agreed to the published version of the manuscript.

Funding

This research was funded by the Austrian Science Fund, FWF, Project No. P29174, and the Doctoral Programme (Doktoratskolleg) DK-ALM: W1259-N27. The tunable OPO system is part of the Innsbruck Laser Core Facility, funded by the Austrian Federal Ministry of Science, Research and Economy.

Institutional Review Board Statement

Not applicable.

Informed Consent Statement

Not applicable.

Data Availability Statement

The data presented in this study are available in the supplementary material.

Acknowledgments

The authors gratefully acknowledge support from the Austrian Science Fund FWF, Project No. P29174, and the DK-ALM: W1259-N27. The tunable OPO system is part of the Innsbruck Laser Core Facility, financed by the Austrian Federal Ministry of Science, Research and Economy. The computational results presented were attained by using the HPC infrastructure LEO of the University of Innsbruck.

Conflicts of Interest

There are no conflicts of interest to declare.

References

  1. Cooper, W.F.; Clarke, G.A.; Hare, C.R. Molecular orbital theory of the diatomic molecules of the first row transition metals. J. Phys. Chem. 1972, 76, 2268. [Google Scholar] [CrossRef]
  2. Bender, C.F.; Rescigno, T.N.; Schaefer, H.F.; Orel, A.E. Potential energy curves for diatomic zinc and cadmium. J. Chem. Phys. 1979, 71, 1122–1227. [Google Scholar] [CrossRef] [Green Version]
  3. Morse, M.D. Clusters of transition-metal atoms. Chem. Rev. 1986, 86, 1049–1109. [Google Scholar] [CrossRef]
  4. Buckner, S.W.; Gord, J.R.; Freiser, B.S. Gas phase studies of Zn+2, Ag+3, and Ag+5. J. Chem. Phys. 1988, 88, 3678–3681. [Google Scholar] [CrossRef]
  5. Czajkowski, M.A.; Koperski, J. The Cd2 and Zn2 van der Waals dimers revisited. Correction for some molecular potential parameters. Spectrochim. Acta A 1999, 55, 2221–2229. [Google Scholar] [CrossRef]
  6. Flad, H.-J.; Schautz, F.; Wang, Y.; Dolg, M.; Savin, A. On the bonding of small group 12 clusters. Eur. Phys. 1999, 6, 243–254. [Google Scholar] [CrossRef]
  7. Gutsev, G.L.; Bauschlicher, C.W. Chemical bonding, electron affinity, and ionization energies of the homonuclear 3d metal dimers. J. Phys. Chem. A 2003, 107, 4755–4767. [Google Scholar] [CrossRef]
  8. Gutsev, G.L.; Mochena, M.D.; Jena, P.; Bauschlicher, C.W., Jr.; Partridge, H., III. Periodic table of 3d-metal dimers and their ions. J. Chem. Phys. 2004, 121, 6785–6797. [Google Scholar] [CrossRef]
  9. Wang, J.; Wang, G.; Zhao, J. Nonmetal-metal transition in Znn (n = 2–20) clusters. Phys. Rev. A 2003, 68, 013201. [Google Scholar] [CrossRef]
  10. Wang, Y.; Quillian, B.; Wei, P.; Wang, H.; Yang, X.-J.; Xie, Y.; King, R.B.; Schleyer, P.V.R.; Schaefer, H.F.; Robinson, G.H. On the Chemistry of Zn–Zn Bonds, RZn– ZnR (R = [{(2, 6-Pri2C6H3)N(Me)C}2CH]): Synthesis, Structure, and Computations. J. Am. Chem. Soc. 2005, 127, 11944. [Google Scholar] [CrossRef]
  11. Figgen, D.; Rauhut, G.; Dolg, M.; Stoll, H. Energy-consistent pseudopotentials for group 11 and 12 atoms: Adjustment to multi-configuration Dirac–Hartree–Fock data. Chem. Phys. 2005, 311, 227–244. [Google Scholar] [CrossRef]
  12. Wu, G.; Stace, A.J. Gas phase studies of metal dimer complexes, M2Ln+, where M = Zn and Mn, and L = pyrrole and furan, for n in the range 1–5. Int. J. Mass Spectrom. 2006, 249, 289–295. [Google Scholar] [CrossRef]
  13. Grirrane, A.; Resa, I.; Rodriguez, A.; Carmona, E.; Alvarez, E.; Gutierrez-Puebla, E.; Monge, A.; Galindo, A.; del Río, D.; Andersen, R.A. Zinc– Zinc Bonded Zincocene Structures. Synthesis and Characterization of Zn25-C5Me5)2 and Zn25-C5Me4Et)2. J. Am. Chem. Soc. 2007, 129, 693–703. [Google Scholar] [CrossRef] [PubMed]
  14. Philpott, M.R.; Kawazoe, Y. The electronic structure of the dizincocene core. Chem. Phys. 2006, 327, 283–290. [Google Scholar] [CrossRef]
  15. Zhao, Y.; Truhlar, D.G. A new local density functional for main-group thermochemistry, transition metal bonding, thermochemical kinetics, and noncovalent interactions. J. Phys. Chem. A 2006, 110, 194101. [Google Scholar] [CrossRef] [PubMed] [Green Version]
  16. Carmona, E.; Galindo, A. Direct bonds between metal atoms: Zn, Cd, and Hg compounds with metal–metal bonds. Angew. Chem. Int. Ed. 2008, 47, 6526–6536. [Google Scholar] [CrossRef] [PubMed]
  17. Resa, I.; Carmona, E.; Gutierrez-Puebla, E.; Monge, A. Decamethyldizincocene, a stable compound of Zn (I) with a Zn-Zn bond. Science 2004, 305, 1136–1138. [Google Scholar] [CrossRef]
  18. Pahl, E.; Figgen, D.; Borschevsky, A.; Peterson, K.A.; Schwerdtfeger, P. Accurate potential energy curves for the group 12 dimers Zn2, Cd2, and Hg2. Theor. Chem. Acc. 2011, 129, 651. [Google Scholar] [CrossRef]
  19. Oymak, H.; Erkoç, Ş. Group 12 elements and their small clusters: Electric dipole polarizability of zn, cd and hg, zn2 dimer and higher znn microclusters and neutral, cationic and anionic zinc oxide molecules (ZnO, ZnO+ and ZnO). Int. J. Mod. Phys. B 2012, 26, 1230003. [Google Scholar] [CrossRef]
  20. Wei, L.M.; Li, P.; Qiao, L.W.; Tang, K.T. Corresponding states principle and van der Waals potentials of Zn2, Cd2, and Hg2. J. Chem. Phys. 2013, 139, 154306. [Google Scholar] [CrossRef]
  21. Oda, A.; Ohkubo, T.; Yumura, T.; Kobayashi, H.; Kuroda, Y. Synthesis of an unexpected [Zn2]2+ species utilizing an MFI-type zeolite as a nano-reaction pot and its manipulation with light and heat. Dalton Trans. 2015, 44, 10038–10047. [Google Scholar] [CrossRef] [PubMed]
  22. Benco, L. Adsorption of small molecules on the [Zn-Zn]2+ linkage in zeolite. A DFT study of ferrierite. Surf. Sci. 2017, 656, 115–125. [Google Scholar] [CrossRef]
  23. Lyngdoh, R.H.D.; Schaefer, H.F.; King, R.B. Metal–metal (MM) bond distances and bond orders in binuclear metal complexes of the first row transition metals titanium through zinc. Chem. Rev. 2018, 118, 11626–11706. [Google Scholar] [CrossRef] [PubMed]
  24. Tarento, R.J. Ionization potentials and charge localization in small charged group 12 clusters. Eur. Phys. J. D 2019, 73, 260. [Google Scholar] [CrossRef]
  25. Sadjadi, S.; Matta, C.F.; Hamilton, I.P. Bonding and metastability for Group 12 dications. J. Comput. Chem. 2021, 42, 40–49. [Google Scholar] [CrossRef] [PubMed]
  26. Jensen, W.B. The place of zinc, cadmium, and mercury in the periodic table. J. Chem. Educ. 2003, 80, 952. [Google Scholar] [CrossRef]
  27. Parkin, G. Zinc-zinc bonds: A new frontier. Science 2004, 305, 1117–1118. [Google Scholar] [CrossRef] [PubMed]
  28. Wang, X.; Andrews, L. Infrared spectra of Zn and Cd hydride molecules and solids. J. Phys. Chem. A 2004, 108, 11006–11013. [Google Scholar] [CrossRef]
  29. Andrews, L.; Cho, H.-G. Formation of Short Zn–Zn Bonds Stabilized by Simple Cyanide and Isocyanide Ligands. Angew. Chem. Int. Ed. 2020, 59, 2496–2525. [Google Scholar] [CrossRef]
  30. Echeverría, J.; Falceto, A.; Alvarez, S. Zinc–Zinc double bonds: A theoretical study. Angew. Chem. Int. Ed. 2017, 56, 10285–10289. [Google Scholar] [CrossRef]
  31. Ayala, R.; Galindo, A. A theoretical study of the bonding capabilities of the zinc-zinc double bond. Int. J. Quantum Chem. 2019, 119, e25823. [Google Scholar] [CrossRef]
  32. Artero, V.; Chavarot-Kerlidou, M.; Fontecave, M. Splitting water with cobalt. Angew. Chem. Int. Ed. 2011, 50, 7238–7266. [Google Scholar] [CrossRef]
  33. Neumaier, M.; Köppe, R.; Schnöckel, H. Ein molekulares Korrosionsmodell für Metalle? Nachr. Chem. 2008, 56, 999–1004. [Google Scholar] [CrossRef]
  34. Berg, C.; Achatz, U.; Beyer, M.; Joos, S.; Albert, G.; Schindler, T.; Niedner-Schatteburg, G.; Bondybey, V.E. Chemistry and charge transfer phenomena in water cluster cations. Int. J. Mass Spectrom. Ion Process. 1997, 167, 723–734. [Google Scholar] [CrossRef]
  35. Berg, C.; Beyer, M.; Achatz, U.; Joos, S.; Niedner-Schatteburg, G.; Bondybey, V.E. Stability and reactivity of hydrated magnesium cations. Chem. Phys. 1998, 239, 379–392. [Google Scholar] [CrossRef]
  36. Fox-Beyer, B.S.; Sun, Z.; Balteanu, I.; Balaj, O.P.; Beyer, M.K. Hydrogen formation in the reaction of Zn+(H2O)n with HCl. Phys. Chem. Chem. Phys. 2005, 7, 981–985. [Google Scholar] [CrossRef]
  37. van der Linde, C.; Akhgarnusch, A.; Siu, C.-K.; Beyer, M.K. Hydrated magnesium cations Mg+(H2O)n, n ≈ 20–60, exhibit chemistry of the hydrated electron in reactions with O2 and CO2. J. Phys. Chem. A 2011, 115, 10174–10180. [Google Scholar] [CrossRef] [PubMed]
  38. van der Linde, C.; Beyer, M.K. The structure of gas-phase [AlnH2O]+: Hydrated monovalent aluminium Al+(H2O)n or hydride-hydroxide HAlOH+(H2O)n−1? Phys. Chem. Chem. Phys. 2011, 13, 6776–6778. [Google Scholar] [CrossRef] [PubMed]
  39. Beyer, M.; Williams, E.R.; Bondybey, V.E. Unimolecular reactions of dihydrated alkaline earth metal dications M2+(H2O)2, M = Be, Mg, CA Sr, and Ba:  Salt-bridge mechanism in the proton-transfer reaction M2+(H2O)2 → MOH+ + H3O+. J. Am. Chem. Soc. 1999, 121, 1565–1573. [Google Scholar] [CrossRef] [Green Version]
  40. van der Linde, C.; Beyer, M.K. Reactions of M+(H2O)n, n < 40, M = V, Cr, Mn, Fe, Co, Ni, Cu, and Zn, with D2O reveal water activation in Mn+(H2O)n. J. Phys. Chem. A 2012, 116, 10676–10682. [Google Scholar]
  41. Beyer, M.; Berg, C.; Görlitzer, H.W.; Schindler, T.; Achatz, U.; Albert, G.; Niedner-Schatteburg, G.; Bondybey, V.E. Fragmentation and intracluster reactions of hydrated aluminum cations Al+(H2O)n, n = 3−50. J. Am. Chem. Soc. 1996, 118, 7386–7389. [Google Scholar] [CrossRef]
  42. Achatz, U.; Joos, S.; Berg, C.; Beyer, M.; Niedner-Schatteburg, G.; Bondybey, V.E. Generation of hydrated iodide clusters I(H2O)n by laser vaporization, their fragmentation and reactions with HCl. Chem. Phys. Lett. 1998, 291, 459–464. [Google Scholar] [CrossRef]
  43. Beyer, M.; Achatz, U.; Berg, C.; Joos, S.; Niedner-Schatteburg, G.; Bondybey, V.E. Size dependence of blackbody radiation induced hydrogen formation in Al+(H2O)n hydrated aluminum cations and their reactivity with hydrogen chloride. J. Phys. Chem. A 1999, 103, 671–678. [Google Scholar] [CrossRef]
  44. Achatz, U.; Fox, B.S.; Beyer, M.K.; Bondybey, V.E. Hypoiodous acid as guest molecule in protonated water clusters:  A Combined FT-ICR/DFT Study of I(H2O)n+. J. Am. Chem. Soc. 2001, 123, 6151–6156. [Google Scholar] [CrossRef] [PubMed]
  45. Beyer, M.K. Hydrated metal ions in the gas phase. Mass Spectrom. Rev. 2007, 26, 517. [Google Scholar] [CrossRef] [PubMed]
  46. Scharfschwerdt, B.; van der Linde, C.; Balaj, O.P.; Herber, I.; Schütze, D.; Beyer, M.K. Photodissociation and photochemistry of V+(H2O)n, n = 1–4, in the 360–680 nm region. Low Temp. Phys. 2012, 38, 717–722. [Google Scholar] [CrossRef] [Green Version]
  47. Ončák, M.; Taxer, T.; Barwa, E.; van der Linde, C.; Beyer, M.K. Photochemistry and spectroscopy of small hydrated magnesium clusters Mg+(H2O)n, n = 1–5. J. Chem. Phys. 2018, 149, 44309. [Google Scholar] [CrossRef] [Green Version]
  48. Taxer, T.; Ončák, M.; Barwa, E.; van der Linde, C.; Beyer, M.K. Electronic spectroscopy and nanocalorimetry of hydrated magnesium ions [Mg(H2O)n]+, n = 20–70: Spontaneous formation of a hydrated electron? Faraday Discuss. 2019, 217, 584–600. [Google Scholar] [CrossRef] [PubMed] [Green Version]
  49. Barwa, E.; Ončák, M.; Pascher, T.F.; Herburger, A.; van der Linde, C.; Beyer, M.K. Infrared multiple photon dissociation spectroscopy of hydrated cobalt anions doped with carbon dioxide CoCO2(H2O)n, n = 1–10, in the C–O Stretch Region. Chem. Eur. J. 2020, 26, 1074–1081. [Google Scholar] [CrossRef] [PubMed] [Green Version]
  50. Barwa, E.; Pascher, T.F.; Ončák, M.; van der Linde, C.; Beyer, M.K. Carbon dioxideactivation at metal centers: Evolution of charge transfer from Mg + to CO2 in [MgCO2(H2O)n]+, n = 0–8. Angew. Chem. Int. Ed. 2020, 59, 7467–7471. [Google Scholar] [CrossRef] [Green Version]
  51. Heller, J.; Tang, W.K.; Cunningham, E.M.; Demissie, E.G.; van der Linde, C.; Lam, W.K.; Ončák, M.; Siu, C.-K.; Beyer, M.K. Beyer: Getting ready for the hydrogen evolution reaction: The infrared spectrum of hydrated aluminum hydride-hydroxide HAlOH+(H2O)n−1, n = 9–14. Angew. Chem. Int. Ed. 2021, 60. in print. [Google Scholar] [CrossRef]
  52. Lisy, J.M. Spectroscopy and structure of solvated alkali-metal ions. Int. Rev. Phys. Chem. 1997, 16, 267–289. [Google Scholar] [CrossRef]
  53. Duncan, M.A. Spectroscopy of metal ion complexes: Gas-phase models for solvation. Annu. Rev. Phys. Chem. 1997, 48, 69–93. [Google Scholar] [CrossRef] [Green Version]
  54. Duncan, M.A. Infrared spectroscopy to probe structure and dynamics in metal ion-molecule complexes. Int. Rev. Phys. Chem. 2003, 22, 407–435. [Google Scholar] [CrossRef]
  55. Asmis, K.R. Structure characterization of metal oxide clusters by vibrational spectroscopy: Possibilities and prospects. Phys. Chem. Chem. Phys. 2012, 14, 9270–9281. [Google Scholar] [CrossRef] [Green Version]
  56. Schwarz, H.; Asmis, K.R. Identification of active sites and structural characterization of reactive ionic intermediates by cryogenic ion trap vibrational spectroscopy. Chem. Eur. J. 2019, 25, 2112–2126. [Google Scholar] [CrossRef]
  57. Reinhard, B.M.; Lagutschenkov, A.; Lemaire, J.; Maitre, P.; Boissel, P.; Niedner-Schatteburg, G. Reductive nitrile coupling in niobium—acetonitrile complexes probed by free electron laser IR multiphoton dissociation apectroscopy. J. Phys. Chem. A 2004, 108, 3350–3355. [Google Scholar] [CrossRef]
  58. Nosenko, Y.; Menges, F.; Riehn, C.; Niedner-Schatteburg, G. Investigation by two-color IR dissociation spectroscopy of Hoogsteen-type binding in a metalated nucleobase pair mimic. Phys. Chem. Chem. Phys. 2013, 15, 8171–8178. [Google Scholar] [CrossRef]
  59. Craig, S.M.; Johnson, C.J.; Ranasinghe, D.S.; Perera, A.; Bartlett, R.J.; Berman, M.R.; Johnson, M.A. Vibrational characterization of radical ion adducts between imidazole and CO2. J. Phys. Chem. A 2018, 122, 3805–3810. [Google Scholar] [CrossRef] [PubMed]
  60. Craig, S.M.; Menges, F.S.; Duong, C.H.; Denton, J.K.; Madison, L.R.; McCoy, A.B.; Johnson, M.A. Hidden role of intermolecular proton transfer in the anomalously diffuse vibrational spectrum of a trapped hydronium ion. Proc. Natl. Acad. Sci. USA 2017, 114, E4706–E4713. [Google Scholar] [CrossRef] [Green Version]
  61. Walker, N.R.; Walters, R.S.; Tsai, M.-K.; Jordan, K.D.; Duncan, M.A. Infrared photodissociation spectroscopy of Mg+(H2O)Arn complexes: Isomers in progressive microsolvation. J. Phys. Chem. A 2005, 109, 7057–7067. [Google Scholar] [CrossRef]
  62. Walker, N.R.; Walters, R.S.; Pillai, E.D.; Duncan, M.A. Infrared spectroscopy of V+(H2O) and V+(D2O) complexes: Solvent deformation and an incipient reaction. J. Chem. Phys. 2003, 119, 10471–10474. [Google Scholar] [CrossRef]
  63. Ward, T.B.; Carnegie, P.D.; Duncan, M.A. Infrared spectroscopy of the Ti(H2O)Ar+ ion–molecule complex: Electronic state switching induced by argon. Chem. Phys. Lett. 2016, 654, 1–5. [Google Scholar] [CrossRef] [Green Version]
  64. Carnegie, P.D.; Marks, J.H.; Brathwaite, A.D.; Ward, T.B.; Duncan, M.A. Microsolvation in V+(H2O)n clusters studied with selected-ion infrared spectroscopy. J. Phys. Chem. A 2020, 124, 1093–1103. [Google Scholar] [CrossRef] [PubMed]
  65. Walters, R.S.; Pillai, E.D.; Duncan, M.A. Solvation dynamics in Ni+(H2O)n clusters probed with infrared spectroscopy. J. Am. Chem. Soc. 2005, 127, 16599–16610. [Google Scholar] [CrossRef] [PubMed]
  66. Sasaki, J.; Ohashi, K.; Inoue, K.; Imamura, T.; Judai, K.; Nishi, N.; Sekiya, H. Infrared photodissociation spectroscopy of V+(H2O)n (n = 2–8): Coordinative saturation of V+ with four H2O molecules. Chem. Phys. Lett. 2009, 474, 36–40. [Google Scholar] [CrossRef]
  67. Iino, T.; Ohashi, K.; Inoue, K.; Judai, K.; Nishi, N.; Sekiya, H. Infrared spectroscopy of Cu+(H2O)n and Ag+(H2O)n: Coordination and solvation of noble-metal ions. J. Chem. Phys. 2007, 126, 194302. [Google Scholar] [CrossRef]
  68. Inoue, K.; Ohashi, K.; Iino, T.; Judai, K.; Nishi, N.; Sekiya, H. Coordination and solvation of copper ion: Infrared photodissociation spectroscopy of Cu+(NH3)n (n = 3–8). Phys. Chem. Chem. Phys. 2007, 9, 4793–4802. [Google Scholar] [CrossRef] [PubMed]
  69. Iino, T.; Ohashi, K.; Mune, Y.; Inokuchi, Y.; Judai, K.; Nishi, N.; Sekiya, H. Infrared photodissociation spectra and solvation structures of Cu+(H2O)n (n = 1–4). Chem. Phys. Lett. 2006, 427, 24–28. [Google Scholar] [CrossRef] [Green Version]
  70. Cunningham, E.M.; Taxer, T.; Heller, J.; Ončák, M.; van der Linde, C.; Beyer, M.K. Microsolvation of Zn cations: Infrared multiple photon dissociation spectroscopy of Zn+(H2O)n (n = 2–35). Phys. Chem. Chem. Phys. 2021, 23, 3627–3636. [Google Scholar] [CrossRef]
  71. Bandyopadhyay, B.; Reishus, K.N.; Duncan, M.A. Infrared spectroscopy of solvation in small Zn+(H2O)n complexes. J. Phys. Chem. A 2013, 117, 7794–7803. [Google Scholar] [CrossRef] [PubMed]
  72. Hock, C.; Schmidt, M.; Kuhnen, R.; Bartels, C.; Ma, L.; Haberland, H.; von Issendorff, B. Calorimetric observation of the melting of free water nanoparticles at cryogenic temperatures. Phys. Rev. Lett. 2009, 103, 73401. [Google Scholar] [CrossRef] [PubMed] [Green Version]
  73. Donald, W.A.; Leib, R.D.; Demireva, M.; Negru, B.; Neumark, D.M.; Williams, E.R. Average sequential water molecule binding enthalpies of M(H2O)19−1242+ (M = Co, Fe, Mn, and Cu) measured with ultraviolet photodissociation at 193 and 248 nm. J. Phys. Chem. A 2011, 115, 2–12. [Google Scholar] [CrossRef]
  74. Shimanouchi, T. Tables of Molecular Vibrational Frequencies. Consolidated Volume I; National Bureau of Standards: Washington, DC, USA, 1972.
  75. Yang, N.; Duong, C.H.; Kelleher, P.J.; Johnson, M.A. Capturing intrinsic site-dependent spectral signatures and lifetimes of isolated OH oscillators in extended water networks. Nat. Chem. 2020, 12, 159–164. [Google Scholar] [CrossRef]
  76. Carlson, K.D.; Kuschnir, K.R. Interatomic potential energy functions for mercury, cadmium, and zinc from vapor viscosities. J. Phys. Chem. 1964, 68, 1566–1567. [Google Scholar] [CrossRef]
  77. Ervin, K.; Loh, S.K.; Aristov, N.; Armentrout, P.B. Metal cluster ions: The bond energy of diatomic manganese (1+). J. Phys. Chem. 1983, 87, 3593–3596. [Google Scholar] [CrossRef]
  78. Leopold, D.G.; Ho, J.; Lineberger, W.C. Photoelectron spectroscopy of mass-selected metal cluster anions. I. Cun, n = 1–10. J. Chem. Phys. 1987, 86, 1715–1726. [Google Scholar] [CrossRef]
  79. Johnson, C.J.; Dzugan, L.C.; Wolk, A.B.; Leavitt, C.M.; Fournier, J.A.; McCoy, A.B.; Johnson, M.A. Microhydration of contact ion pairs in M2+OH(H2O)n=1–5 (M = Mg, Ca) clusters: Spectral manifestations of a mobile proton defect in the first hydration shell. J. Phys. Chem. A 2014, 118, 7590–7597. [Google Scholar] [CrossRef]
  80. Akhgarnusch, A.; Tang, W.K.; Zhang, H.; Siu, C.-K.; Beyer, M.K. Charge transfer reactions between gas-phase hydrated electrons, molecular oxygen and carbon dioxide at temperatures of 80–300 K. Phys. Chem. Chem. Phys. 2016, 18, 23528–23537. [Google Scholar] [CrossRef] [PubMed] [Green Version]
  81. Allemann, M.; Kellerhals, H.; Wanczek, K.P. High magnetic field Fourier transform ion cyclotron resonance spectroscopy. Int. J. Mass Spectrom. Ion Process. 1983, 46, 139–142. [Google Scholar] [CrossRef]
  82. Berg, C.; Schindler, T.; Niedner-Schatteburg, G.; Bondybey, V.E. Reactions of simple hydrocarbons with Nb+n: Chemisorption and physisorption on ionized niobium clusters. J. Chem. Phys. 1995, 102, 4870. [Google Scholar] [CrossRef]
  83. Schindler, T.; Berg, C.; Niedner-Schatteburg, G.; Bondybey, V.E. Reactions of water clusters H+(H2O)n, n = 3–75, with diethyl ether. Chem. Phys. 1995, 201, 491–496. [Google Scholar] [CrossRef]
  84. Akhgarnusch, A.; Höckendorf, R.F.; Beyer, M.K. Thermochemistry of the reaction of SF6 with gas-phase hydrated electrons: A benchmark for nanocalorimetry. J. Phys. Chem. A 2015, 119, 9978–9985. [Google Scholar] [CrossRef]
  85. Caravatti, P.; Allemann, M. The “infinity cell”: A new trapped ion cell with radiofrequency covered trapping electrodes for Fourier transform ion cyclotron resonance mass spectrometry. Org. Mass Spectrom. 1991, 26, 514–518. [Google Scholar] [CrossRef]
  86. Bondybey, V.E.; English, J.H. Laser induced fluorescence of metal clusters produced by laser vaporization: Gas phase spectrum of Pb2. J. Chem. Phys. 1981, 74, 6978–6979. [Google Scholar] [CrossRef]
  87. Dietz, T.G.; Duncan, M.A.; Powers, D.E.; Smalley, R.E. Laser production of supersonic metal cluster beams. J. Chem. Phys. 1981, 74, 6511–6512. [Google Scholar] [CrossRef]
  88. Marshall, A.G.; Hendrickson, C.L.; Jackson, G.S. Fourier transform ion cyclotron resonance mass spectrometry: A primer. Mass Spectrom. Rev. 1998, 17, 1–35. [Google Scholar] [CrossRef]
  89. Wong, R.L.; Paech, K.; Williams, E.R. Blackbody infrared radiative dissociation at low temperature: Hydration of X2+(H2O)n, for X = Mg, Ca. Int. J. Mass Spectrom. 2004, 232, 59–66. [Google Scholar] [CrossRef]
  90. Balaj, O.P.; Berg, C.B.; Reitmeier, S.J.; Bondybey, V.E.; Beyer, M.K. A novel design of a temperature-controlled FT-ICR cell for low-temperature black-body infrared radiative dissociation (BIRD) studies of hydrated ions. Int. J. Mass Spectrom. 2009, 279, 5–9. [Google Scholar] [CrossRef]
  91. Thölmann, D.; Tonner, D.S.; McMahon, T.B. Spontaneous unimolecular dissociation of small cluster ions, (H3O+) Ln and Cl-(H2O)n (n = 2–4), under Fourier transform ion cyclotron resonance conditions. J. Phys. Chem. 1994, 98, 2002–2004. [Google Scholar] [CrossRef]
  92. Dunbar, R.C. BIRD (blackbody infrared radiative dissociation): Evolution, principles, and applications. Mass Spectrom. Rev. 2004, 23, 127. [Google Scholar] [CrossRef] [PubMed]
  93. Schindler, T.; Berg, C.; Niedner-Schatteburg, G.; Bondybey, V.E. Protonated water clusters and their black body radiation induced fragmentation. Chem. Phys. Lett. 1996, 250, 301–308. [Google Scholar] [CrossRef]
  94. Schnier, P.D.; Price, W.D.; Jockusch, R.A.; Williams, E.R. Blackbody infrared radiative dissociation of bradykinin and its analogues: Energetics, dynamics, and evidence for salt-bridge structures in the gas phase. J. Am. Chem. Soc. 1996, 118, 7178–7189. [Google Scholar] [CrossRef] [PubMed] [Green Version]
  95. Sena, M.; Riveros, J.M. The unimolecular dissociation of the molecular ion of acetophenone induced by thermal radiation. Rapid Commun. Mass Spectrom. 1994, 8, 1031–1034. [Google Scholar] [CrossRef]
  96. Fox, B.S.; Beyer, M.K.; Bondybey, V.E. Black body fragmentation of cationic ammonia clusters. J. Phys. Chem. A 2001, 105, 6386–6392. [Google Scholar] [CrossRef]
  97. Herburger, A.; van der Linde, C.; Beyer, M.K. Photodissociation spectroscopy of protonated leucine enkephalin. Phys. Chem. Chem. Phys. 2017, 19, 10786–10795. [Google Scholar] [CrossRef] [Green Version]
  98. Donald, W.A.; Leib, R.D.; Demireva, M.; Williams, E.R. Ions in size-selected aqueous nanodrops: Sequential water molecule binding energies and effects of water on ion fluorescence. J. Am. Chem. Soc. 2011, 133, 18940–18949. [Google Scholar] [CrossRef] [PubMed]
  99. Herburger, A.; Ončák, M.; Siu, C.-K.; Demissie, E.G.; Heller, J.; Tang, W.K.; Beyer, M.K. Infrared spectroscopy of size selected hydrated carbon dioxide radical anions CO2(H2O)n (n = 2–61) in the C−O stretch region. Chem. Eur. J. 2019, 25, 10165. [Google Scholar] [CrossRef] [Green Version]
  100. Breneman, C.M.; Wiberg, K.B. Determining atom centered monopoles from molecular electrostatic potentials. The need for high sampling density in formamide conformational analysis. J. Comput. Chem. 1990, 11, 361. [Google Scholar] [CrossRef]
  101. Frisch, M.J.; Trucks, G.W.; Schlegel, H.B.; Scuseria, G.E.; Robb, M.A.; Cheeseman, J.R.; Scalmani, G.; Barone, V.; Petersson, G.A.; Nakatsuji, H.; et al. Gaussian 16, Revision A.03; Gaussian Inc.: Wallingford, CT, USA, 2016. [Google Scholar]
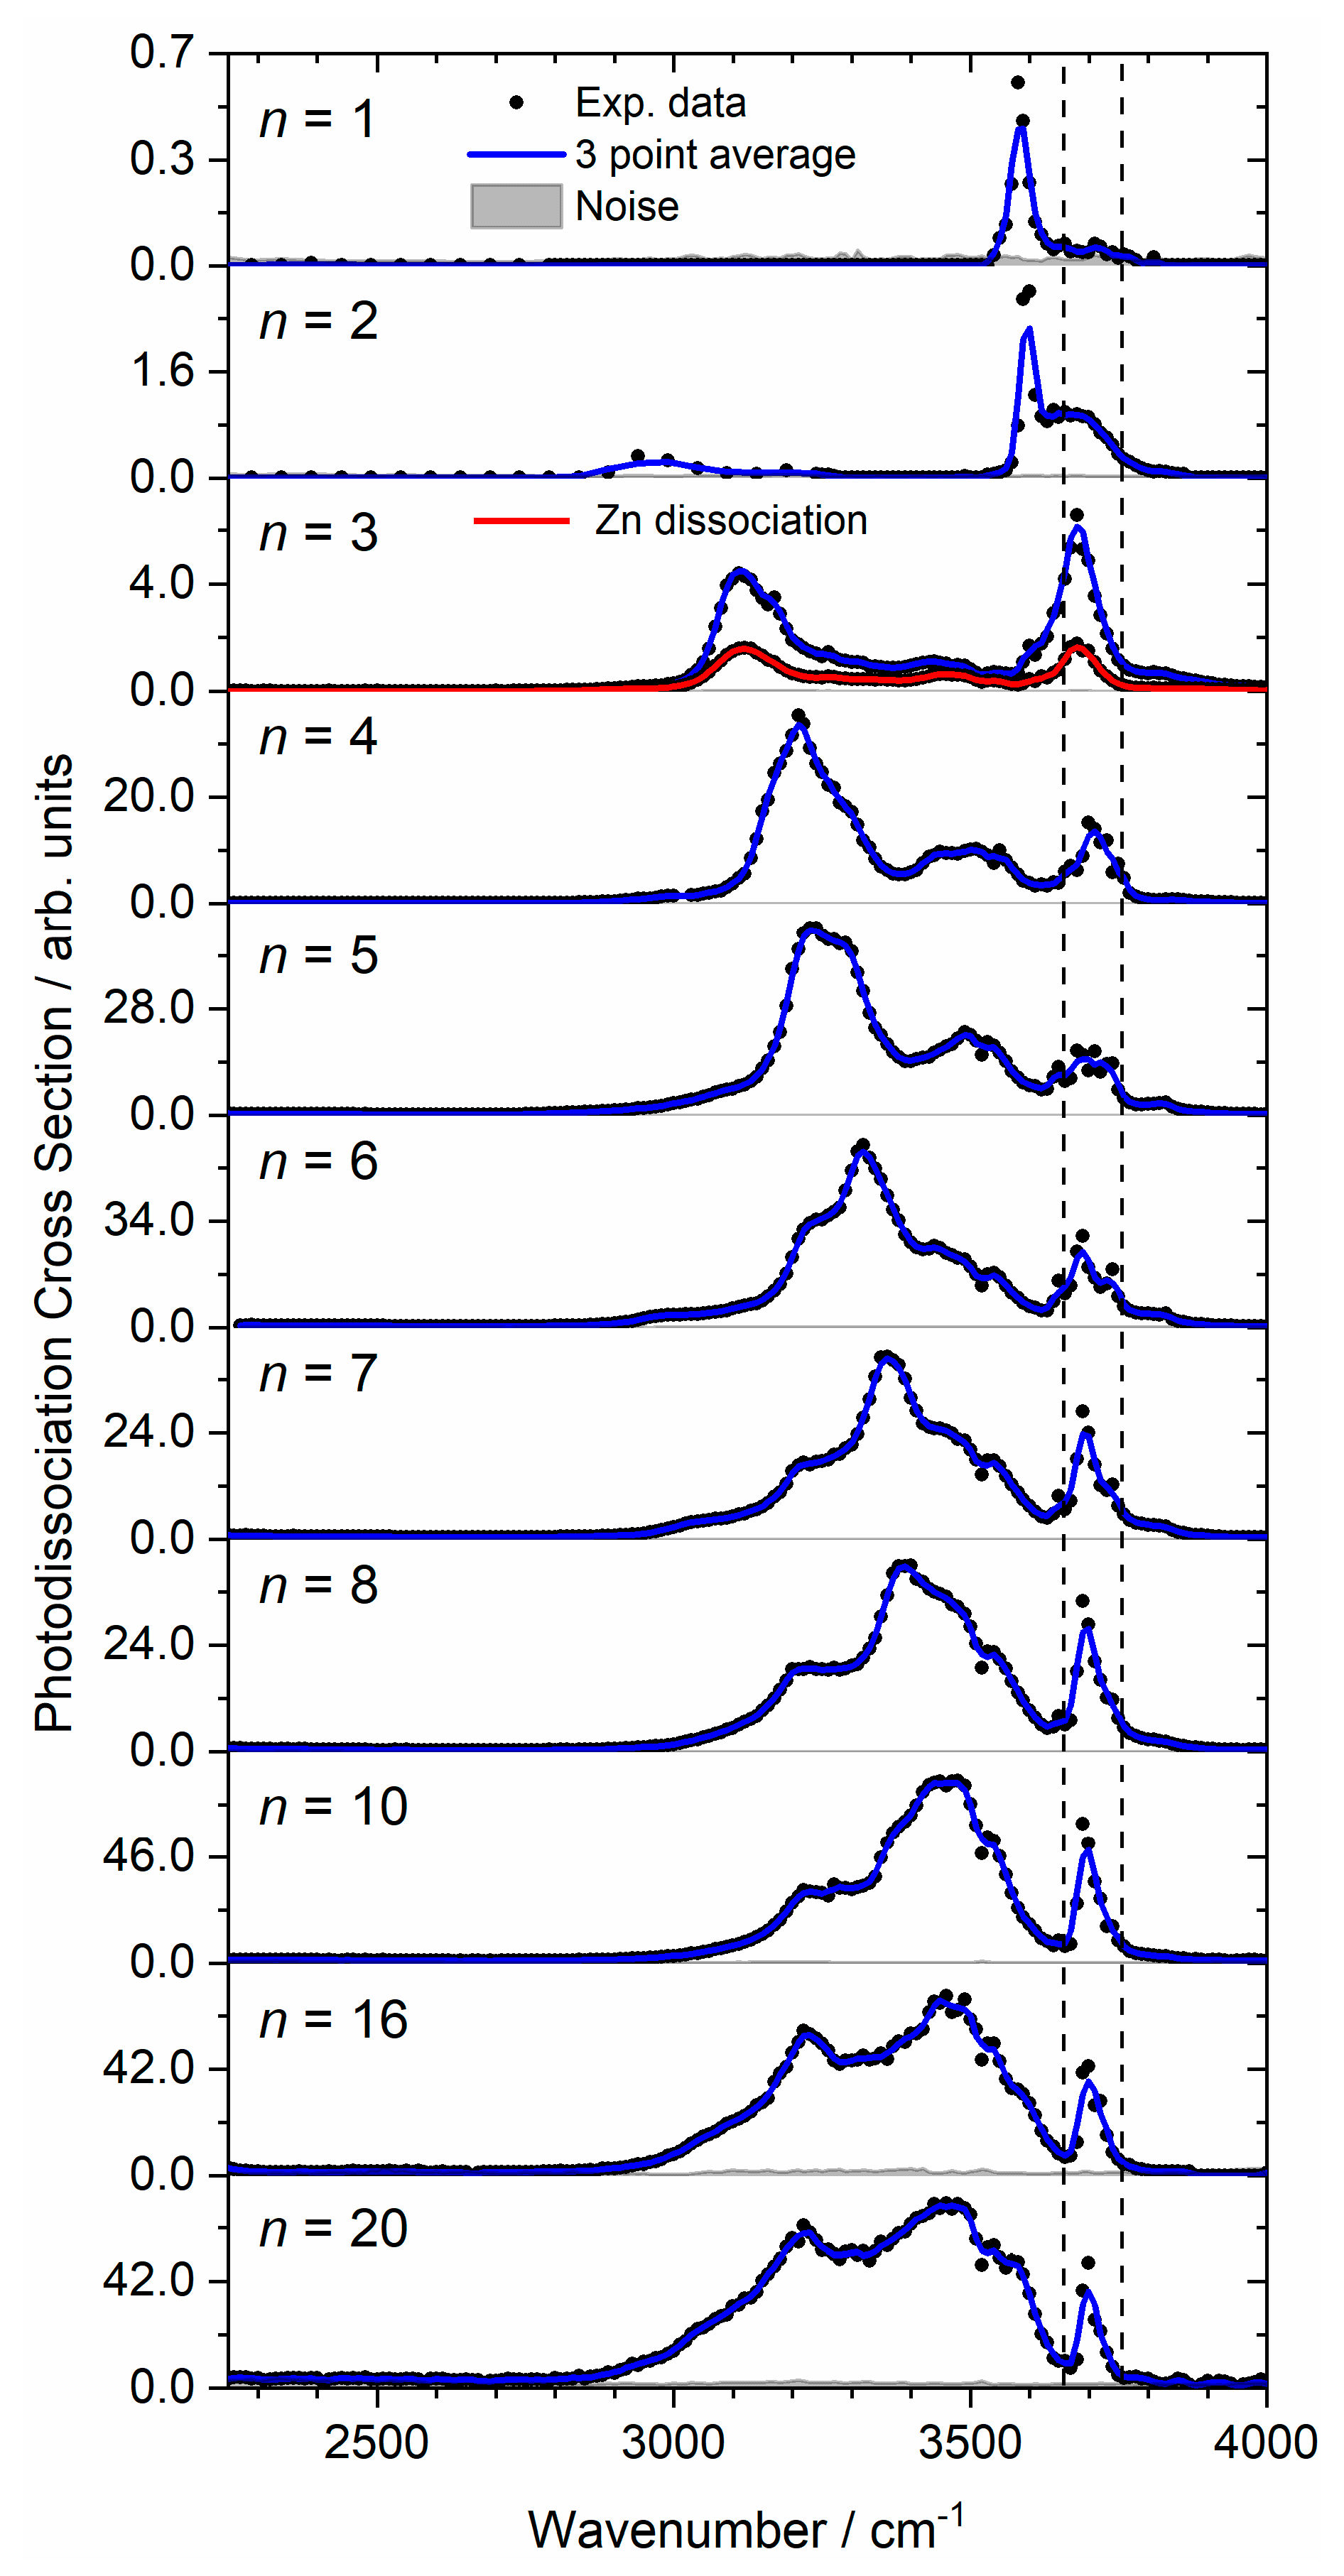
Figure 1. Experimental relative infrared photodissociation cross-section (arbitrary units) of Zn2+(H2O)n complexes (n = 1–8, 10, 16, and 20) assuming a one-photon process. In each case photodissociation events are due to loss of intact water molecules except for n = 3 where a second, less intense channel is observed due to Zn dissociation. The dashed lines in each experimental spectrum correspond to the wavenumbers of the symmetric and asymmetric stretching modes of isolated water at 3657 and 3756 cm−1, respectively [74].
Ijms 22 06026 g001
Figure 2. (a) Low-lying isomers of Zn2+(H2O)n clusters (n = 1–6) with water molecules coordinated to one Zn atom, and (b) isomers of Zn2+(H2O)n clusters (n = 1–6) with water molecules coordinated to both Zn atoms. All isomers were calculated at the B3LYP/aug-cc-pVDZ level of theory, with relative energy given in kJ mol−1 inclusive of zero-point energy.
Ijms 22 06026 g002
Figure 3. Experimental relative IRMPD photodissociation cross-section (arbitrary units) along with simulated cross-section σ of low-lying isomers for (af) Zn2+(H2O)1–6, representing the singly coordinated, and doubly coordinated isomers, respectively, at the B3LYP/aug-cc-pVDZ level. In each case photodissociation cross-sections present loss of intact water molecules. The dashed lines in each experimental spectrum correspond to the wavenumbers of the symmetric and asymmetric stretching modes of isolated water at 3657 and 3756 cm−1, respectively [74].
Ijms 22 06026 g003
Figure 4. Calculated binding energies of one water molecule (black), one Zn atom (red), and the difference in these binding energies (blue) in lowest-lying Zn2+(H2O)n clusters (n = 1–6) calculated at the CCSD/aug-cc-pVDZ//B3LYP/aug-cc-pDVZ level of theory. These isomers correspond to water bound to one Zn atom. Using the water molecule as an example, binding energies are calculated: E[Zn2+(H2O)n] − E[Zn2+(H2O)n−1] − E[(H2O)], including zero-point correction.
Ijms 22 06026 g004
Figure 5. Experimental relative IRMPD photodissociation cross-section (arbitrary units) along with simulated cross-section σ of low-lying isomers for (a) Zn2+(H2O)8 and (b) Zn2+(H2O)10. The dashed lines in each experimental spectrum correspond to the wavenumbers of the symmetric and asymmetric stretching modes of isolated water at 3657 and 3756 cm−1, respectively [74]. Low-lying isomers of n = 8 and n = 10, with water coordinated to one Zn atom, are shown in (c,d), respectively. All isomers were calculated at the B3LYP/aug-cc-pVDZ level of theory, with relative energy given in kJ mol−1 inclusive of zero-point energy.
Ijms 22 06026 g005
Table 1. Experimentally observed IRMPD O–H band position of Zn2+(H2O)n complexes (n = 1–8, 10, 16, and 20) along with the isomer assignment and water binding motif.
ClusterExperimental IRMPD Band
Position/cm−1
Isomer Assignment and
Binding Motif
Zn2+(H2O)3580
3710
Ia
Ia
Zn2+(H2O)22965
3590
3680
IIa-SA
IIa, IIb
IIa, IIb
Zn2+(H2O)33110
3160
3445
3605
3680
IIIc-SA, IIIb-SA(sym)
IIIb-SA(asym)
IIIa-DA
IIIb
IIIaIIIc
Zn2+(H2O)43210
3290
3490
3710
IVa-S*A, IVb-oDA, IVc-SA
IVb-DA
IVa-DA
IVaIVc
Zn2+(H2O)53230
3270
3490
3540
3690
Va-SA, Vb-oDA
Vb-SA, Vb-DA/oDA
Va-DA
Va-DA
Va-Vb
Zn2+(H2O)63240
3320
3445
3540
3690
3730
VIa-S*A, VIa-oDA, VIb-oSA VIb-SA
VIa-DA, VIb-D*A
VIb-oSA
Via, VIb
Via, VIb
Zn2+(H2O)72985–3620, 3220, 3360, 3460, 3540, 3690, 3730
Zn2+(H2O)83050–3640, 3220, 3390, 3460, 3540, 3670
Zn2+(H2O)103050–3645, 3220, 3460, 3530, 3700
Zn2+(H2O)162950–3650, 3220, 3450, 3540, 3700
Zn2+(H2O)202920–3660, 3220, 3460, 3560, 3700
Publisher’s Note: MDPI stays neutral with regard to jurisdictional claims in published maps and institutional affiliations.