System, Method and Software for Calculation of a Cannabis Drug Efficiency Index for the Reduction of Inflammation

 ,
,
Abstract
1. Introduction
2. Methods
2.1. Cannabis Drug Efficiency Index (CDEI)
2.1.1. Input and Output Data for the CDEI Metric
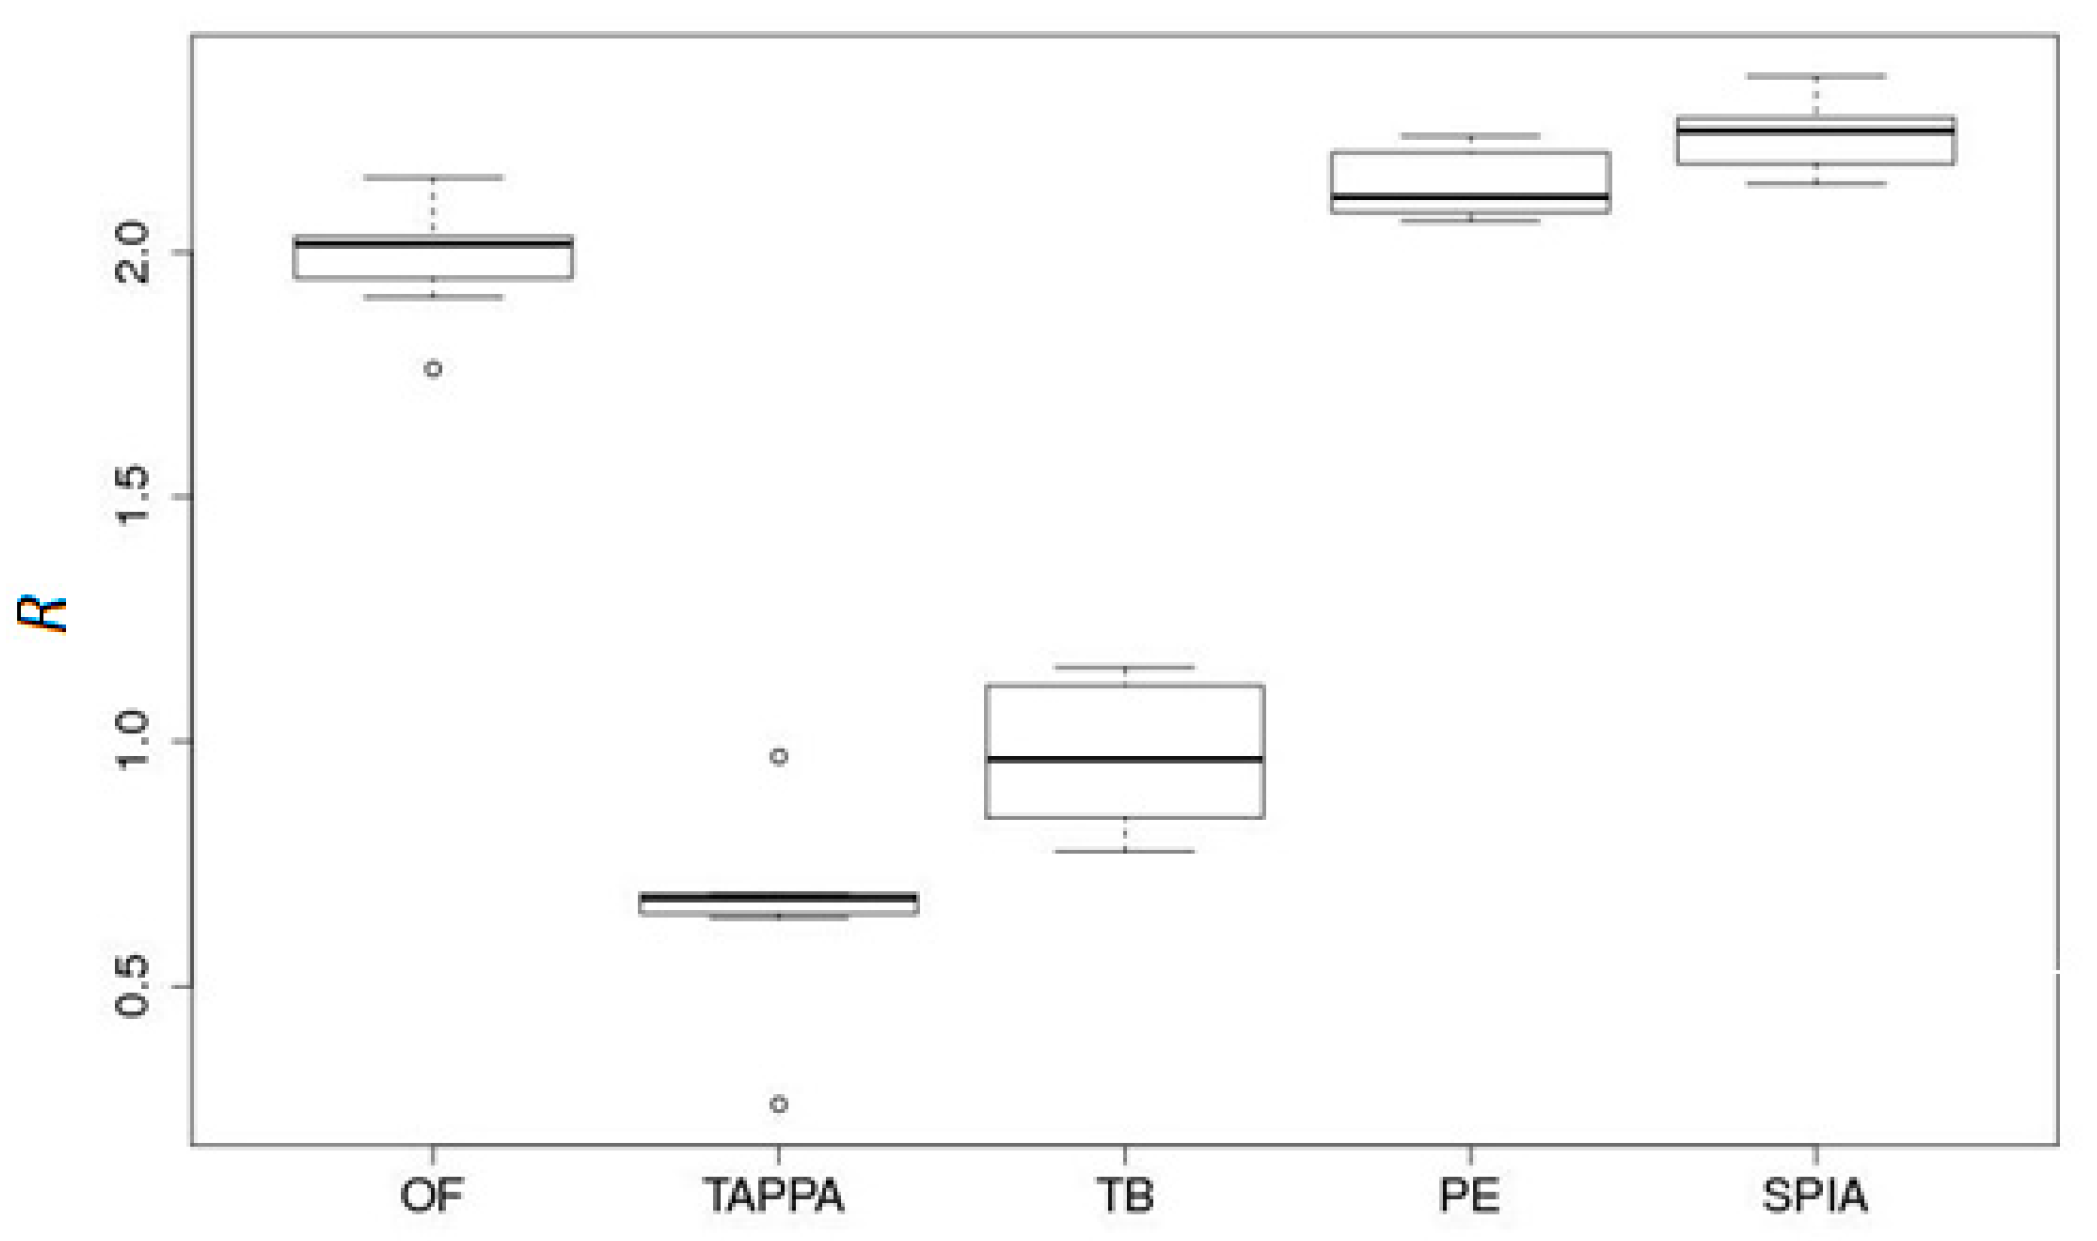
2.1.2. SPIA (Signaling Pathway Impact Analysis): A Method for Assessment of Signaling Pathway Activation
2.1.3. Calculation of the Cannabis Drug Efficiency Index (CDEI)
- Obtain the signaling pathway impact analysis (SPIA) for each drug for each biological pathway.
- Calculate the values of the pathway weight (wp) factor as follows: For pathways with a positive mean SPIA score of the case samples, wp = ((number of case samples with positive SPIA score)/(total number of case samples)). For pathways with a negative mean SPIA score of the case samples, wp = ((number of case samples with negative SPIA score)/(total number of case samples)).
- Adjust the mean SPIA score of each pathway by the weight factor, SPIAμ = mean(SPIA)·wp.
- Perform Student’s t-test if the values of SPIAμ for the pool of case samples are different from 0 (for the pool of control samples, the values of SPIAμ are clearly equal to 0). During the Student’s t-test, the following case classes are taken into account: the untreated case (U), i.e., the pathological state before drug application, should be far from the control (C).
- -
- Treated case (T), i.e., the pathological state after drug application, should be close to the control;
- -
- The following values are the results for such calculations: |tU| = absolute t-value for the Student’s t-test for U-vs.-C profiles;
- -
- |tT| = absolute t-value for the Student’s test for T-vs.-C profiles.
- Calculate the cannabis drug efficiency index (CDEI) for each drug for a specific disease, wherein CDEI = 2 ((|tU|/(|tT| + |tU|) − 0.5).
- Rank the drugs according to highest CDEI for a group of individual patients.
- -
- CDEI is a value between −1 and 1;
- -
- CDEI is 0 if |tT| and |tU| are the same, which means no drug efficiency;
- -
- CDEI is 1 if |tT| is 0, which means the perfect efficiency;
- -
- CDEI is a value greater than 0 if |tT| is smaller than |tU|, which means a positive efficiency;
- -
- CDEI is a value less than 0 if |tT| is larger than |tU|, which means a negative efficiency.
2.2. Experiments Used for Validation of the CDEI
2.2.1. Plant Growth
2.2.2. Crude Extract Preparation Using Solvent
2.2.3. Analysis of Cannabinoid Content
2.2.4. Preparation of the Cannabis Extract for Experimental Analysis Using Human Cells and Tissues
2.2.5. Example #1
2.2.6. Example #2
2.2.7. Example #3
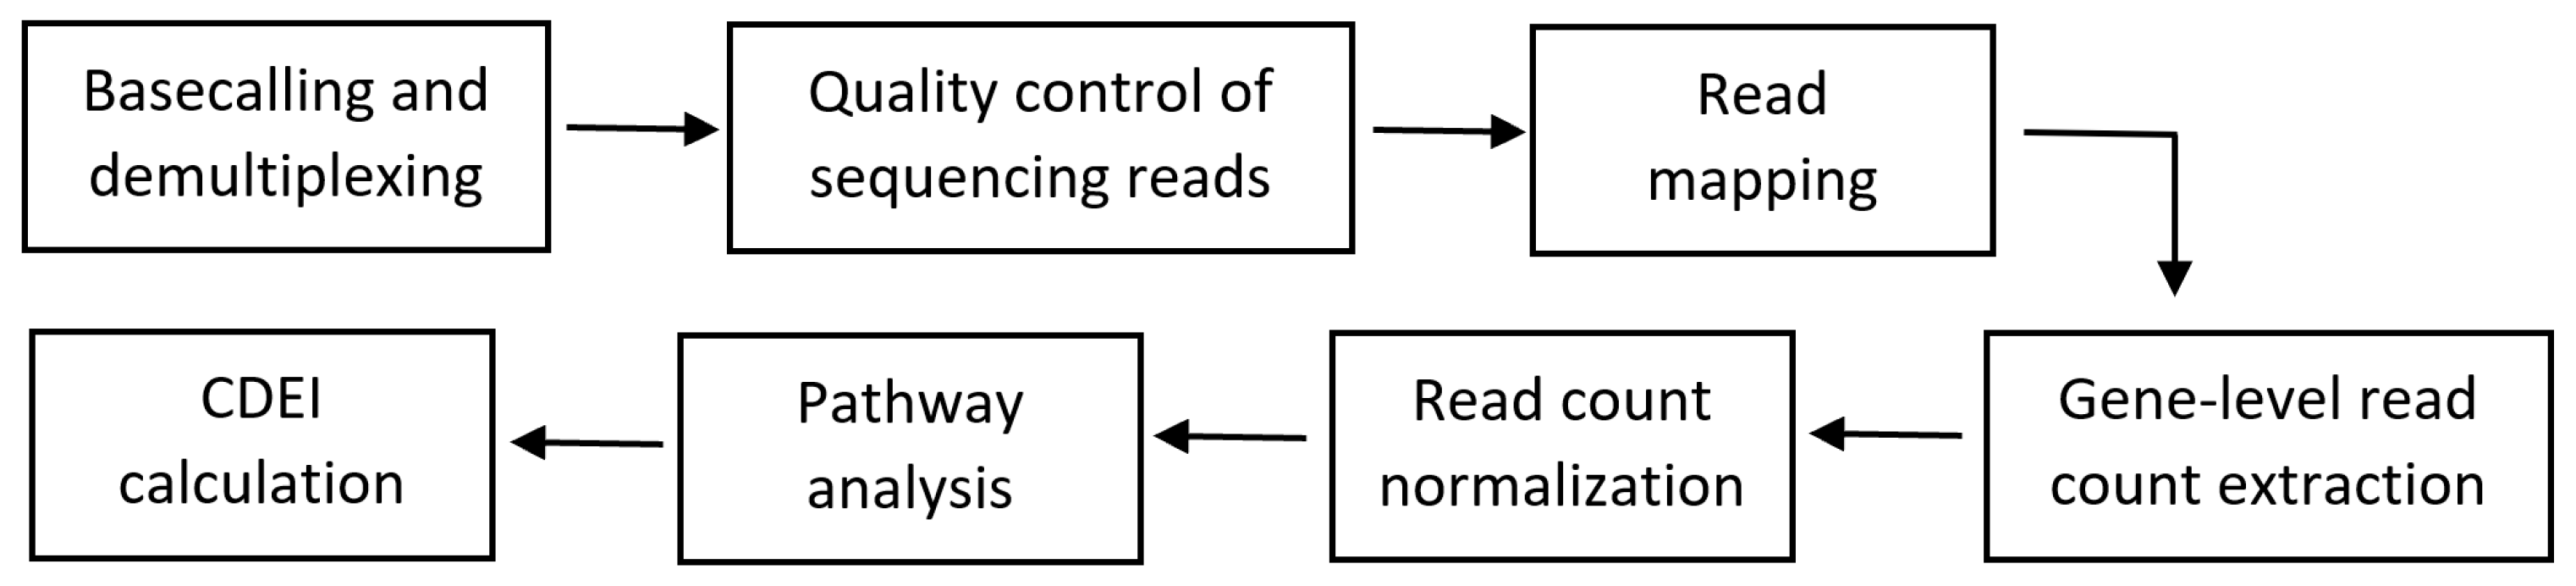
2.2.8. Bioinformatics Workflow
3. Results
4. Discussion
Author Contributions
Funding
Institutional Review Board Statement
Informed Consent Statement
Conflicts of Interest
References
- Buzdin, A.; Zhavoronkov, A.; Korzinkin, M.B.; Venkova, L.; Zenin, A.V.; Smirnov, P.Y.; Borisov, N.M. Oncofinder, a new method for the analysis of intracellular signaling pathway activation using transcriptomic data. Front. Genet. 2014, 5. [Google Scholar] [CrossRef] [PubMed]
- Jiang, Z.; Zhou, X.; Li, R.; Michal, J.J.; Zhang, S.; Dodson, M.V.; Zhang, Z.; Harland, R.M. Whole transcriptome analysis with sequencing: Methods, challenges and potential solutions. Cell Mol. Life Sci. 2015, 72, 3425–3439. [Google Scholar] [CrossRef] [PubMed]
- Kholodenko, B.N. Spatially distributed cell signalling. FEBS Lett. 2009, 583, 4006–4012. [Google Scholar] [CrossRef] [PubMed]
- Borisov, N.; Aksamitiene, E.; Kiyatkin, A.; Legewie, S.; Berkhout, J.; Maiwald, T.; Kaimachnikov, N.P.; Timmer, J.; Hoek, J.B.; Kholodenko, B.N. Systems-level interactions between insulin–EGF networks amplify mitogenic signaling. Mol. Syst. Biol. 2009, 5, 256. [Google Scholar] [CrossRef]
- Dimmer, E.C.; Huntley, R.P.; Alam-Faruque, Y.; Sawford, T.; O’Donovan, C.; Martin, M.J.; Bely, B.; Browne, P.; Chan, W.M.; Eberhardt, R.; et al. The UniProt-GO Annotation database in 2011. Nucleic Acids Res. 2011, 40, D565–D570. [Google Scholar] [CrossRef]
- Mishra, G.R. Human protein reference database--2006 update. Nucleic Acids Res. 2006, 34, D411–D414. [Google Scholar] [CrossRef]
- Kutmon, M.; Riutta, A.; Nunes, N.; Hanspers, K.; Willighagen, E.L.; Bohler, A.; Mélius, J.; Waagmeester, A.; Sinha, S.R.; Miller, R.A.; et al. WikiPathways: Capturing the full diversity of pathway knowledge. Nucleic Acids Res. 2016, 44, D488–D494. [Google Scholar] [CrossRef]
- Nikitin, A.; Egorov, S.; Daraselia, N.; Mazo, I. Pathway studio--the analysis and navigation of molecular networks. Bioinformatics 2003, 19, 2155–2157. [Google Scholar] [CrossRef]
- Elkon, R.; Vesterman, R.; Amit, N.; Ulitsky, I.; Zohar, I.; Weisz, M.; Mass, G.; Orlev, N.; Sternberg, G.; Blekhman, R.; et al. SPIKE—A database, visualization and analysis tool of cellular signaling pathways. BMC Bioinform. 2008, 9, 110. [Google Scholar] [CrossRef]
- Haw, R.; Hermjakob, H.; D’Eustachio, P.; Stein, L. Reactome pathway analysis to enrich biological discovery in proteomics data sets. Proteomics 2011, 11, 3598–3613. [Google Scholar] [CrossRef]
- Nakaya, A.; Katayama, T.; Itoh, M.; Hiranuka, K.; Kawashima, S.; Moriya, Y.; Okuda, S.; Tanaka, M.; Tokimatsu, T.; Yamanishi, Y.; et al. KEGG OC: A large-scale automatic construction of taxonomy-based ortholog clusters. Nucleic Acids Res. 2012, 41, D353–D357. [Google Scholar] [CrossRef] [PubMed]
- Yizhak, K.; Gabay, O.; Cohen, H.; Ruppin, E. Model-based identification of drug targets that revert disrupted metabolism and its application to ageing. Nat. Commun. 2013, 4, 2632. [Google Scholar] [CrossRef] [PubMed]
- Borisov, N.M.; Kholodenko, B.N.; Faeder, J.R.; Chistopolsky, A.S. Domain-oriented reduction of rule-based network models. IET Syst. Biol. 2008, 2, 342–351. [Google Scholar] [CrossRef] [PubMed]
- Hwang, S. Comparison and evaluation of pathway-level aggregation methods of gene expression data. BMC Genom. 2012, 13, S26. [Google Scholar] [CrossRef]
- Borisov, N.; Sorokin, M.; Garazha, A.; Buzdin, A. Quantitation of Molecular Pathway Activation Using RNA Sequencing Data. Methods Mol. Biol. 2020, 2063, 189–206. [Google Scholar]
- Buzdin, A.; Sorokin, M.; Garazha, A.; Sekacheva, M.; Kim, E.; Zhukov, N.; Wang, Y.; Li, X.; Kar, S.; Hartmann, C.; et al. Molecular pathway activation—New type of biomarkers for tumor morphology and personalized selection of target drugs. Semin. Cancer Biol. 2018, 53, 110–124. [Google Scholar] [CrossRef]
- Ozerov, I.V.; Lezhnina, K.V.; Izumchenko, E.; Artemov, A.V.; Medintsev, S.; Vanhaelen, Q.; Aliper, A.; Vijg, J.; Osipov, A.N.; Labat, I.; et al. In silico Pathway Activation Network Decomposition Analysis (iPANDA) as a method for biomarker development. Nat. Commun. 2016, 7, 13427. [Google Scholar] [CrossRef]
- Tkachev, V.; Sorokin, M.; Garazha, A.; Borisov, N.; Buzdin, A. Oncobox Method for Scoring Efficiencies of Anticancer Drugs Based on Gene Expression Data. Methods Mol. Biol. 2020, 2063, 235–255. [Google Scholar]
- Zolotovskaia, M.; Sorokin, M.; Garazha, A.; Borisov, N.; Buzdin, A. Molecular Pathway Analysis of Mutation Data for Biomarkers Discovery and Scoring of Target Cancer Drugs. Methods Mol. Biol. 2020, 2063, 207–234. [Google Scholar]
- Zolotovskaia, M.A.; Sorokin, M.I.; Emelianova, A.A.; Borisov, N.M.; Kuzmin, D.V.; Borger, P.; Garazha, A.V.; Buzdin, A.A. Pathway Based Analysis of Mutation Data Is Efficient for Scoring Target Cancer Drugs. Front. Pharmacol. 2019, 10, 1. [Google Scholar] [CrossRef]
- Zolotovskaia, M.A.; Sorokin, M.I.; Roumiantsev, S.A.; Borisov, N.M.; Buzdin, A.A. Pathway Instability Is an Effective New Mutation-Based Type of Cancer Biomarkers. Front. Oncol. 2019, 8, 658. [Google Scholar] [CrossRef] [PubMed]
- Borisov, N.; Buzdin, A. New Paradigm of Machine Learning (ML) in Personalized Oncology: Data Trimming for Squeezing More Biomarkers From Clinical Datasets. Front. Oncol. 2019, 9, 658. [Google Scholar] [CrossRef] [PubMed]
- Borisov, N.; Tkachev, V.; Suntsova, M.; Kovalchuk, O.; Zhavoronkov, A.; Muchnik, I.; Buzdin, A. A method of gene expression data transfer from cell lines to cancer patients for machine-learning prediction of drug efficiency. Cell Cycle 2018, 17, 486–491. [Google Scholar] [CrossRef] [PubMed]
- Tkachev, V.; Sorokin, M.; Mescheryakov, A.; Simonov, A.; Garazha, A.; Buzdin, A.; Muchnik, I.; Borisov, N. FLOating-Window Projective Separator (FloWPS): A Data Trimming Tool for Support Vector Machines (SVM) to Improve Robustness of the Classifier. Front. Genet. 2019, 9, 717. [Google Scholar] [CrossRef] [PubMed]
- Tkachev, V.; Sorokin, M.; Borisov, C.; Garazha, A.; Buzdin, A.; Borisov, N. Flexible Data Trimming Improves Performance of Global Machine Learning Methods in Omics-Based Personalized Oncology. Int. J. Mol. Sci. 2020, 21, 713. [Google Scholar] [CrossRef] [PubMed]
- Tarca, A.L.; Draghici, S.; Khatri, P.; Hassan, S.S.; Mittal, P.; Kim, J.-S.; Kim, C.J.; Kusanovic, J.P.; Romero, R. A novel signaling pathway impact analysis. Bioinformatics 2008, 25, 75–82. [Google Scholar] [CrossRef] [PubMed]
- Gao, S.; Wang, X. TAPPA: Topological analysis of pathway phenotype association. Bioinformatics 2007, 23, 3100–3102. [Google Scholar] [CrossRef]
- Ibrahim, M.A.-H.; Jassim, S.; A Cawthorne, M.; Langlands, K. A Topology-Based Score for Pathway Enrichment. J. Comput. Biol. 2012, 19, 563–573. [Google Scholar] [CrossRef]
- Draghici, S.; Khatri, P.; Tarca, A.L.; Amin, K.; Done, A.; Voichita, C.; Georgescu, C.; Romero, R. A systems biology approach for pathway level analysis. Genome Res. 2007, 17, 1537–1545. [Google Scholar] [CrossRef]
- Borisov, N.; Suntsova, M.; Sorokin, M.; Garazha, A.; Kovalchuk, O.; Aliper, A.; Ilnitskaya, E.; Lezhnina, K.; Korzinkin, M.; Tkachev, V.; et al. Data aggregation at the level of molecular pathways improves stability of experimental transcriptomic and proteomic data. Cell Cycle 2017, 16, 1810–1823. [Google Scholar] [CrossRef]
- Even, S. Graph Algorithms, 2nd ed.; Cambridge University Press: Cambridge, UK, 2011. [Google Scholar]
- Kim, D.; Langmead, B.; Salzberg, S.L. HISAT: A fast spliced aligner with low memory requirements. Nat. Methods 2015, 12, 357–360. [Google Scholar] [CrossRef] [PubMed]
- Liao, Y.; Smyth, G.K.; Shi, W. featureCounts: An efficient general purpose program for assigning sequence reads to genomic features. Bioinformatics 2013, 30, 923–930. [Google Scholar] [CrossRef]
- Love, M.I.; Huber, W.; Anders, S. Moderated estimation of fold change and dispersion for RNA-seq data with DESeq2. Genome Biol. 2014, 15, 550. [Google Scholar] [CrossRef] [PubMed]
- Selleck, M.J.; Senthil, M.; Wall, N.R. Making Meaningful Clinical Use of Biomarkers. Biomark. Insights 2016, 12. [Google Scholar] [CrossRef] [PubMed]
- Ein-Dor, L.; Zuk, O.; Domany, E. Thousands of samples are needed to generate a robust gene list for predicting outcome in cancer. Proc. Natl. Acad. Sci. USA 2006, 103, 5923–5928. [Google Scholar] [CrossRef]
- Ein-Dor, L.; Kela, I.; Getz, G.; Givol, D.; Domany, E. Outcome signature genes in breast cancer: Is there a unique set? Bioinformatics 2004, 21, 171–178. [Google Scholar] [CrossRef]
- Pan, Y.; Neuss, S.; Leifert, A.; Fischler, M.; Wen, F.; Simon, U.; Schmid, G.; Brandau, W.; Jahnen-Dechent, W. Size-Dependent Cytotoxicity of Gold Nanoparticles. Small 2007, 3, 1941–1949. [Google Scholar] [CrossRef]
- Ben-Hamo, R.; Berger, A.J.; Gavert, N.; Miller, M.; Pines, G.; Oren, R.; Pikarsky, E.; Benes, C.H.; Neuman, T.; Zwang, Y.; et al. Predicting and affecting response to cancer therapy based on pathway-level biomarkers. Nat. Commun. 2020, 11, 3296. [Google Scholar] [CrossRef]
- Li, Z.; Su, Z.; Wen, Z.; Shi, L.; Chen, T. Microarray platform consistency is revealed by biologically functional analysis of gene expression profiles. BMC Bioinform. 2009, 10, S12. [Google Scholar] [CrossRef]
- Wang, J.; Zhang, Y.; Marian, C.; Ressom, H.W. Identification of aberrant pathways and network activities from high-throughput data. Briefings Bioinform. 2012, 13, 406–419. [Google Scholar] [CrossRef]
- Ben-Hamo, R.; Efroni, S. Biomarker robustness reveals the PDGF network as driving disease outcome in ovarian cancer patients in multiple studies. BMC Syst. Biol. 2012, 6, 3. [Google Scholar] [CrossRef] [PubMed]
- Ben-Hamo, R.; Efroni, S. Gene expression and network-based analysis reveals a novel role for hsa-miR-9 and drug control over the p38 network in glioblastoma multiforme progression. Genome Med. 2011, 3, 77. [Google Scholar] [CrossRef] [PubMed]
- Su, J.; Yoon, B.-J.; Dougherty, E.R. Accurate and Reliable Cancer Classification Based on Probabilistic Inference of Pathway Activity. PLoS ONE 2009, 4, e8161. [Google Scholar] [CrossRef] [PubMed]
- Nguyen, T.-M.; Shafi, A.; Nguyen, T.; Draghici, S. Identifying significantly impacted pathways: A comprehensive review and assessment. Genome Biol. 2019, 20, 1–15. [Google Scholar] [CrossRef]
- Alexander, A.; Aleksey, V.B.; Andrew, G.; Leslie, J.; Artem, A.; Maria, S.; Alena, I.; Larisa, V.; Nicolas, B.; Anton, B.; et al. In search for geroprotectors: In silico screening and in vitro validation of signalome-level mimetics of young healthy state. Aging 2016, 8, 2127–2141. [Google Scholar]
- Aravind, S.; Pablo, T.; Vamsi, K.M.; Sayan, M.; Benjamin, L.E.; Michael, A.G.; Amanda, P.; Scott, L.P.; Todd, R.G.; Eric, S.L.; et al. Gene set enrichment analysis: A knowledge-based approach for interpreting genome-wide expression profiles. Proc. Natl. Acad. Sci. 2005, 102, 15545–15550. [Google Scholar]
- Franco, M.; Jeggari, A.; Peuget, S.; Bottger, F.; Selivanova, G.; Alexeyenko, A. Prediction of response to anti-cancer drugs becomes robust via network integration of molecular data. Sci. Rep. 2019, 9, 2379. [Google Scholar] [CrossRef]
- Zhang, W.; Emrich, S.; Zeng, E. A two-stage machine learning approach for pathway analysis. In Proceedings of the IEEE International Conference on Bioinformatics and Biomedicine 2010, Hong Kong, China, 18–21 December 2010; pp. 274–279. [Google Scholar]
- Wang, B.; Kovalchuk, A.; Li, D.; Rodriguez-Juarez, R.; Ilnytskyy, Y.; Kovalchuk, I.; Kovalchuk, O. In search of preventive strategies: Novel high-CBD Cannabis sativa extracts modulate ACE2 expression in COVID-19 gateway tissues. Aging 2020, 12, 22425–22444. [Google Scholar]


| Flowers, % | THC | CBD | CBGA | CBN | TOTAL Cannabinoids | CBD:THC Ratio |
|---|---|---|---|---|---|---|
| #1 | 0.25 | 6.79 | 0.12 | 7.16 | 27.16 | |
| #7 | 0.21 | 7.2 | 0 | 7.41 | 34.29 | |
| #9 | 0.22 | 6.91 | 0.31 | 7.44 | 31.41 | |
| #45 | 0.03 | 1.61 | 1.64 | 53.67 | ||
| #115 | 0.3 | 9.54 | 9.84 | 31.80 | ||
| #129 | 0.28 | 6.75 | 0.66 | 7.69 | 24.11 | |
| #130 | 0.86 | 2.63 | 0.31 | 0.03 | 3.83 | 3.06 |
| #157 | 0.2 | 3.75 | 0.09 | 0.15 | 4.19 | 18.75 |
| #167 | 0.08 | 2.25 | 0.16 | 2.49 | 28.13 | |
| #169 | 0.2 | 1.88 | 0.14 | 2.22 | 9.40 | |
| #274 | 0.44 | 9.02 | 0.31 | 9.77 | 20.50 | |
| Extracts, % | THC | CBD | CBGA | CBN | TOTAL Cannabinoids | CBD:THC Ratio |
| #1 | 0.88 | 34.6 | 0.25 | 0.12 | 35.85 | 39.32 |
| #7 | 1.1 | 32.9 | 0.27 | 0.15 | 34.27 | 29.91 |
| #9 | 0.98 | 32.6 | 0.97 | 0.15 | 34.55 | 33.27 |
| #45 | 0.44 | 24.92 | 0.13 | 0.14 | 25.63 | 56.64 |
| #115 | 1.23 | 42.52 | 0.42 | 0.28 | 44.45 | 34.57 |
| #129 | 1.3 | 35.3 | 1.2 | 0.42 | 38.22 | 27.15 |
| #130 | 2.43 | 28.43 | 0.98 | 0.18 | 32.02 | 11.70 |
| #157 | 0.62 | 33.5 | 0.73 | 0.33 | 34.85 | 54.03 |
| #167 | 0.38 | 24.3 | 0.29 | 0.12 | 24.97 | 63.95 |
| #169 | 0.67 | 19.28 | 0.45 | 0.18 | 20.58 | 28.78 |
| #274 | 0.93 | 43.81 | 1.2 | 0.12 | 46.06 | 47.11 |
| Molarity/µM | THC | CBD | CBGA | CBN | TOTAL Cannabinoids | TOTAL Cannabinoids |
| #1 | 0.28 | 11.00 | 0.08 | 0.04 | ||
| #7 | 0.35 | 10.46 | 0.09 | 0.05 | ||
| #9 | 0.31 | 10.37 | 0.31 | 0.05 | ||
| #45 | 0.14 | 7.92 | 0.04 | 0.05 | ||
| #115 | 0.39 | 13.52 | 0.13 | 0.09 | ||
| #129 | 0.41 | 11.23 | 0.38 | 0.14 | ||
| #130 | 0.77 | 9.04 | 0.31 | 0.06 | ||
| #157 | 0.20 | 10.65 | 0.23 | 0.11 | ||
| #167 | 0.12 | 7.73 | 0.09 | 0.04 | ||
| #169 | 0.21 | 6.13 | 0.14 | 0.06 | ||
| #274 | 0.30 | 13.93 | 0.38 | 0.04 |
| UniProt | Gene Symbol | Gene Name |
|---|---|---|
| UniProtKB: Q12979 | ABR | Active breakpoint cluster region-related protein |
| UniProtKB: P13686 | ACP5 | Tartrate-resistant acid phosphatase type 5 |
| UniProtKB: Q04771 | ACVR1 | Activin receptor type-1 |
| UniProtKB: P00813 | ADA | Adenosine deaminase |
| UniProtKB: P30542 | ADORA1 | Adenosine receptor A1 |
| UniProtKB: P29274 | ADORA2A | Adenosine receptor A2a |
| UniProtKB: P29274 | ADORA2A | Adenosine receptor A2a |
| UniProtKB: P29275 | ADORA2B | Adenosine receptor A2b |
| UniProtKB: Q15109 | AGER | Advanced glycosylation end product-specific receptor |
| UniProtKB: Q15109 | AGER | Advanced glycosylation end product-specific receptor |
| UniProtKB: P50052 | AGTR2 | Type-2 angiotensin II receptor |
| UniProtKB: P50052 | AGTR2 | Type-2 angiotensin II receptor |
| UniProtKB: P23526 | AHCY | Adenosylhomocysteinase |
| UniProtKB: P31749 | AKT1 | RAC-alpha serine/threonine-protein kinase |
| UniProtKB: P09917 | ALOX5 | Arachidonate 5-lipoxygenase |
| UniProtKB: P02652 | APOA2 | Apolipoprotein A-II |
| UniProtKB: Q9NR48 | ASH1L | Histone-lysine N-methyltransferase ASH1L |
| UniProtKB: P00966 | ASS1 | Argininosuccinate synthase |
| UniProtKB: Q13315 | ATM | Serine-protein kinase ATM |
| UniProtKB: P30530 | AXL | Tyrosine-protein kinase receptor UFO |
| UniProtKB: P15291 | B4GALT1 | Beta-1,4-galactosyltransferase 1 |
| UniProtKB: Q9Y5Z0 | BACE2 | Beta-secretase 2 |
| UniProtKB: Q92560 | BAP1 | Ubiquitin carboxyl-terminal hydrolase BAP1 |
| UniProtKB: P11274 | BCR | Breakpoint cluster region protein |
| UniProtKB: P46663 | BDKRB1 | B1 bradykinin receptor |
| UniProtKB: P22004 | BMP6 | Bone morphogenetic protein 6 |
| UniProtKB: O00238 | BMPR1B | Bone morphogenetic protein receptor type-1B |
| UniProtKB: Q06187 | BTK | Tyrosine-protein kinase BTK |
| UniProtKB: Q06187 | BTK | Tyrosine-protein kinase BTK |
| UniProtKB: Q06187 | BTK | Tyrosine-protein kinase BTK |
| UniProtKB: Q5T7M4 | C1QTNF12 | Adipolin |
| UniProtKB: P01024 | C3 | Complement C3 |
| UniProtKB: P01024 | C3 | Complement C3 |
| UniProtKB: Q96GV9 | C5orf30 | UNC119-binding protein C5orf30 |
| UniProtKB: P13671 | C6 | Complement component C6 |
| UniProtKB: P01258 | CALCA | Calcitonin |
| UniProtKB: P01258 | CALCA | Calcitonin |
| UniProtKB: Q16602 | CALCRL | Calcitonin gene-related peptide type 1 receptor |
| UniProtKB: P51671 | CCL11 | Eotaxin |
| UniProtKB: O00175 | CCL24 | C-C motif chemokine 24 |
| UniProtKB: P51679 | CCR4 | C-C chemokine receptor type 4 |
| UniProtKB: P10747 | CD28 | T-cell-specific surface glycoprotein CD28 |
| UniProtKB: P25942 | CD40 | Tumor necrosis factor receptor superfamily member 5 |
| UniProtKB: P40200 | CD96 | T-cell surface protein tactile |
| UniProtKB: Q9BWU1 | CDK19 | Cyclin-dependent kinase 19 |
| UniProtKB: Q9UNI1 | CELA1 | Chymotrypsin-like elastase family member 1 |
| UniProtKB: O15516 | CLOCK | Circadian locomoter output cycles protein kaput |
| UniProtKB: P21554 | CNR1 | Cannabinoid receptor 1 |
| UniProtKB: P21554 | CNR1 | Cannabinoid receptor 1 |
| UniProtKB: P34972 | CNR2 | Cannabinoid receptor 2 |
| UniProtKB: P25025 | CXCR2 | C-X-C chemokine receptor type 2 |
| UniProtKB: P11511 | CYP19A1 | Aromatase |
| UniProtKB: Q9NR63 | CYP26B1 | Cytochrome P450 26B1 |
| UniProtKB: Q9Y271 | CYSLTR1 | Cysteinyl leukotriene receptor 1 |
| UniProtKB: Q9NRR4 | DROSHA | Ribonuclease 3 |
| UniProtKB: Q1HG43 | DUOXA1 | Dual oxidase maturation factor 1 |
| UniProtKB: Q1HG44 | DUOXA2 | Dual oxidase maturation factor 2 |
| UniProtKB: Q9Y6W6 | DUSP10 | Dual specificity protein phosphatase 10 |
| UniProtKB: Q16610 | ECM1 | Extracellular matrix protein 1 |
| UniProtKB: P24530 | EDNRB | Endothelin receptor type B |
| UniProtKB: P00533 | EGFR | Epidermal growth factor receptor |
| UniProtKB: P00533 | EGFR | Epidermal growth factor receptor |
| UniProtKB: Q9BQI3 | EIF2AK1 | Eukaryotic translation initiation factor 2-alpha kinase 1 |
| UniProtKB: P08246 | ELANE | Neutrophil elastase |
| UniProtKB: P29317 | EPHA2 | Ephrin type-A receptor 2 |
| UniProtKB: P01588 | EPO | Erythropoietin |
| UniProtKB: P03372 | ESR1 | Estrogen receptor |
| UniProtKB: P14921 | ETS1 | Protein C-ets-1 |
| UniProtKB: P15090 | FABP4 | Fatty acid-binding protein, adipocyte |
| UniProtKB: O15360 | FANCA | Fanconi anemia group A protein |
| UniProtKB: Q9BXW9 | FANCD2 | Fanconi anemia group D2 protein |
| UniProtKB: P30273 | FCER1G | High affinity immunoglobulin epsilon receptor subunit gamma |
| UniProtKB: P30273 | FCER1G | High affinity immunoglobulin epsilon receptor subunit gamma |
| UniProtKB: P30273 | FCER1G | High affinity immunoglobulin epsilon receptor subunit gamma |
| UniProtKB: P30273 | FCER1G | High affinity immunoglobulin epsilon receptor subunit gamma |
| UniProtKB: Q12946 | FOXF1 | Forkhead box protein F1 |
| UniProtKB: Q9BZS1 | FOXP3 | Forkhead box protein P3 |
| UniProtKB: P22466 | GAL | Galanin peptides |
| UniProtKB: P23771 | GATA3 | Trans-acting T-cell-specific transcription factor GATA-3 |
| UniProtKB: Q13304 | GPR17 | Uracil nucleotide/cysteinyl leukotriene receptor |
| UniProtKB: P07203 | GPX1 | Glutathione peroxidase 1 |
| UniProtKB: P36969 | GPX4 | Phospholipid hydroperoxide glutathione peroxidase |
| UniProtKB: P81172 | HAMP | Hepcidin |
| UniProtKB: Q30201 | HFE | Hereditary hemochromatosis protein |
| UniProtKB: P14210 | HGF | Hepatocyte growth factor |
| UniProtKB: Q96A08 | HIST1H2BA | Histone H2B type 1-A |
| UniProtKB: P10809 | HSPD1 | 60 kDa heat shock protein, mitochondrial |
| UniProtKB: P05362 | ICAM1 | Intercellular adhesion molecule 1 |
| UniProtKB: P14902 | IDO1 | Indoleamine 2,3-dioxygenase 1 |
| UniProtKB: P14902 | IDO1 | Indoleamine 2,3-dioxygenase 1 |
| UniProtKB: P22692 | IGFBP4 | Insulin-like growth factor-binding protein 4 |
| UniProtKB: P22301 | IL10 | Interleukin-10 |
| UniProtKB: P29460 | IL12B | Interleukin-12 subunit beta |
| UniProtKB: P35225 | IL13 | Interleukin-13 |
| UniProtKB: P40933 | IL15 | Interleukin-15 |
| UniProtKB: Q9UHF5 | IL17B | Interleukin-17B |
| UniProtKB: Q96PD4 | IL17F | Interleukin-17F |
| UniProtKB: Q96F46 | IL17RA | Interleukin-17 receptor A |
| UniProtKB: Q9NRM6 | IL17RB | Interleukin-17 receptor B |
| UniProtKB: Q8NAC3 | IL17RC | Interleukin-17 receptor C |
| UniProtKB: P01583 | IL1A | Interleukin-1 alpha |
| UniProtKB: P14778 | IL1R1 | Interleukin-1 receptor type 1 |
| UniProtKB: P27930 | IL1R2 | Interleukin-1 receptor type 2 |
| UniProtKB: Q01638 | IL1RL1 | Interleukin-1 receptor-like 1 |
| UniProtKB: Q9HB29 | IL1RL2 | Interleukin-1 receptor-like 2 |
| UniProtKB: P60568 | IL2 | Interleukin-2 |
| UniProtKB: Q6UXL0 | IL20RB | Interleukin-20 receptor subunit beta |
| UniProtKB: Q6UXL0 | IL20RB | Interleukin-20 receptor subunit beta |
| UniProtKB: Q969J5 | IL22RA2 | Interleukin-22 receptor subunit alpha-2 |
| UniProtKB: Q9H293 | IL25 | Interleukin-25 |
| UniProtKB: P01589 | IL2RA | Interleukin-2 receptor subunit alpha |
| UniProtKB: P01589 | IL2RA | Interleukin-2 receptor subunit alpha |
| UniProtKB: Q8NI17 | IL31RA | Interleukin-31 receptor subunit alpha |
| UniProtKB: O95760 | IL33 | Interleukin-33 |
| UniProtKB: P05113 | IL5 | Interleukin-5 |
| UniProtKB: Q01344 | IL5RA | Interleukin-5 receptor subunit alpha |
| UniProtKB: P17301 | ITGA2 | Integrin alpha-2 |
| UniProtKB: P05107 | ITGB2 | Integrin beta-2 |
| UniProtKB: P18564 | ITGB6 | Integrin beta-6 |
| UniProtKB: O60674 | JAK2 | Tyrosine-protein kinase JAK2 |
| UniProtKB:Q9BX67 | JAM3 | Junctional adhesion molecule C |
| UniProtKB: P05412 | JUN | Transcription factor AP-1 |
| UniProtKB: O15054 | KDM6B | Lysine-specific demethylase 6B |
| UniProtKB: P04264 | KRT1 | Keratin, type II cytoskeletal 1 |
| UniProtKB: P18428 | LBP | Lipopolysaccharide-binding protein |
| UniProtKB: P01130 | LDLR | Low-density lipoprotein receptor |
| UniProtKB: P38571 | LIPA | Lysosomal acid lipase/cholesteryl ester hydrolase |
| UniProtKB: Q5S007 | LRRK2 | Leucine-rich repeat serine/threonine-protein kinase 2 |
| UniProtKB: P01374 | LTA | Lymphotoxin-alpha |
| UniProtKB: P07948 | LYN | Tyrosine-protein kinase Lyn |
| UniProtKB: P07948 | LYN | Tyrosine-protein kinase Lyn |
| UniProtKB: P46734 | MAP2K3 | Dual specificity mitogen-activated protein kinase kinase 3 |
| UniProtKB: P04201 | MAS1 | Proto-oncogene Mas |
| UniProtKB: Q8NEM0 | MCPH1 | Microcephalin |
| UniProtKB: P43490 | NAMPT | Nicotinamide phosphoribosyltransferase |
| UniProtKB: Q16236 | NFE2L2 | Nuclear factor erythroid 2-related factor 2 |
| UniProtKB: P19838 | NFKB1 | Nuclear factor NF-kappa-B p105 subunit |
| UniProtKB: Q9BYH8 | NFKBIZ | NF-kappa-B inhibitor zeta |
| UniProtKB: P59044 | NLRP6 | NACHT, LRR and PYD domains-containing protein 6 |
| UniProtKB: Q86UT6 | NLRX1 | NLR family member X1 |
| UniProtKB: P46531 | NOTCH1 | Neurogenic locus notch homolog protein 1 |
| UniProtKB: O15130 | NPFF | Pro-FMRFamide-related neuropeptide FF |
| UniProtKB: P01160 | NPPA | Natriuretic peptides A |
| UniProtKB: Q15761 | NPY5R | Neuropeptide Y receptor type 5 |
| UniProtKB: Q15761 | NPY5R | Neuropeptide Y receptor type 5 |
| UniProtKB: P21589 | NT5E | 5’-nucleotidase |
| UniProtKB: O60356 | NUPR1 | Nuclear protein 1 |
| UniProtKB: O15527 | OGG1 | N-glycosylase/DNA lyase |
| UniProtKB: P35372 | OPRM1 | Mu-type opioid receptor |
| UniProtKB: P51575 | P2RX1 | P2X purinoceptor 1 |
| UniProtKB: Q99572 | P2RX7 | P2X purinoceptor 7 |
| UniProtKB: Q96KB5 | PBK | Lymphokine-activated killer T-cell-originated protein kinase |
| UniProtKB: O75594 | PGLYRP1 | Peptidoglycan recognition protein 1 |
| UniProtKB: Q96PD5 | PGLYRP2 | N-acetylmuramoyl-L-alanine amidase |
| UniProtKB: P48736 | PIK3CG | Phosphatidylinositol 4,5-bisphosphate 3-kinase catalytic subunit gamma isoform |
| UniProtKB: Q9Y263 | PLAA | Phospholipase A-2-activating protein |
| UniProtKB: P60201 | PLP1 | Myelin proteolipid protein |
| UniProtKB: P06746 | POLB | DNA polymerase beta |
| UniProtKB: P37231 | PPARG | Peroxisome proliferator-activated receptor gamma |
| UniProtKB: P42785 | PRCP | Lysosomal Pro-X carboxypeptidase |
| UniProtKB: P28070 | PSMB4 | Proteasome subunit beta type-4 |
| UniProtKB: P25105 | PTAFR | Platelet-activating factor receptor |
| UniProtKB: O14684 | PTGES | Prostaglandin E synthase |
| UniProtKB: O14684 | PTGES | Prostaglandin E synthase |
| UniProtKB: P35354 | PTGS2 | Prostaglandin G/H synthase 2 |
| UniProtKB: Q9ULZ3 | PYCARD | Apoptosis-associated speck-like protein containing a CARD |
| UniProtKB: O95267 | RASGRP1 | RAS guanyl-releasing protein 1 |
| UniProtKB: Q06330 | RBPJ | Recombining binding protein suppressor of hairless |
| UniProtKB: Q9Y3P4 | RHBDD3 | Rhomboid domain-containing protein 3 |
| UniProtKB: Q6R327 | RICTOR | Rapamycin-insensitive companion of mTOR |
| UniProtKB: P05109 | S100A8 | Protein S100-A8 |
| UniProtKB: P05109 | S100A8 | Protein S100-A8 |
| UniProtKB: Q99500 | S1PR3 | Sphingosine 1-phosphate receptor 3 |
| UniProtKB: Q15858 | SCN9A | Sodium channel protein type 9 subunit alpha |
| UniProtKB: P18827 | SDC1 | Syndecan-1 |
| UniProtKB: Q96EE3 | SEH1L | Nucleoporin SEH1 |
| UniProtKB: P16109 | SELP | P-selectin |
| UniProtKB: P01008 | SERPINC1 | Antithrombin-III |
| UniProtKB: P36955 | SERPINF1 | Pigment epithelium-derived factor |
| UniProtKB: Q86VZ5 | SGMS1 | Phosphatidylcholine:ceramide cholinephosphotransferase 1 |
| UniProtKB: P52569 | SLC7A2 | Cationic amino acid transporter 2 |
| UniProtKB: P52569 | SLC7A2 | Cationic amino acid transporter 2 |
| UniProtKB: Q15797 | SMAD1 | Mothers against decapentaplegic homolog 1 |
| UniProtKB: P84022 | SMAD3 | Mothers against decapentaplegic homolog 3 |
| UniProtKB: Q99835 | SMO | Smoothened homolog |
| UniProtKB: O14543 | SOCS3 | Suppressor of cytokine signaling 3 |
| UniProtKB: O75159 | SOCS5 | Suppressor of cytokine signaling 5 |
| UniProtKB: Q9NYA1 | SPHK1 | Sphingosine kinase 1 |
| UniProtKB: P10451 | SPP1 | Osteopontin |
| UniProtKB: P40763 | STAT3 | Signal transducer and activator of transcription 3 |
| UniProtKB: P51692 | STAT5B | Signal transducer and activator of transcription 5B |
| UniProtKB: Q9UEW8 | STK39 | STE20/SPS1-related proline-alanine-rich protein kinase |
| UniProtKB: Q9BXA5 | SUCNR1 | Succinate receptor 1 |
| UniProtKB: P20366 | TAC1 | Protachykinin-1 |
| UniProtKB: Q9NUY8 | TBC1D23 | TBC1 domain family member 23 |
| UniProtKB: Q9UP52 | TFR2 | Transferrin receptor protein 2 |
| UniProtKB: P21980 | TGM2 | Protein-glutamine gamma-glutamyltransferase 2 |
| UniProtKB: P01033 | TIMP1 | Metalloproteinase inhibitor 1 |
| UniProtKB: O60603 | TLR2 | Toll-like receptor 2 |
| UniProtKB: O15455 | TLR3 | Toll-like receptor 3 |
| UniProtKB: O00206 | TLR4 | Toll-like receptor 4 |
| UniProtKB: Q9Y2C9 | TLR6 | Toll-like receptor 6 |
| UniProtKB: Q9NYK1 | TLR7 | Toll-like receptor 7 |
| UniProtKB: Q9NR97 | TLR8 | Toll-like receptor 8 |
| UniProtKB: P01375 | TNF | Tumor necrosis factor |
| UniProtKB: P21580 | TNFAIP3 | Tumor necrosis factor alpha-induced protein 3 |
| UniProtKB: P20333 | TNFRSF1B | Tumor necrosis factor receptor superfamily member 1B |
| UniProtKB: P20333 | TNFRSF1B | Tumor necrosis factor receptor superfamily member 1B |
| UniProtKB: Q8NER1 | TRPV1 | Transient receptor potential cation channel subfamily V member 1 |
| UniProtKB: Q8NER1 | TRPV1 | Transient receptor potential cation channel subfamily V member 1 |
| UniProtKB: Q9HBA0 | TRPV4 | Transient receptor potential cation channel subfamily V member 4 |
| UniProtKB: O60636 | TSPAN2 | Tetraspanin-2 |
| UniProtKB: O75896 | TUSC2 | Tumor suppressor candidate 2 |
| UniProtKB: P55089 | UCN | Urocortin |
| UniProtKB: P22309 | UGT1A1 | UDP-glucuronosyltransferase 1-1 |
| UniProtKB: Q70J99 | UNC13D | Protein unc-13 homolog D |
| UniProtKB: P19320 | VCAM1 | Vascular cell adhesion protein 1 |
| UniProtKB: P19320 | VCAM1 | Vascular cell adhesion protein 1 |
| UniProtKB: Q9HC57 | WFDC1 | WAP four-disulfide core domain protein 1 |
| UniProtKB: Q15942 | ZYX | Zyxin |
| Data Set | Sample | Number of Profiles | t-Value | p-Value | CDEI |
|---|---|---|---|---|---|
| DMSO | Control (C) | 3 | 0 | 1 | - |
| UV | Untreated (U) | 3 | 1.04 | 0.23 | 0.00 |
| Extract #4 | Treated (T) | 5 | 0.67 | 0.50 | 0.22 |
| Extract #12 | Treated (T) | 5 | 2.06 | 0.04 | −0.33 |
| Extract #8 | Treated (T) | 5 | −0.19 | 0.85 | 0.69 |
| Extract #13 | Treated (T) | 5 | −1.04 | 0.30 | 0.00 |
| Data Set | Sample | t-Value | p-Value | CDEI |
|---|---|---|---|---|
| DMSO | Control (C) | - | - | - |
| TNFα | Untreated (U) | −2.78 | 0.006 | 0.00 |
| Extract #1 | Treated (T) | 0.86 | 0.39 | 0.53 |
| Extract #7 | Treated (T) | 0.19 | 0.85 | 0.87 |
| Extract #9 | Treated (T) | −0.03 | 0.98 | 0.98 |
| Extract #45 | Treated (T) | −2.02 | 0.04 | 0.16 |
| Extract #115 | Treated (T) | −0.15 | 0.88 | 0.90 |
| Extract #129 | Treated (T) | −0.63 | 0.53 | 0.63 |
| Extract #157 | Treated (T) | −0.29 | 0.77 | 0.81 |
| Extract #167 | Treated (T) | −2.27 | 0.02 | 0.10 |
| Extract #169 | Treated (T) | −0.17 | 0.86 | 0.88 |
| Data Set | Sample | t-Value | p-Value | CDEI |
|---|---|---|---|---|
| DMSO | Control (C) | - | - | - |
| TNFα | Untreated (U) | 2.43 | 0.016 | 0.00 |
| Extract #1 | Treated (T) | −1.37 | 0.17 | 0.28 |
| Extract #7 | Treated (T) | 1.15 | 0.25 | 0.36 |
| Extract #9 | Treated (T) | 1.43 | 0.15 | 0.26 |
| Extract #45 | Treated (T) | 1.02 | 0.31 | 0.41 |
| Extract #115 | Treated (T) | 0.21 | 0.84 | 0.84 |
| Extract #129 | Treated (T) | −0.56 | 0.58 | 0.63 |
| Extract #130 | Treated (T) | 1.56 | 0.12 | 0.22 |
| Extract #169 | Treated (T) | 1.75 | 0.08 | 0.16 |
| Extract #274 | Treated (T) | 0.99 | 0.32 | 0.42 |
Publisher’s Note: MDPI stays neutral with regard to jurisdictional claims in published maps and institutional affiliations. |
© 2020 by the authors. Licensee MDPI, Basel, Switzerland. This article is an open access article distributed under the terms and conditions of the Creative Commons Attribution (CC BY) license (http://creativecommons.org/licenses/by/4.0/).
Share and Cite
Borisov, N.; Ilnytskyy, Y.; Byeon, B.; Kovalchuk, O.; Kovalchuk, I. System, Method and Software for Calculation of a Cannabis Drug Efficiency Index for the Reduction of Inflammation. Int. J. Mol. Sci. 2021, 22, 388. https://doi.org/10.3390/ijms22010388
Borisov N, Ilnytskyy Y, Byeon B, Kovalchuk O, Kovalchuk I. System, Method and Software for Calculation of a Cannabis Drug Efficiency Index for the Reduction of Inflammation. International Journal of Molecular Sciences. 2021; 22(1):388. https://doi.org/10.3390/ijms22010388
Chicago/Turabian StyleBorisov, Nicolas, Yaroslav Ilnytskyy, Boseon Byeon, Olga Kovalchuk, and Igor Kovalchuk. 2021. "System, Method and Software for Calculation of a Cannabis Drug Efficiency Index for the Reduction of Inflammation" International Journal of Molecular Sciences 22, no. 1: 388. https://doi.org/10.3390/ijms22010388
APA StyleBorisov, N., Ilnytskyy, Y., Byeon, B., Kovalchuk, O., & Kovalchuk, I. (2021). System, Method and Software for Calculation of a Cannabis Drug Efficiency Index for the Reduction of Inflammation. International Journal of Molecular Sciences, 22(1), 388. https://doi.org/10.3390/ijms22010388