Alpha-5 Integrin Mediates Simvastatin-Induced Osteogenesis of Bone Marrow Mesenchymal Stem Cells


 and
and 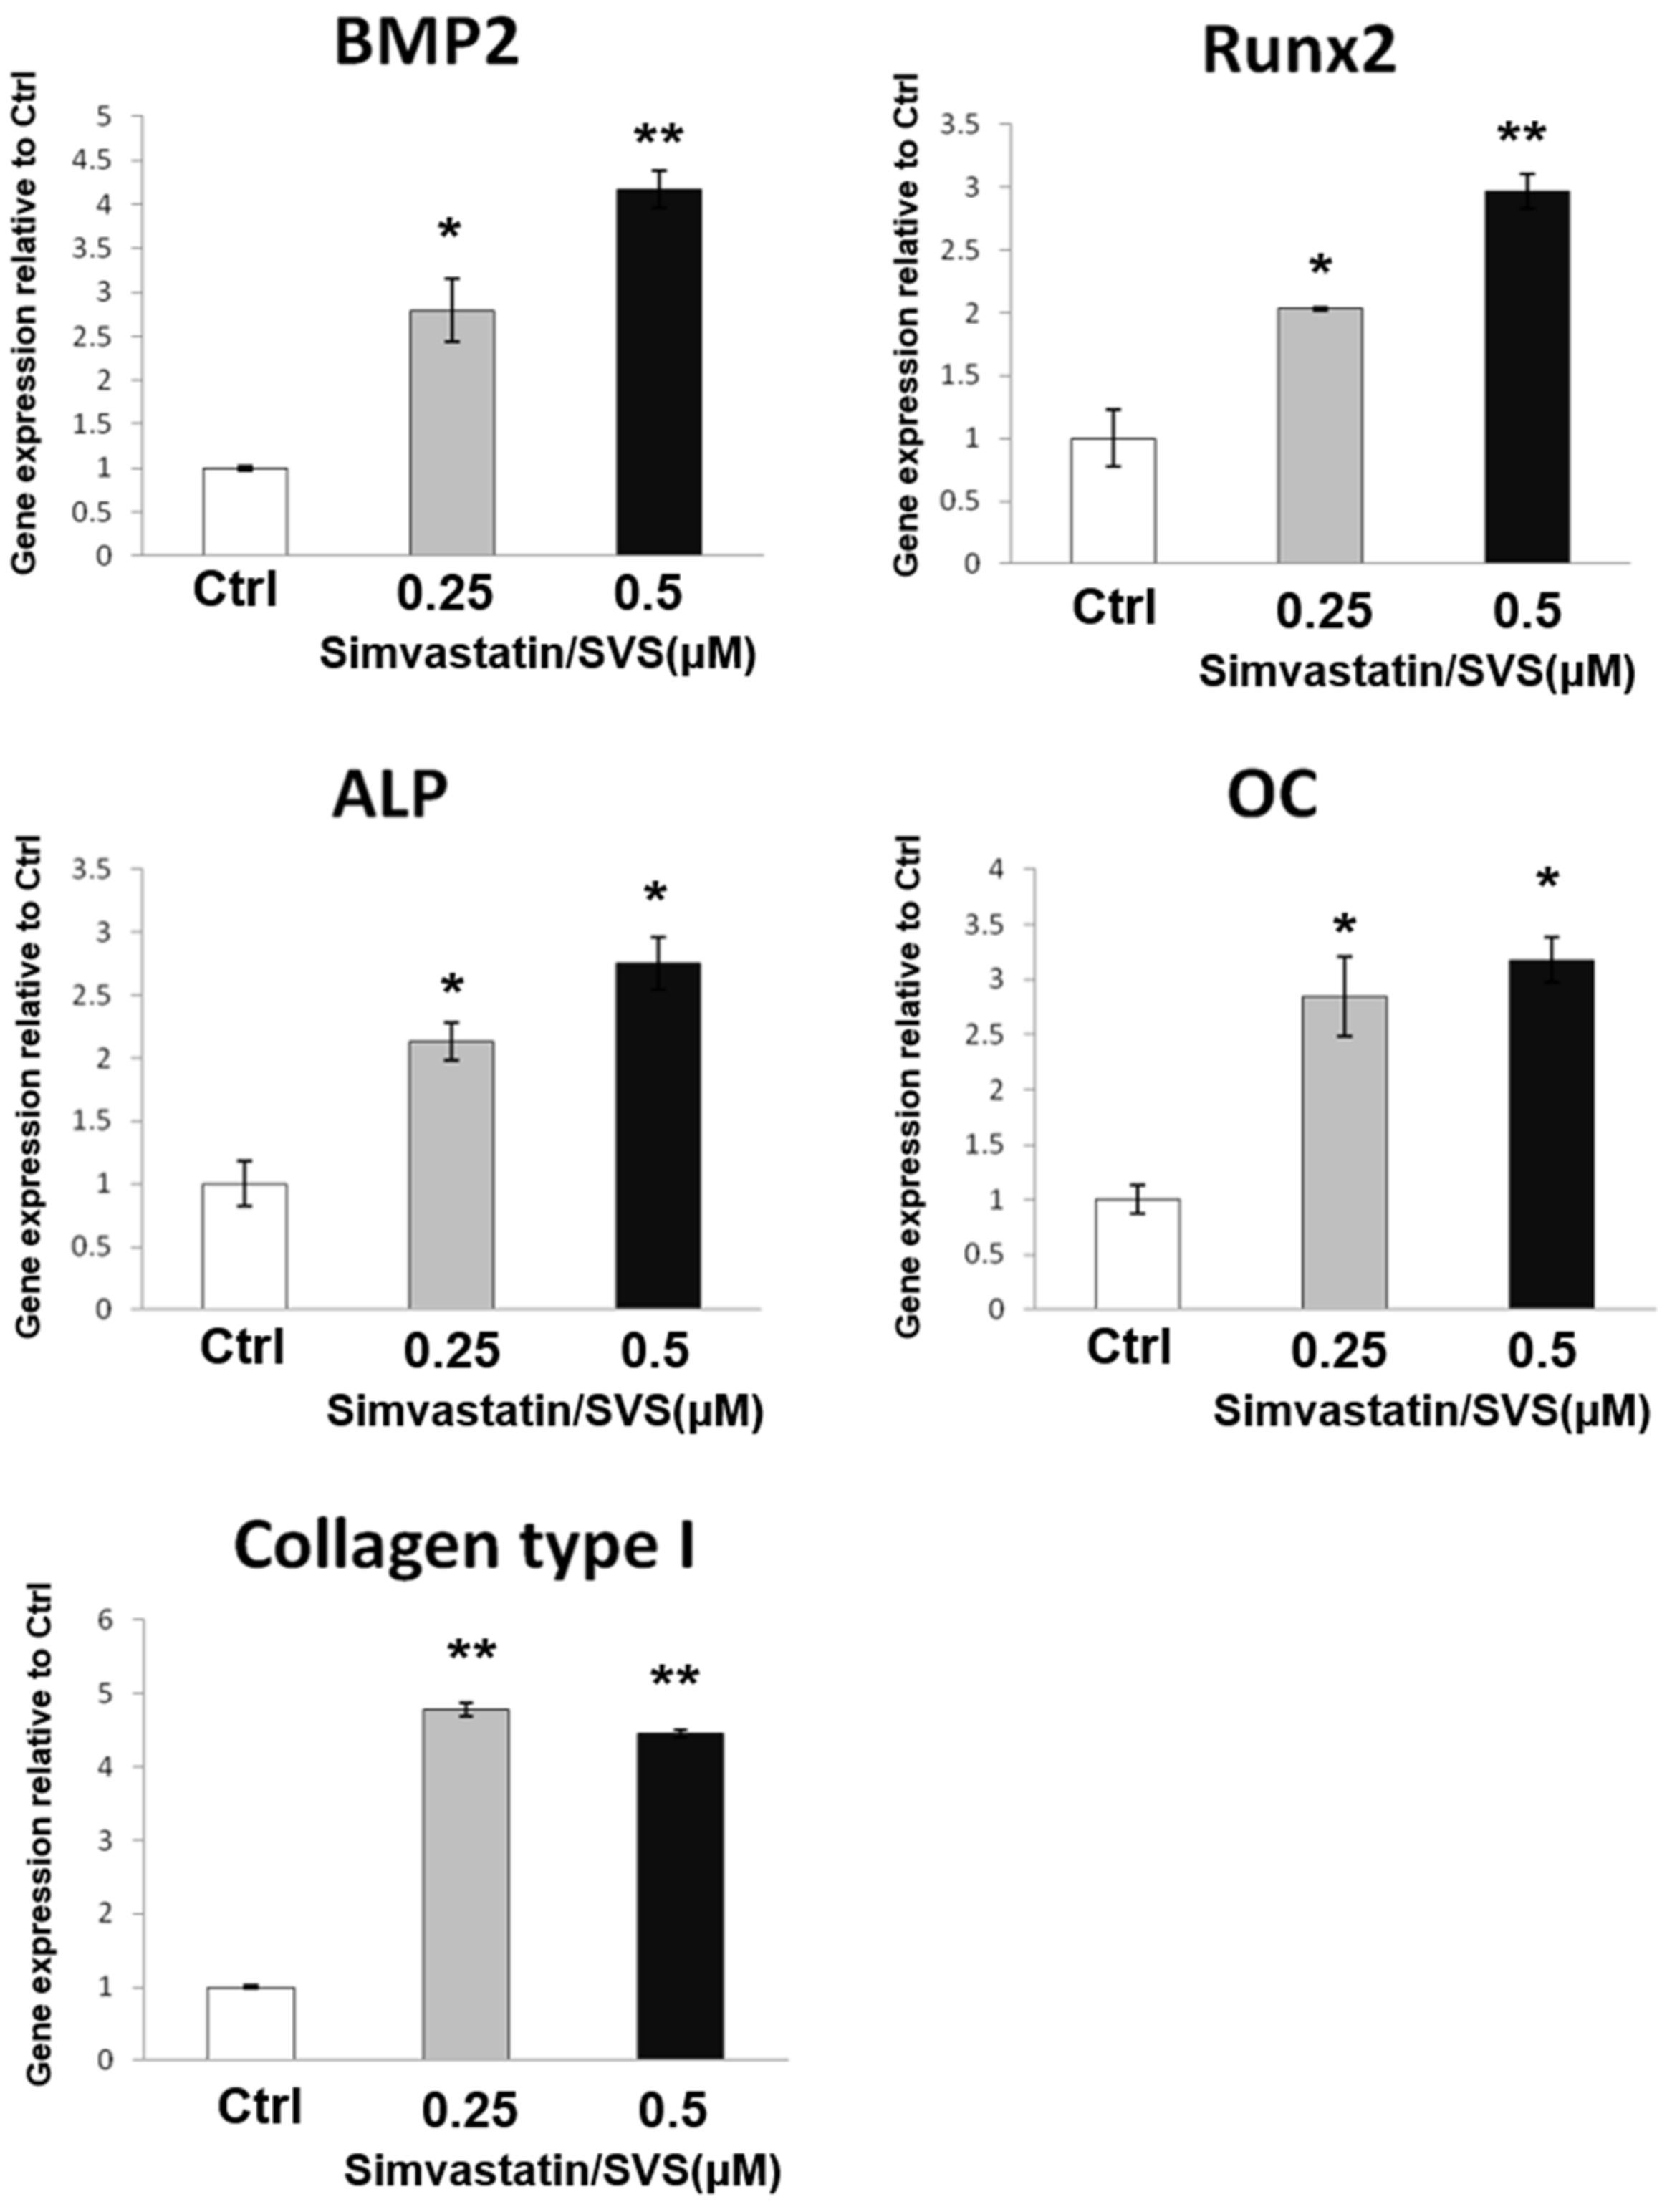
Abstract
1. Introduction
2. Results
2.1. SVS Increased the mRNA Expression of Osteogenic Markers in D1 Cells
2.2. SVS Enhanced ALP Activity and Calcium Deposition in D1 Cells
2.3. SVS Increased the Expression Levels of α5 Integrin on the Cell Surface of D1 Cells
2.4. SVS Treatment Increased the Phosphorylation of Focal Adhesion Kinase (FAK) and Increased the Protein Expression Level of α5 Integrin in D1 Cells
2.5. Depletion of α5 Integrin in D1 Cells Using α5 Integrin siRNA
2.6. α5 Integrin Silencing Reduced the mRNA Expression Levels of Osteogenic Marker Genes in D1 Cells during SVS-Induced Osteogenic Differentiation
2.7. α5 Integrin Silencing Reduced ALP Activity and Calcium Deposition in D1 Cells during SVS-Induced Osteogenic Differentiation
3. Discussion
4. Materials and Methods
4.1. Materials
4.2. D1 Cells
4.3. SVS Preparation and Treatment
4.4. β1, β3, α2, αV, and α5 Integrin Detection by Flow Cytometry
4.5. RNA Isolation and Quantitative Real-Time Polymerase Chain Reaction (qRT-PCR)
4.6. Western Blot Analysis
4.7. α5 Integrin siRNA Transfection
4.8. Alkaline Phosphatase (ALP) Activity Staining
4.9. Alizarin Red S Staining and Quantification
4.10. Statistical Analysis
5. Conclusions
Author Contributions
Funding
Acknowledgments
Conflicts of Interest
References
- Bianco, P.; Robey, P.G. Stem cells in tissue engineering. Nature 2001, 414, 118–121. [Google Scholar] [CrossRef] [PubMed]
- Hamidouche, Z.; Fromigue, O.; Ringe, J.; Haupl, T.; Vaudin, P.; Pages, J.C.; Srouji, S.; Livne, E.; Marie, P.J. Priming integrin alpha5 promotes human mesenchymal stromal cell osteoblast differentiation and osteogenesis. Proc. Natl. Acad. Sci. USA 2009, 106, 18587–18591. [Google Scholar] [CrossRef] [PubMed]
- Ho-Shui-Ling, A.; Bolander, J.; Rustom, L.E.; Johnson, A.W.; Luyten, F.P.; Picart, C. Bone regeneration strategies: Engineered scaffolds, bioactive molecules and stem cells current stage and future perspectives. Biomaterials 2018, 180, 143–162. [Google Scholar] [CrossRef] [PubMed]
- Muraglia, A.; Cancedda, R.; Quarto, R. Clonal mesenchymal progenitors from human bone marrow differentiate in vitro according to a hierarchical model. J. Cell Sci. 2000, 113 Pt 7, 1161–1166. [Google Scholar]
- Marie, P.J. Targeting integrins to promote bone formation and repair. Nat. Rev. Endocrinol. 2013, 9, 288–295. [Google Scholar] [CrossRef] [PubMed]
- Pizzicannella, J.; Cavalcanti, M.; Trubiani, O.; Diomede, F. MicroRNA 210 Mediates VEGF Upregulation in Human Periodontal Ligament Stem Cells Cultured on 3DHydroxyapatite Ceramic Scaffold. Int. J. Mol. Sci. 2018, 19, 3916. [Google Scholar] [CrossRef]
- Diomede, F.; Gugliandolo, A.; Scionti, D.; Merciaro, I.; Cavalcanti, M.F.; Mazzon, E.; Trubiani, O. Biotherapeutic Effect of Gingival Stem Cells Conditioned Medium in Bone Tissue Restoration. Int. J. Mol. Sci. 2018, 19, 329. [Google Scholar] [CrossRef]
- Petite, H.; Viateau, V.; Bensaid, W.; Meunier, A.; de Pollak, C.; Bourguignon, M.; Oudina, K.; Sedel, L.; Guillemin, G. Tissue-engineered bone regeneration. Nat. Biotechnol. 2000, 18, 959–963. [Google Scholar] [CrossRef]
- Shah, S.R.; Werlang, C.A.; Kasper, F.K.; Mikos, A.G. Novel applications of statins for bone regeneration. Natl. Sci. Rev. 2015, 2, 85–99. [Google Scholar] [CrossRef]
- Ishida, K.; Haudenschild, D.R. Interactions between FGF21 and BMP-2 in osteogenesis. Biochem. Biophys. Res. Commun. 2013, 432, 677–682. [Google Scholar] [CrossRef]
- Nishimura, R.; Kato, Y.; Chen, D.; Harris, S.E.; Mundy, G.R.; Yoneda, T. Smad5 and DPC4 are key molecules in mediating BMP-2-induced osteoblastic differentiation of the pluripotent mesenchymal precursor cell line C2C12. J. Biol. Chem. 1998, 273, 1872–1879. [Google Scholar] [CrossRef] [PubMed]
- Oryan, A.; Kamali, A.; Moshiri, A. Potential mechanisms and applications of statins on osteogenesis: Current modalities, conflicts and future directions. J. Control. Release 2015, 215, 12–24. [Google Scholar] [CrossRef] [PubMed]
- Chen, P.Y.; Sun, J.S.; Tsuang, Y.H.; Chen, M.H.; Weng, P.W.; Lin, F.H. Simvastatin promotes osteoblast viability and differentiation via Ras/Smad/Erk/BMP-2 signaling pathway. Nutr. Res. 2010, 30, 191–199. [Google Scholar] [CrossRef] [PubMed]
- Wu, H.; Lu, D.; Jiang, H.; Xiong, Y.; Qu, C.; Li, B.; Mahmood, A.; Zhou, D.; Chopp, M. Simvastatin-mediated upregulation of VEGF and BDNF, activation of the PI3K/Akt pathway, and increase of neurogenesis are associated with therapeutic improvement after traumatic brain injury. J. Neurotrauma 2008, 25, 130–139. [Google Scholar] [CrossRef] [PubMed]
- Sugiyama, M.; Kodama, T.; Konishi, K.; Abe, K.; Asami, S.; Oikawa, S. Compactin and simvastatin, but not pravastatin, induce bone morphogenetic protein-2 in human osteosarcoma cells. Biochem. Biophys. Res. Commun. 2000, 271, 688–692. [Google Scholar] [CrossRef] [PubMed]
- Kupcsik, L.; Meurya, T.; Flury, M.; Stoddart, M.; Alini, M. Statin-induced calcification in human mesenchymal stem cells is cell death related. J. Cell. Mol. Med. 2009, 13, 4465–4473. [Google Scholar] [CrossRef]
- Mendes Junior, D.; Domingues, J.A.; Hausen, M.A.; Cattani, S.M.M.; Aragones, A.; Oliveira, A.L.R.; Inacio, R.F.; Barbo, M.L.P.; Duek, E.A.R. Study of mesenchymal stem cells cultured on a poly(lactic-co-glycolic acid) scaffold containing simvastatin for bone healing. J. Appl. Biomater. Funct. Mater. 2017, 15, e133–e141. [Google Scholar] [CrossRef]
- Moursi, A.M.; Globus, R.K.; Damsky, C.H. Interactions between integrin receptors and fibronectin are required for calvarial osteoblast differentiation in vitro. J. Cell Sci. 1997, 110 Pt 18, 2187–2196. [Google Scholar]
- Franceschi, R.T. The developmental control of osteoblast-specific gene expression: Role of specific transcription factors and the extracellular matrix environment. Crit. Rev. Oral Biol. Med. 1999, 10, 40–57. [Google Scholar] [CrossRef]
- Zimmerman, D.; Jin, F.; Leboy, P.; Hardy, S.; Damsky, C. Impaired bone formation in transgenic mice resulting from altered integrin function in osteoblasts. Dev. Biol. 2000, 220, 2–15. [Google Scholar] [CrossRef]
- De Franceschi, N.; Hamidi, H.; Alanko, J.; Sahgal, P.; Ivaska, J. Integrin traffic—The update. J. Cell Sci. 2015, 128, 839–852. [Google Scholar] [CrossRef] [PubMed]
- Hynes, R.O. Integrins: Bidirectional, allosteric signaling machines. Cell 2002, 110, 673–687. [Google Scholar] [CrossRef]
- Humphries, J.D.; Byron, A.; Humphries, M.J. Integrin ligands at a glance. J. Cell Sci. 2006, 119 Pt 19, 3901–3903. [Google Scholar] [CrossRef]
- Ruoslahti, E.; Reed, J.C. Anchorage dependence, integrins, and apoptosis. Cell 1994, 77, 477–478. [Google Scholar] [CrossRef]
- Zhang, Z.; Vuori, K.; Reed, J.C.; Ruoslahti, E. The alpha 5 beta 1 integrin supports survival of cells on fibronectin and up-regulates Bcl-2 expression. Proc. Natl. Acad. Sci. USA 1995, 92, 6161–6165. [Google Scholar] [CrossRef] [PubMed]
- Marie, P.J.; Kassem, M. Osteoblasts in osteoporosis: Past, emerging, and future anabolic targets. Eur. J. Endocrinol. 2011, 165, 1–10. [Google Scholar] [CrossRef] [PubMed]
- Aubin, J.E. Regulation of osteoblast formation and function. Rev. Endocr. Metab. Disord. 2001, 2, 81–94. [Google Scholar] [CrossRef] [PubMed]
- Lian, J.B.; Javed, A.; Zaidi, S.K.; Lengner, C.; Montecino, M.; van Wijnen, A.J.; Stein, J.L.; Stein, G.S. Regulatory controls for osteoblast growth and differentiation: Role of Runx/Cbfa/AML factors. Crit. Rev. Eukaryot. Gene Expr. 2004, 14, 1–41. [Google Scholar] [CrossRef]
- Karsenty, G. Minireview: Transcriptional control of osteoblast differentiation. Endocrinology 2001, 142, 2731–2733. [Google Scholar] [CrossRef]
- Marie, P.J. Transcription factors controlling osteoblastogenesis. Arch. Biochem. Biophys. 2008, 473, 98–105. [Google Scholar] [CrossRef]
- Aubin, J.E. Bone stem cells. J. Cell. Biochem. 1998, 72 (Suppl. 30–31), 73–82. [Google Scholar] [CrossRef]
- Karsenty, G.; Wagner, E.F. Reaching a genetic and molecular understanding of skeletal development. Dev. Cell 2002, 2, 389–406. [Google Scholar] [CrossRef]
- Komori, T. Signaling networks in RUNX2-dependent bone development. J. Cell. Biochem. 2011, 112, 750–755. [Google Scholar] [CrossRef]
- Rosen, V. BMP2 signaling in bone development and repair. Cytokine Growth Factor Rev. 2009, 20, 475–480. [Google Scholar] [CrossRef] [PubMed]
- Kyrkanides, S.; Yang, M.; Tallents, R.H.; Miller, J.N.; Brouxhon, S.M.; Olschowka, J.A. The trigeminal retrograde transfer pathway in the treatment of neurodegeneration. J. Neuroimmunol. 2009, 209, 139–142. [Google Scholar] [CrossRef] [PubMed]
- Ma, X.Y.; Feng, Y.F.; Wang, T.S.; Lei, W.; Li, X.; Zhou, D.P.; Wen, X.X.; Yu, H.L.; Xiang, L.B.; Wang, L. Involvement of FAK-mediated BMP-2/Smad pathway in mediating osteoblast adhesion and differentiation on nano-HA/chitosan composite coated titanium implant under diabetic conditions. Biomater. Sci. 2017, 6, 225–238. [Google Scholar] [CrossRef] [PubMed]
- Tamura, Y.; Takeuchi, Y.; Suzawa, M.; Fukumoto, S.; Kato, M.; Miyazono, K.; Fujita, T. Focal adhesion kinase activity is required for bone morphogenetic protein--Smad1 signaling and osteoblastic differentiation in murine MC3T3-E1 cells. J. Bone Miner. Res. 2001, 16, 1772–1779. [Google Scholar] [CrossRef]
- Ge, C.; Yang, Q.; Zhao, G.; Yu, H.; Kirkwood, K.L.; Franceschi, R.T. Interactions between extracellular signal-regulated kinase 1/2 and p38 MAP kinase pathways in the control of RUNX2 phosphorylation and transcriptional activity. J. Bone Miner. Res. 2012, 27, 538–551. [Google Scholar] [CrossRef]
- Salasznyk, R.M.; Klees, R.F.; Boskey, A.; Plopper, G.E. Activation of FAK is necessary for the osteogenic differentiation of human mesenchymal stem cells on laminin-5. J. Cell. Biochem. 2007, 100, 499–514. [Google Scholar] [CrossRef]
- Diduch, D.R.; Coe, M.R.; Joyner, C.; Owen, M.E.; Balian, G. Two cell lines from bone marrow that differ in terms of collagen synthesis, osteogenic characteristics, and matrix mineralization. J. Bone Joint Surg. Am. 1993, 75, 92–105. [Google Scholar] [CrossRef]
- Wu, S.C.; Chen, C.H.; Wang, J.Y.; Lin, Y.S.; Chang, J.K.; Ho, M.L. Hyaluronan size alters chondrogenesis of adipose-derived stem cells via the CD44/ERK/SOX-9 pathway. Acta Biomater. 2018, 66, 224–237. [Google Scholar] [CrossRef] [PubMed]
- Wu, S.C.; Huang, P.Y.; Chen, C.H.; Teong, B.; Chen, J.W.; Wu, C.W.; Chang, J.K.; Ho, M.L. Hyaluronan microenvironment enhances cartilage regeneration of human adipose-derived stem cells in a chondral defect model. Int. J. Biol. Macromol. 2018, 119, 726–740. [Google Scholar] [CrossRef] [PubMed]
- Livak, K.J.; Schmittgen, T.D. Analysis of relative gene expression data using real-time quantitative PCR and the 2(-Delta Delta C(T)) Method. Methods 2001, 25, 402–408. [Google Scholar] [CrossRef] [PubMed]
- Takacs, R.; Matta, C.; Somogyi, C.; Juhasz, T.; Zakany, R. Comparative analysis of osteogenic/chondrogenic differentiation potential in primary limb bud-derived and C3H10T1/2 cell line-based mouse micromass cultures. Int. J. Mol. Sci. 2013, 14, 16141–16167. [Google Scholar] [CrossRef] [PubMed]


© 2019 by the authors. Licensee MDPI, Basel, Switzerland. This article is an open access article distributed under the terms and conditions of the Creative Commons Attribution (CC BY) license (http://creativecommons.org/licenses/by/4.0/).
Share and Cite
Shao, P.-L.; Wu, S.-C.; Lin, Z.-Y.; Ho, M.-L.; Chen, C.-H.; Wang, C.-Z. Alpha-5 Integrin Mediates Simvastatin-Induced Osteogenesis of Bone Marrow Mesenchymal Stem Cells. Int. J. Mol. Sci. 2019, 20, 506. https://doi.org/10.3390/ijms20030506
Shao P-L, Wu S-C, Lin Z-Y, Ho M-L, Chen C-H, Wang C-Z. Alpha-5 Integrin Mediates Simvastatin-Induced Osteogenesis of Bone Marrow Mesenchymal Stem Cells. International Journal of Molecular Sciences. 2019; 20(3):506. https://doi.org/10.3390/ijms20030506
Chicago/Turabian StyleShao, Pei-Lin, Shun-Cheng Wu, Zih-Yin Lin, Mei-Ling Ho, Chung-Hwan Chen, and Chau-Zen Wang. 2019. "Alpha-5 Integrin Mediates Simvastatin-Induced Osteogenesis of Bone Marrow Mesenchymal Stem Cells" International Journal of Molecular Sciences 20, no. 3: 506. https://doi.org/10.3390/ijms20030506
APA StyleShao, P.-L., Wu, S.-C., Lin, Z.-Y., Ho, M.-L., Chen, C.-H., & Wang, C.-Z. (2019). Alpha-5 Integrin Mediates Simvastatin-Induced Osteogenesis of Bone Marrow Mesenchymal Stem Cells. International Journal of Molecular Sciences, 20(3), 506. https://doi.org/10.3390/ijms20030506