PD-L1 Nanobody Competitively Inhibits the Formation of the PD-1/PD-L1 Complex: Comparative Molecular Dynamics Simulations

Abstract
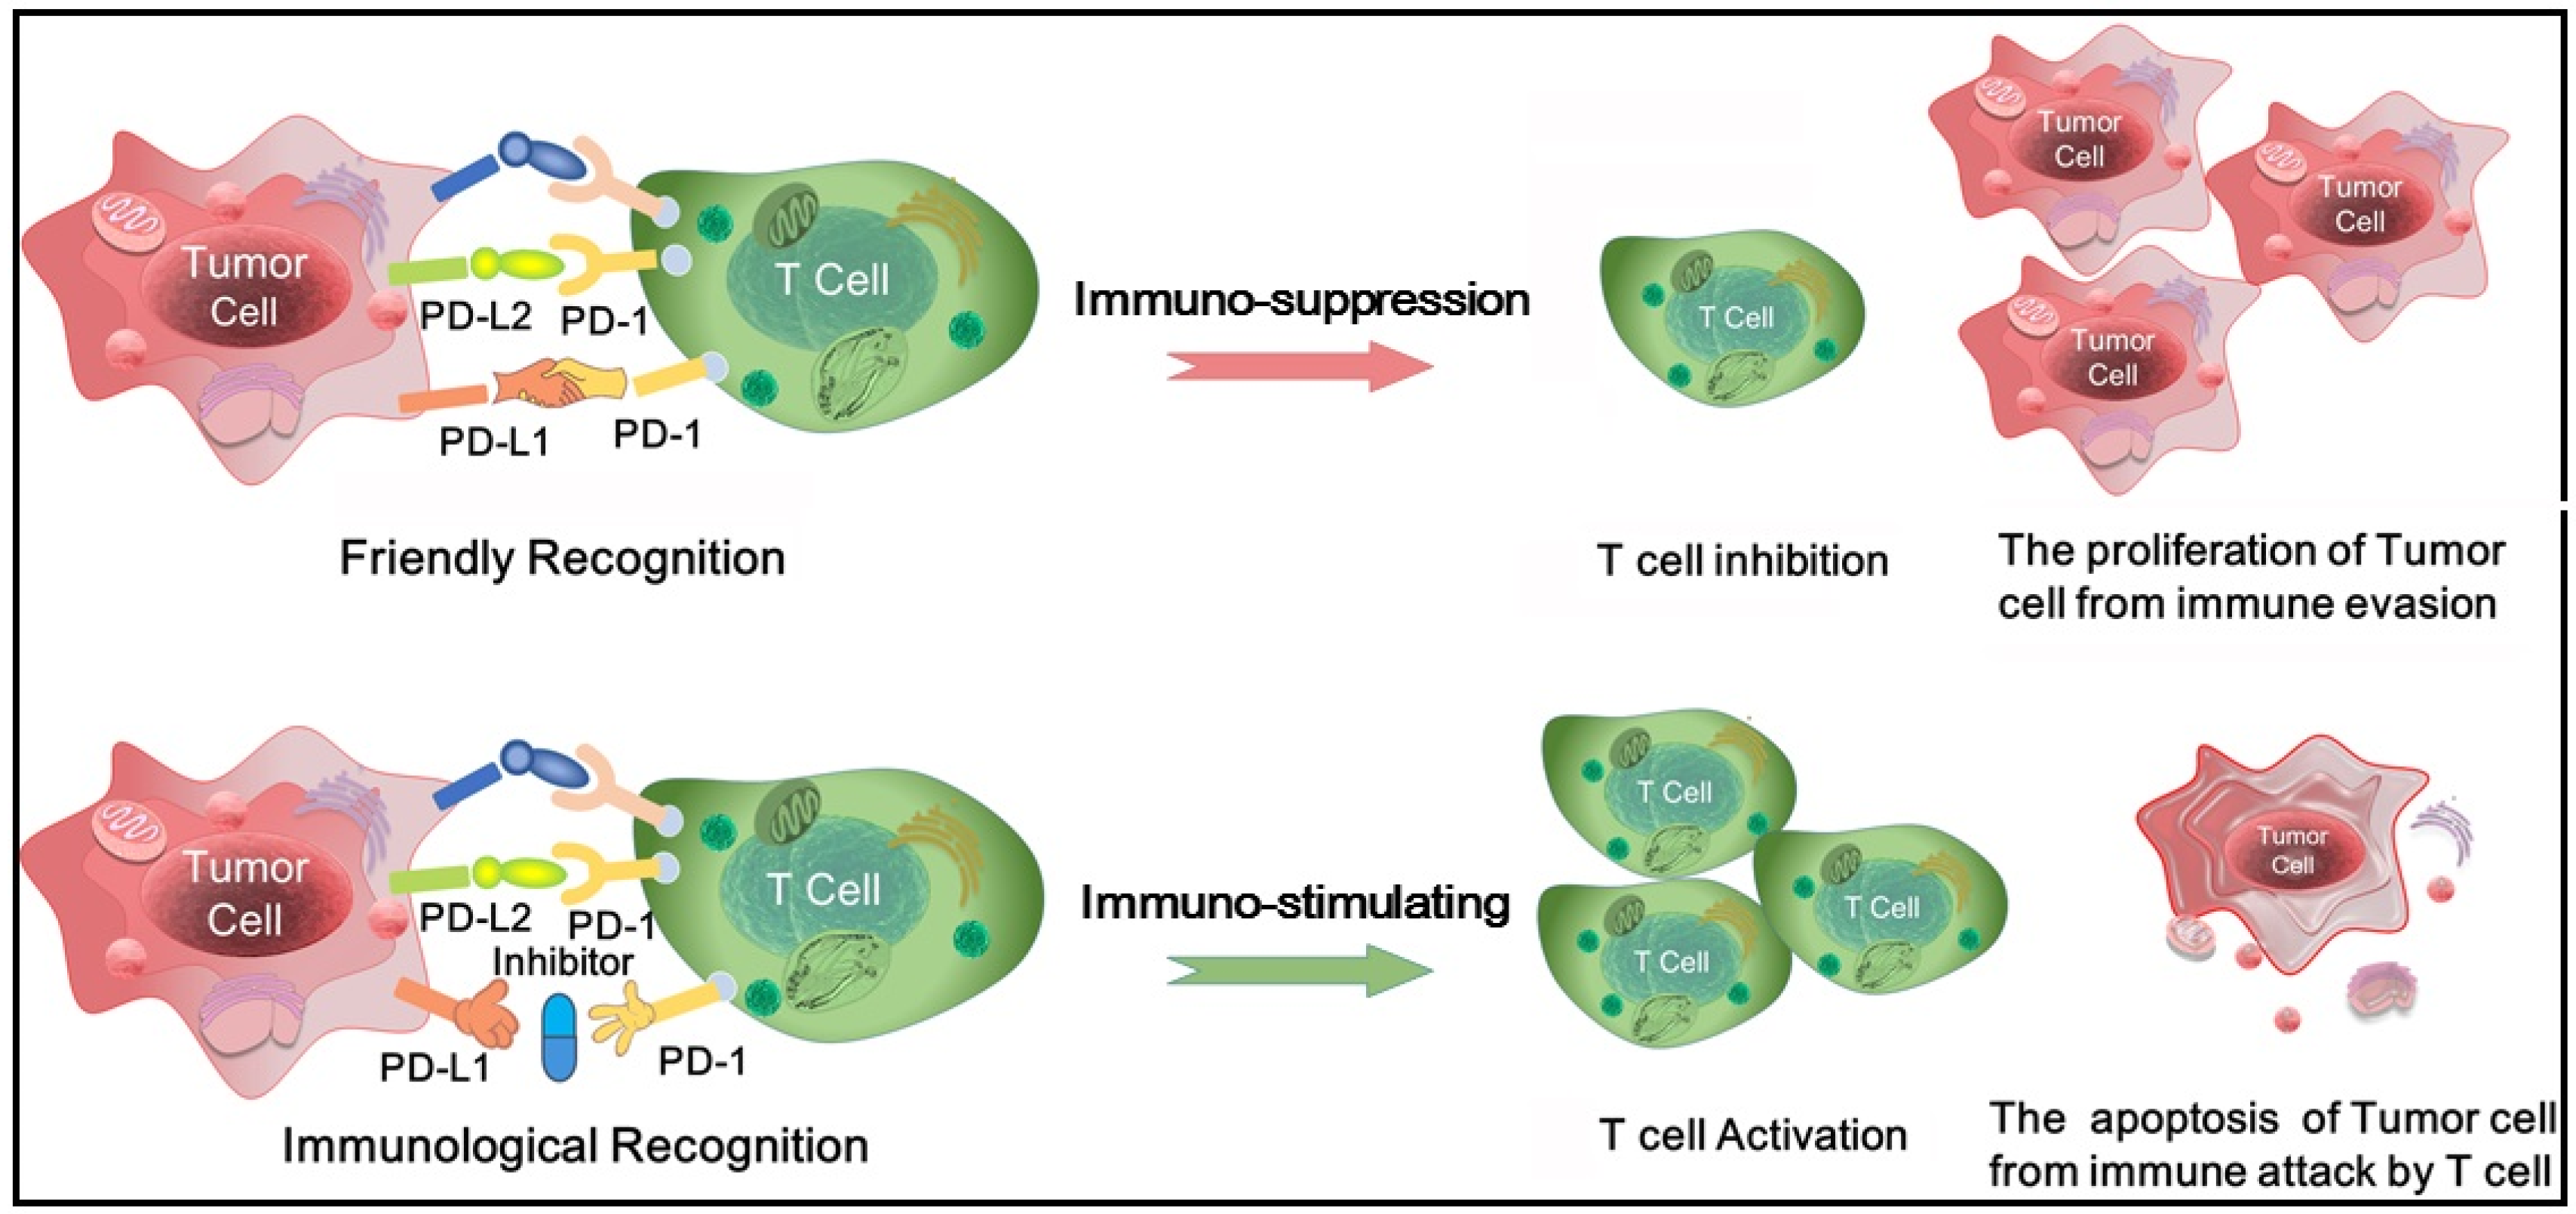
1. Introduction
2. Results and Discussion
2.1. Structural Biology Survey of PD-1/PD-L1
2.2. Development of Antibodies Targeting PD-1/PD-L1
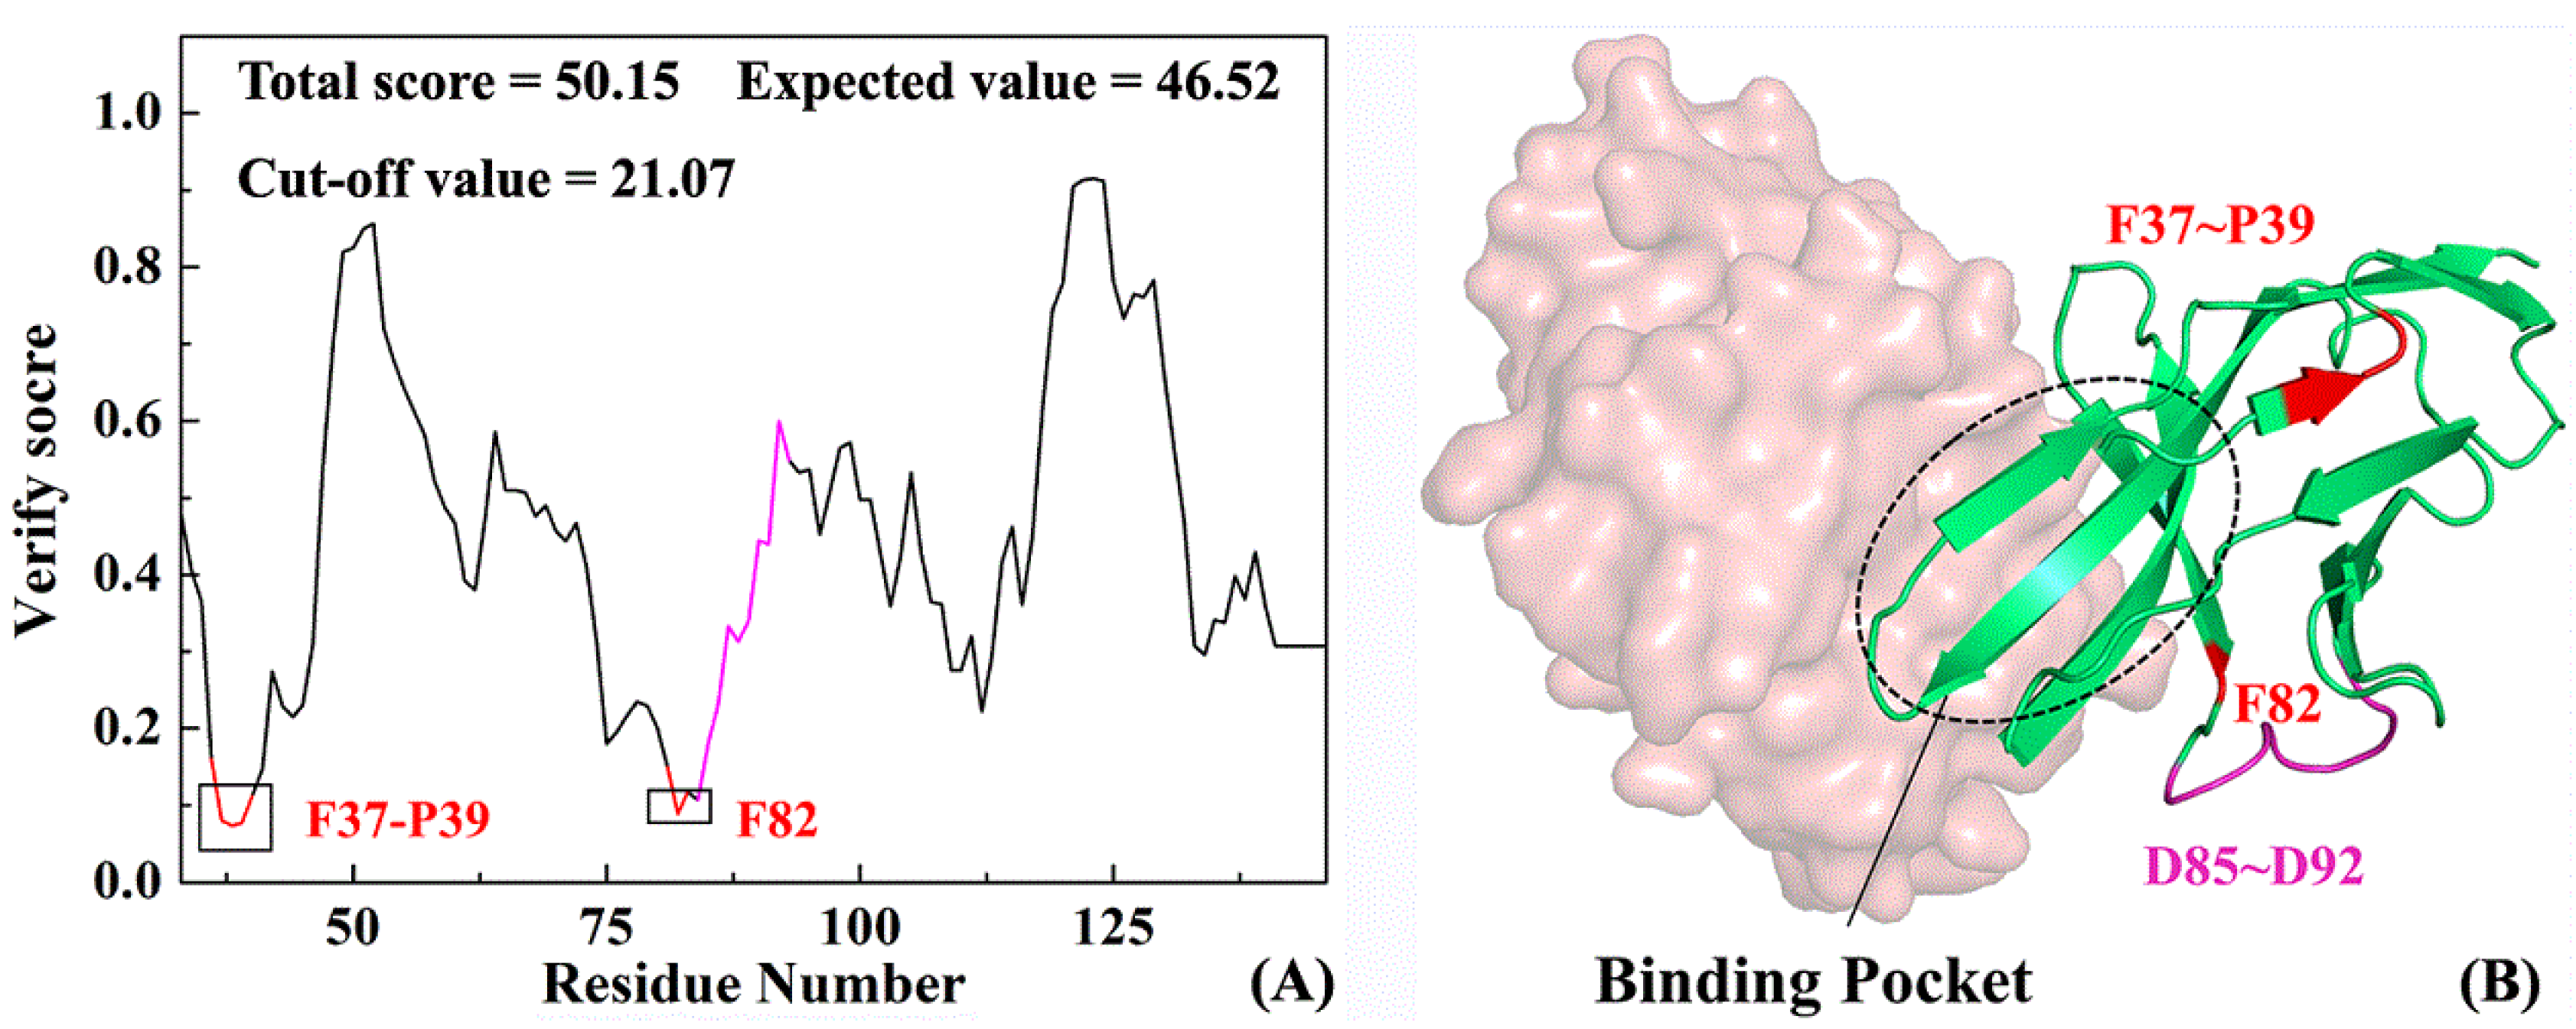
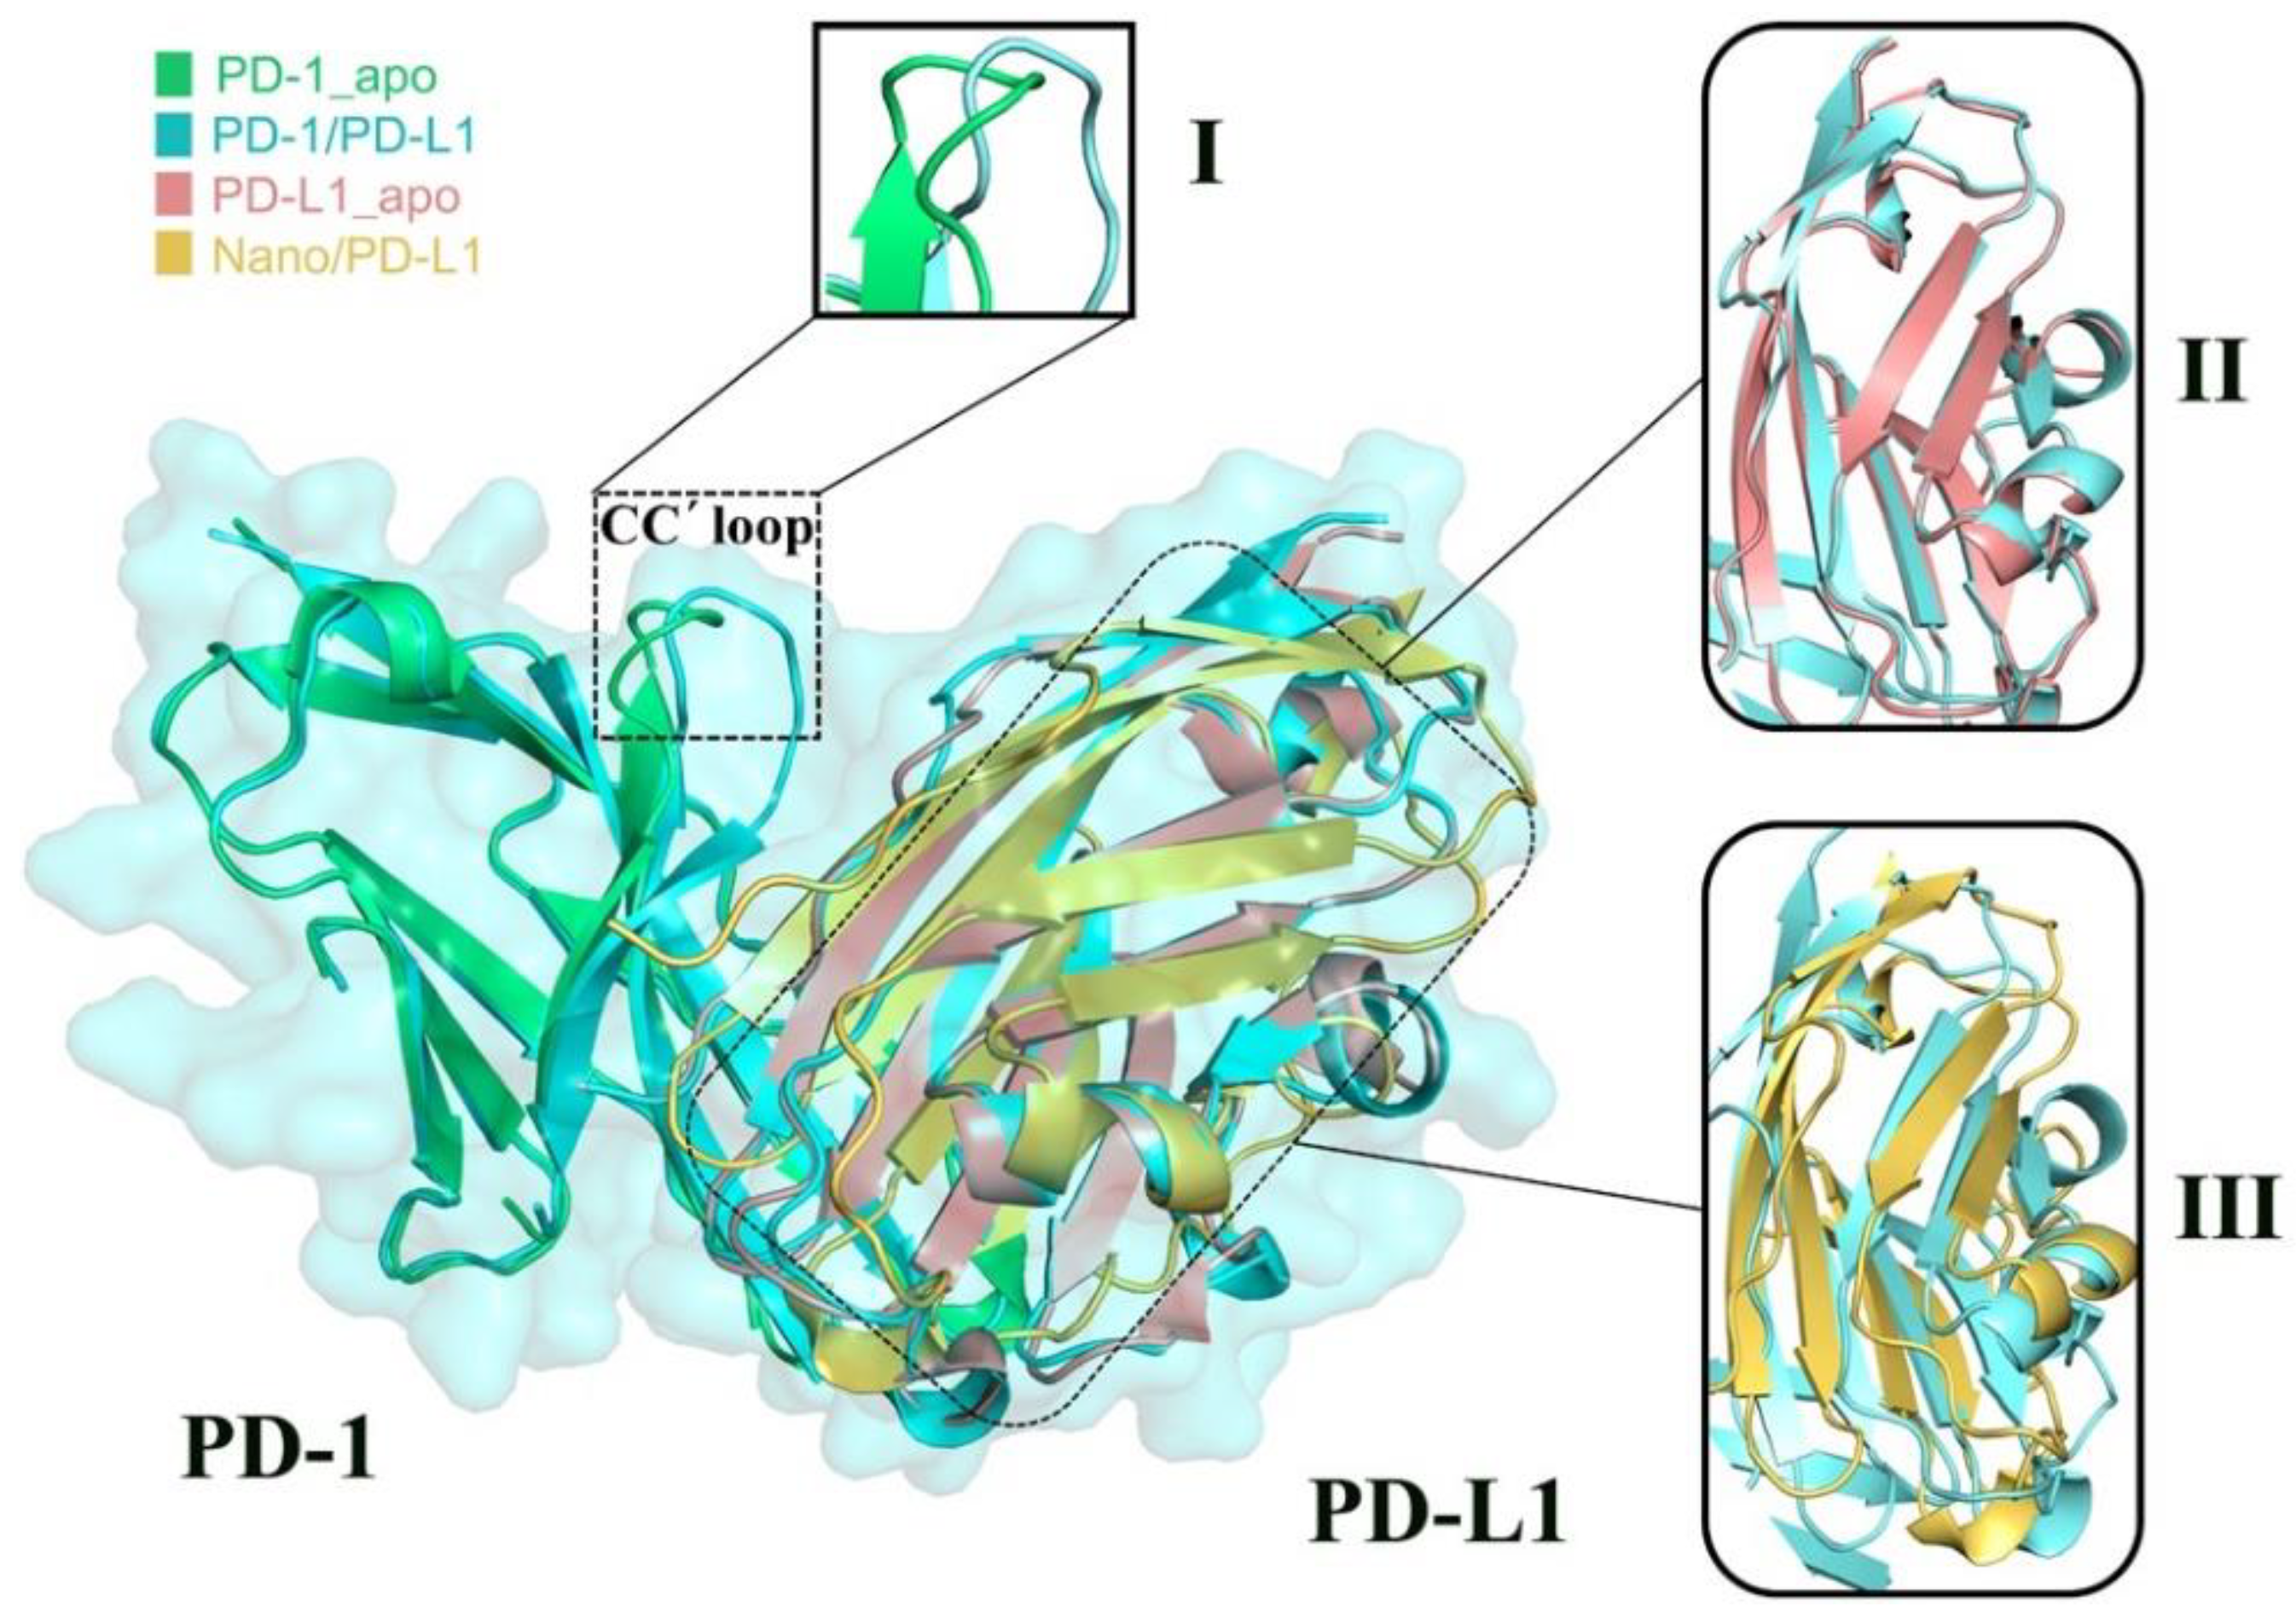
2.3. Structure Complement of PD-1
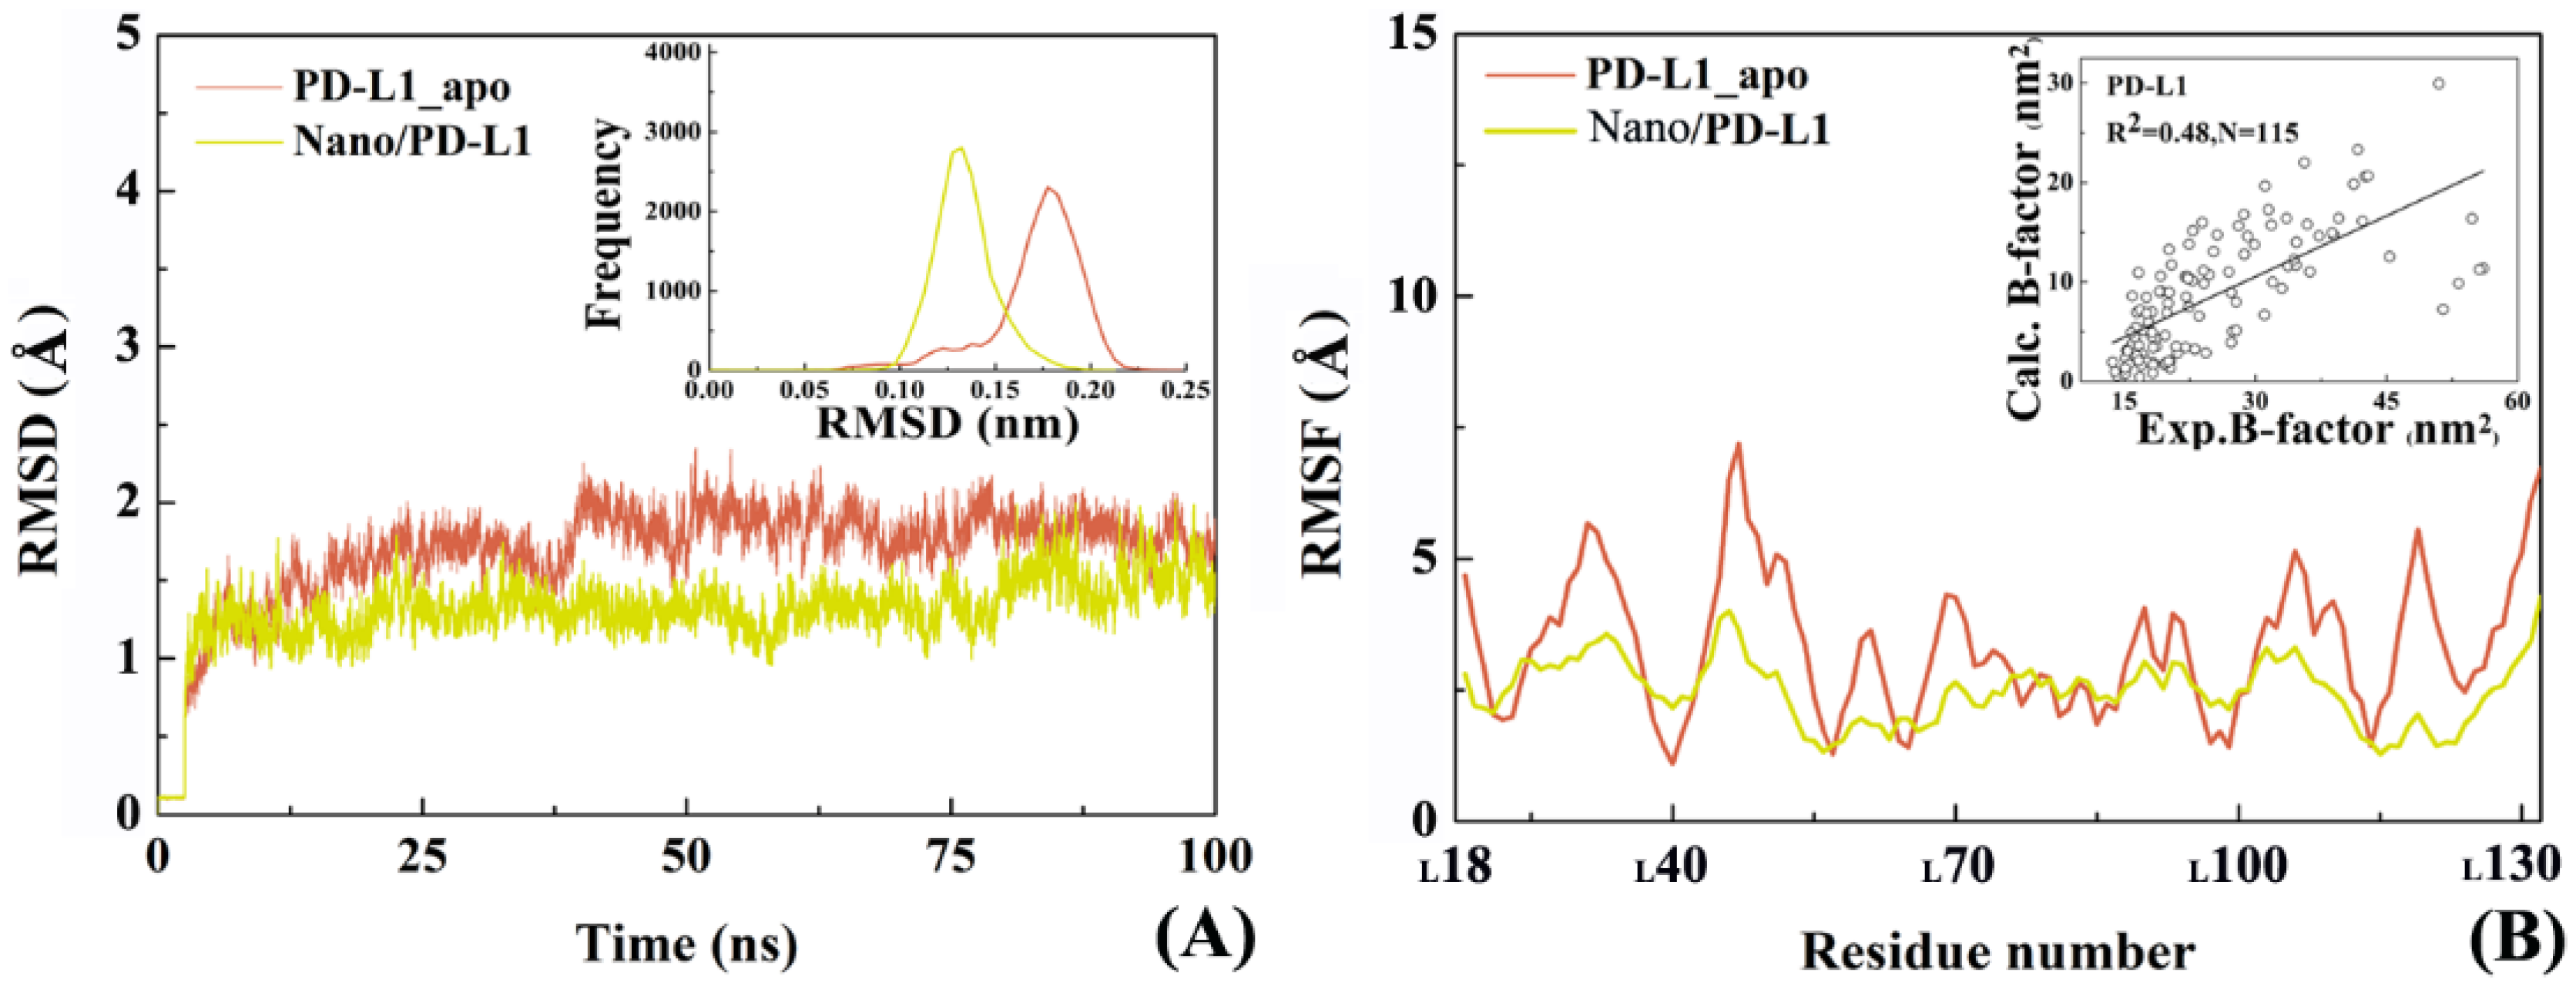
2.4. The Reliability of Molecular Dynamics Simulations
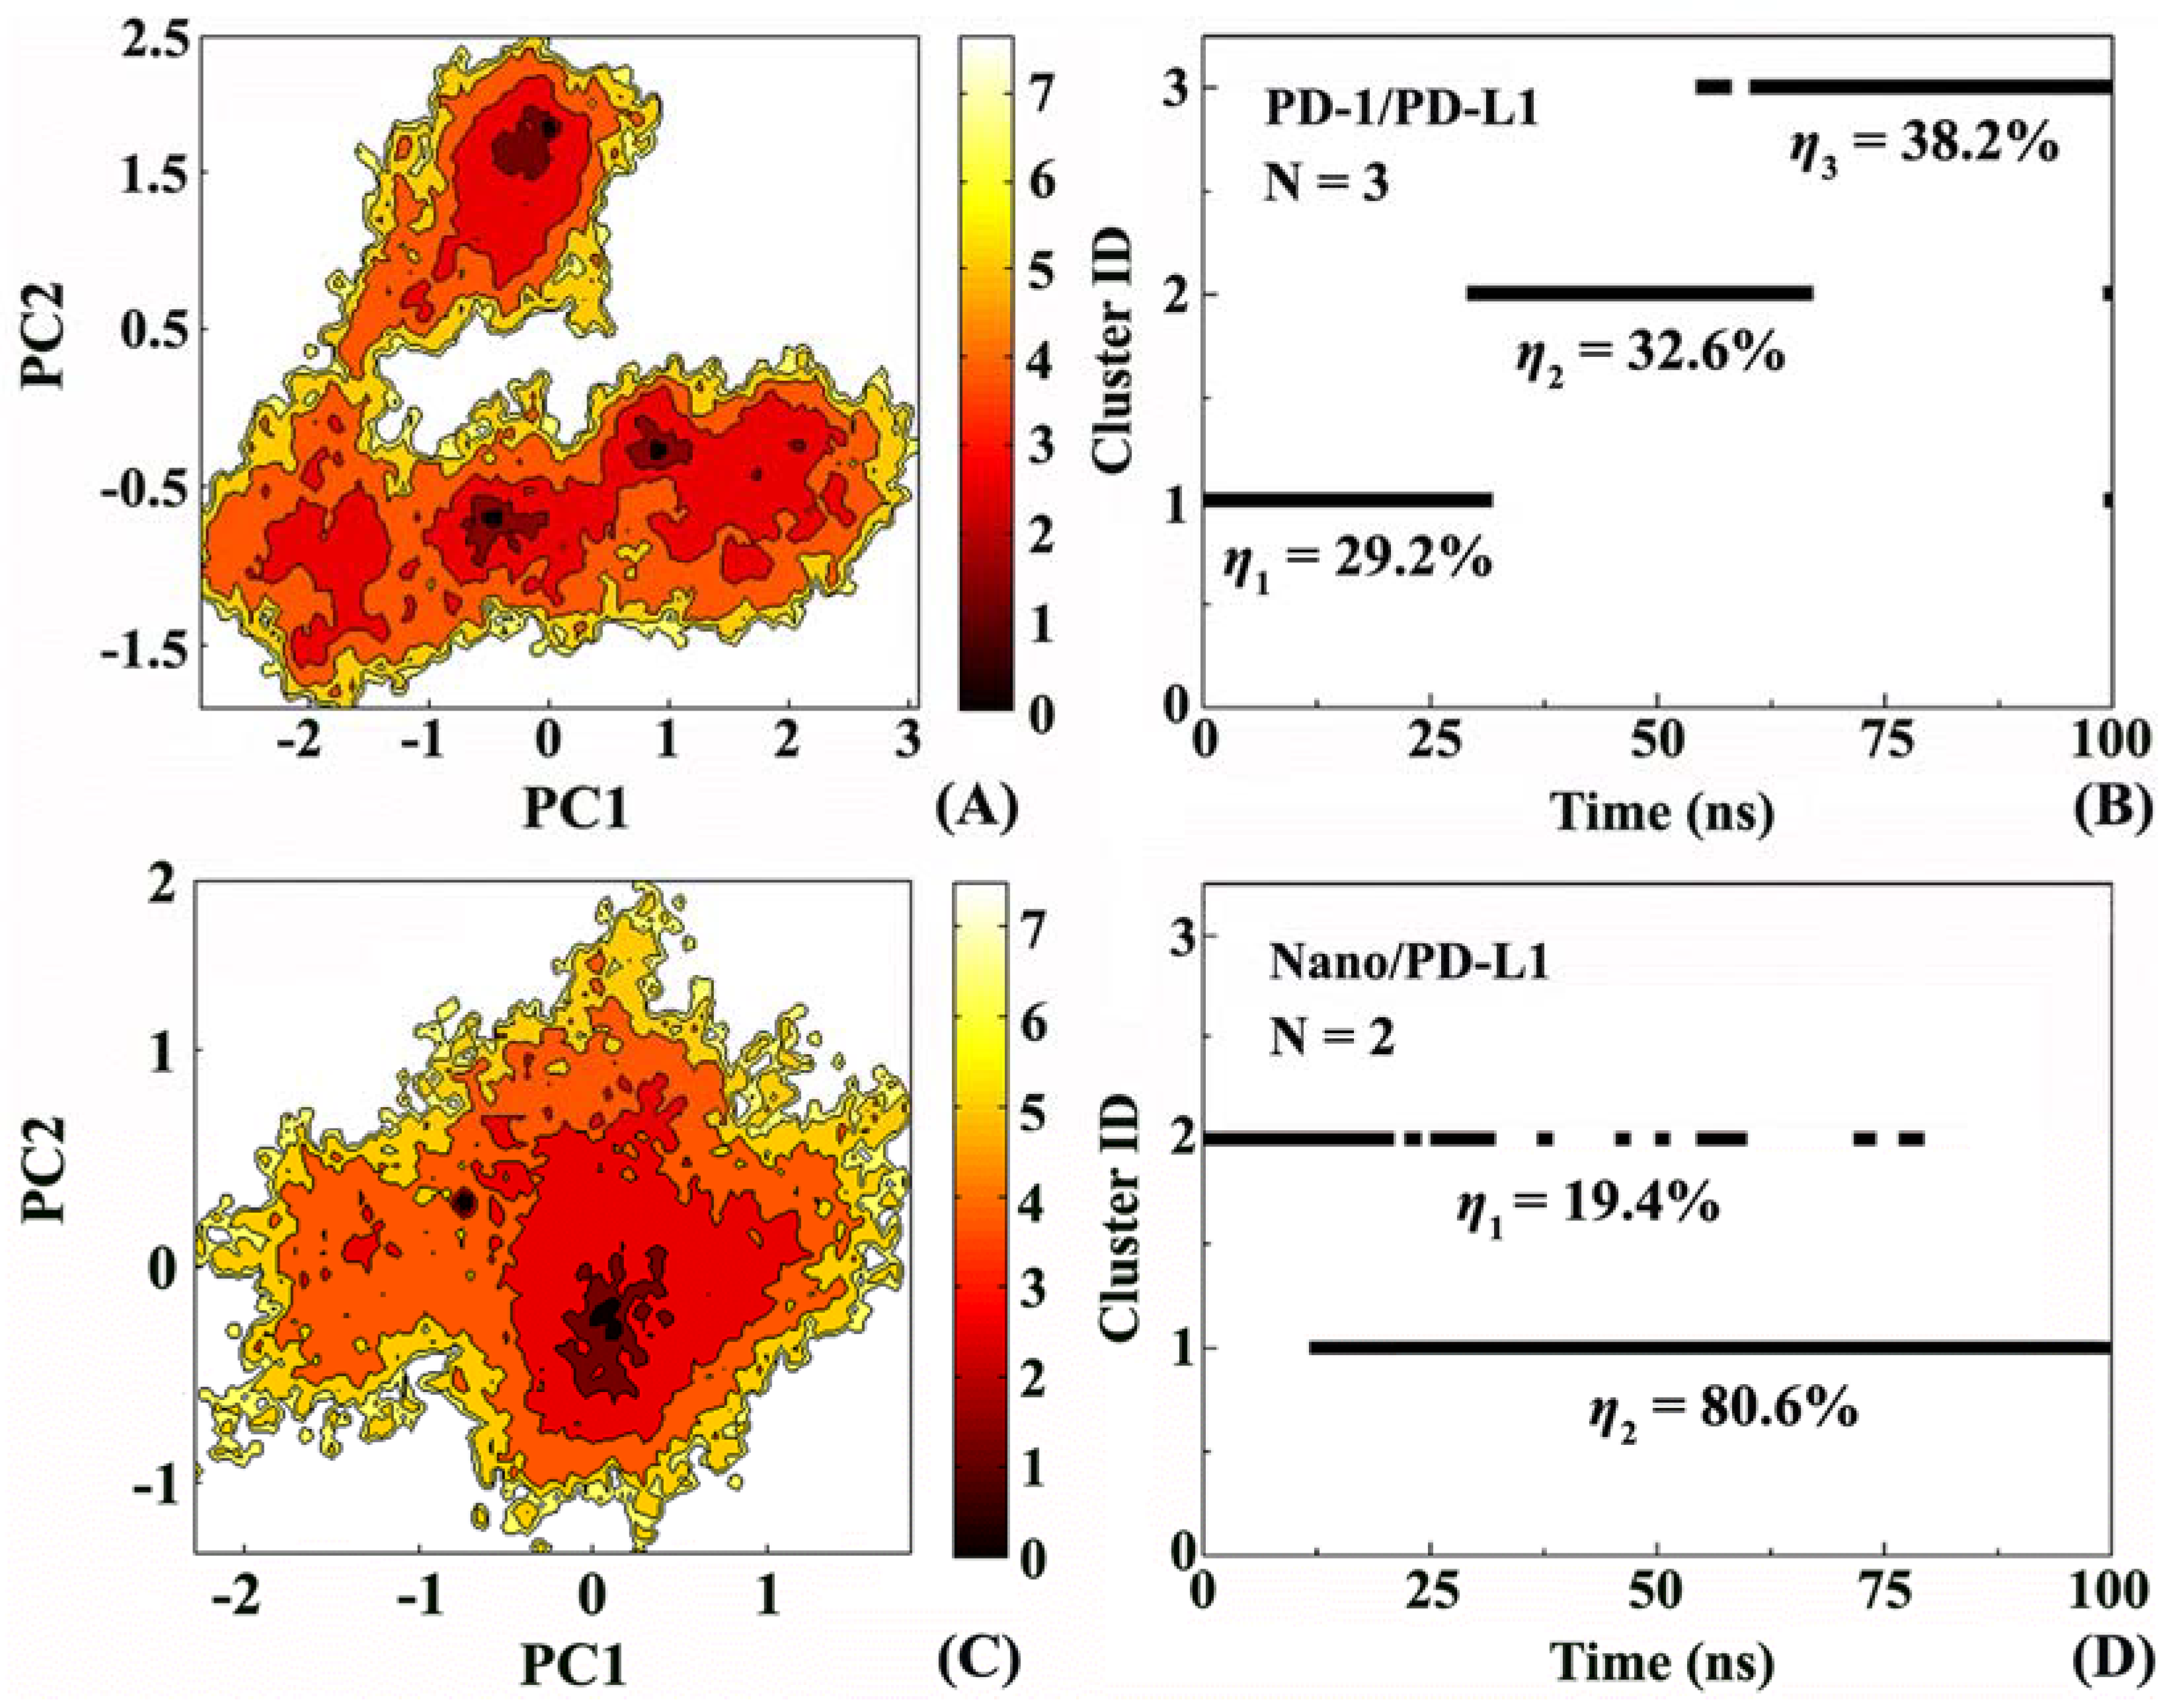
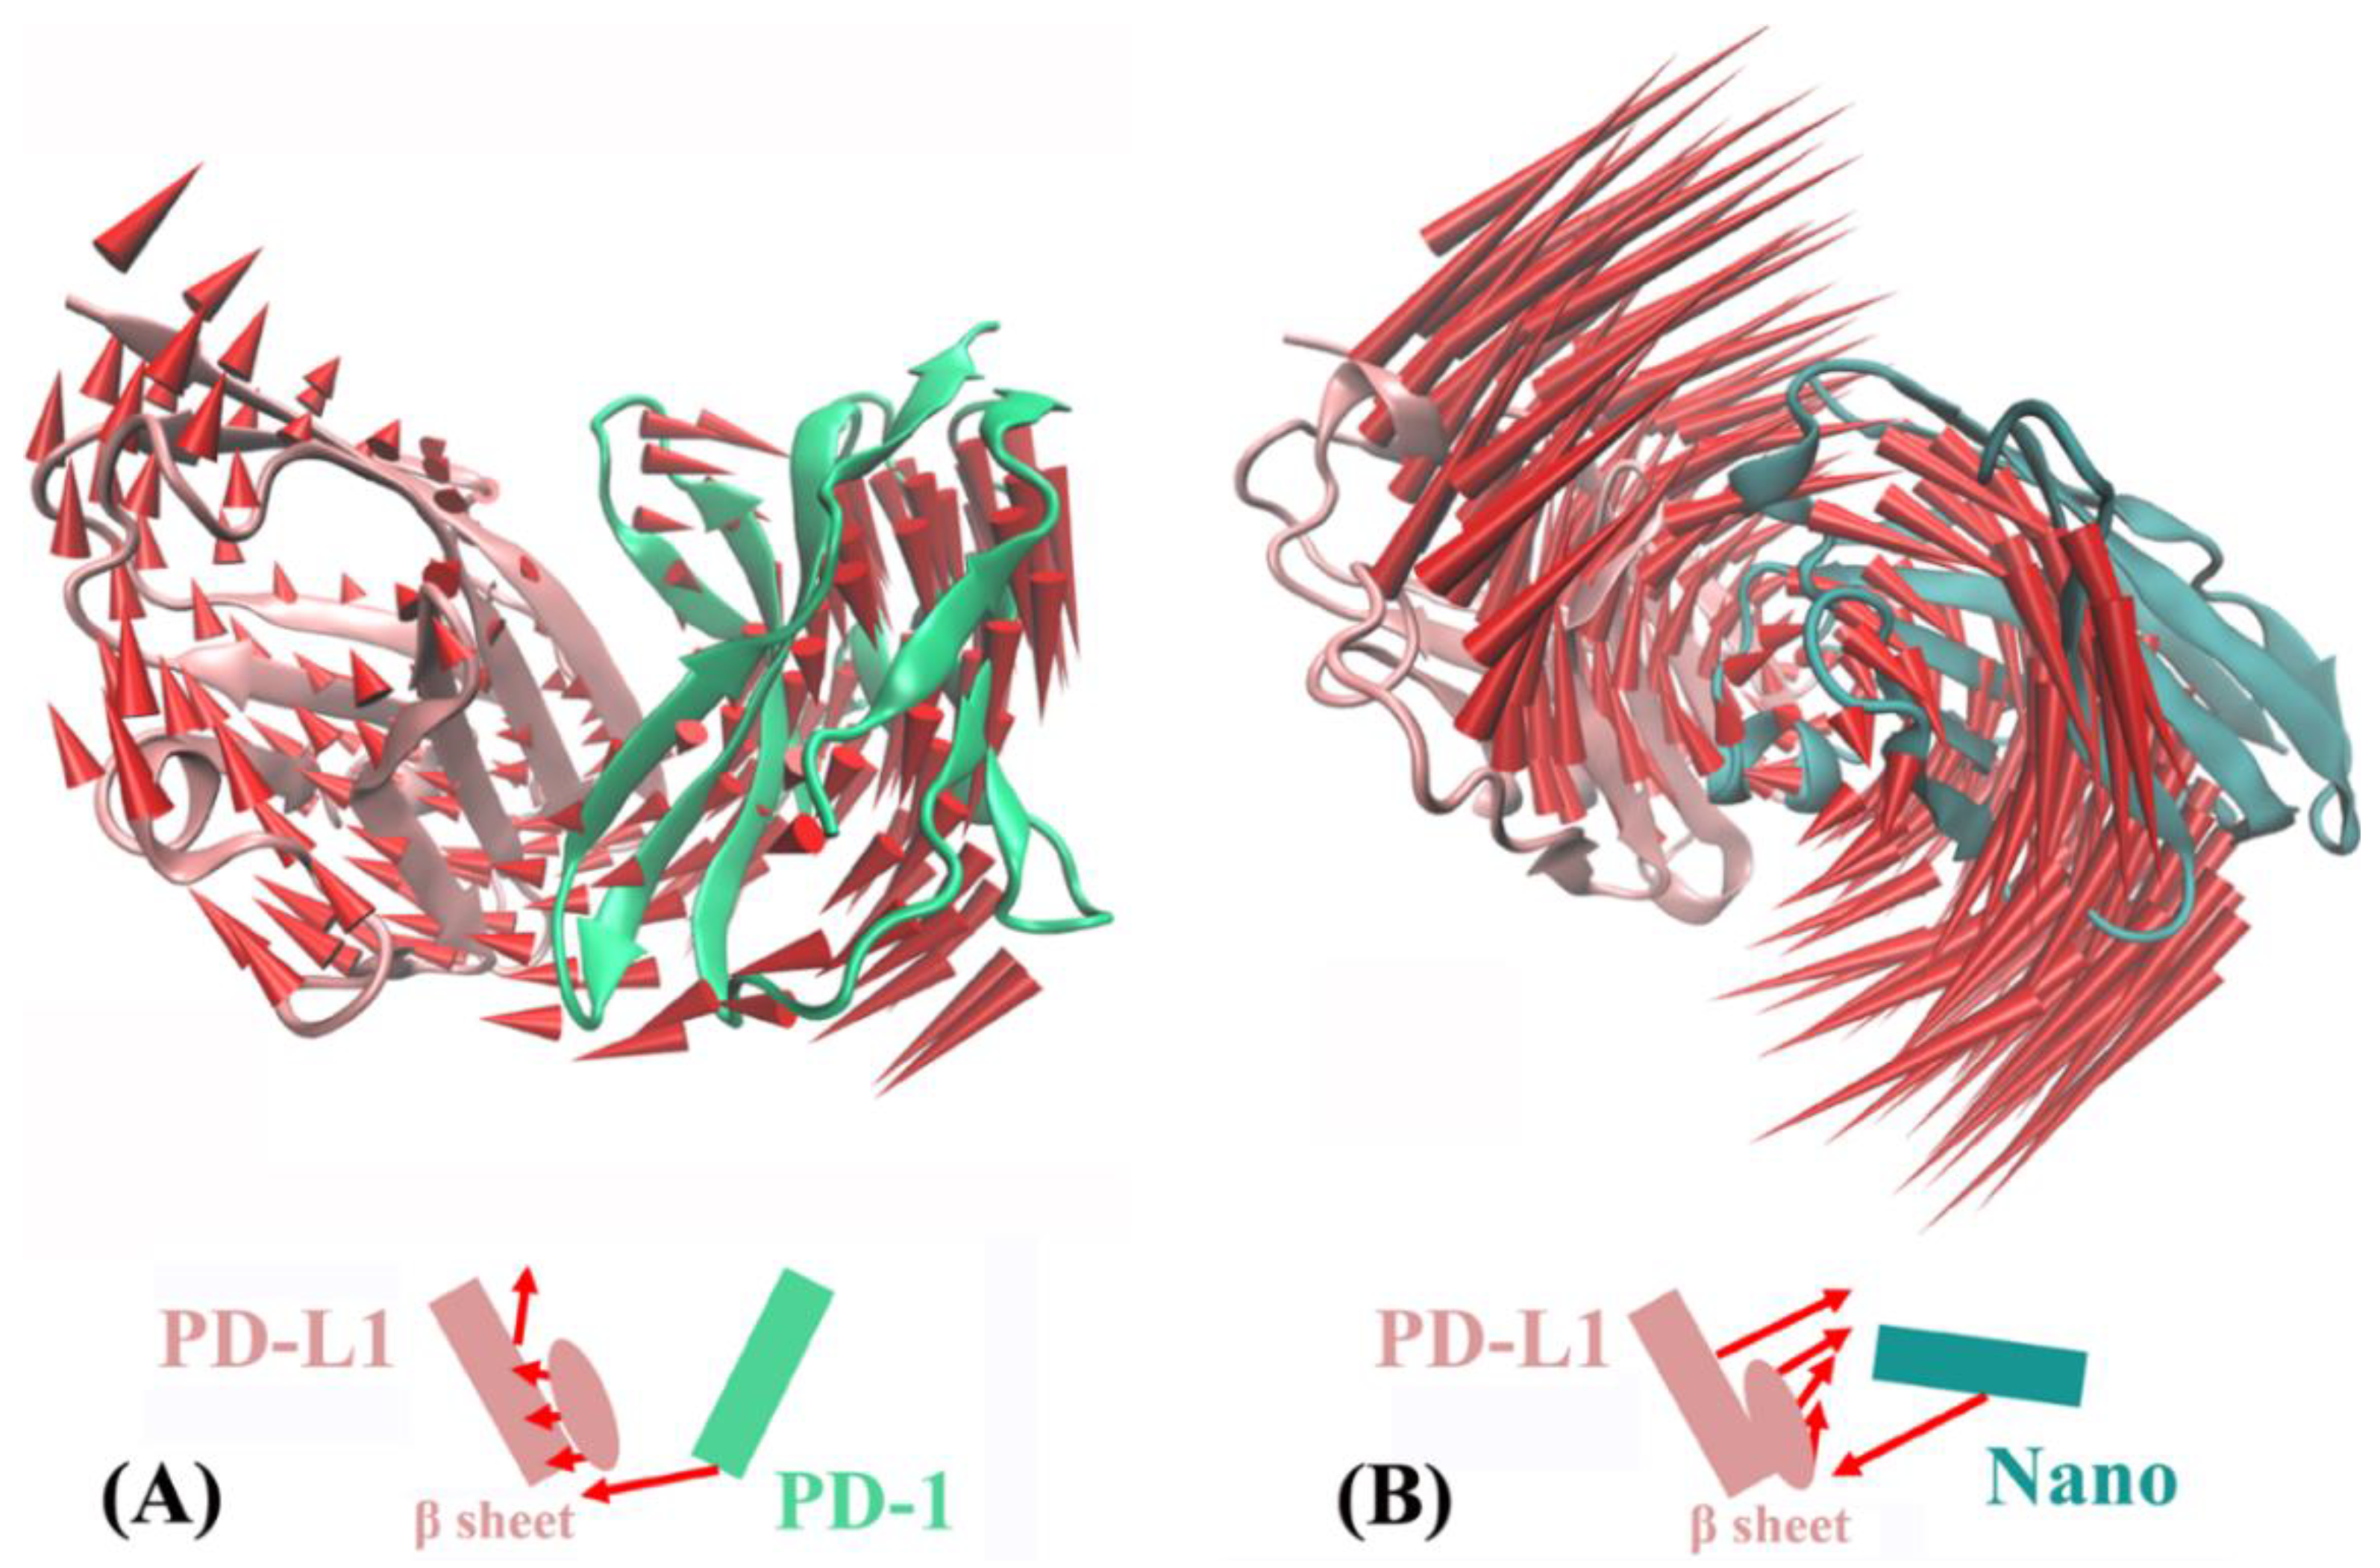
2.5. Molecular Motion Analysis
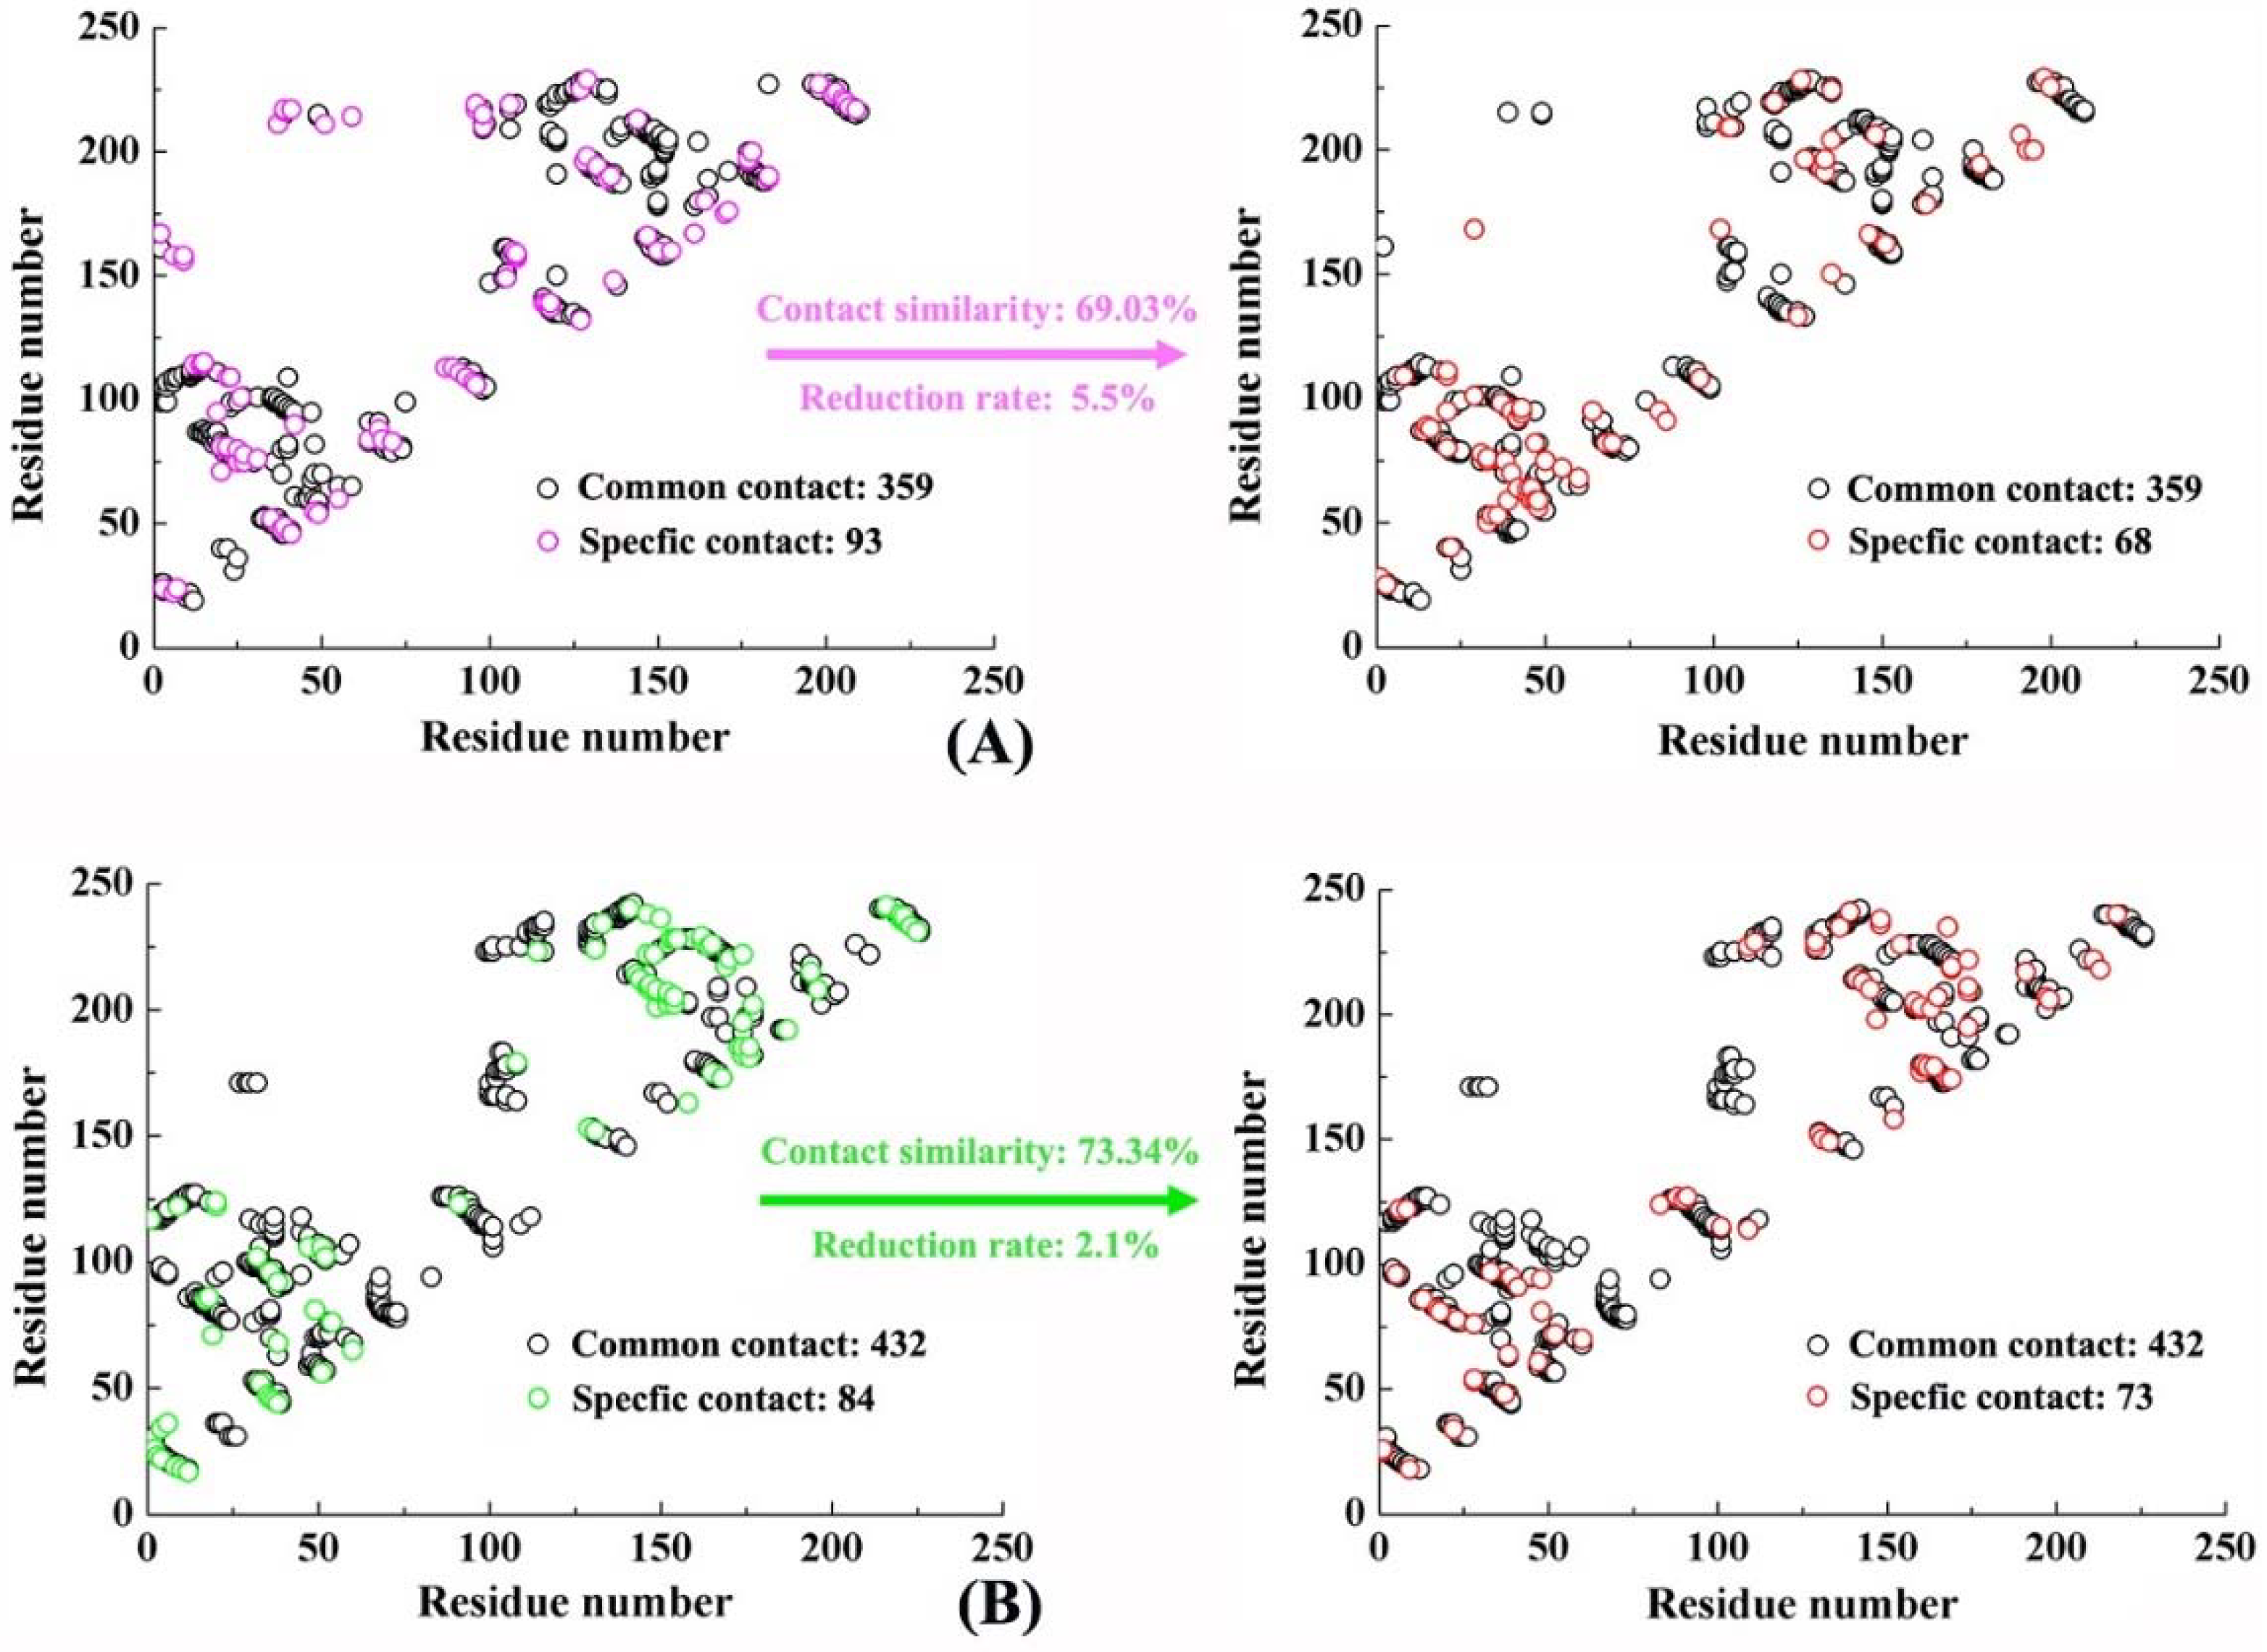
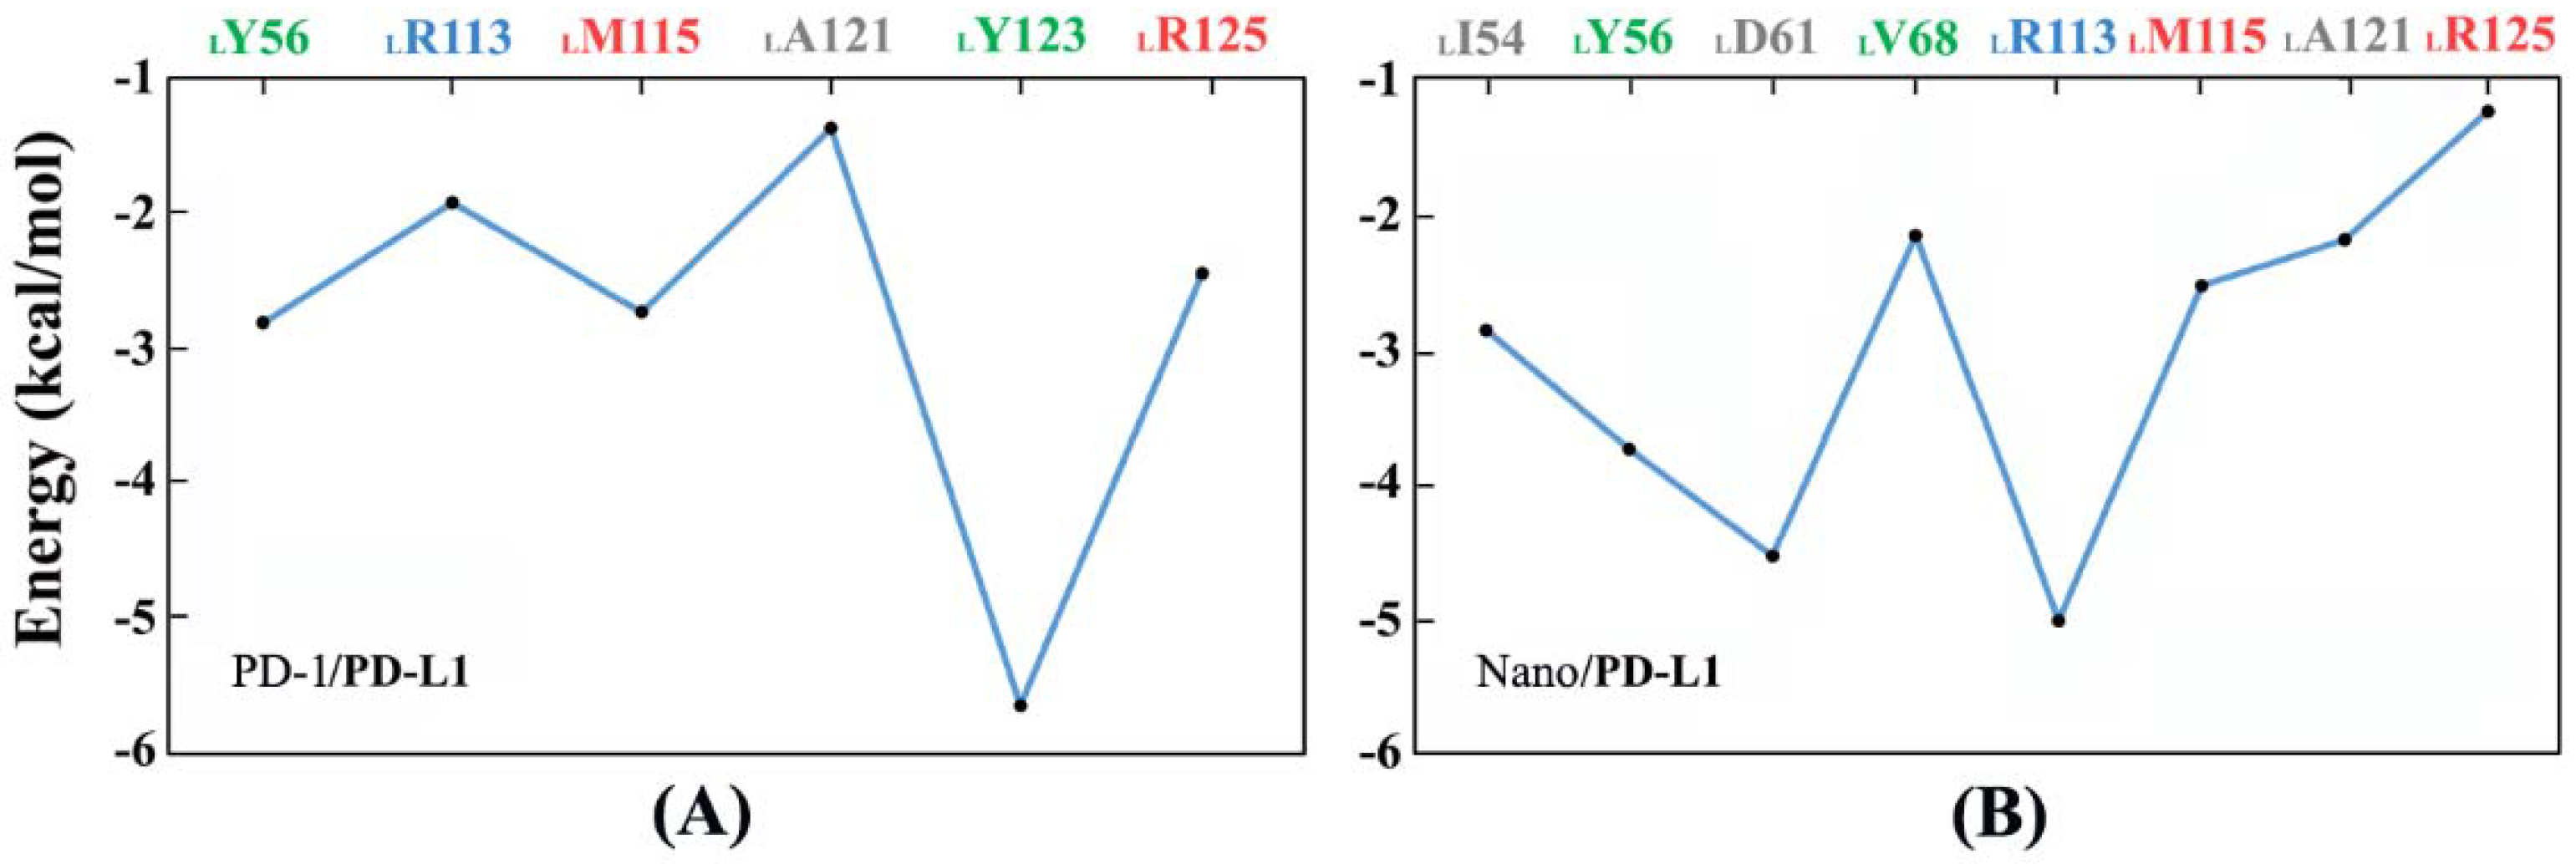
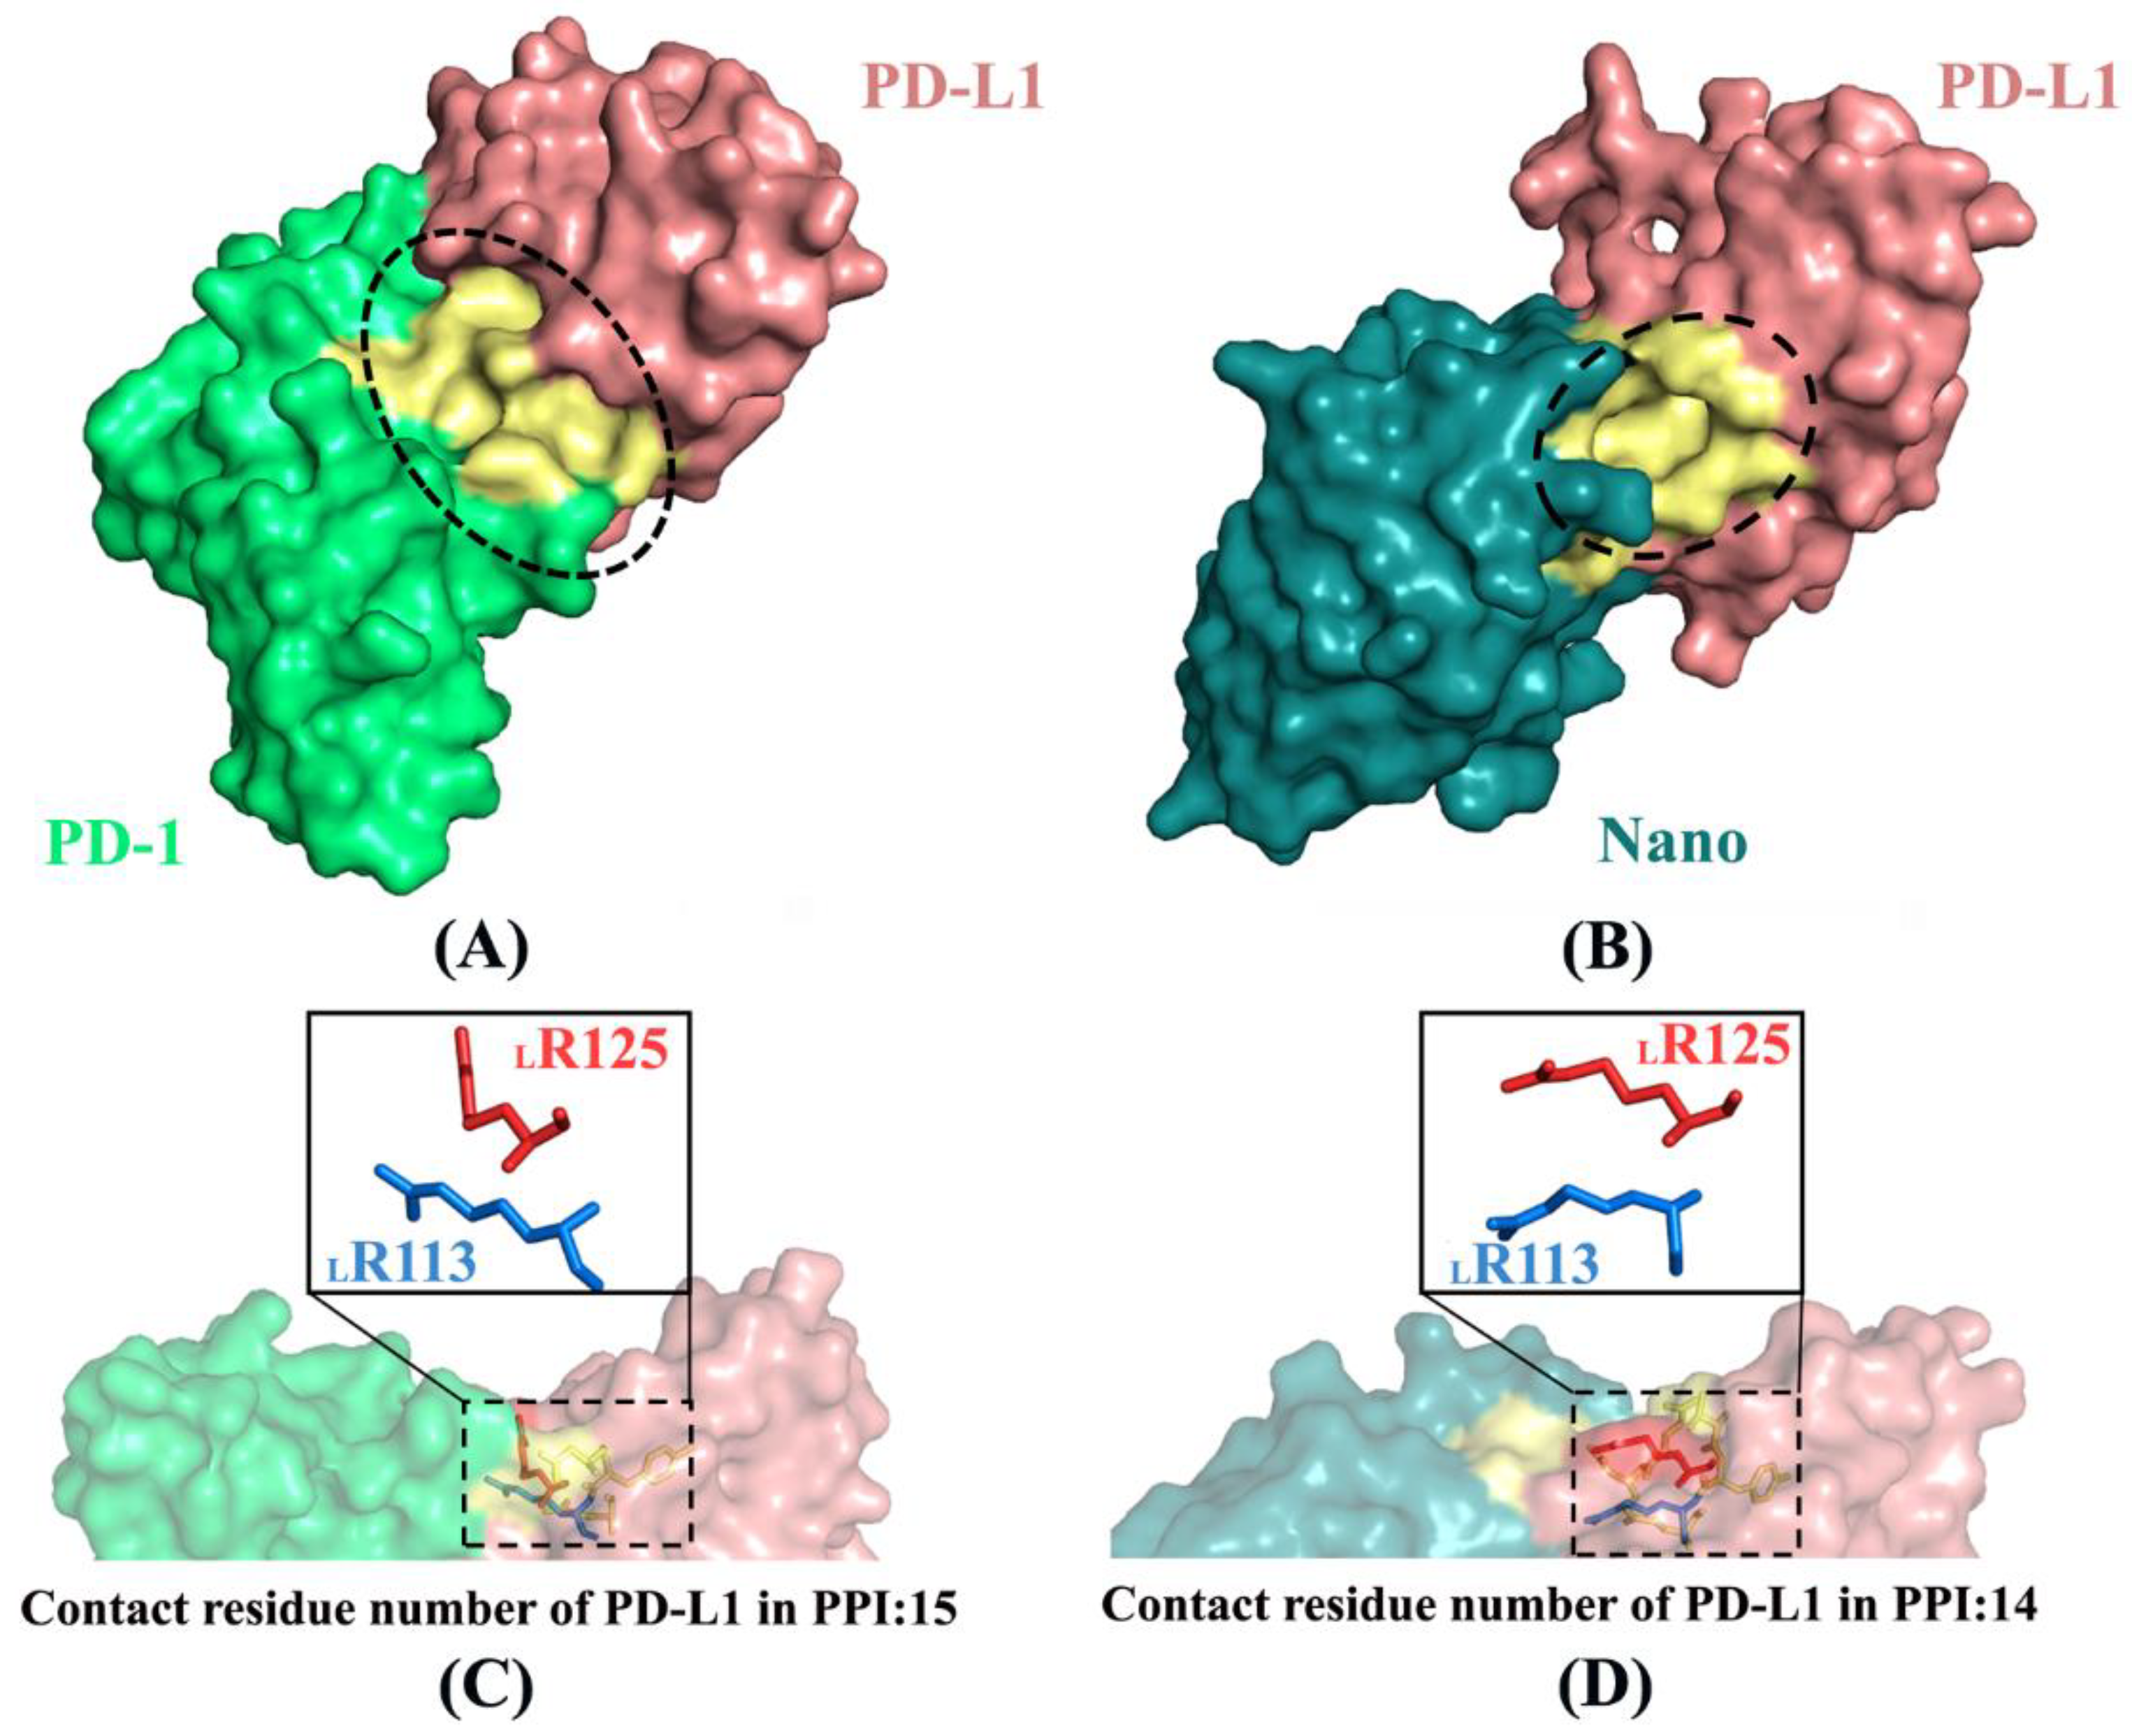
2.6. Molecular Recognition
2.7. Binding Free Energy Calculation
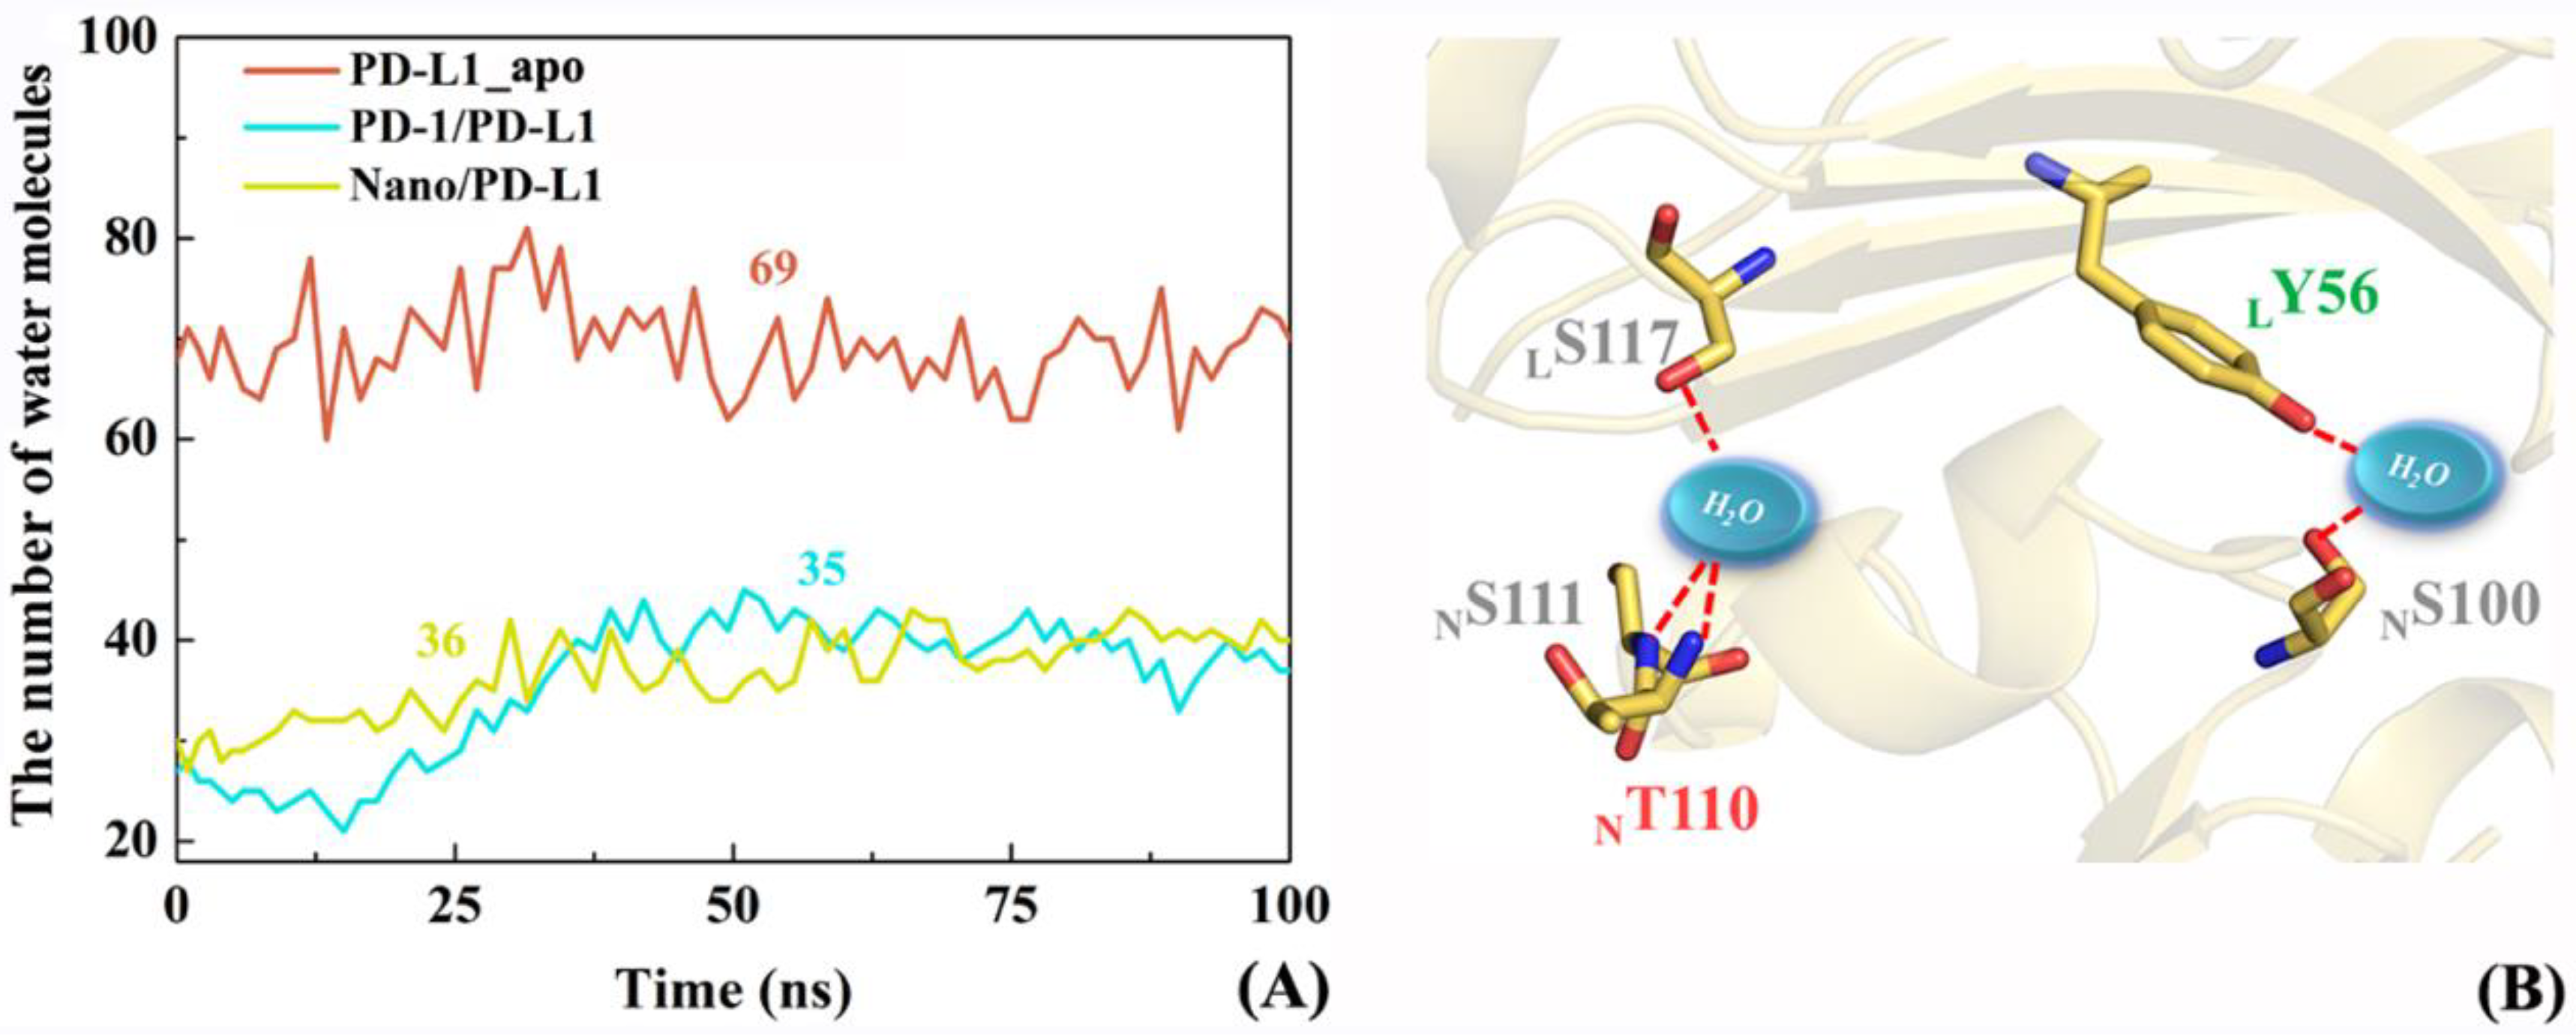
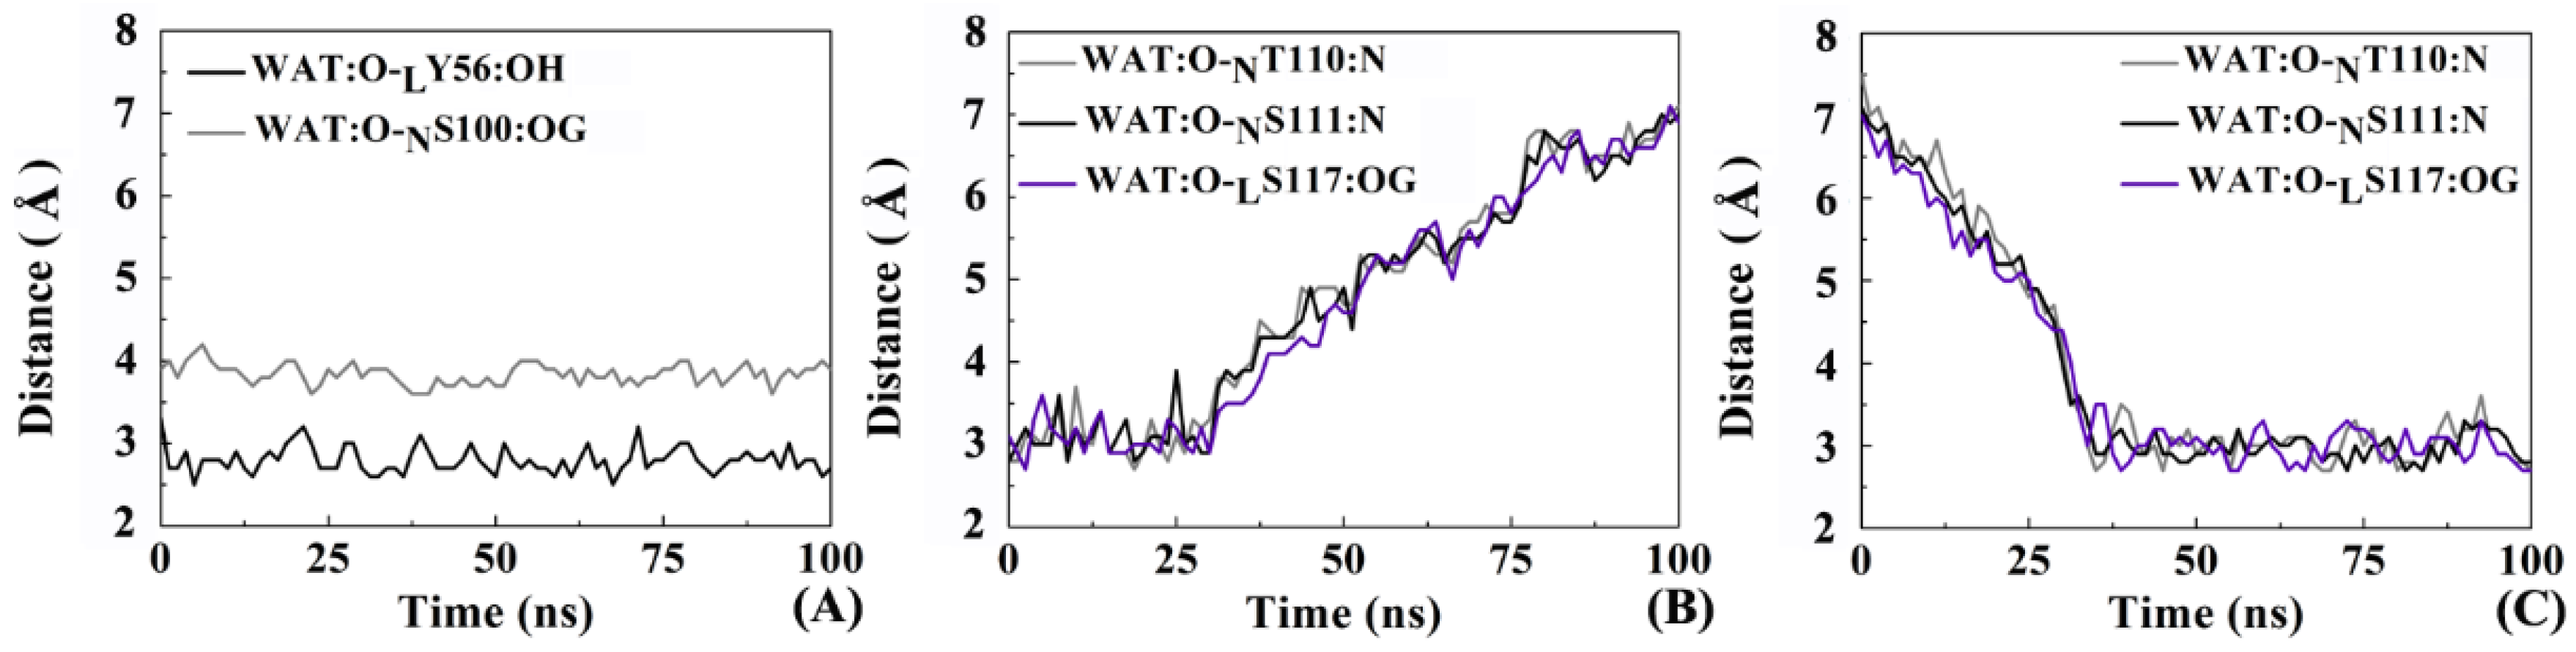
2.8. The Role of Solvents in Molecular Recognition
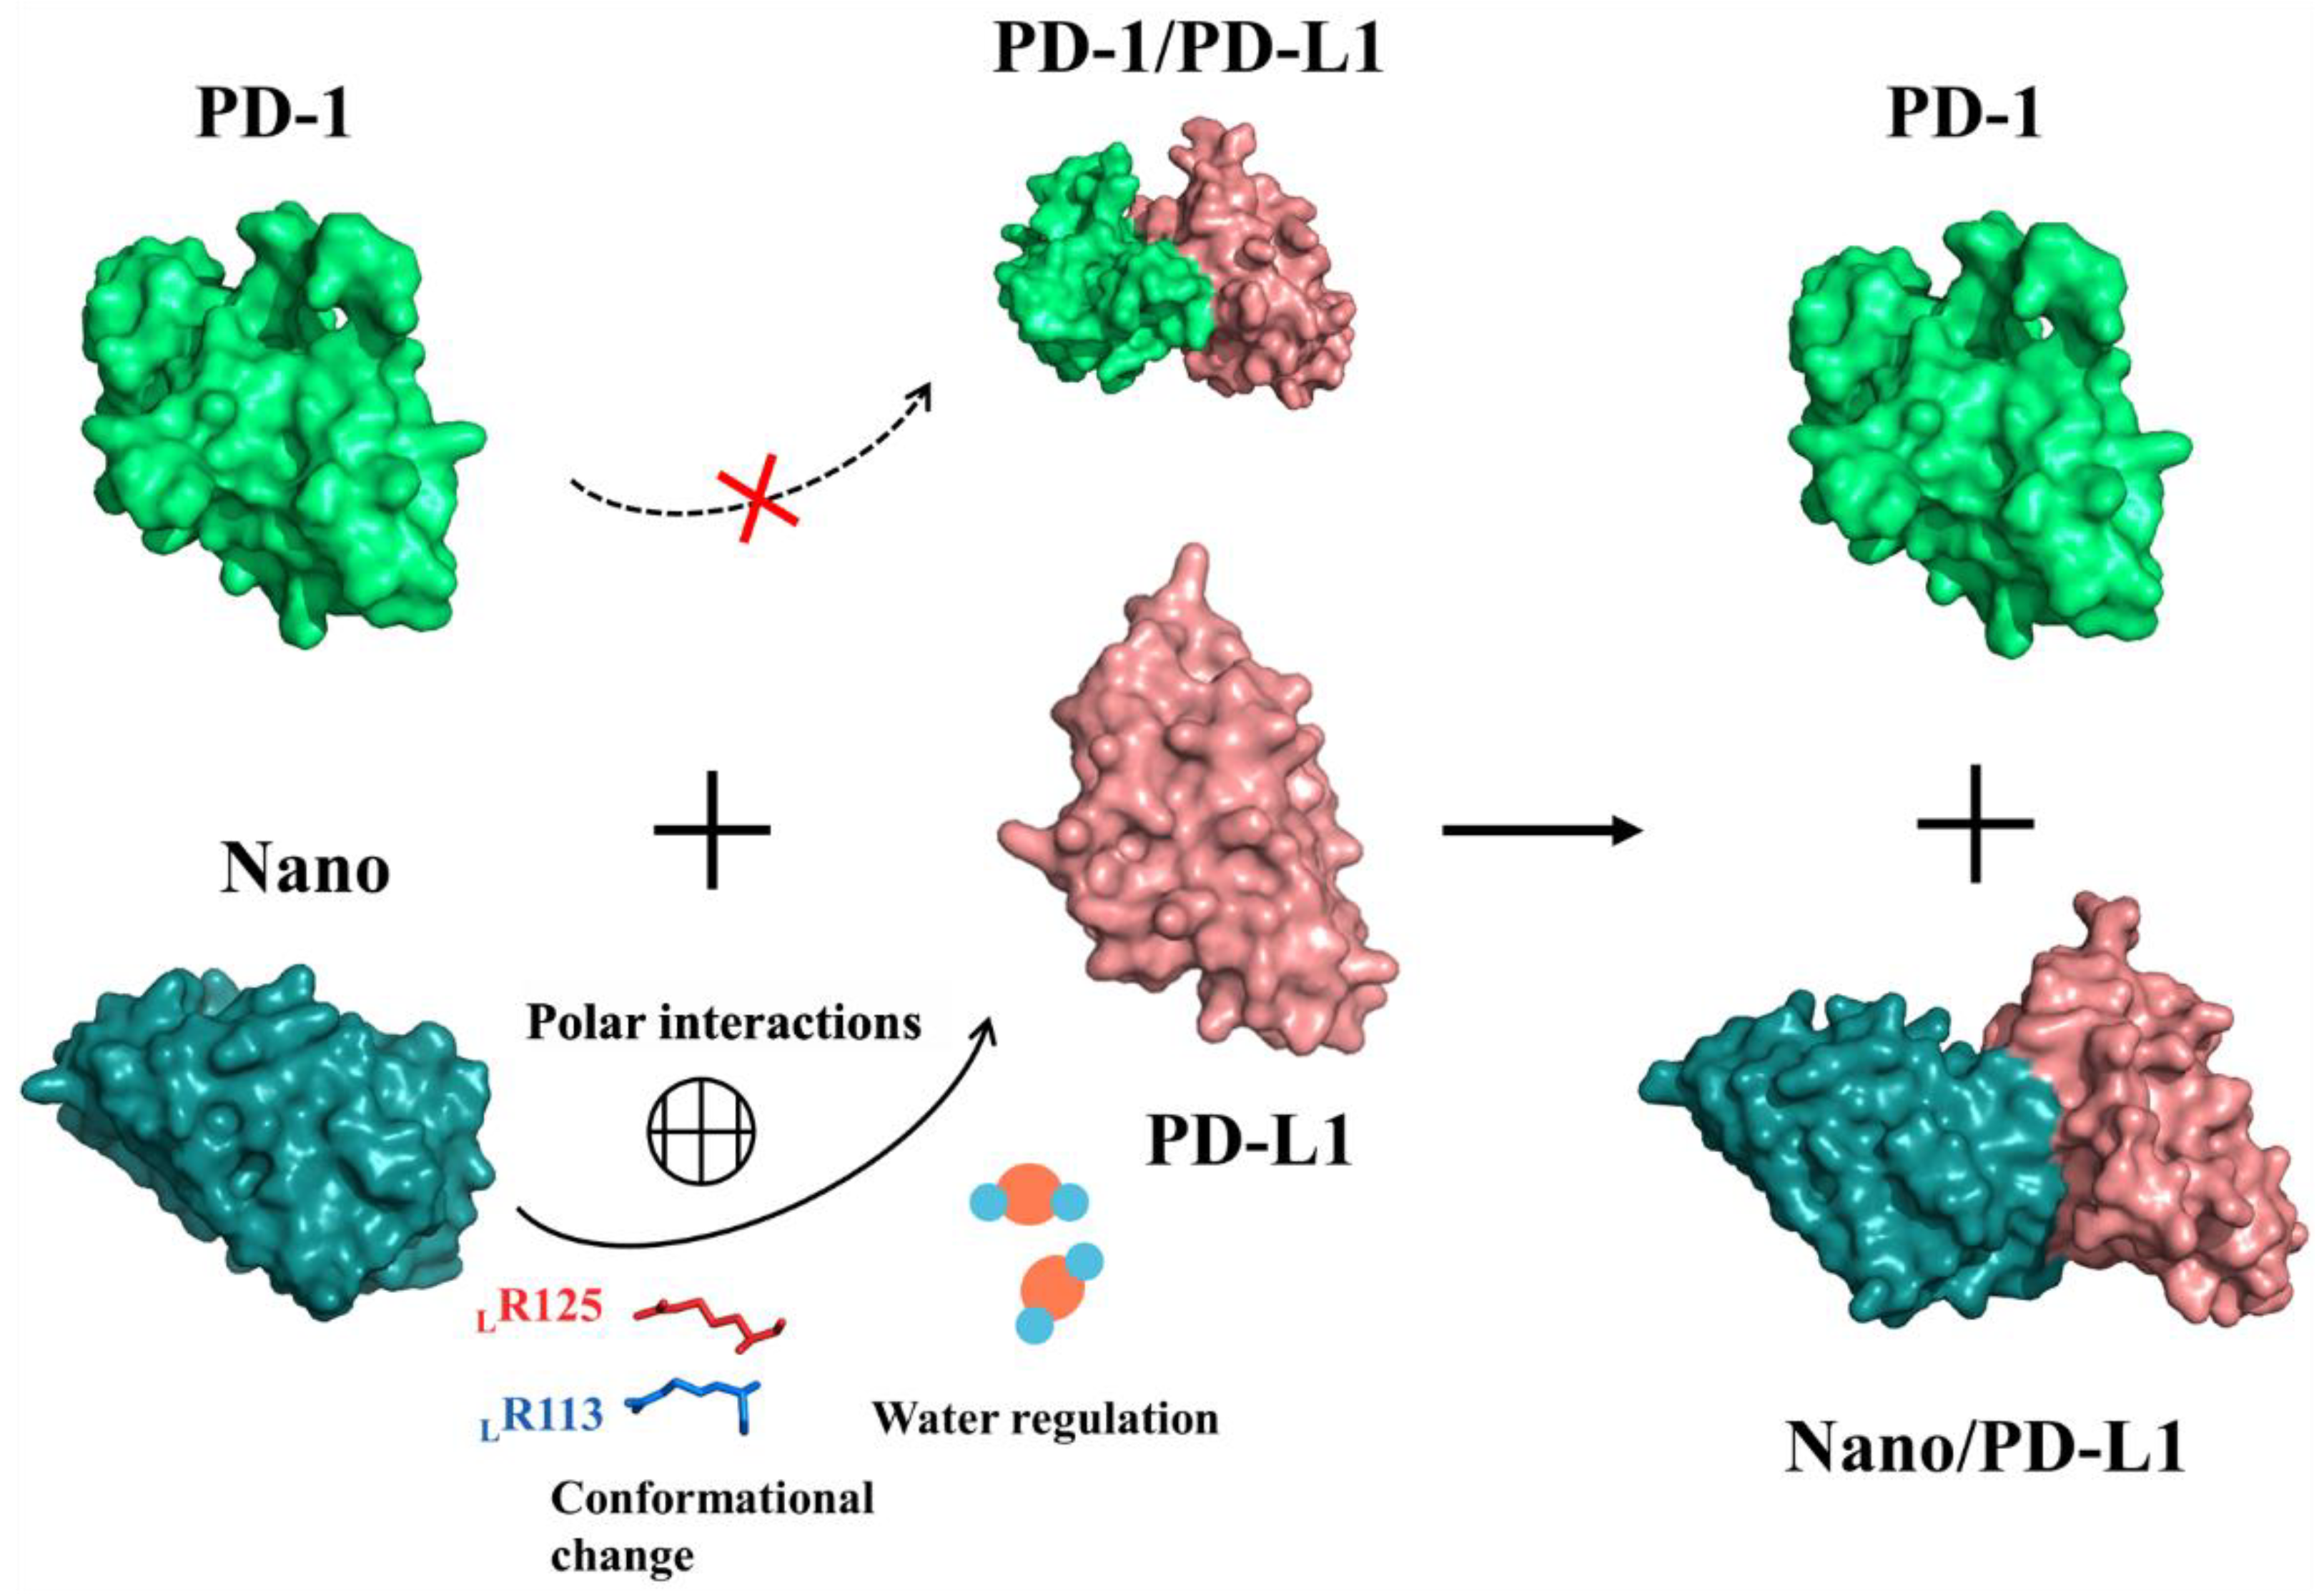
2.9. Inhibition Mechanism and Implications for Drug Design
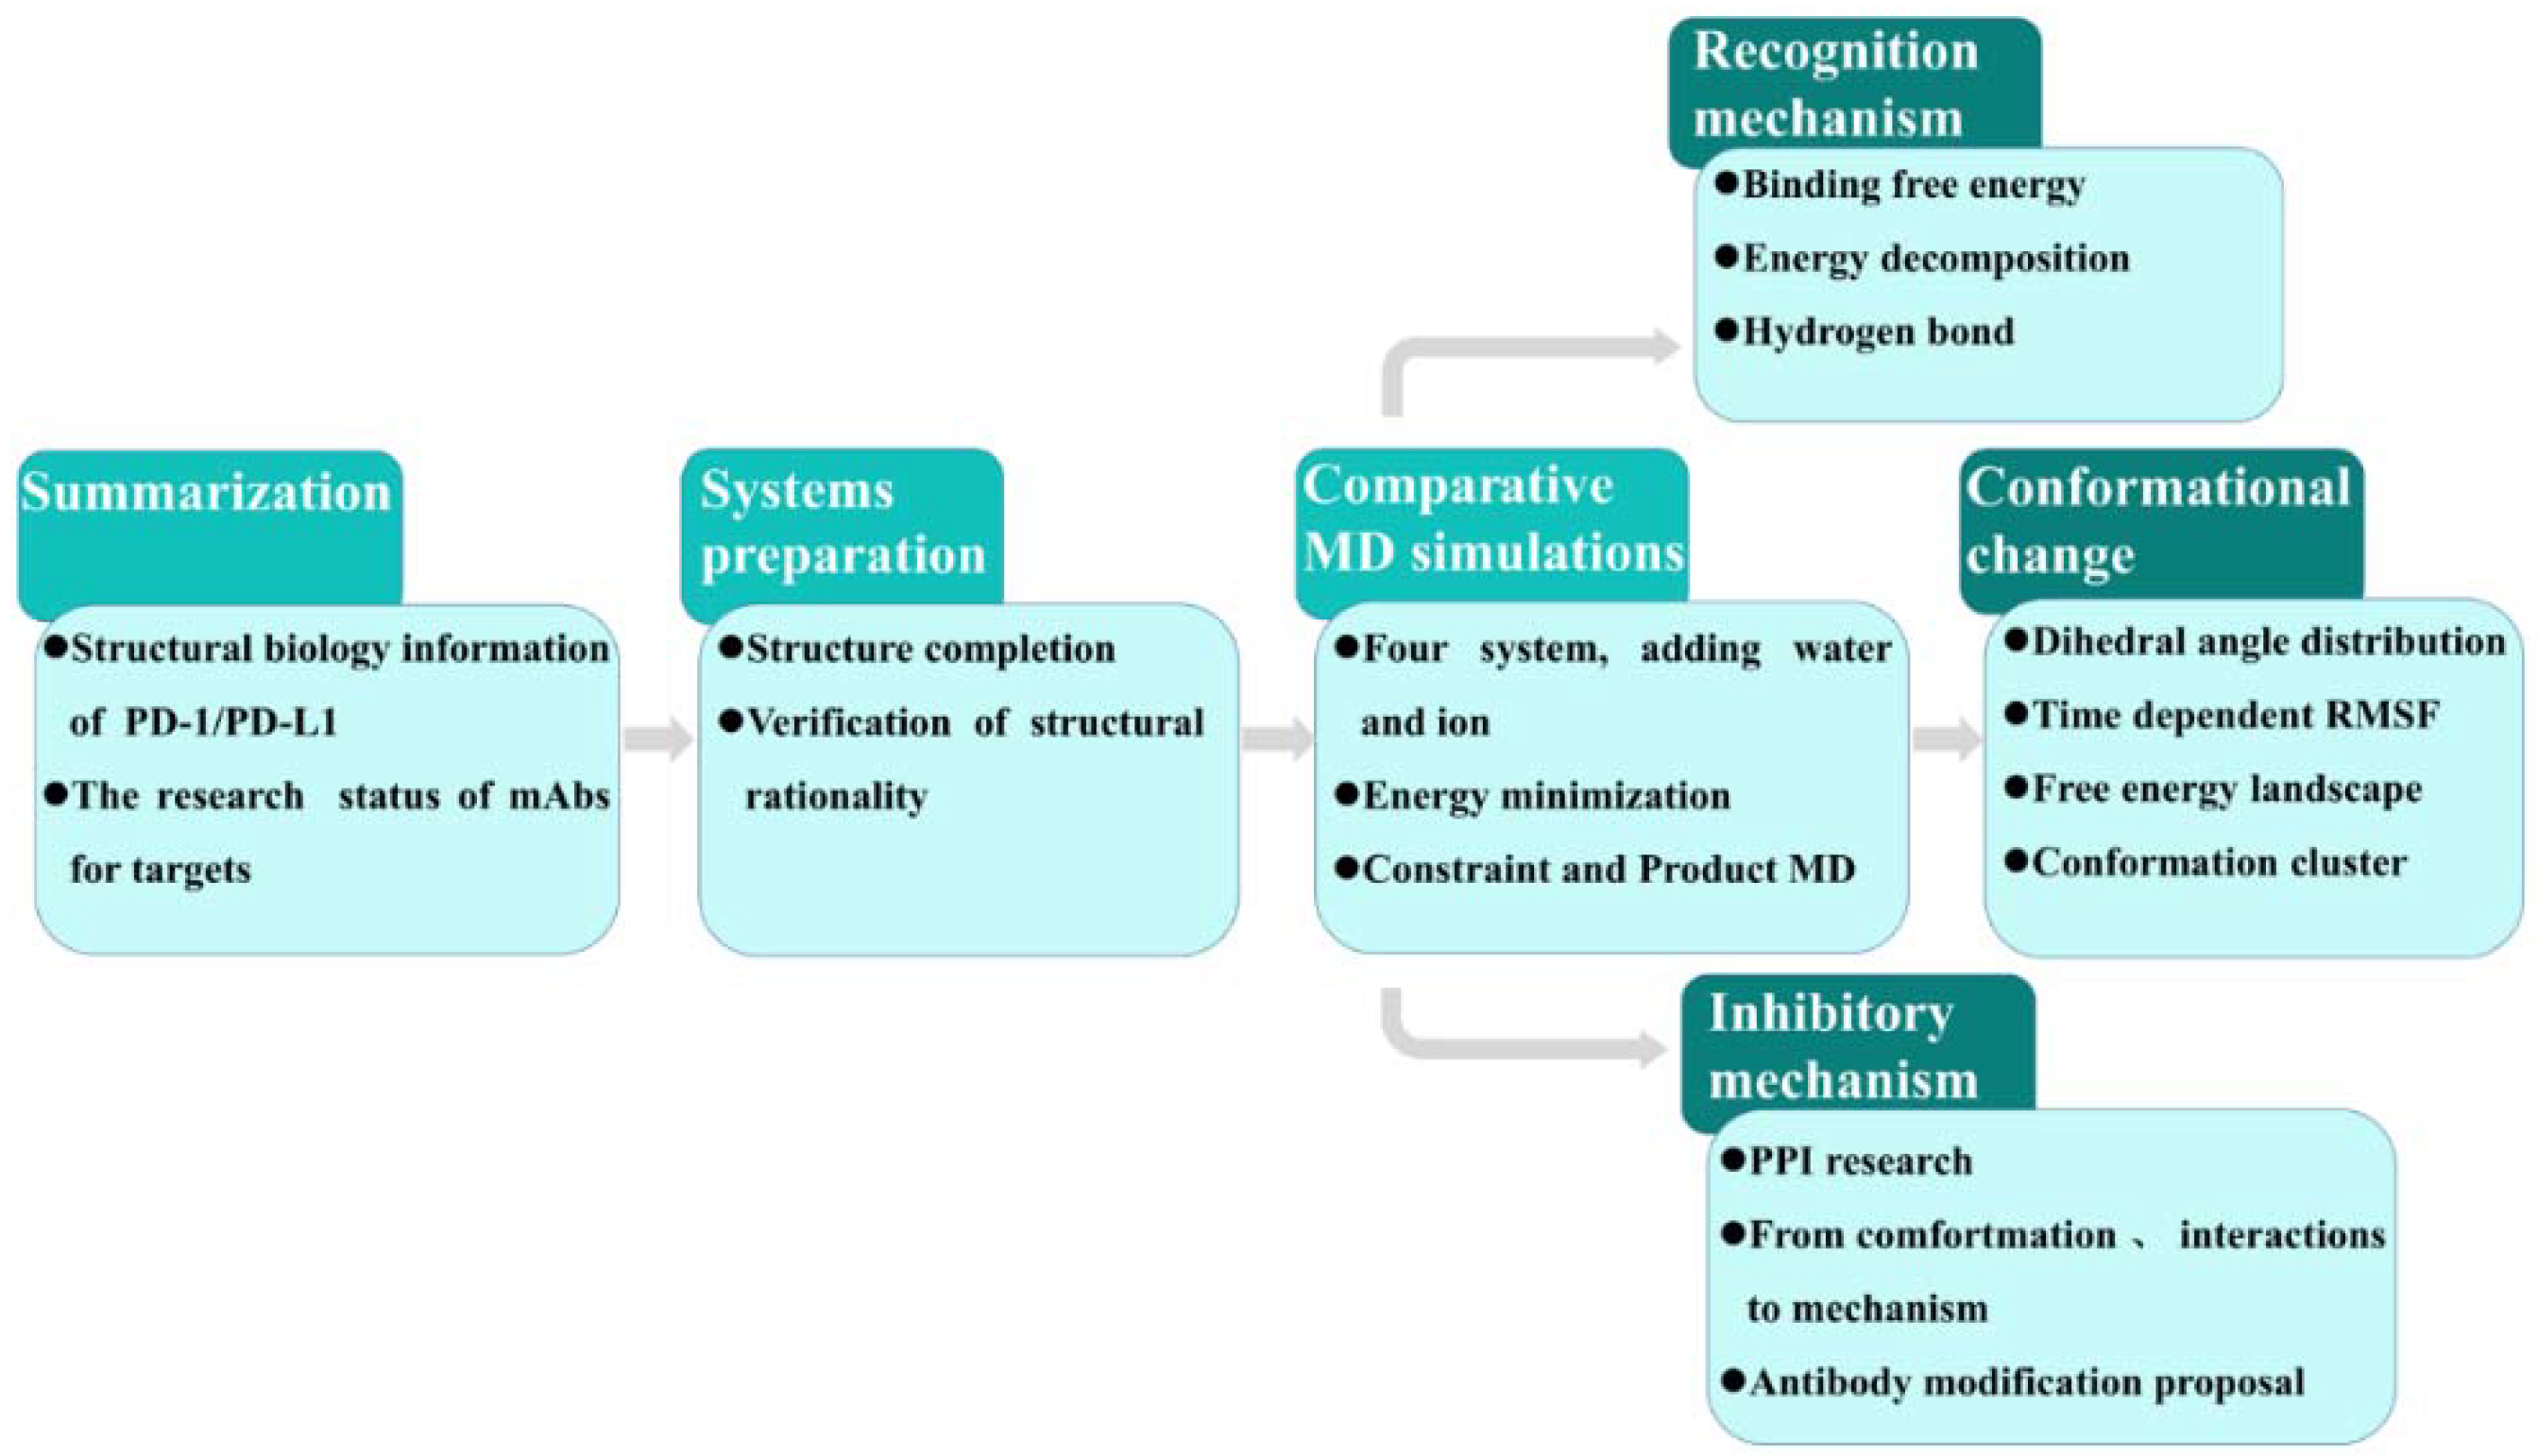
3. Materials and Methods
3.1. Molecular Dynamics Simulations
3.2. Free Energy Landscape
3.3. Cluster Analysis
3.4. Solvent Accessible Surface Area (SASA) Calculation
3.5. Binding Energy Predication
3.6. Key Residue Scanning
4. Conclusions
Supplementary Materials
Author Contributions
Acknowledgments
Conflicts of Interest
References
- Center, M.M. Global cancer statistics. CA-Cancer J. Clin. 2015, 65, 69–90. [Google Scholar]
- Stewart, B.; Wild, C. World Cancer Report 2014; International Agency for Research on Cancer: Lyon, France, 2014. [Google Scholar]
- Eilard, M.S.; Lundgren, L.; Cahlin, C.; Strandell, A.; Svanberg, T.; Sandström, P. Surgical treatment for gallbladder cancer—A systematic literature review. Scand. J. Gastroenterol. 2017, 52, 505–514. [Google Scholar] [CrossRef] [PubMed]
- Feain, I.J.; Court, L.; Palta, J.R.; Beddar, S.; Keall, P. Innovations in radiotherapy technology. J. Clin. Oncol. 2017, 29, 120–128. [Google Scholar] [CrossRef] [PubMed]
- Rajasekaran, T.; Ng, Q.S.; Tan, D.S.; Lim, W.T.; Ang, M.K.; Toh, C.K. Metronomic chemotherapy: A relook at its basis and rationale. Cancer Lett. 2017, 388, 328–333. [Google Scholar] [CrossRef] [PubMed]
- Chen, D.S.; Mellman, I. Oncology meets immunology: The cancer-immunity cycle. Immunity 2013, 39, 1–10. [Google Scholar] [CrossRef] [PubMed]
- Couzin-Frankel, J. Breakthrough of the year 2013. Cancer immunotherapy. Science 2013, 342, 1432–1433. [Google Scholar] [CrossRef] [PubMed]
- Phan, T.G.; Long, G.V.; Scolyer, R.A. Multiple checkpoints on the long road towards cancer immunotherapy. Immunol. Cell Biol. 2015, 93, 323–325. [Google Scholar] [CrossRef] [PubMed]
- Antonia, S.J.; Larkin, J.; Ascierto, P.A. Immuno-oncology Combinations: A Review of Clinical Experience and Future Prospects. Clin. Cancer Res. 2014, 20, 6258–6268. [Google Scholar] [CrossRef] [PubMed]
- Topalian, S.L.; Drake, C.G.; Pardoll, D.M. Immune checkpoint blockade: A common denominator approach to cancer therapy. Cancer Cell. 2015, 27, 450–461. [Google Scholar] [CrossRef] [PubMed]
- Hao, G.; Wesolowski, J.S.; Jiang, X.; Lauder, S.; Sood, V.D. Epitope characterization of an anti-PD-L1 antibody using orthogonal approaches. J. Mol. Recognit. 2015, 28, 269–276. [Google Scholar] [CrossRef] [PubMed]
- Zak, K.M.; Kitel, R.; Przetocka, S.; Golik, P.; Guzik, K.; Musielak, B. Structure of the Complex of Human Programmed Death 1, PD-1 and Its Ligand PD-L1. Structure 2015, 23, 2341–2348. [Google Scholar] [CrossRef] [PubMed]
- Riella, L.V.; Paterson, A.M.; Sharpe, A.H.; Chandraker, A. Role of the PD-1 Pathway in the Immune Response. Am. J. Transplant. 2012, 12, 2575–2587. [Google Scholar] [CrossRef] [PubMed]
- Hawkes, E.A.; Grigg, A.; Chong, G. Programmed cell death-1 inhibition in lymphoma. Lancet Oncol. 2015, 16, 234–245. [Google Scholar] [CrossRef]
- Wherry, E.J. T cell exhaustion. Nat. Immunol. 2011, 12, 492–499. [Google Scholar] [CrossRef] [PubMed]
- Brahmer, J.R.; Tykodi, S.S.; Chow, L.Q.; Hwu, W.J.; Topalian, S.L.; Hwu, P. Safety and Activity of Anti–PD-L1 Antibody in Patients with Advanced Cancer. New. Engl. J. Med. 2012, 366, 2455–2465. [Google Scholar] [CrossRef] [PubMed]
- Zhan, M.M.; Hu, X.Q.; Liu, X.X.; Ruan, B.F.; Xu, J.; Liao, C. From monoclonal antibodies to small molecules: The development of inhibitors targeting the PD-1/PD-L1 pathway. Drug Discov. Today 2016, 21, 1027–1036. [Google Scholar] [CrossRef] [PubMed]
- Na, Z.; Yeo, SP.; Bharath, SR.; Bowler, M.W.; Balıkçı, E.; Wang, C.I. Structural basis for blocking PD-1-mediated immune suppression by therapeutic antibody pembrolizumab. Cell Res. 2016, 27, 147–150. [Google Scholar] [CrossRef] [PubMed]
- Lee, J.Y.; Lee, H.T.; Shin, W.; Chae, J.; Choi, J.; Kim, S.H. Structural basis of checkpoint blockade by monoclonal antibodies in cancer immunotherapy. Nat. Commun. 2016, 7, 13354. [Google Scholar] [CrossRef] [PubMed]
- Ibrahim, R.; Stewart, R.; Shalabi, A. PD-L1 blockade for cancer treatment: MEDI4736. Semin. Oncol. 2015, 42, 474–483. [Google Scholar] [CrossRef] [PubMed]
- Zak, K.M.; Grudnik, P.; Magiera, K.; Dömling, A.; Dubin, G.; Holak, T.A. Structural Biology of the Immune Checkpoint Receptor PD-1 and Its Ligands PD-L1/PD-L2. Structure 2017, 25, 1163–1174. [Google Scholar] [CrossRef] [PubMed]
- Ahmed, M.; Barakat, K.H. The Too Many Faces of PD-L1: A Comprehensive Conformational Analysis Study. Biochem.-US 2017, 56, 428–5439. [Google Scholar] [CrossRef] [PubMed]
- Liu, W.; Liu, G. Mapping Paratope and Epitope Residues of Antibody Pembrolizumab via Molecular Dynamics Simulation. In Proceedings of the International Symposium on Bioinformatics Research and Applications, Honolulu, HI, USA, 29 May–2 June 2017; pp. 120–127. [Google Scholar]
- Zhang, X.; Schwartz, J.C.; Guo, X.; Bhatia, S.; Cao, E.; Lorenz, M. Structural and functional analysis of the costimulatory receptor programmed death-1. Immunity 2004, 20, 337–347. [Google Scholar] [CrossRef]
- Cheng, X.; Veverka, V.; Radhakrishnan, A.; Waters, L.C.; Muskett, F.W.; Morgan, S.H. Structure and Interactions of the Human Programmed Cell Death 1 Receptor. J. Biol. Chem. 2013, 288, 11771–11785. [Google Scholar] [CrossRef] [PubMed]
- Horita, S.; Nomura, Y.; Sato, Y.; Shimamura, T.; Iwata, S.; Nomura, N. High-resolution crystal structure of the therapeutic antibody pembrolizumab bound to the human PD-1. Sci. Rep.-UK 2016, 6, 35297. [Google Scholar] [CrossRef] [PubMed]
- Tan, S.; Zhang, H.; Chai, Y.; Song, H.; Tong, Z.; Wang, Q. An unexpected N-terminal loop in PD-1 dominates binding by nivolumab. Nat. Commun. 2017, 8, 14369. [Google Scholar] [CrossRef] [PubMed]
- Lin, D.Y.; Tanaka, Y.; Iwasaki, M.; Gittis, A.G.; Su, H.P.; Mikami, B. The PD-1/PD-L1 complex resembles the antigen-binding Fv domains of antibodies and T cell receptors. Proc. Natl. Acad. Sci. USA 2008, 105, 3011–3016. [Google Scholar] [CrossRef] [PubMed]
- Chen, Y.; Liu, P.; Gao, F.; Cheng, H.; Qi, J.; Gao, G.F. A dimeric structure of PD-L1: Functional units or evolutionary relics? Protein Cell 2010, 1, 153–160. [Google Scholar] [CrossRef] [PubMed]
- Fei, Z.; Wei, H.; Wang, X.; Bai, Y.; Wang, P.; Wu, J. Structural basis of a novel PD-L1 nanobody for immune checkpoint blockade. Cell Discov. 2017, 3, 17004–17015. [Google Scholar]
- Liu, K.; Tan, S.; Chai, Y.; Chen, D.; Song, H.; Zhang, C.W. Structural basis of anti-PD-L1 monoclonal antibody avelumab for tumor therapy. Cell Res. 2016, 27, 151–153. [Google Scholar] [CrossRef] [PubMed]
- Lee, H.T.; Lee, J.Y.; Lim, H.; Sang, H.L.; Yu, J.M.; Pyo, H.J. Molecular mechanism of PD-1/PD-L1 blockade via anti-PD-L1 antibodies atezolizumab and durvalumab. Sci. Rep-UK 2017, 7, 5532–5544. [Google Scholar] [CrossRef] [PubMed]
- Pascolutti, R.; Sun, X.; Kao, J.; Maute, R.; Ring, A.M.; Bowman, G.R. Structure and Dynamics of PD-L1 and an Ultra-High-Affinity PD-1 Receptor Mutant. Structure 2016, 24, 1719–1728. [Google Scholar] [CrossRef] [PubMed]
- Zak, K.M.; Grudnik, P.; Guzik, K.; Zieba, B.J.; Bogdan, M.; Alexander, D. Structural basis for small molecule targeting of the programmed death ligand 1 (PD-L1). Oncotarget 2016, 7, 30323–30335. [Google Scholar] [CrossRef] [PubMed]
- Guzik, K.; Zak, K.M.; Grudnik, P.; Magiera, K.; Musielak, B.; Törner, R. Small-Molecule Inhibitors of the Programmed Cell Death-1/Programmed Death-Ligand 1 (PD-1/PD-L1) Interaction via Transiently Induced Protein States and Dimerization of PD-L1. J. Med. Chem. 2017, 60, 5857–5867. [Google Scholar] [CrossRef] [PubMed]
- Herbst, R.S.; Soria, J.C.; Kowanetz, M. Predictive correlates of response to the anti-PD-L1 antibody MPDL3280A in cancer patients. Nature. 2014, 515, 563–567. [Google Scholar] [CrossRef] [PubMed]
- Philips, G.K.; Atkins, M. Therapeutic uses of anti-PD-1 and anti-PD-L1 antibodies. Int. Immunol. 2015, 27, 39–46. [Google Scholar] [CrossRef] [PubMed]
- Naidoo, J.; Page, D.B.; Li, B.T.; Connell, L.C.; Schindler, K.; Lacouture, M.E. Toxicities of the anti-PD-1 and anti-PD-L1 immune checkpoint antibodies. Ann. Oncol. 2015, 26, 2375–2391. [Google Scholar] [CrossRef] [PubMed]
- Gunturi, A.; Mcdermott, D.F. Nivolumab for the treatment of cancer. Expert Opin. Investig. Drugs 2015, 24, 253–260. [Google Scholar] [CrossRef] [PubMed]
- Gangadhar, T.C.; Salama, A.K. Clinical applications of PD-1-based therapy: A focus on pembrolizumab (MK-3475) in the management of melanoma and other tumor types. Oncotargets Ther. 2015, 8, 929–937. [Google Scholar]
- Johnson, D.B.; Peng, C.; Sosman, J.A. Nivolumab in melanoma: Latest evidence and clinical potential. Ther. Adv. Med. Oncol. 2015, 7, 97–106. [Google Scholar] [CrossRef] [PubMed]
- Sharma, P.; Allison, J.P. The future of immune checkpoint therapy. Science 2015, 348, 56–61. [Google Scholar] [CrossRef] [PubMed]
- Powles, T.; Eder, J.P.; Fine, G.D.; Braiteh, F.S.; Loriot, Y.; Cruz, C. MPDL3280A (anti-PD-L1) treatment leads to clinical activity in metastatic bladder cancer. Nature. 2014, 515, 558–562. [Google Scholar] [CrossRef] [PubMed]
- Alqudah, D.A.; Zihlif, M.A.; Taha, M.O. Ligand-based modeling of diverse aryalkylamines yields new potent P-glycoprotein inhibitors. Eur. J. Med. Chem. 2016, 110, 204–223. [Google Scholar] [CrossRef] [PubMed]
- Tomii, K.; Hirokawa, T.; Motono, C. Protein structure prediction using a variety of profile libraries and 3D verification. Proteins 2005, 61, 114–120. [Google Scholar] [CrossRef] [PubMed]
- Feig, M.; Karanicolas, J.; Brooks, C.L. MMTSB Tool Set: Enhanced sampling and multiscale modeling methods for applications in structural biology. J. Mol. Graph. Model. 2004, 22, 377–395. [Google Scholar] [CrossRef] [PubMed]
- Hu, J.; Hu, Z.; Zhang, Y.; Gou, X.; Mu, Y.; Wang, L. Metal binding mediated conformational change of XPA protein: A potential cytotoxic mechanism of nickel in the nucleotide excision repair. J. Mol. Model. 2016, 22, 1–19. [Google Scholar] [CrossRef] [PubMed]
- Knapp, B.; Lederer, N.; Omasits, U.; Schreiner, W. vmdICE: A plug-in for rapid evaluation of molecular dynamics simulations using VMD. J. Comput. Chem. 2010, 31, 2868–2873. [Google Scholar] [CrossRef] [PubMed]
- Kabsch, W.; Sander, C. Dictionary of protein secondary structure. Biopolymers 1983, 22, 2577–2637. [Google Scholar] [CrossRef] [PubMed]
- Dolinsky, T.J.; Nielsen, J.E.; Mccammon, J.A.; Baker, N.A. PDB2PQR: An automated pipeline for the setup of Poisson-Boltzmann electrostatics calculations. Nucleic Acids Res. 2004, 32, W665–W667. [Google Scholar] [CrossRef] [PubMed]
- Ahmed, M.; Barakat, K. When theory meets experiment: The PD-1 challenge. J. Mol. Model. 2017, 23, 308–313. [Google Scholar] [CrossRef] [PubMed]
- Basu, S.; Mukharjee, D. Salt-bridge networks within globular and disordered proteins: Characterizing trends for designable interactions. J. Mol. Model. 2017, 23, 206–230. [Google Scholar] [CrossRef] [PubMed]
- Zhao, W.S.; Sun, M.Y.; Sun, L.F.; Liu, Y.; Yang, Y.; Huang, L.D. A Highly Conserved Salt Bridge Stabilizes the Kinked Conformation of β2,3-Sheet Essential for Channel Function of P2X4 Receptors. J. Biol. Chem. 2016, 291, 7990–8005. [Google Scholar] [CrossRef] [PubMed]
- Kumar, S.; Nussinov, R. Salt bridge stability in monomeric proteins. J. Mol. Biol. 1999, 293, 1241–1255. [Google Scholar] [CrossRef] [PubMed]
- Hu, J.P.; Gong, X.Q.; Su, J.G.; Chen, W.Z.; Wang, C.X. Study on the molecular mechanism of inhibiting HIV-1 integrase by EBR28 peptide via molecular modeling approach. Biophys. Chem. 2008, 132, 69–80. [Google Scholar] [CrossRef] [PubMed]
- Cummings, C.G.; Hamilton, A.D. Disrupting protein-protein interactions with non-peptidic, small molecule alpha-helix mimetics. Curr. Opin. Chem. Biol. 2010, 14, 341–346. [Google Scholar] [CrossRef] [PubMed]
- Case, D.A.; Darden, T.A.; Cheatham, T.E., III; Simmerling, C.L.; Wang, J.; Duke, R.E.; Luo, R.; Walker, R.C.; Zhang, W.; Merz, K.M.; et al. AMBER 12; University of California: San Francisco, CA, USA, 2012. [Google Scholar]
- Wang, J.; Cieplak, P.; Komllman, P.A. How well does a restrained electrostatic potential (RESP) model perform in calculating conformational energies of organic and biological molecules. J. Comput. Chem. 2000, 21, 1049–1074. [Google Scholar] [CrossRef]
- Jorgense, W.L.; Chandrasekhar, J.; Madura, J.D.; Impey, R.W.; Klein, M.L. Comparison of simple potential functions for simulating liquid water. J. Chem. Phys. 1983, 79, 926–935. [Google Scholar] [CrossRef]
- Ryckaert, J.P.; Ciccotti, G.; Berendsen, H.J.C. Numerical integration of the cartesian equations of motion of a system with constraints: Molecular dynamics of n-alkanes. J. Chem. Phys. 1977, 23, 327–341. [Google Scholar] [CrossRef]
- Hegger, R.; Altis, A.; Nguyen, P.H.; Stock, G. How complex is the dynamics of Peptide folding? Phys. Rev. Lett. 2007, 98, 028102. [Google Scholar] [CrossRef] [PubMed]
- Talavera, D.; Robertson, D.L.; Lovell, S.C. Characterization of Protein-Protein Interaction Interfaces from a Single Species. PLoS ONE 2011, 6, e21053. [Google Scholar] [CrossRef] [PubMed]
- Peri, C.; Morra, G.; Colombo, G. Surface energetics and protein-protein interactions: Analysis and mechanistic implications. Sci. Rep. 2016, 6, 24035. [Google Scholar] [CrossRef] [PubMed]
- Kumari, R.; Kumar, R.; Lynn, A. G_mmpbsa—A GROMACS tool for high-throughput MM-PBSA calculations. J. Chem. Inf. Model. 2014, 54, 1951–1962. [Google Scholar] [CrossRef] [PubMed]
- Kottalam, J.; Case, D.A. Langevin modes of macromolecules: Applications to crambin and DNA hexamers. Biopolymers 1990, 29, 1409–1421. [Google Scholar] [CrossRef] [PubMed]
- Kollman, P.A.; Massova, I.; Reyes, C.; Kuhn, B.; Huo, S.; Chong, L. Calculating structures and free energies of complex molecules: Combining molecular mechanics and continuum models. Acc. Chem. Res. 2000, 33, 889–897. [Google Scholar] [CrossRef] [PubMed]
- Catalysis, E.; Wang, W.; Donini, O.; Reyes, C.M.; Kollman, P.A. Biomolecular simulations: Recent developments in force fields, simulations of enzyme catalysis, protein-ligand, protein-protein and protein-nucleic acid noncovalent interactions. Annu. Rev. Biophys. Biomol. Struct. 2001, 30, 211–243. [Google Scholar]
- Simonson, T. Macromolecular electrostatics: Continuum models and their growing pains. Curr. Opin. Struc. Biol. 2001, 11, 243–252. [Google Scholar] [CrossRef]
- Bashford, D.; Case, D.A. Generalized born models of macromolecular solvation effects. Annu. Rev. Phys. Chem. 2000, 51, 129–152. [Google Scholar] [CrossRef] [PubMed]
- Still, W.C.; Tempczyk, A.; Hawley, R.C.; Hendrickson, T. Semianalytical treatment of solvation for molecular mechanics and dynamics. J. Am. Chem. Soc. 1990, 112, 6127–6129. [Google Scholar] [CrossRef]
- Weiser, J.; Shenkin, P.S.; Still, W.C. Approximate atomic surfaces from linear combinations of pairwise overlaps (LCPO). J. Comput. Chem. 1999, 20, 217–230. [Google Scholar] [CrossRef]


| Classification | PDB Codes | Residue Ranges | Substrates | Features |
|---|---|---|---|---|
| PD-1_apo | 1NPU, 3RRQ, 2M2D | S1-E150 | none | All are monomers with fewer mutation. 3RRQ comes from the human with the resolution of 2.1 Å [24,25]. |
| PD-1_antibody | 5GGR, 5GGS, 5JXE, 5B8C, 5WT9 | L25-E146 | Nivolumab, Pembrolizumab | All structures belong to the human and are intact with high-resolution, which can be used to explore the binding mode of PD-1 with antibody inhibitors [18,19,26,27]. |
| PD-L1_apo | 3BIS, 3FN3, 4ZI8, 5JDR, 5C3T | M18-A232 | none | All are dimers with resolutions up to 1.8 Å (such as 5CT3). Since there is no substrate information, it is used to investigate conformational changes before binding its inhibitors [12,28,29,30]. |
| PD-L1_antibody | 5GGT, 5GRJ, 5JDS, 5X8L, 5X8M | A18-H233 | BMS-936559, avelumab, KN035-Fc, atezolizumab, durvalumab | 5JDS has the complete structure, with no mutation and a high resolution of 1.7 Å. The substrate in 5JDS is a nanobody, being the latest antibody drugs which provides a useful idea for the reconstruction and design of antibodies based on the structure of PD-L1 [19,30,31,32]. |
| PD-1/PD-L1 | 3BIK, 3SBW, 4ZQK, 5IUS | D29-I148; A18-L231 | none | 3BIK and 3SBW are mouse PD-1/human PD-L1 complex. 4ZQK is human-derived wild type with high resolution and no mutation, more suitable for the following simulation [12,28,33]. |
| PD-L1/PD-L1_ligand | 5J8O, 5J89 5N2D, 5N2F | A18-H142 | BMS-8, BMS-37, BMS-200, BMS-202 | For the first time, the structural information of small molecule inhibitors of PD-L1 was reported. Based on the 5J89 structure, Zak group proposed a possible inhibitory mechanism of PD-L1 small molecule inhibitors [34,35]. |
| Targets | Antibodies | Developers | Property |
|---|---|---|---|
| PD-1 | Nivolumab | Bristol-Myers Squibb | Most of the antibody structures are mainly based on PD-L2 and IgG4. The side effects main lie in destabilizing the complex structure of PD-1/PD-L2. Currently, Nivolumab and Pembrolizumab both were used to treat NSCLC and lymphoma. |
| Pembrolizumab | Merck | ||
| AMP-224/AMP-514 | GlaxoSmithKline | ||
| Pidilizumab | CureTech | ||
| BGB-A317 | BeiGene | ||
| SHR-1210 | Jiangsu Hengui Medicine | ||
| PD-L1 | BMS-936559 | Bristol-Myers Squibb | PD-L1 antibody mainly comes from IgG1 and its side effect is weaker than PD-1 mAbs, which is mainly used for the treatment of advanced solid tumors. Most mAbs are in phase I clinical stage, in which Atezolizumab is approved for clinical use. |
| Atezolizumab | Genentech/Roche | ||
| Durvalumab | AstraZenerca | ||
| Avelumab | Pfizer/Merck | ||
| KN035-Fc | Hongqiao I Ins Med | ||
| PD-L2 | rHlgM12B7 | Mayo Clinic/NCI | The effect of PD-L2 on T cells is far less than that of PD-L1. There are few reports on mABs of PD-L2. |
| Systems | ∆H | T∆S | ∆Gbind | ∆Gexp |
|---|---|---|---|---|
| PD-1/PD-L1 | −46.64 ± 3.24 | −41.37 ± 1.49 | −5.27 | − |
| Nano/PD-L1 | −56.73 ± 5.42 | −42.83 ± 2.68 | −13.90 | −11.38 [30] |
© 2018 by the authors. Licensee MDPI, Basel, Switzerland. This article is an open access article distributed under the terms and conditions of the Creative Commons Attribution (CC BY) license (http://creativecommons.org/licenses/by/4.0/).
Share and Cite
Sun, X.; Yan, X.; Zhuo, W.; Gu, J.; Zuo, K.; Liu, W.; Liang, L.; Gan, Y.; He, G.; Wan, H.; et al. PD-L1 Nanobody Competitively Inhibits the Formation of the PD-1/PD-L1 Complex: Comparative Molecular Dynamics Simulations. Int. J. Mol. Sci. 2018, 19, 1984. https://doi.org/10.3390/ijms19071984
Sun X, Yan X, Zhuo W, Gu J, Zuo K, Liu W, Liang L, Gan Y, He G, Wan H, et al. PD-L1 Nanobody Competitively Inhibits the Formation of the PD-1/PD-L1 Complex: Comparative Molecular Dynamics Simulations. International Journal of Molecular Sciences. 2018; 19(7):1984. https://doi.org/10.3390/ijms19071984
Chicago/Turabian StyleSun, Xin, Xiao Yan, Wei Zhuo, Jinke Gu, Ke Zuo, Wei Liu, Li Liang, Ya Gan, Gang He, Hua Wan, and et al. 2018. "PD-L1 Nanobody Competitively Inhibits the Formation of the PD-1/PD-L1 Complex: Comparative Molecular Dynamics Simulations" International Journal of Molecular Sciences 19, no. 7: 1984. https://doi.org/10.3390/ijms19071984
APA StyleSun, X., Yan, X., Zhuo, W., Gu, J., Zuo, K., Liu, W., Liang, L., Gan, Y., He, G., Wan, H., Gou, X., Shi, H., & Hu, J. (2018). PD-L1 Nanobody Competitively Inhibits the Formation of the PD-1/PD-L1 Complex: Comparative Molecular Dynamics Simulations. International Journal of Molecular Sciences, 19(7), 1984. https://doi.org/10.3390/ijms19071984