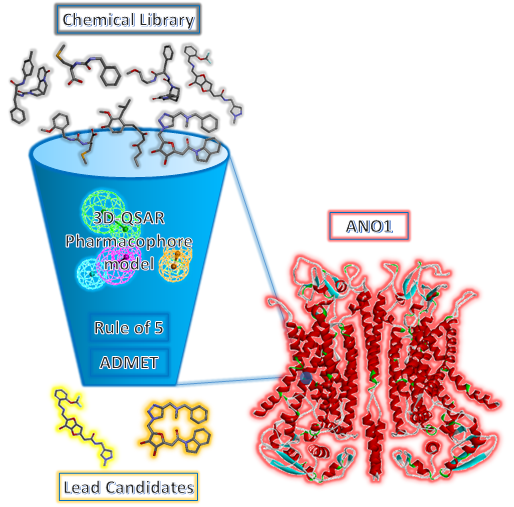
Prediction of Novel Anoctamin1 (ANO1) Inhibitors Using 3D-QSAR Pharmacophore Modeling and Molecular Docking


Abstract

1. Introduction
2. Results and Discussion
2.1. Pharmacophore Model Generation
2.2. Pharmacophore Model Evaluation and Selection
2.3. Pharmacophore Model Validation
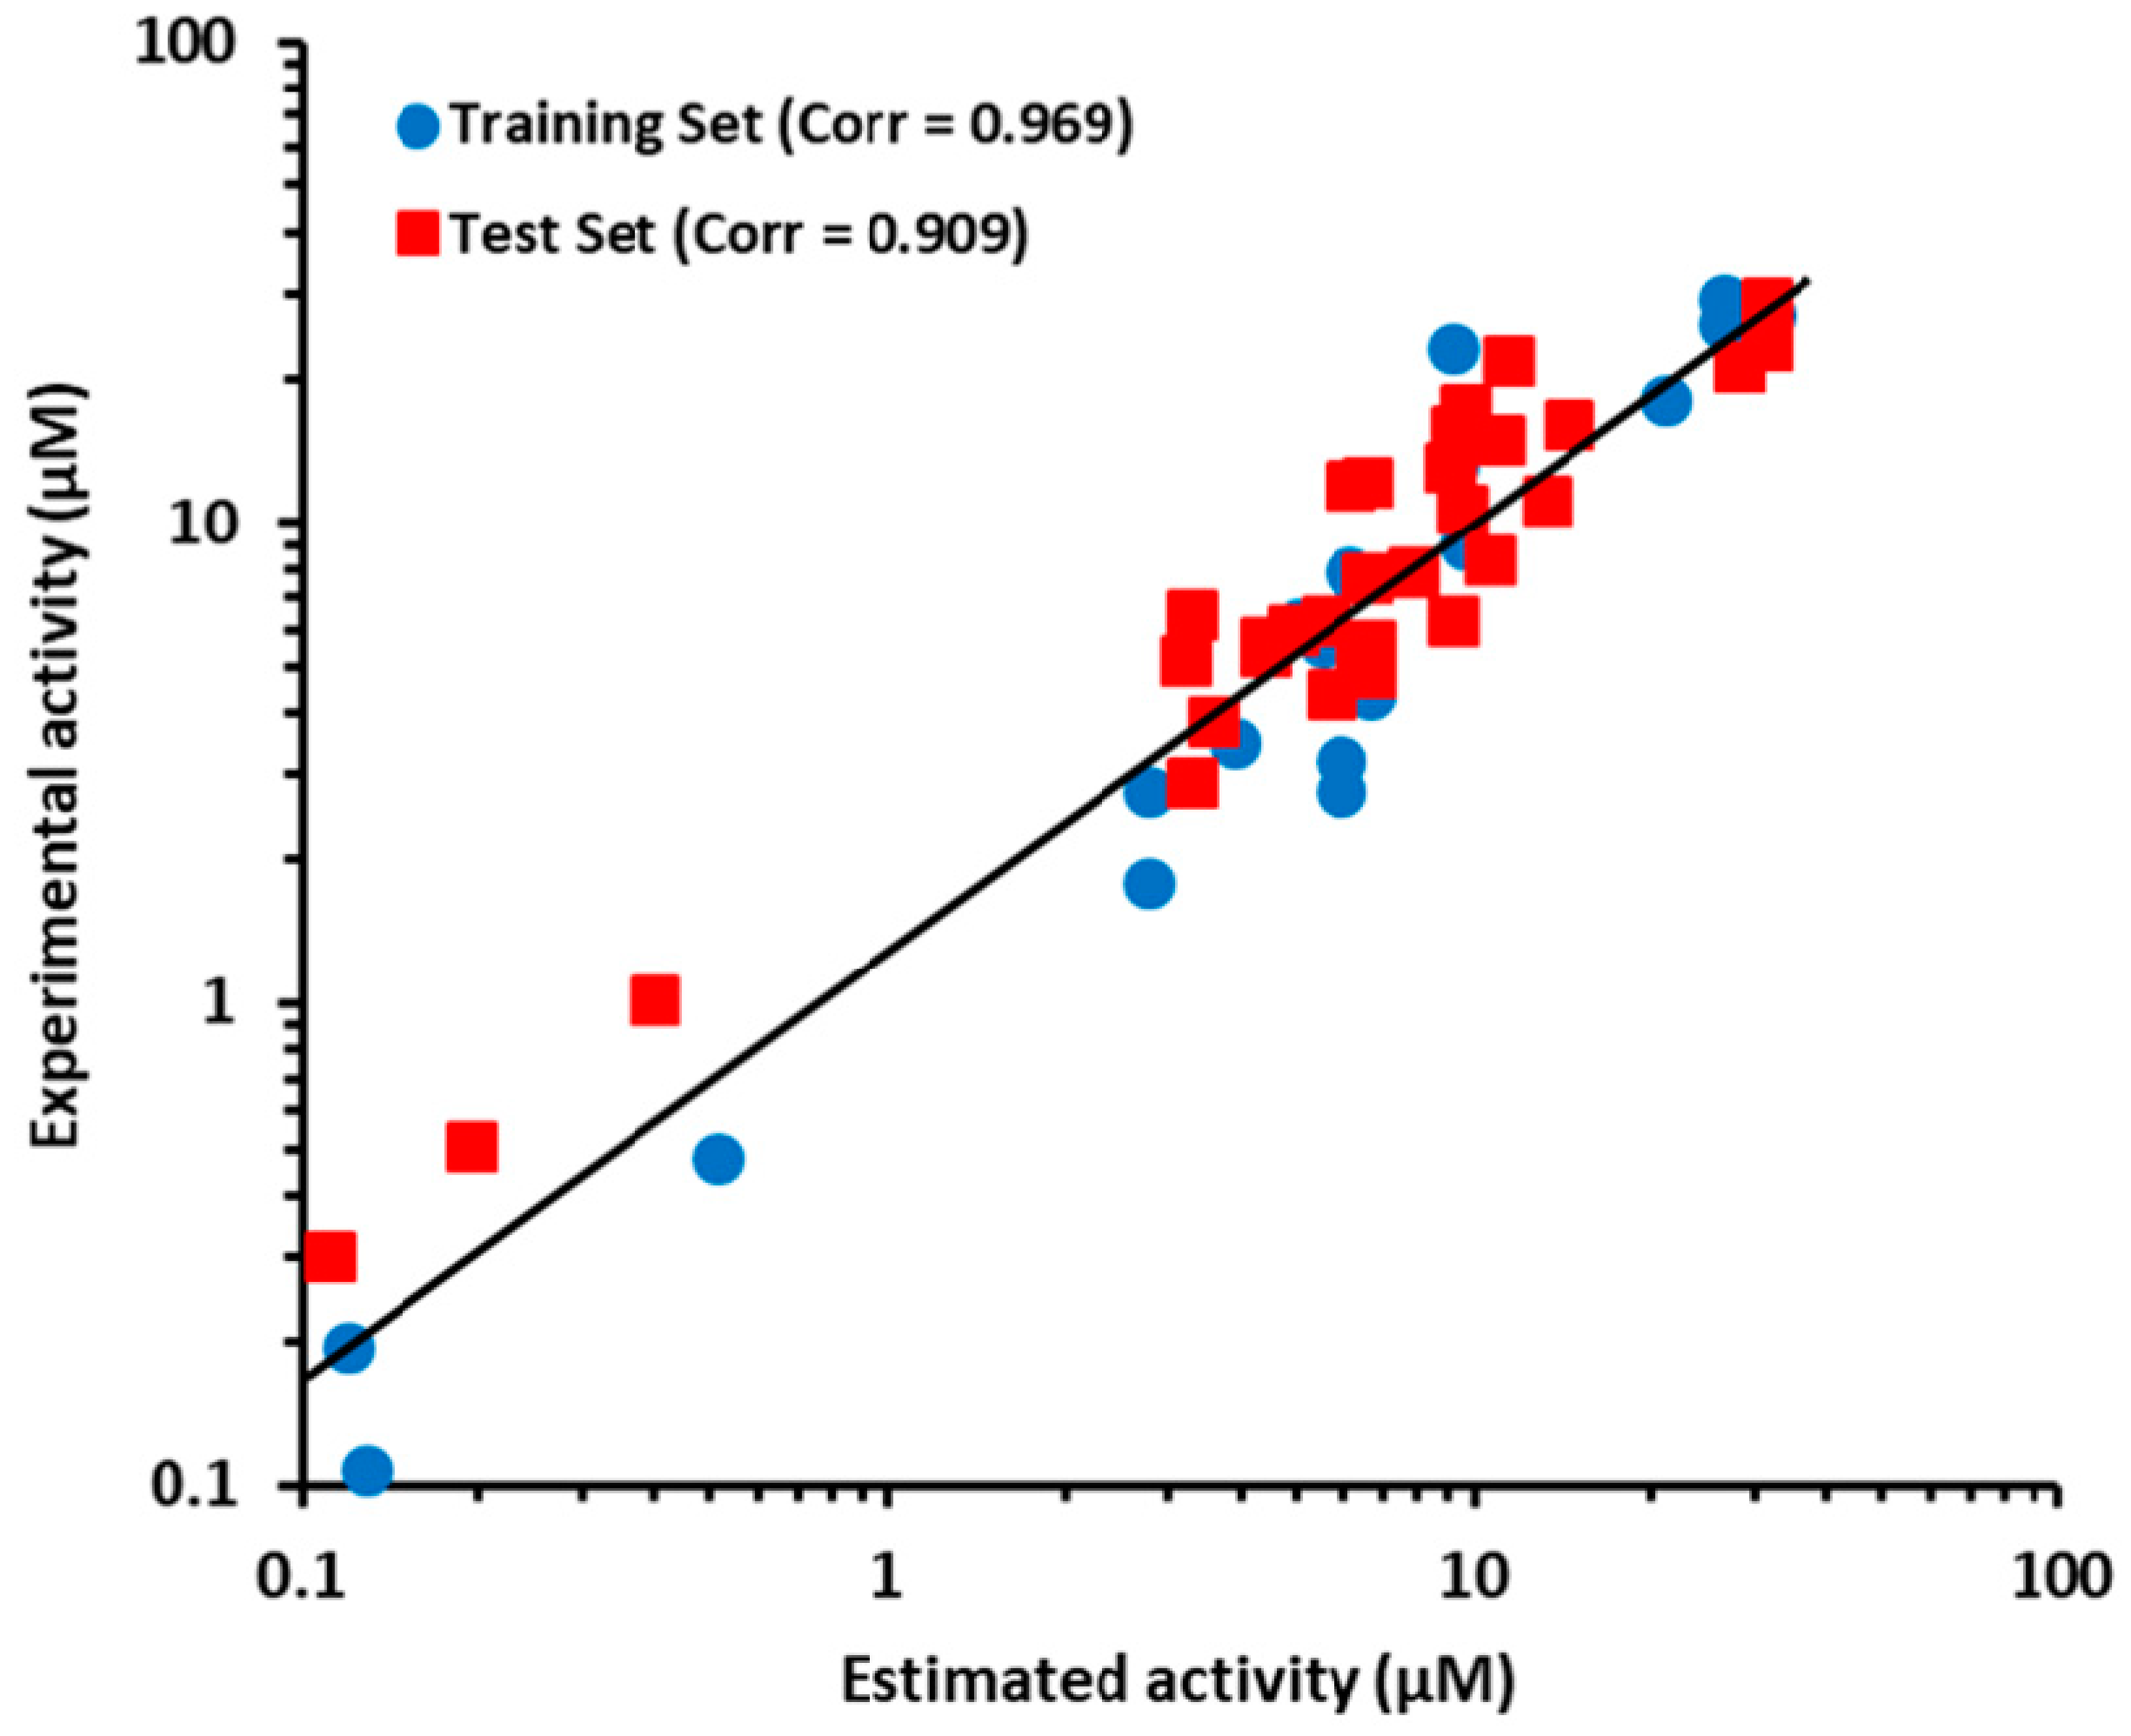
2.3.1. Test Set Method
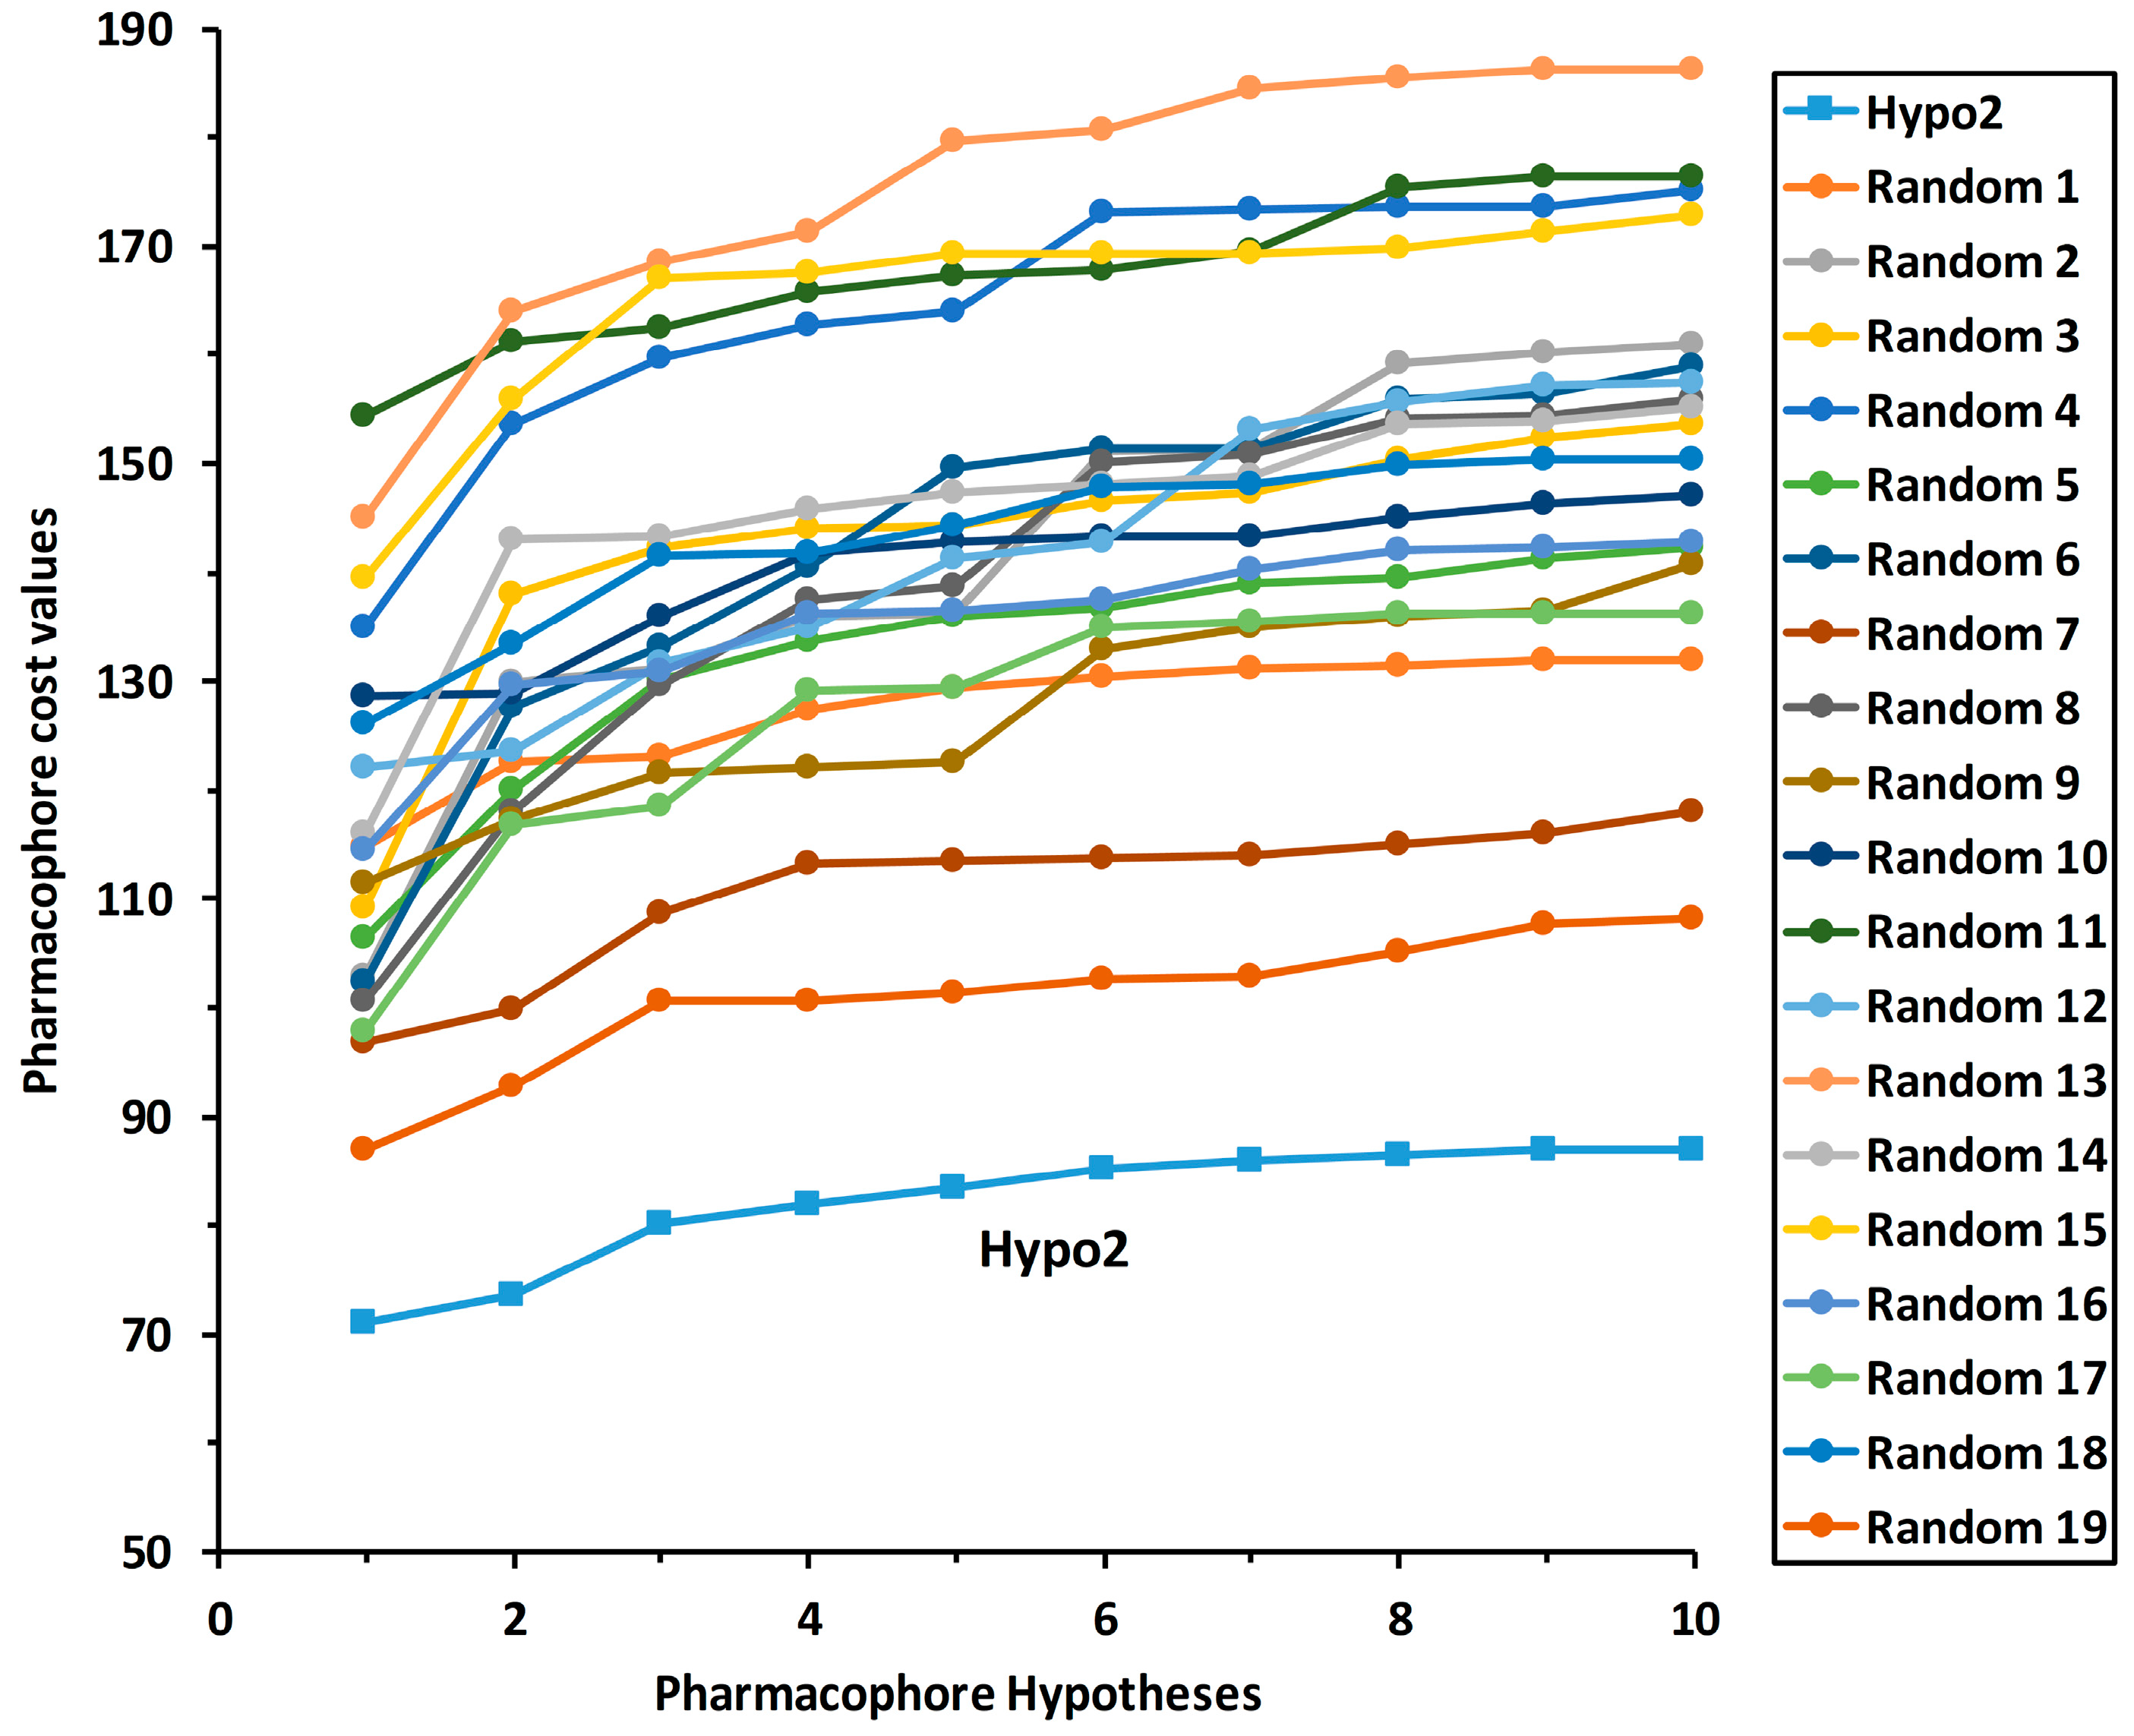
2.3.2. Fischer Randomization Method
2.3.3. Leave-One-Out Method
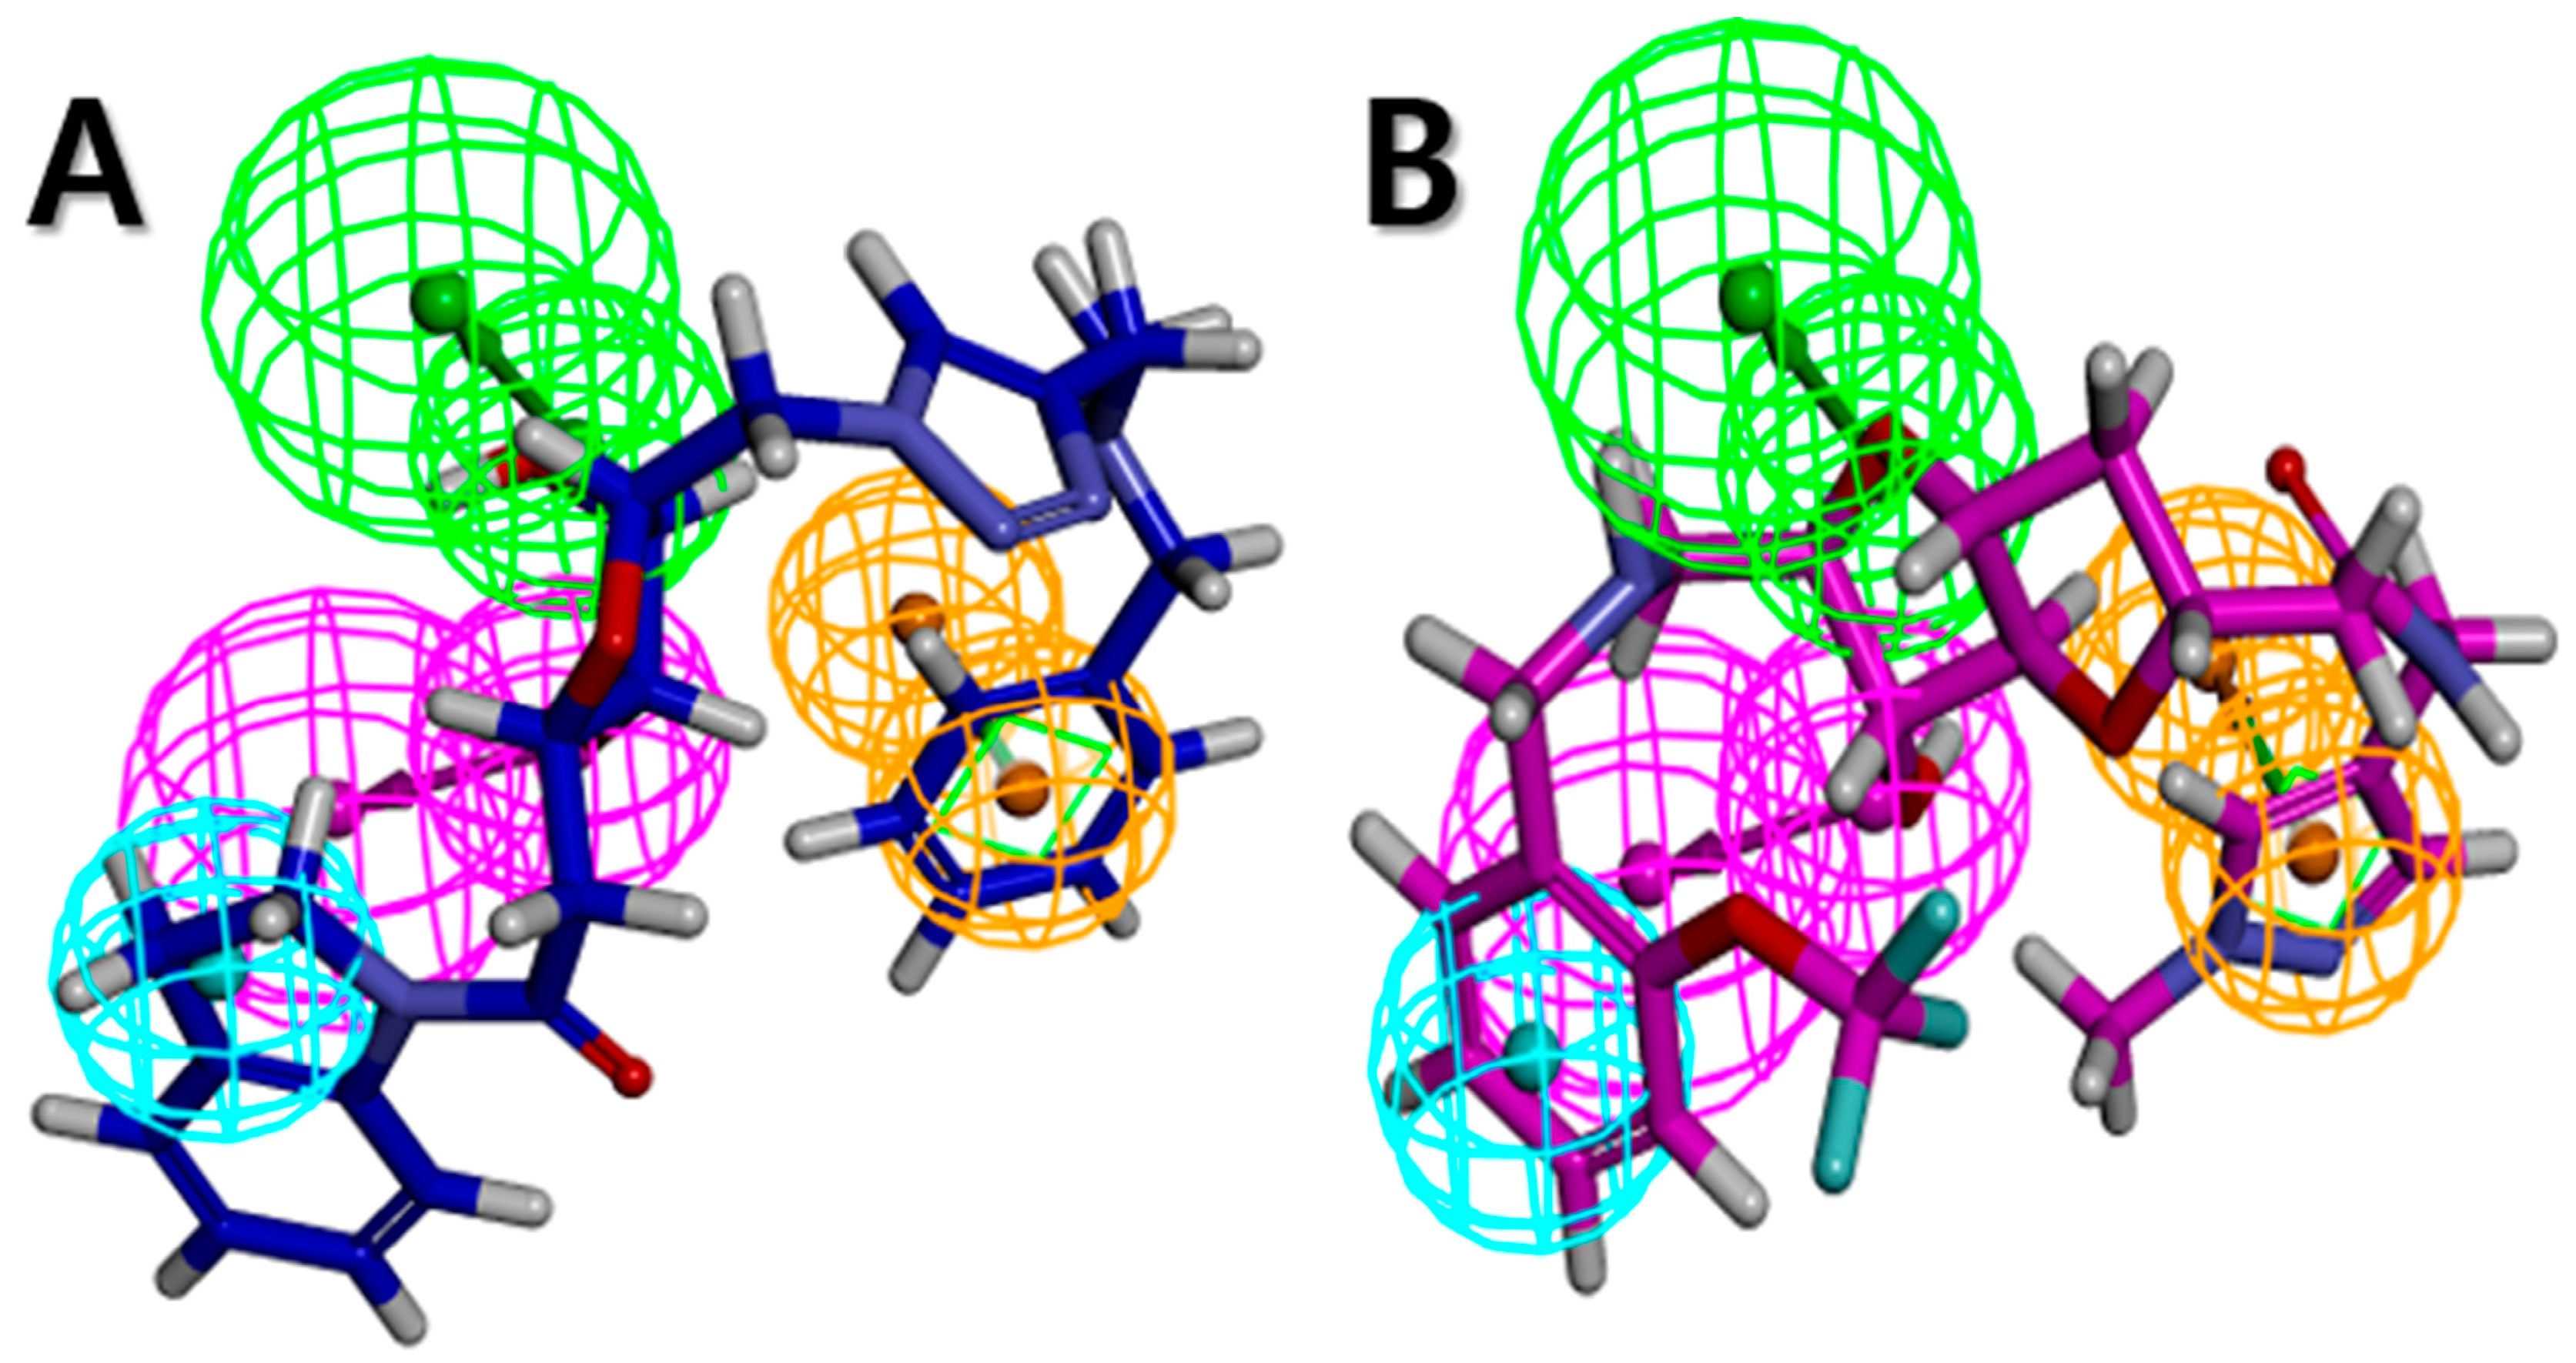
2.4. Virtual Screening
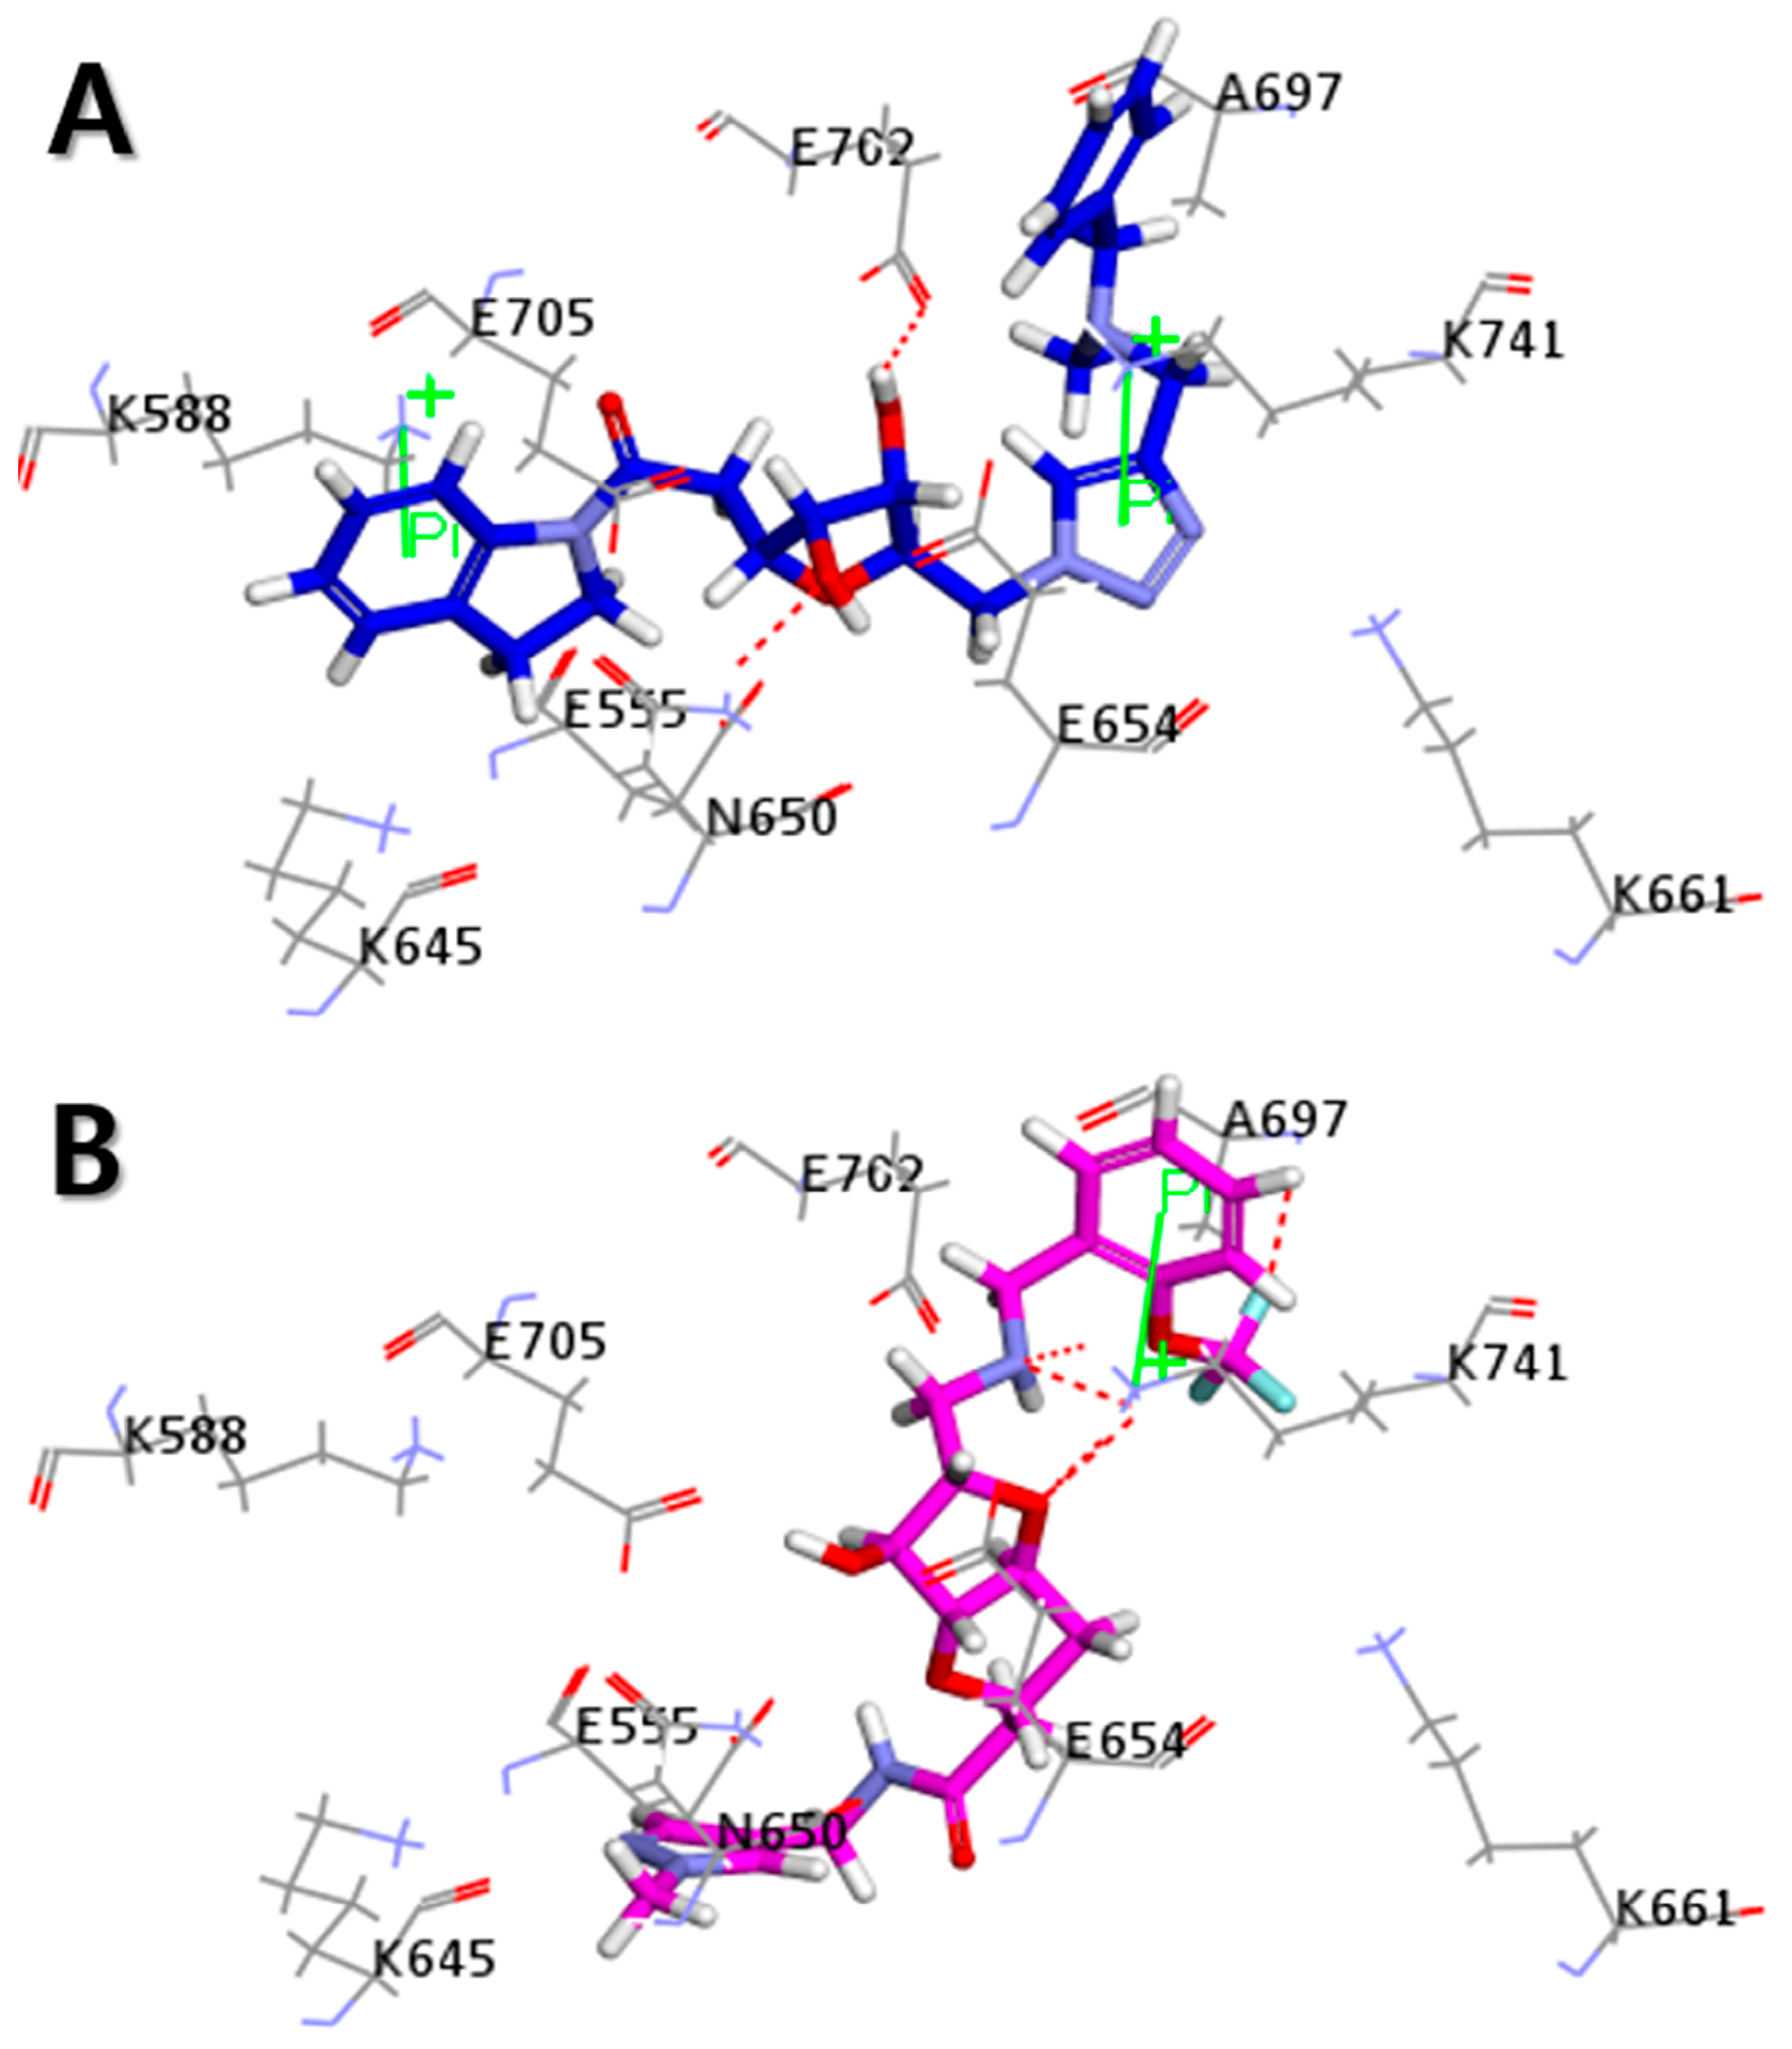
2.5. Molecular Docking
3. Materials and Methods
3.1. Pharmacophore Model Generation
3.1.1. Selection of Dataset Compounds
3.1.2. Dataset Compound Preparation
3.1.3. Generation of Pharmacophore Models
3.2. Pharmacophore Model Evaluation
3.2.1. Cost Analysis
3.2.2. Test Set Method
3.2.3. Fischer Randomization Method
3.2.4. Leave-One-Out Method
3.3. Virtual Screening
3.4. Molecular Docking
4. Conclusions
Author Contributions
Funding
Conflicts of Interest
Abbreviations
| ZINC | ZINC Is Not Commercial database |
| ADMET | Absorption, Distribution, Metabolism, Excretion, and Toxicity |
| MONNA | N-((4-methoxy)-2-naphthyl)-5-nitroanthranilic acid |
| FDA | The Food and Drug Administration |
| ANO2 | Anoctamin 2 |
| CFTR | Cystic fibrosis transmembrane conductance regulator |
| ENaC | Epithelial sodium channel |
| PDE4 | Type 4 cyclic adenosine monophosphate (cAMP) phosphodiesterase |
| BACE1 | β-Site amyloid precursor protein-cleaving enzyme |
| AKR1B10 | Aldo-keto reductase family 1 B 10 |
| CYP2D6 | Cytochrome P450 2D6 |
References
- Caputo, A.; Caci, E.; Ferrera, L.; Pedemonte, N.; Barsanti, C.; Sondo, E.; Pfeffer, U.; Ravazzolo, R.; Zegarra-Moran, O.; Galietta, L.J. TMEM16A, a membrane protein associated with calcium-dependent chloride channel activity. Science 2008, 322, 590–594. [Google Scholar] [CrossRef] [PubMed]
- Schroeder, B.C.; Cheng, T.; Jan, Y.N.; Jan, L.Y. Expression cloning of TMEM16A as a calcium-activated chloride channel subunit. Cell 2008, 134, 1019–1029. [Google Scholar] [CrossRef] [PubMed]
- Yang, Y.D.; Cho, H.; Koo, J.Y.; Tak, M.H.; Cho, Y.; Shim, W.S.; Park, S.P.; Lee, J.; Lee, B.; Kim, B.M.; et al. TMEM16A confers receptor-activated calcium-dependent chloride conductance. Nature 2008, 455, 1210–1215. [Google Scholar] [CrossRef] [PubMed]
- Huang, F.; Rock, J.R.; Harfe, B.D.; Cheng, T.; Huang, X.; Jan, Y.N.; Jan, L.Y. Studies on expression and function of the TMEM16A calcium-activated chloride channel. Proc. Natl. Acad. Sci. USA 2009, 106, 21413–21418. [Google Scholar] [CrossRef] [PubMed]
- Pedemonte, N.; Galietta, L.J. Structure and function of TMEM16 proteins (anoctamins). Physiol. Rev. 2014, 94, 419–459. [Google Scholar] [CrossRef] [PubMed]
- Oh, U.; Jung, J. Cellular functions of TMEM16/anoctamin. Pflugers Arch. 2016, 468, 443–453. [Google Scholar] [CrossRef] [PubMed]
- Verkman, A.S.; Galietta, L.J. Chloride channels as drug targets. Nat. Rev. Drug Discov. 2009, 8, 153–171. [Google Scholar] [CrossRef] [PubMed]
- Galietta, L.J.; Haggie, P.M.; Verkman, A.S. Green fluorescent protein-based halide indicators with improved chloride and iodide affinities. FEBS Lett. 2001, 499, 220–224. [Google Scholar] [CrossRef]
- De La Fuente, R.; Namkung, W.; Mills, A.; Verkman, A.S. Small-molecule screen identifies inhibitors of a human intestinal calcium-activated chloride channel. Mol. Pharmacol. 2008, 73, 758–768. [Google Scholar] [CrossRef] [PubMed]
- Namkung, W.; Phuan, P.W.; Verkman, A.S. TMEM16A inhibitors reveal TMEM16A as a minor component of calcium-activated chloride channel conductance in airway and intestinal epithelial cells. J. Biol. Chem. 2011, 286, 2365–2374. [Google Scholar] [CrossRef] [PubMed]
- Oh, S.J.; Hwang, S.J.; Jung, J.; Yu, K.; Kim, J.; Choi, J.Y.; Hartzell, H.C.; Roh, E.J.; Lee, C.J. MONNA, a potent and selective blocker for transmembrane protein with unknown function 16/anoctamin-1. Mol. Pharmacol. 2013, 84, 726–735. [Google Scholar] [CrossRef] [PubMed]
- Huang, F.; Zhang, H.; Wu, M.; Yang, H.; Kudo, M.; Peters, C.J.; Woodruff, P.G.; Solberg, O.D.; Donne, M.L.; Huang, X.; et al. Calcium-activated chloride channel TMEM16A modulates mucin secretion and airway smooth muscle contraction. Proc. Natl. Acad. Sci. USA 2012, 109, 16354–16359. [Google Scholar] [CrossRef] [PubMed]
- Seo, Y.; Lee, H.K.; Park, J.; Jeon, D.K.; Jo, S.; Jo, M.; Namkung, W. Ani9, A Novel Potent Small-Molecule ANO1 Inhibitor with Negligible Effect on ANO2. PLoS ONE 2016, 11, e0155771. [Google Scholar] [CrossRef] [PubMed]
- Namkung, W.; Thiagarajah, J.R.; Phuan, P.W.; Verkman, A.S. Inhibition of Ca2+-activated Cl− channels by gallotannins as a possible molecular basis for health benefits of red wine and green tea. FASEB J. 2010, 24, 4178–4186. [Google Scholar] [CrossRef] [PubMed]
- Yao, Z.; Namkung, W.; Ko, E.A.; Park, J.; Tradtrantip, L.; Verkman, A.S. Fractionation of a herbal antidiarrheal medicine reveals eugenol as an inhibitor of Ca2+-Activated Cl− channel TMEM16A. PLoS ONE 2012, 7, e38030. [Google Scholar] [CrossRef] [PubMed]
- Seo, Y.; Ryu, K.; Park, J.; Jeon, D.K.; Jo, S.; Lee, H.K.; Namkung, W. Inhibition of ANO1 by luteolin and its cytotoxicity in human prostate cancer PC-3 cells. PLoS ONE 2017, 12, e0174935. [Google Scholar] [CrossRef] [PubMed]
- Tradtrantip, L.; Namkung, W.; Verkman, A.S. Crofelemer, an antisecretory antidiarrheal proanthocyanidin oligomer extracted from Croton lechleri, targets two distinct intestinal chloride channels. Mol. Pharmacol. 2010, 77, 69–78. [Google Scholar] [CrossRef] [PubMed]
- Cottreau, J.; Tucker, A.; Crutchley, R.; Garey, K.W. Crofelemer for the treatment of secretory diarrhea. Expert Rev. Gastroenterol. Hepatol. 2012, 6, 17–23. [Google Scholar] [CrossRef] [PubMed]
- Berg, J.; Yang, H.; Jan, L.Y. Ca2+-activated Cl− channels at a glance. J. Cell Sci. 2012, 125 Pt 6, 1367–1371. [Google Scholar] [CrossRef]
- Hartzell, C.; Putzier, I.; Arreola, J. Calcium-activated chloride channels. Annu. Rev. Physiol. 2005, 67, 719–758. [Google Scholar] [CrossRef] [PubMed]
- Kaserer, T.; Beck, K.R.; Akram, M.; Odermatt, A.; Schuster, D. Pharmacophore Models and Pharmacophore-Based Virtual Screening: Concepts and Applications Exemplified on Hydroxysteroid Dehydrogenases. Molecules 2015, 20, 22799–22832. [Google Scholar] [CrossRef] [PubMed]
- John, S.; Thangapandian, S.; Arooj, M.; Hong, J.C.; Kim, K.D.; Lee, K.W. Development, evaluation and application of 3D QSAR Pharmacophore model in the discovery of potential human renin inhibitors. BMC Bioinform. 2011, 12 (Suppl. 14), S4. [Google Scholar] [CrossRef] [PubMed]
- John, S.; Thangapandian, S.; Sakkiah, S.; Lee, K.W. Potent BACE-1 inhibitor design using pharmacophore modeling, in silico screening and molecular docking studies. BMC Bioinform. 2011, 12 (Suppl. 1), S28. [Google Scholar] [CrossRef] [PubMed]
- Niu, M.; Dong, F.; Tang, S.; Fida, G.; Qin, J.; Qiu, J.; Liu, K.; Gao, W.; Gu, Y. Pharmacophore modeling and virtual screening for the discovery of new type 4 cAMP phosphodiesterase (PDE4) inhibitors. PLoS ONE 2013, 8, e82360. [Google Scholar] [CrossRef] [PubMed]
- Niu, M.M.; Qin, J.Y.; Tian, C.P.; Yan, X.F.; Dong, F.G.; Cheng, Z.Q.; Fida, G.; Yang, M.; Chen, H.Y.; Gu, Y.Q. Tubulin inhibitors: Pharmacophore modeling, virtual screening and molecular docking. Acta Pharmacol. Sin. 2014, 35, 967–979. [Google Scholar] [CrossRef] [PubMed]
- Kumar, R.; Son, M.; Bavi, R.; Lee, Y.; Park, C.; Arulalapperumal, V.; Cao, G.P.; Kim, H.H.; Suh, J.K.; Kim, Y.S.; et al. Novel chemical scaffolds of the tumor marker AKR1B10 inhibitors discovered by 3D QSAR pharmacophore modeling. Acta Pharmacol. Sin. 2015, 36, 998–1012. [Google Scholar] [CrossRef] [PubMed]
- Dang, S.; Feng, S.; Tien, J.; Peters, C.J.; Bulkley, D.; Lolicato, M.; Zhao, J.; Zuberbuhler, K.; Ye, W.; Qi, L.; et al. Cryo-EM structures of the TMEM16A calcium-activated chloride channel. Nature 2017, 552, 426–429. [Google Scholar] [CrossRef] [PubMed]
- Paulino, C.; Kalienkova, V.; Lam, A.K.M.; Neldner, Y.; Dutzler, R. Activation mechanism of the calcium-activated chloride channel TMEM16A revealed by cryo-EM. Nature 2017, 552, 421–425. [Google Scholar] [CrossRef] [PubMed]
- Paulino, C.; Neldner, Y.; Lam, A.K.; Kalienkova, V.; Brunner, J.D.; Schenck, S.; Dutzler, R. Structural basis for anion conduction in the calcium-activated chloride channel TMEM16A. eLife 2017, 6, e26232. [Google Scholar] [CrossRef] [PubMed]
- Kumar, S.; Namkung, W.; Verkman, A.S.; Sharma, P.K. Novel 5-substituted benzyloxy-2-arylbenzofuran-3-carboxylic acids as calcium activated chloride channel inhibitors. Bioorg. Med. Chem. 2012, 20, 4237–4244. [Google Scholar] [CrossRef] [PubMed]
- Piechowicz, K.A.; Truong, E.C.; Javed, K.M.; Chaney, R.R.; Wu, J.Y.; Phuan, P.W.; Verkman, A.S.; Anderson, M.O. Synthesis and evaluation of 5,6-disubstituted thiopyrimidine aryl aminothiazoles as inhibitors of the calcium-activated chloride channel TMEM16A/Ano1. J. Enzyme Inhib. Med. Chem. 2016, 31, 1362–1368. [Google Scholar] [CrossRef] [PubMed]
- Sterling, T.; Irwin, J.J. ZINC 15--Ligand Discovery for Everyone. J. Chem. Inf. Model. 2015, 55, 2324–2337. [Google Scholar] [CrossRef] [PubMed]
- Yu, K.; Duran, C.; Qu, Z.; Cui, Y.Y.; Hartzell, H.C. Explaining calcium-dependent gating of anoctamin-1 chloride channels requires a revised topology. Circ. Res. 2012, 110, 990–999. [Google Scholar] [CrossRef] [PubMed]
- Tien, J.; Peters, C.J.; Wong, X.M.; Cheng, T.; Jan, Y.N.; Jan, L.Y.; Yang, H. A comprehensive search for calcium binding sites critical for TMEM16A calcium-activated chloride channel activity. eLife 2014, 3, e02772. [Google Scholar] [CrossRef] [PubMed]
- Jeng, G.; Aggarwal, M.; Yu, W.P.; Chen, T.Y. Independent activation of distinct pores in dimeric TMEM16A channels. J. Gen. Physiol. 2016, 148, 393–404. [Google Scholar] [CrossRef] [PubMed]
- Lim, N.K.; Lam, A.K.; Dutzler, R. Independent activation of ion conduction pores in the double-barreled calcium-activated chloride channel TMEM16A. J. Gen. Physiol. 2016, 148, 375–392. [Google Scholar] [CrossRef] [PubMed]
- Kim, S.; Thiessen, P.A.; Bolton, E.E.; Chen, J.; Fu, G.; Gindulyte, A.; Han, L.; He, J.; He, S.; Shoemaker, B.A.; et al. PubChem Substance and Compound databases. Nucleic Acids Res. 2016, 44, D1202–D1213. [Google Scholar] [CrossRef] [PubMed]
- Li, H.; Sutter, J.; Hoffmann, R. HypoGen: An automated system for generating 3D predictive pharmacophore models. In Pharmacophore Perception Development, and Use in Drug Design; Guner, O.F., Ed.; International University Line: La Jolla, CA, USA, 2000; pp. 172–189. [Google Scholar]
- Lipinski, C.A.; Lombardo, F.; Dominy, B.W.; Feeney, P.J. Experimental and computational approaches to estimate solubility and permeability in drug discovery and development settings. Adv. Drug Deliv. Rev. 2001, 46, 3–26. [Google Scholar] [CrossRef]
- Egan, W.J.; Merz, K.M., Jr.; Baldwin, J.J. Prediction of drug absorption using multivariate statistics. J. Med. Chem. 2000, 43, 3867–3877. [Google Scholar] [CrossRef] [PubMed]
- Egan, W.J.; Lauri, G. Prediction of intestinal permeability. Adv. Drug Deliv. Rev. 2002, 54, 273–289. [Google Scholar] [CrossRef]
- Cheng, A.; Dixon, S.L. In silico models for the prediction of dose-dependent human hepatotoxicity. J. Comput. Aided Mol. Des. 2003, 17, 811–823. [Google Scholar] [CrossRef] [PubMed]
- Cheng, A.; Merz, K.M., Jr. Prediction of aqueous solubility of a diverse set of compounds using quantitative structure-property relationships. J. Med. Chem. 2003, 46, 3572–3580. [Google Scholar] [CrossRef] [PubMed]
- Susnow, R.G.; Dixon, S.L. Use of robust classification techniques for the prediction of human cytochrome P450 2D6 inhibition. J. Chem. Inf. Comput. Sci. 2003, 43, 1308–1315. [Google Scholar] [CrossRef] [PubMed]
- Xia, X.; Maliski, E.G.; Gallant, P.; Rogers, D. Classification of kinase inhibitors using a Bayesian model. J. Med. Chem. 2004, 47, 4463–4470. [Google Scholar] [CrossRef] [PubMed]
- Rao, S.N.; Head, M.S.; Kulkarni, A.; LaLonde, J.M. Validation studies of the site-directed docking program LibDock. J. Chem. Inf. Model. 2007, 47, 2159–2171. [Google Scholar] [CrossRef] [PubMed]
- Bill, A.; Hall, M.L.; Borawski, J.; Hodgson, C.; Jenkins, J.; Piechon, P.; Popa, O.; Rothwell, C.; Tranter, P.; Tria, S.; et al. Small molecule-facilitated degradation of ANO1 protein: A new targeting approach for anticancer therapeutics. J. Biol. Chem. 2014, 289, 11029–11041. [Google Scholar] [CrossRef] [PubMed]


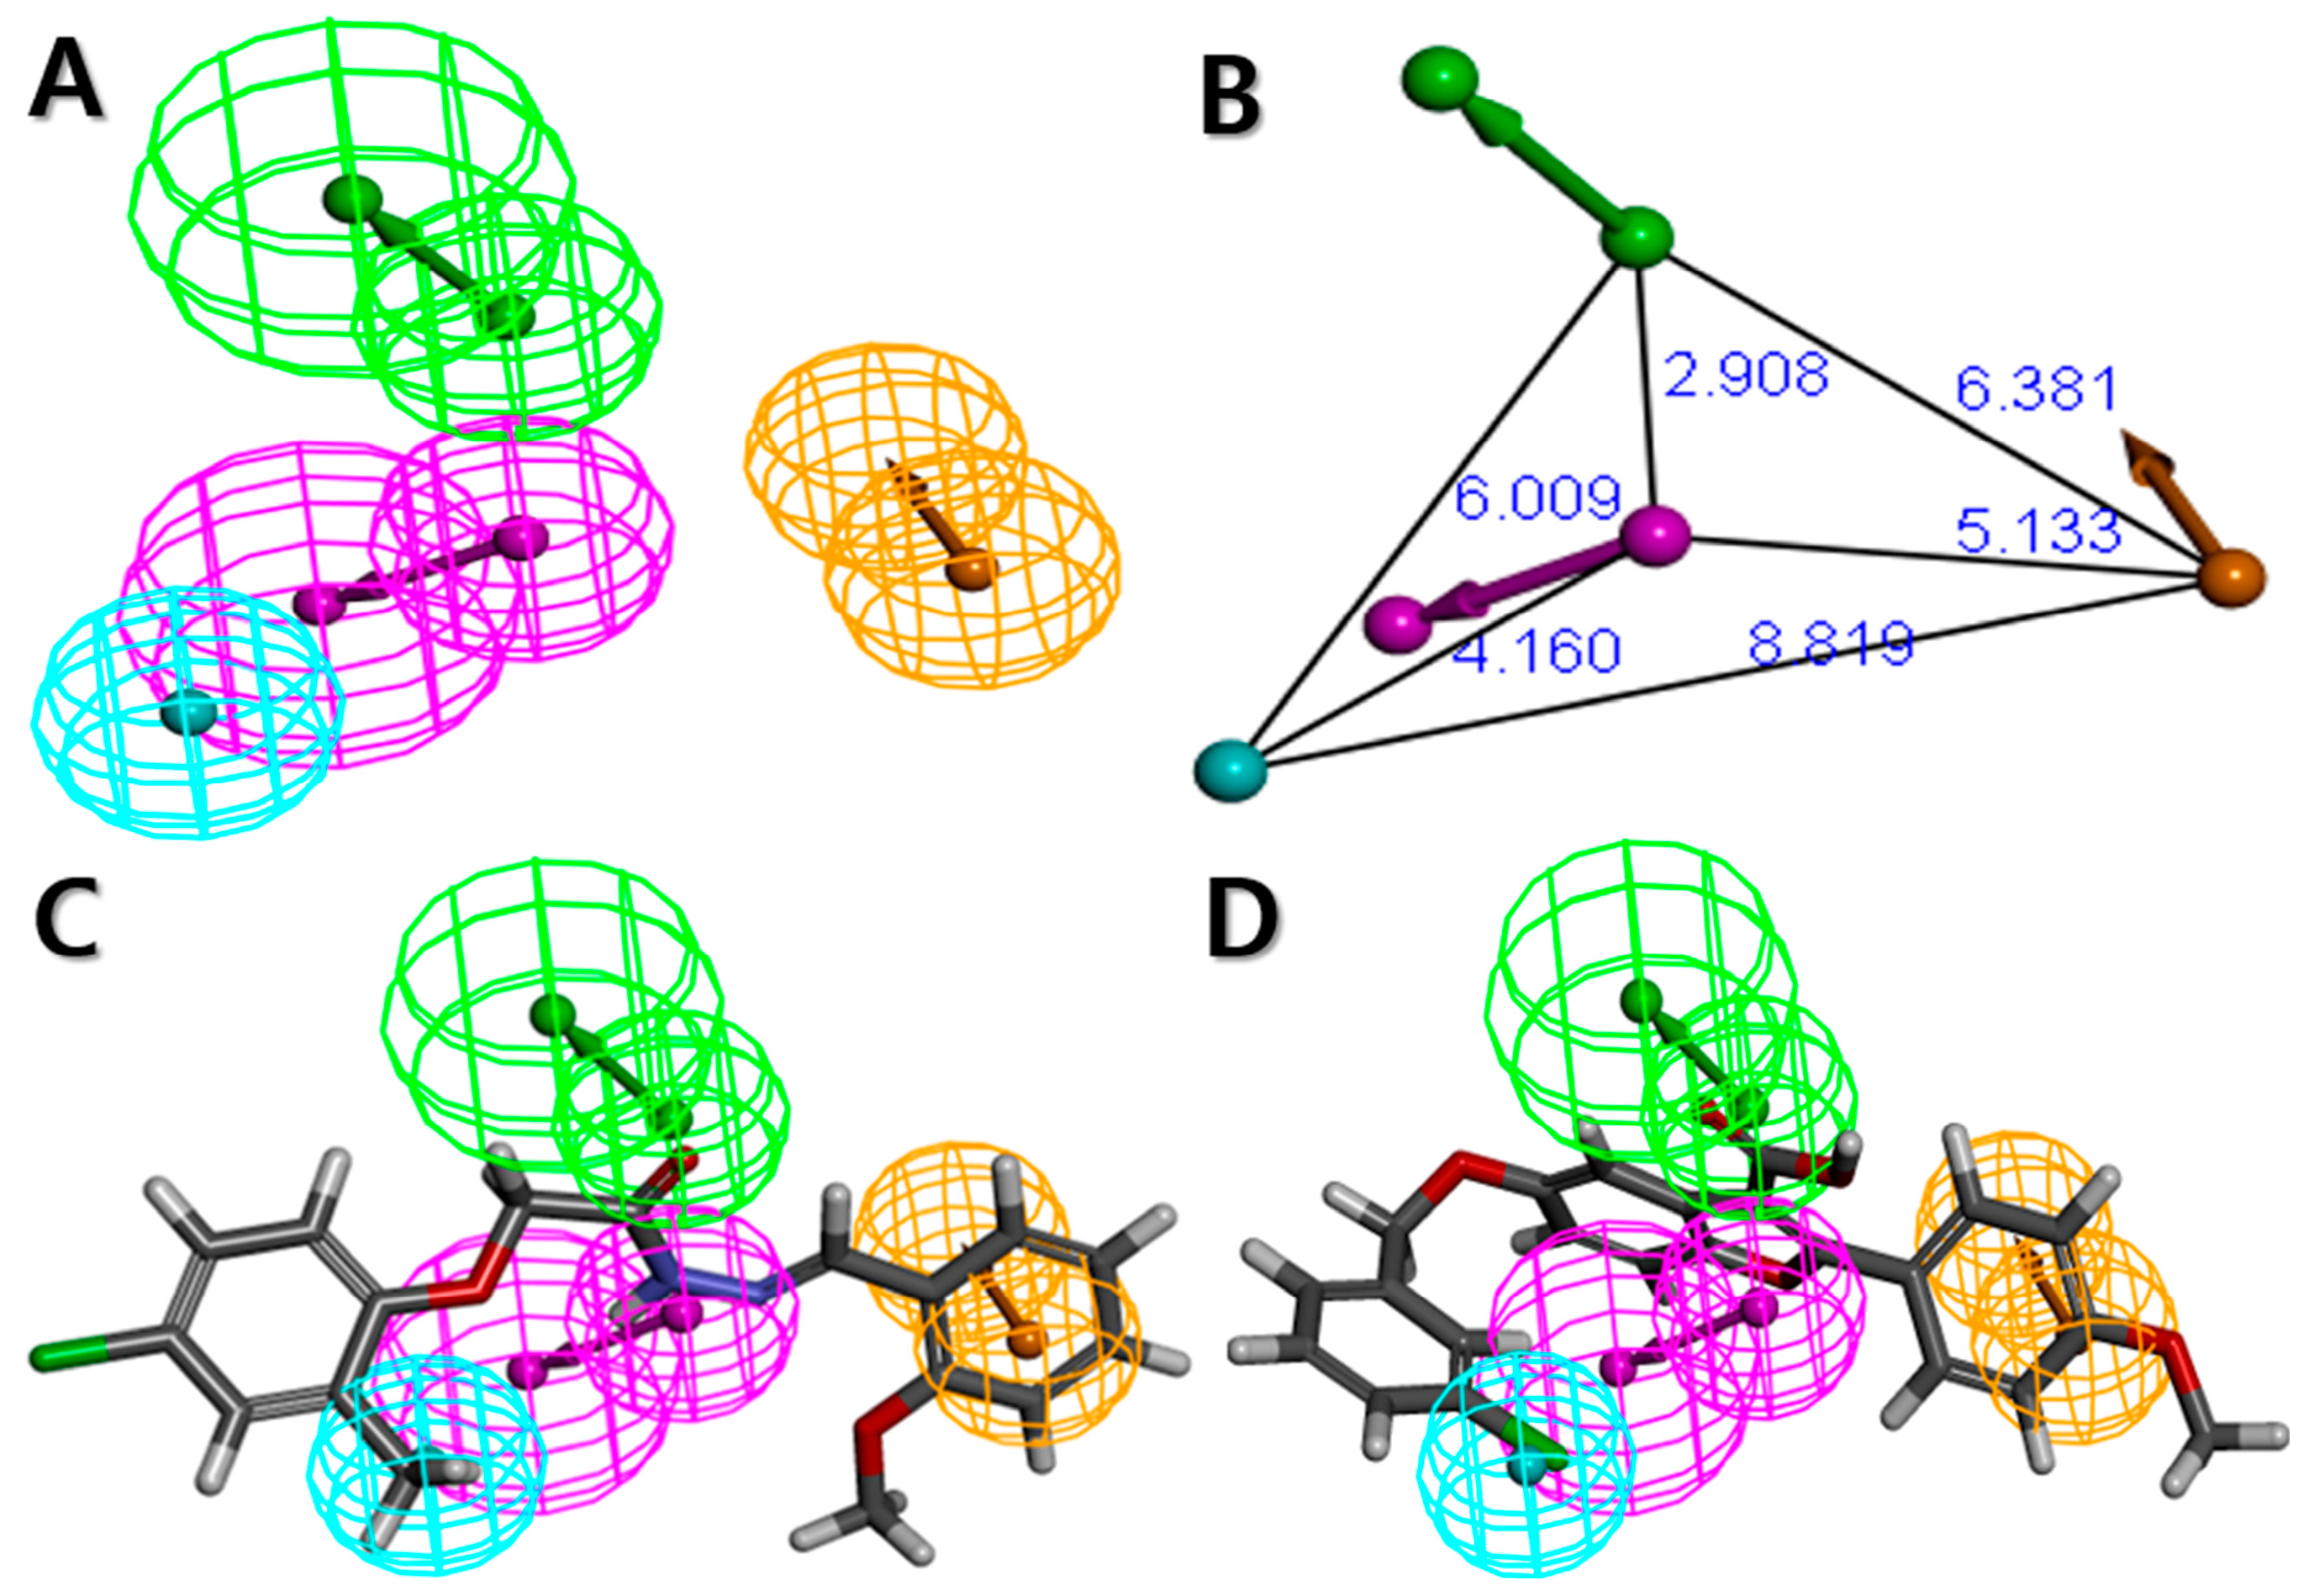
| Hypothesis | Total Cost | Cost Difference a | RMSD | Correlation (r2training) | Correlation (r2test) | Features b |
|---|---|---|---|---|---|---|
| Hypo1 | 70.969 | 123.64 | 0.846 | 0.975 | 0.750 | HBA, HBD, HY, RA |
| Hypo2 | 73.604 | 121.00 | 0.946 | 0.969 | 0.909 | HBA, HBD, HY, RA |
| Hypo3 | 80.233 | 114.37 | 1.259 | 0.945 | 0608 | HBA, HBA, HY, RA |
| Hypo4 | 81.841 | 112.77 | 1.324 | 0.939 | 0.441 | HBA, HBD, HY, RA |
| Hypo5 | 83.504 | 111.10 | 1.400 | 0.931 | 0.362 | HBA, HBD, HY, RA |
| Hypo6 | 85.290 | 109.32 | 1.466 | 0.924 | 0.449 | HBA, HBD, HY, RA |
| Hypo7 | 85.999 | 108.61 | 1.444 | 0.927 | 0.413 | HBA, HBD, HY, RA |
| Hypo8 | 86.400 | 108.21 | 1.503 | 0.920 | 0.702 | HBD, HY, RA |
| Hypo9 | 86.982 | 107.63 | 1.482 | 0.923 | 0.634 | HBA, HBD, HY, RA |
| Hypo10 | 87.091 | 107.52 | 1.436 | 0.927 | 0.584 | HBA, HBD, HY, RA |
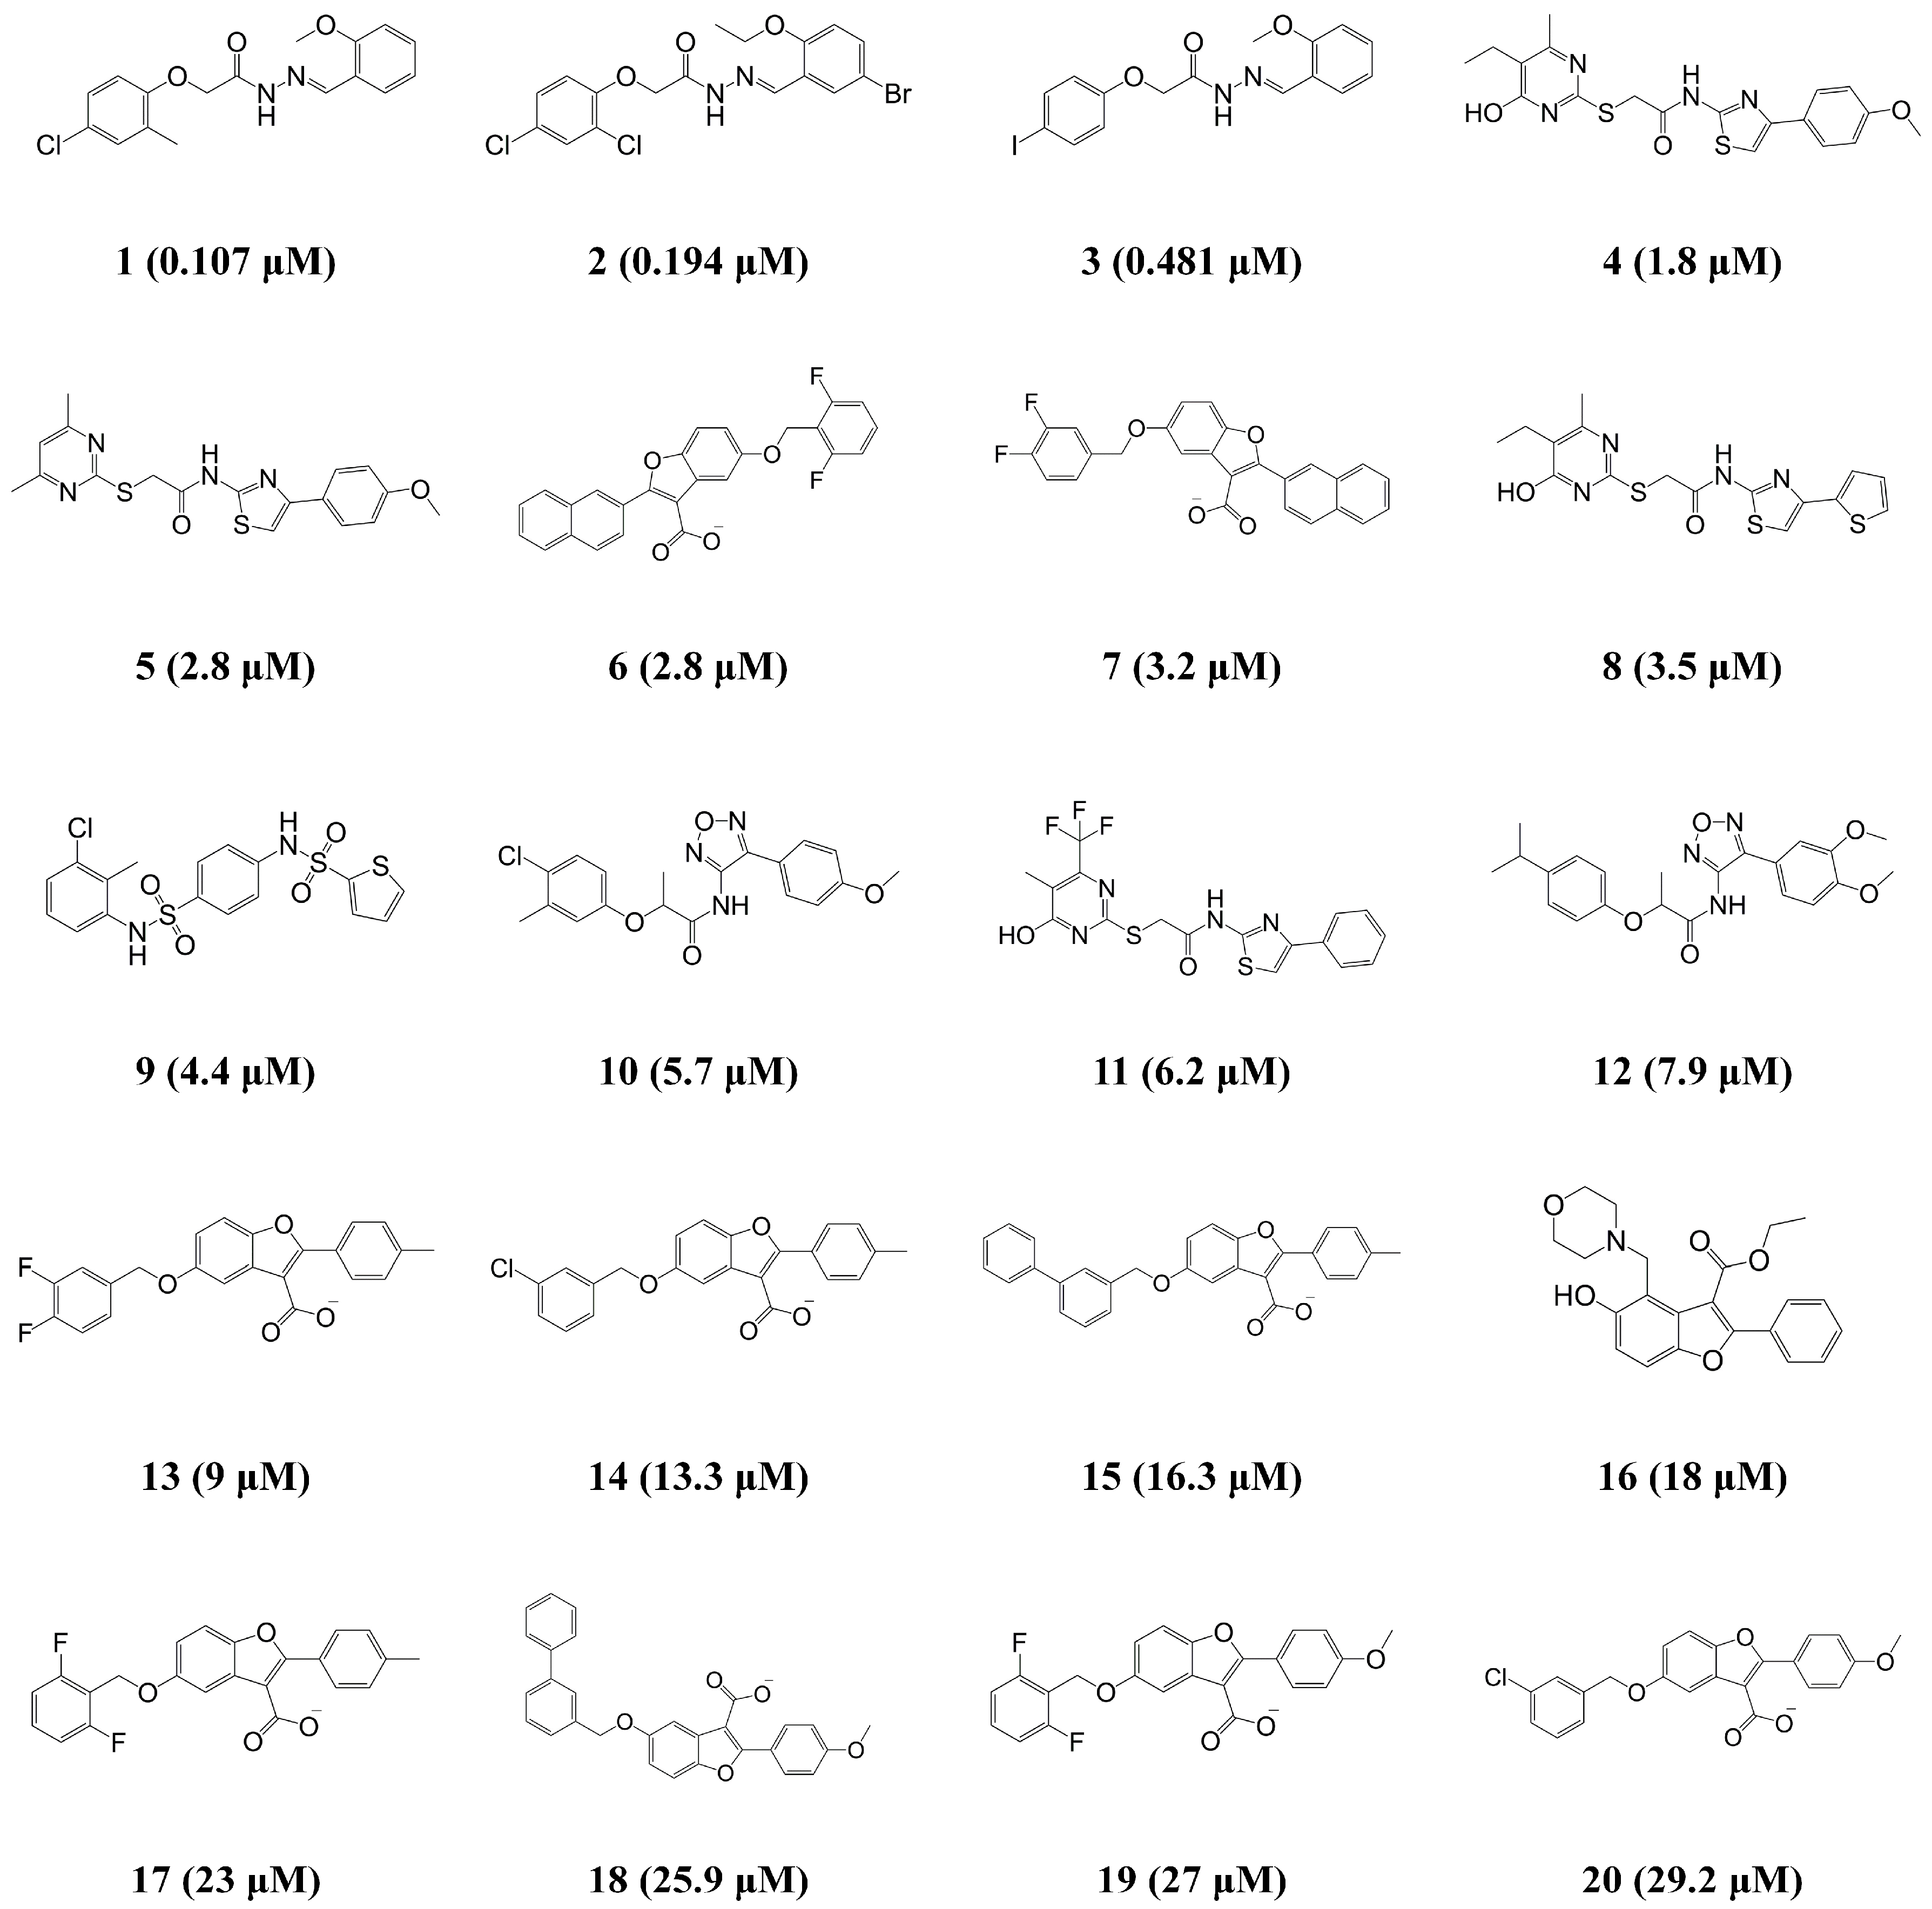
| Compound | IC50 (μM) | Error b | Activity Scale c | ||
|---|---|---|---|---|---|
| Experimental a | Estimated | Experimental | Estimated | ||
| 1 | 0.107 | 0.128 | +1.2 | ++++ | ++++ |
| 2 | 0.194 | 0.119 | −1.6 | ++++ | ++++ |
| 3 | 0.481 | 0.511 | +1.1 | ++++ | ++++ |
| 4 | 1.8 | 2.8 | +1.6 | +++ | +++ |
| 5 | 2.8 | 5.9 | +2.1 | +++ | +++ |
| 6 | 2.8 | 2.8 | −1 | +++ | +++ |
| 7 | 3.2 | 5.9 | +1.8 | +++ | +++ |
| 8 | 3.5 | 3.9 | +1.1 | +++ | +++ |
| 9 | 4.4 | 6.7 | +1.5 | +++ | +++ |
| 10 | 5.7 | 5.5 | −1 | +++ | +++ |
| 11 | 6.2 | 5 | −1.2 | +++ | +++ |
| 12 | 7.9 | 6.1 | −1.3 | +++ | +++ |
| 13 | 9 | 9.6 | +1.1 | ++ | ++ |
| 14 | 13.3 | 9.2 | −1.4 | ++ | ++ |
| 15 | 16.3 | 9.4 | −1.7 | ++ | ++ |
| 16 | 18 | 21.3 | +1.2 | + | + |
| 17 | 23 | 9.2 | −2.5 | + | ++ |
| 18 | 25.9 | 26.7 | +1 | + | + |
| 19 | 27 | 31.8 | +1.2 | + | + |
| 20 | 29.2 | 26.6 | −1.1 | + | + |
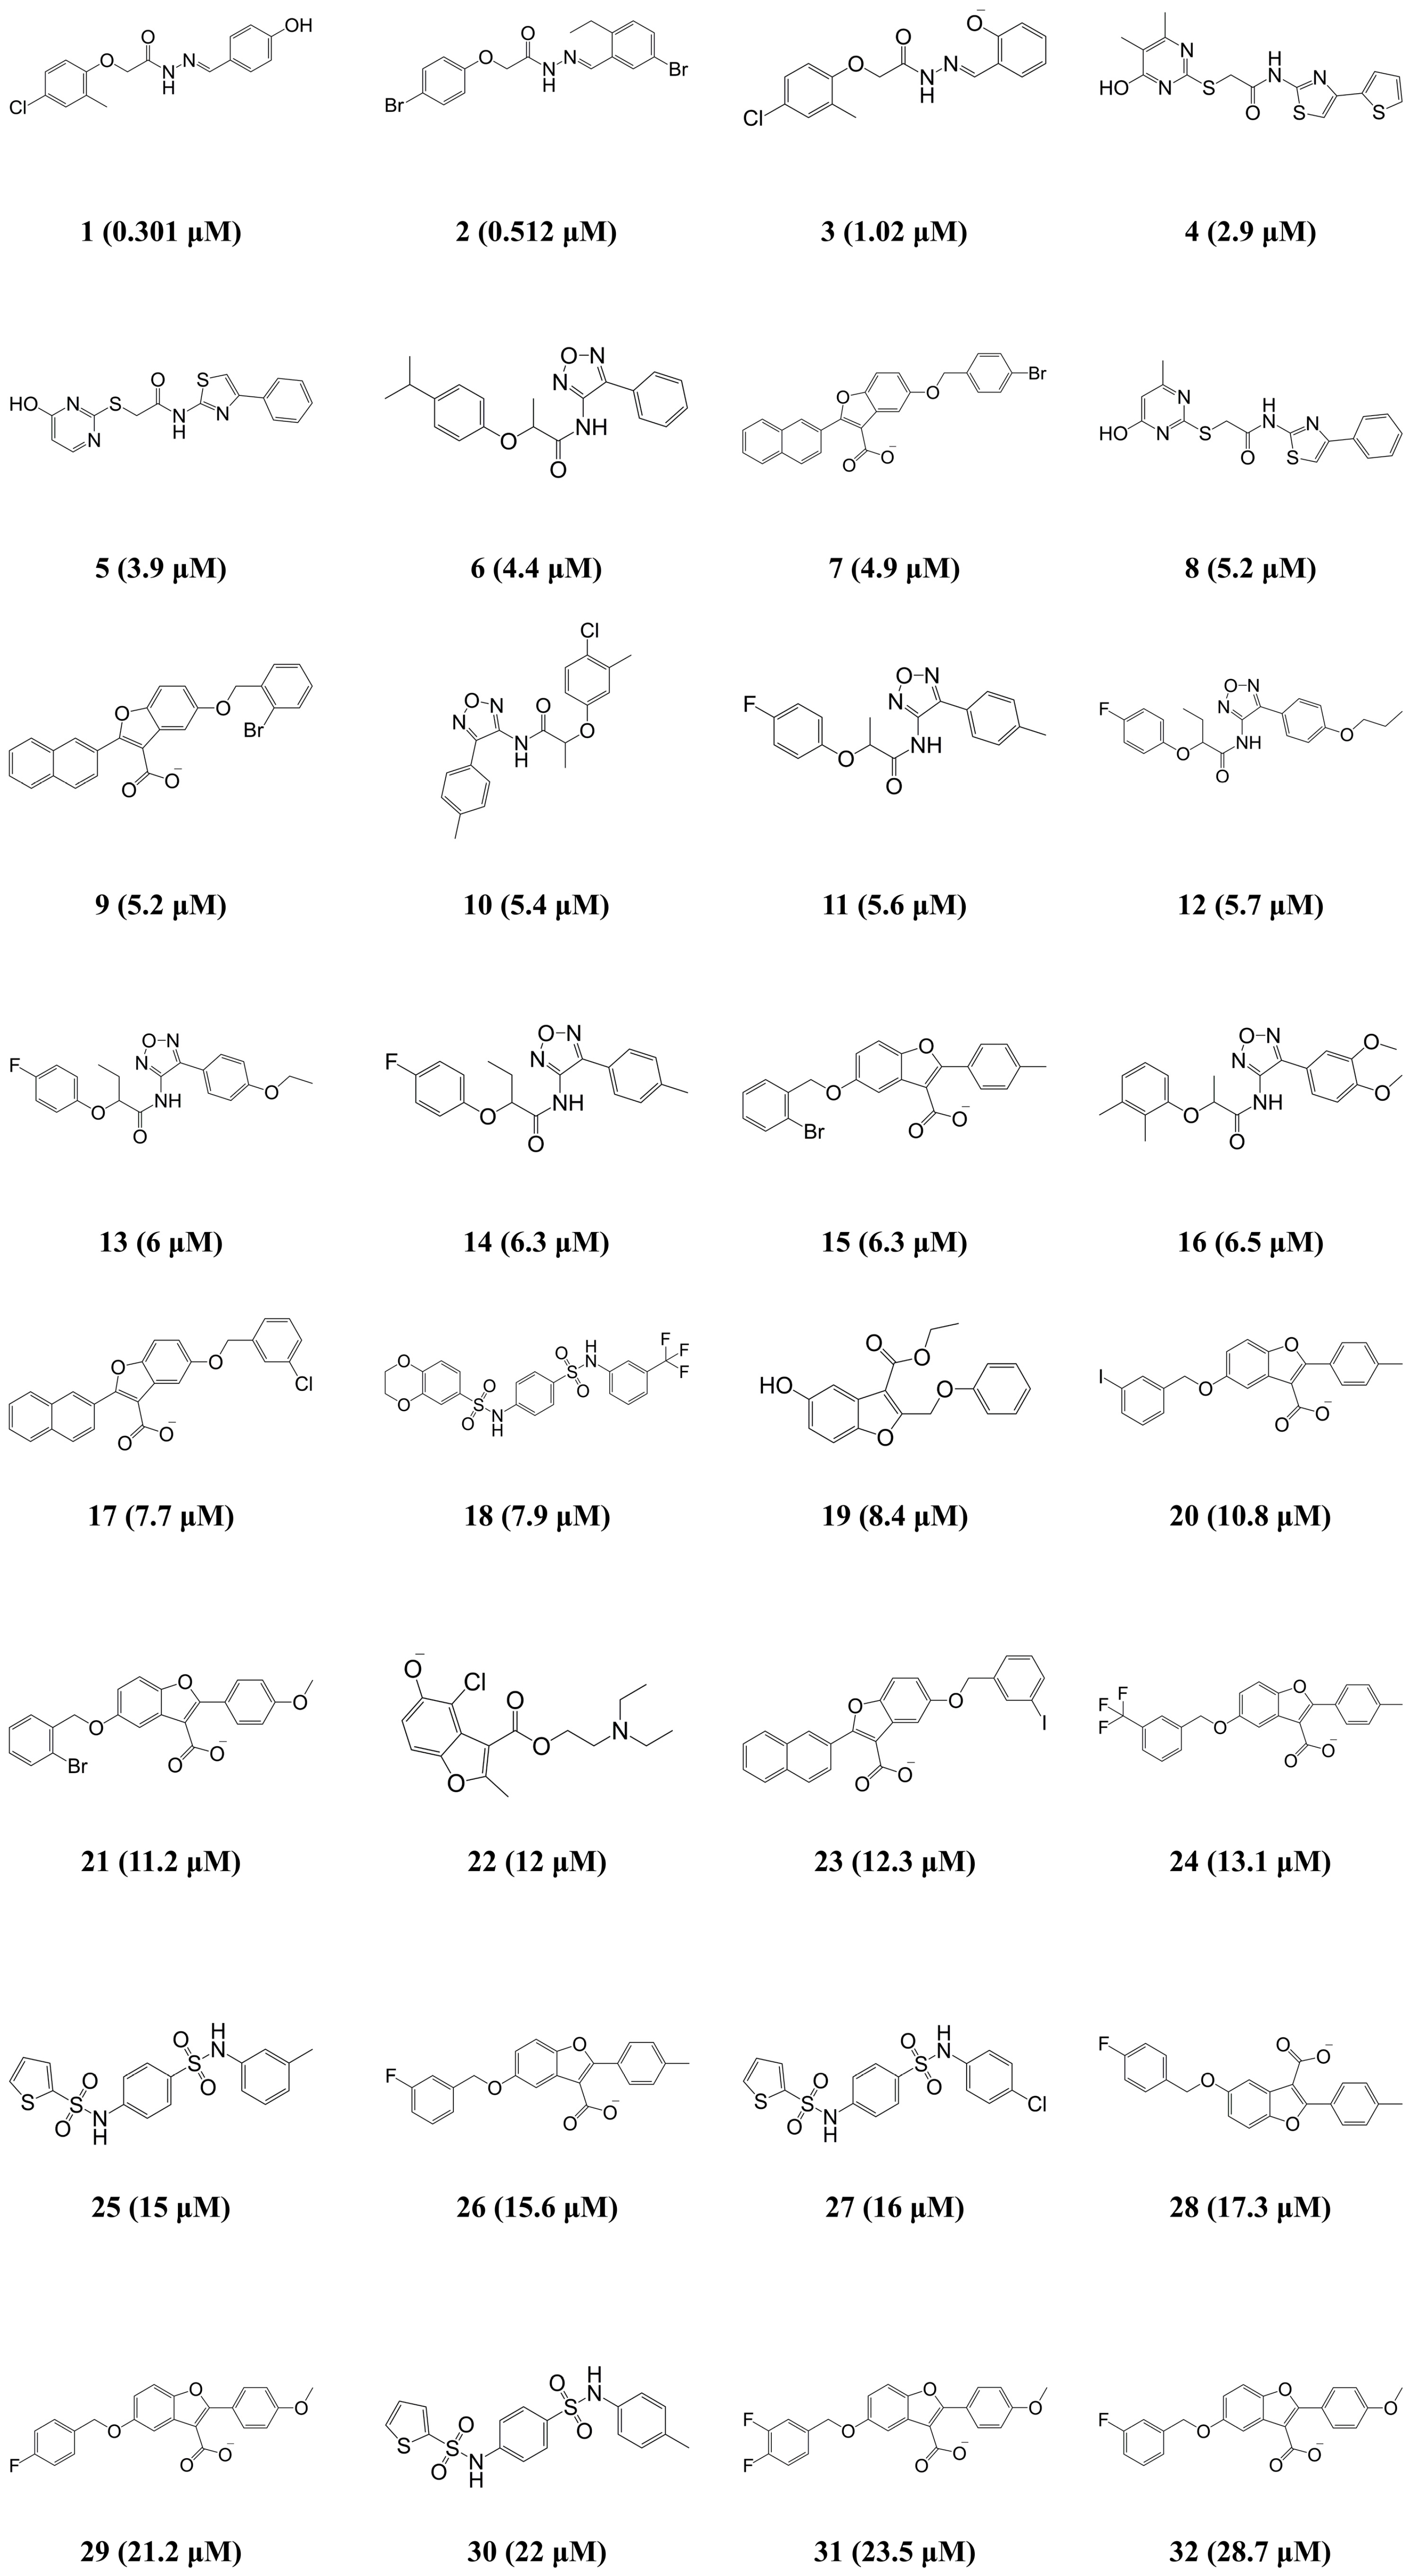
| Compound | IC50 (μM) | Error b | Activity Scale c | ||
|---|---|---|---|---|---|
| Experimental a | Estimated | Experimental | Estimated | ||
| 1 | 0.301 | 0.111 | −2.7 | ++++ | ++++ |
| 2 | 0.512 | 0.195 | −2.6 | ++++ | ++++ |
| 3 | 1.02 | 0.399 | −2.6 | +++ | ++++ |
| 4 | 2.9 | 3.3 | +1.1 | +++ | +++ |
| 5 | 3.9 | 3.6 | −1.1 | +++ | +++ |
| 6 | 4.4 | 5.7 | +1.3 | +++ | +++ |
| 7 | 4.9 | 6.7 | +1.4 | +++ | +++ |
| 8 | 5.2 | 3.2 | −1.6 | +++ | +++ |
| 9 | 5.2 | 6.4 | +1.2 | +++ | +++ |
| 10 | 5.4 | 4.4 | −1.2 | +++ | +++ |
| 11 | 5.6 | 6.7 | +1.2 | +++ | +++ |
| 12 | 5.7 | 4.4 | −1.3 | +++ | +++ |
| 13 | 6 | 4.9 | −1.2 | +++ | +++ |
| 14 | 6.3 | 5.6 | −1.1 | +++ | +++ |
| 15 | 6.3 | 9.2 | +1.5 | +++ | ++ |
| 16 | 6.5 | 3.3 | −2 | +++ | +++ |
| 17 | 7.7 | 6.6 | −1.2 | +++ | +++ |
| 18 | 7.9 | 7.9 | −1 | +++ | +++ |
| 19 | 8.4 | 10.6 | +1.3 | ++ | ++ |
| 20 | 10.8 | 9.5 | −1.1 | ++ | ++ |
| 21 | 11.2 | 13.3 | +1.2 | ++ | ++ |
| 22 | 12 | 6.1 | −2 | ++ | +++ |
| 23 | 12.3 | 6.6 | −1.9 | ++ | +++ |
| 24 | 13.1 | 9.1 | −1.4 | ++ | ++ |
| 25 | 15 | 11 | −1.4 | ++ | ++ |
| 26 | 15.6 | 9.3 | −1.7 | ++ | ++ |
| 27 | 16 | 14.5 | −1.1 | ++ | ++ |
| 28 | 17.3 | 9.7 | −1.8 | ++ | ++ |
| 29 | 21.2 | 28.4 | +1.3 | + | + |
| 30 | 22 | 11.4 | −1.9 | + | ++ |
| 31 | 23.5 | 31.4 | +1.3 | + | + |
| 32 | 28.7 | 31.3 | +1.1 | + | + |
| Compound | Structure | Fit Value | Estimate (μM) | Libdock Score |
|---|---|---|---|---|
| ZINC8643627 |  | 6.29 | 0.052 | 162.29 |
| ZINC225516955 |  | 6.04 | 0.092 | 160.92 |
© 2018 by the authors. Licensee MDPI, Basel, Switzerland. This article is an open access article distributed under the terms and conditions of the Creative Commons Attribution (CC BY) license (http://creativecommons.org/licenses/by/4.0/).
Share and Cite
Lee, Y.H.; Yi, G.-S. Prediction of Novel Anoctamin1 (ANO1) Inhibitors Using 3D-QSAR Pharmacophore Modeling and Molecular Docking. Int. J. Mol. Sci. 2018, 19, 3204. https://doi.org/10.3390/ijms19103204
Lee YH, Yi G-S. Prediction of Novel Anoctamin1 (ANO1) Inhibitors Using 3D-QSAR Pharmacophore Modeling and Molecular Docking. International Journal of Molecular Sciences. 2018; 19(10):3204. https://doi.org/10.3390/ijms19103204
Chicago/Turabian StyleLee, Yoon Hyeok, and Gwan-Su Yi. 2018. "Prediction of Novel Anoctamin1 (ANO1) Inhibitors Using 3D-QSAR Pharmacophore Modeling and Molecular Docking" International Journal of Molecular Sciences 19, no. 10: 3204. https://doi.org/10.3390/ijms19103204
APA StyleLee, Y. H., & Yi, G.-S. (2018). Prediction of Novel Anoctamin1 (ANO1) Inhibitors Using 3D-QSAR Pharmacophore Modeling and Molecular Docking. International Journal of Molecular Sciences, 19(10), 3204. https://doi.org/10.3390/ijms19103204