Deprotonation Mechanism of Methyl Gallate: UV Spectroscopic and Computational Studies

Abstract
:1. Introduction
2. Results and Discussion
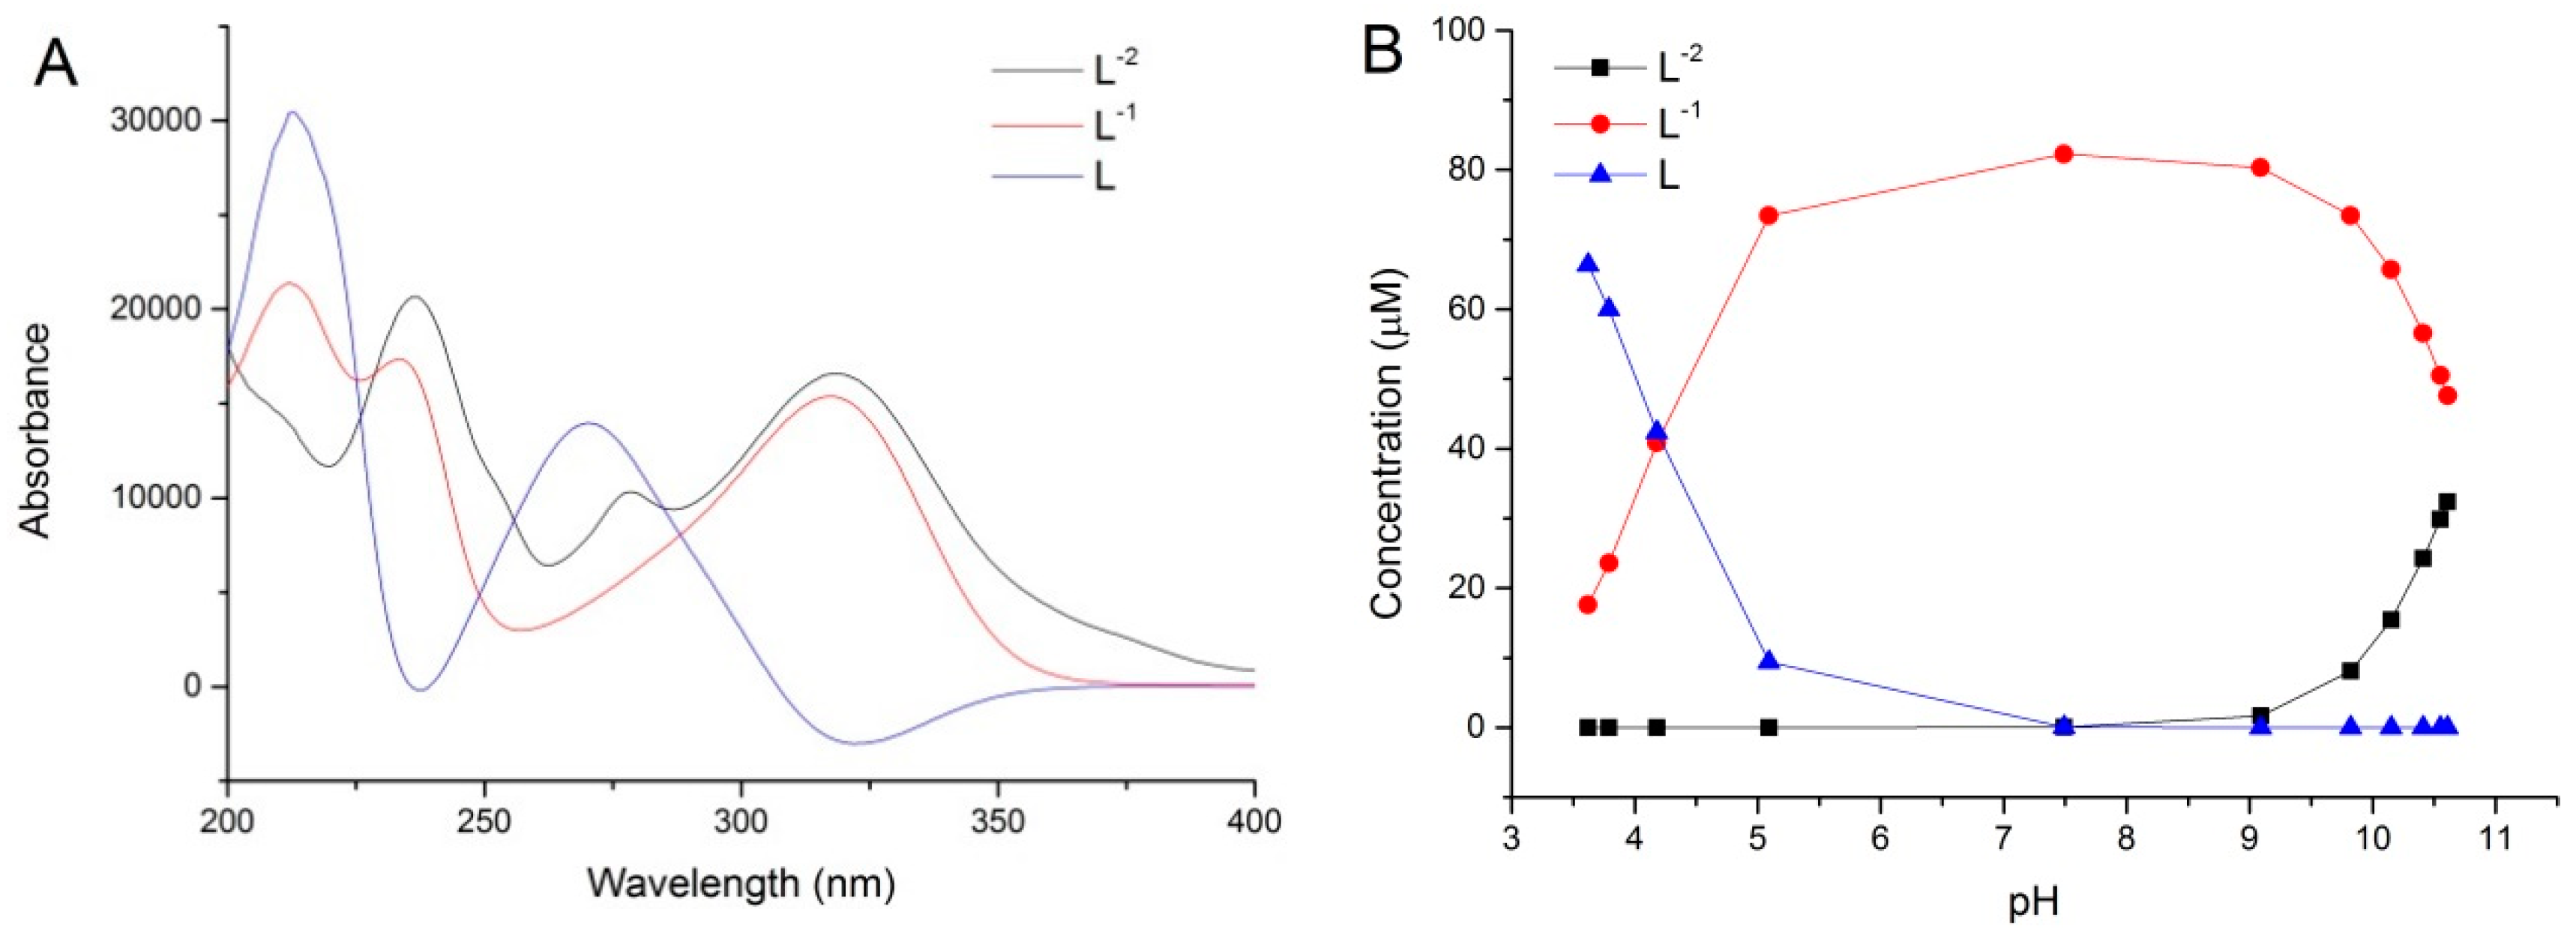
2.1. pH Titration Study
2.2. Computational Study
2.3. Calculation of pKa Values
2.4. Chemometric Modeling Study
3. Materials and Methods
3.1. Chemicals
3.2. Instrumentation
3.3. pH Titrations
3.4. Computational Method
4. Conclusions
Supplementary Materials
Author Contributions
Funding
Acknowledgments
Conflicts of Interest
Abbreviations
| MeG | Methyl gallate |
| TD-DFT | Time-dependent density functional theory |
| pKa | Acid dissociation constant |
References
- Hider, R.C.; Liu, Z.D.; Khodr, H.H. Metal chelation of polyphenols. Methods Enzymol. 2001, 335, 190–203. [Google Scholar] [PubMed]
- Bloomfield, C. The possible significance of polyphenols in soil formation. J. Sci. Food Agric. 1957, 8, 389–392. [Google Scholar] [CrossRef]
- Khokhar, S.; Apenten, R.K.O. Iron binding characteristics of phenolic compounds: Some tentative structure–activity relations. Food Chem. 2003, 81, 133–140. [Google Scholar] [CrossRef]
- Brune, M.; Rossander, L.; Hallberg, L. Iron absorption and phenolic compounds: Importance of different phenolic structures. Eur. J. Clin. Nutr. 1989, 43, 547–557. [Google Scholar] [PubMed]
- Rice-Evans, C.A.; Miller, N.J.; Paganga, G. Structure-antioxidant activity relationships of flavonoids and phenolic acids. Free Radic. Biol. Med. 1996, 20, 933–956. [Google Scholar] [CrossRef]
- Cornard, J.P.; Lapouge, C. Theoretical and spectroscopic investigations of a complex of Al(III) with caffeic acid. J. Phys. Chem. A 2004, 108, 4470–4478. [Google Scholar] [CrossRef]
- Boudet, A.C.; Cornard, J.P.; Merlin, J.C. Conformational and spectroscopic investigation of 3-hydroxyflavone–aluminium chelates. Spectrochim. Acta A Mol. Biomol. Spectrosc. 2000, 56, 829–839. [Google Scholar] [CrossRef]
- Le Person, A.; Moncomble, A.L.; Cornard, J.P. The complexation of Al(III), Pb(II), and Cu(II) metal ions by esculetin: A spectroscopic and theoretical approach. J. Phys. Chem. A 2014, 118, 2646–2655. [Google Scholar] [CrossRef] [PubMed]
- Cornard, J.P.; Boudet, A.C.; Merlin, J.C. Complexes of Al(III) with 3′4′-dihydroxy-flavone: Characterization, theoretical and spectroscopic study. Spectrochim. Acta A Mol. Biomol. Spectrosc. 2001, 57, 591–602. [Google Scholar] [CrossRef]
- Siddiqi, K.; Bano, S.; Mohd, A.; Khan, A.A.P. Binding interaction of captopril with metal ions: A fluorescence quenching study. Chin. J. Chem. 2009, 27, 1755–1761. [Google Scholar] [CrossRef]
- Andjelković, M.; van Camp, J.; de Meulenaer, B.; Depaemelaere, G.; Socaciu, C.; Verloo, M.; Verhe, R. Iron-chelation properties of phenolic acids bearing catechol and galloyl groups. Food Chem. 2006, 98, 23–31. [Google Scholar] [CrossRef]
- Zhang, L.; Liu, R.; Gung, B.W.; Tindall, S.; Gonzalez, J.M.; Halvorson, J.J.; Hagerman, A.E. Polyphenol-aluminum complex formation: Implications for aluminum tolerance in plants. J. Agric. Food Chem. 2016, 64, 3025–3033. [Google Scholar] [CrossRef] [PubMed]
- Perron, N.R.; Wang, H.C.; DeGuire, S.N.; Jenkins, M.; Lawson, M.; Brumaghim, J.L. Kinetics of iron oxidation upon polyphenol binding. Dalton Trans. 2010, 39, 9982–9987. [Google Scholar] [CrossRef] [PubMed]
- Tuominen, A.; Sundman, T. Stability and oxidation products of hydrolysable tannins in basic conditions detected by HPLC/DAD-ESI/QTOF/MS. Phytochem. Anal. 2013, 24, 424–435. [Google Scholar] [CrossRef] [PubMed]
- Dangles, O.; Elhabiri, M.; Brouillard, R. Kinetic and thermodynamic investigation of the aluminium-anthocyanin complexation in aqueous solution. J. Chem. Soc. Perkin Trans. 1994, 12, 2587–2596. [Google Scholar] [CrossRef]
- Elhabiri, M.; Figueiredo, P.; Toki, K.; Saito, N.; Brouillard, R. Anthocyanin-aluminium and -gallium complexes in aqueous solution. J. Chem. Soc. Perkin Trans. 1997, 2, 355–362. [Google Scholar] [CrossRef]
- Becke, A.D. Density-functional exchange-energy approximation with correct asymptotic behavior. Phys. Rev. A 1988, 38, 3098–3100. [Google Scholar] [CrossRef]
- Lee, C.; Yang, W.; Parr, R.G. Development of the colle-salvetti correlation-energy formula into a functional of the electron density. Phys. Rev. B Condens. Matter 1988, 37, 785–789. [Google Scholar] [CrossRef] [PubMed]
- Hay, P.J. Gaussian basis sets for molecular calculations. The representation of 3d orbitals in transition-metal atoms. J. Chem. Phys. 1977, 66, 4377–4384. [Google Scholar] [CrossRef]
- Marenich, A.V.; Cramer, C.J.; Truhlar, D.G. Universal solvation model based on solute electron density and on a continuum model of the solvent defined by the bulk dielectric constant and atomic surface tensions. J. Phys. Chem. B 2009, 113, 6378. [Google Scholar] [CrossRef] [PubMed]
- Mitri, N.D.; Monti, S.; Prampolini, G.; Barone, V. Absorption and emission spectra of a flexible dye in solution: A computational time-dependent approach. J. Chem. Theory Comput. 2013, 9, 4507–4516. [Google Scholar] [CrossRef] [PubMed]


| Considered Form | Wavelength (nm) | Transition Energy (eV) | Oscillator Strength |
|---|---|---|---|
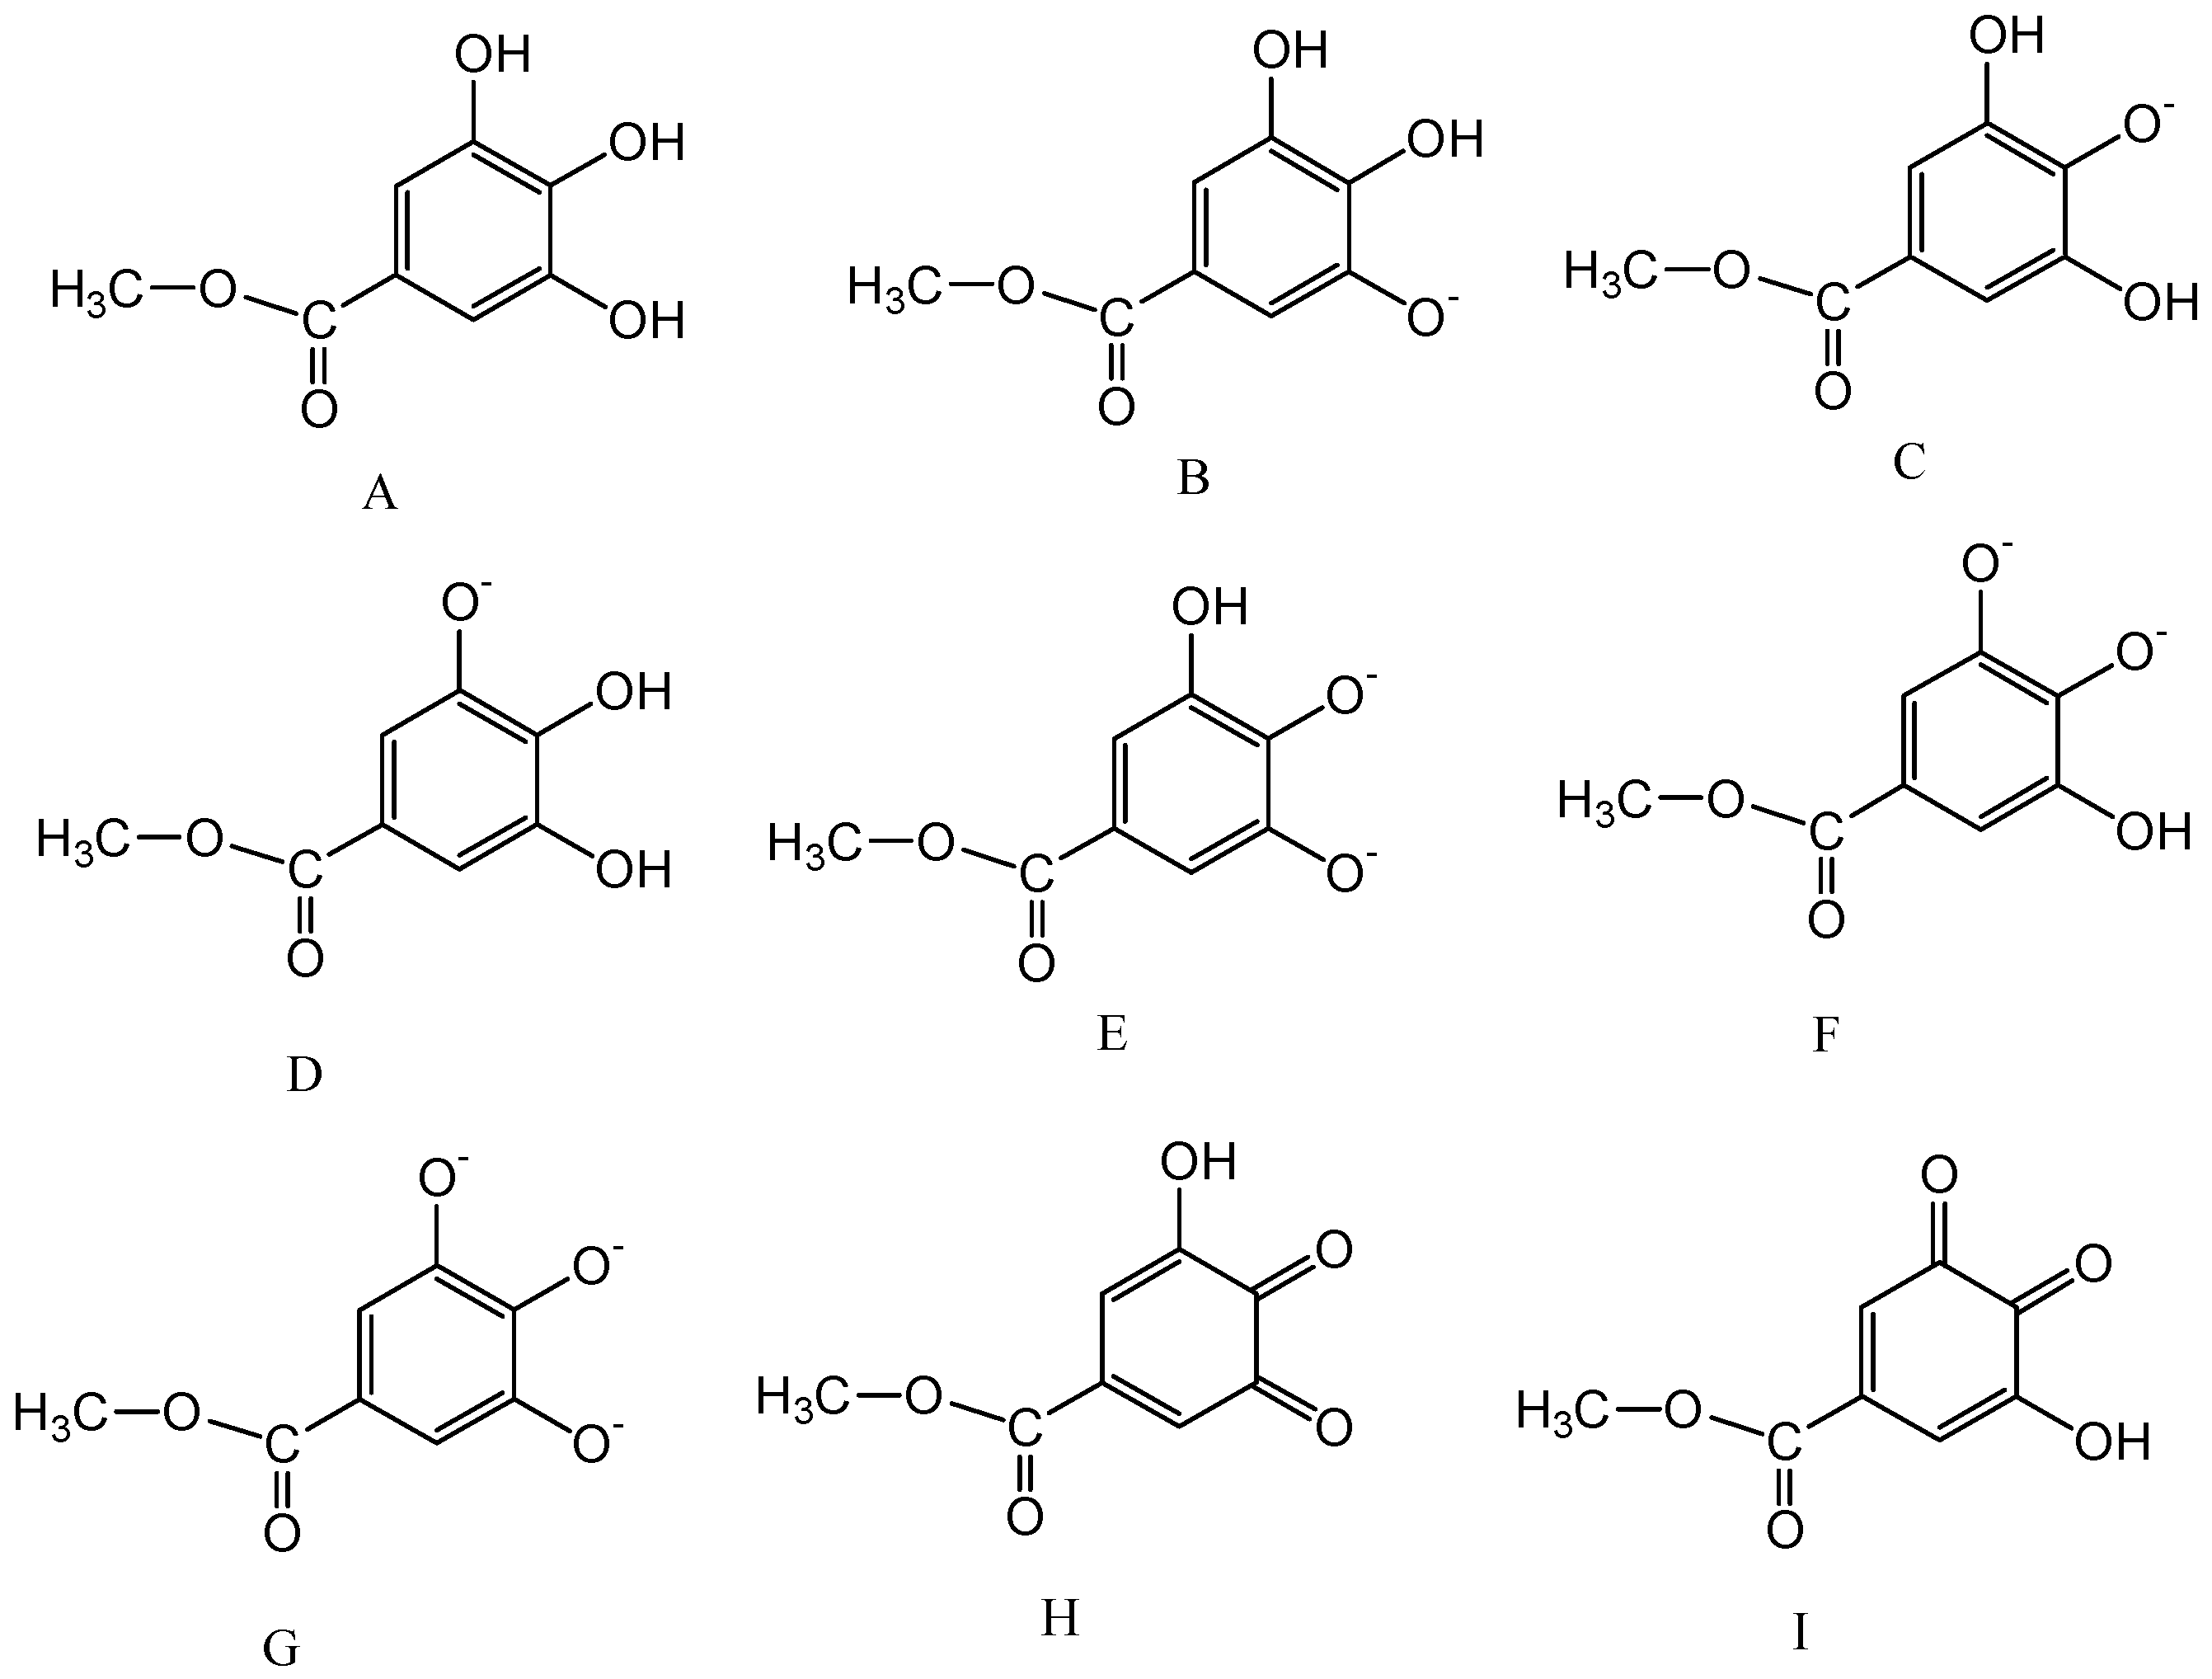
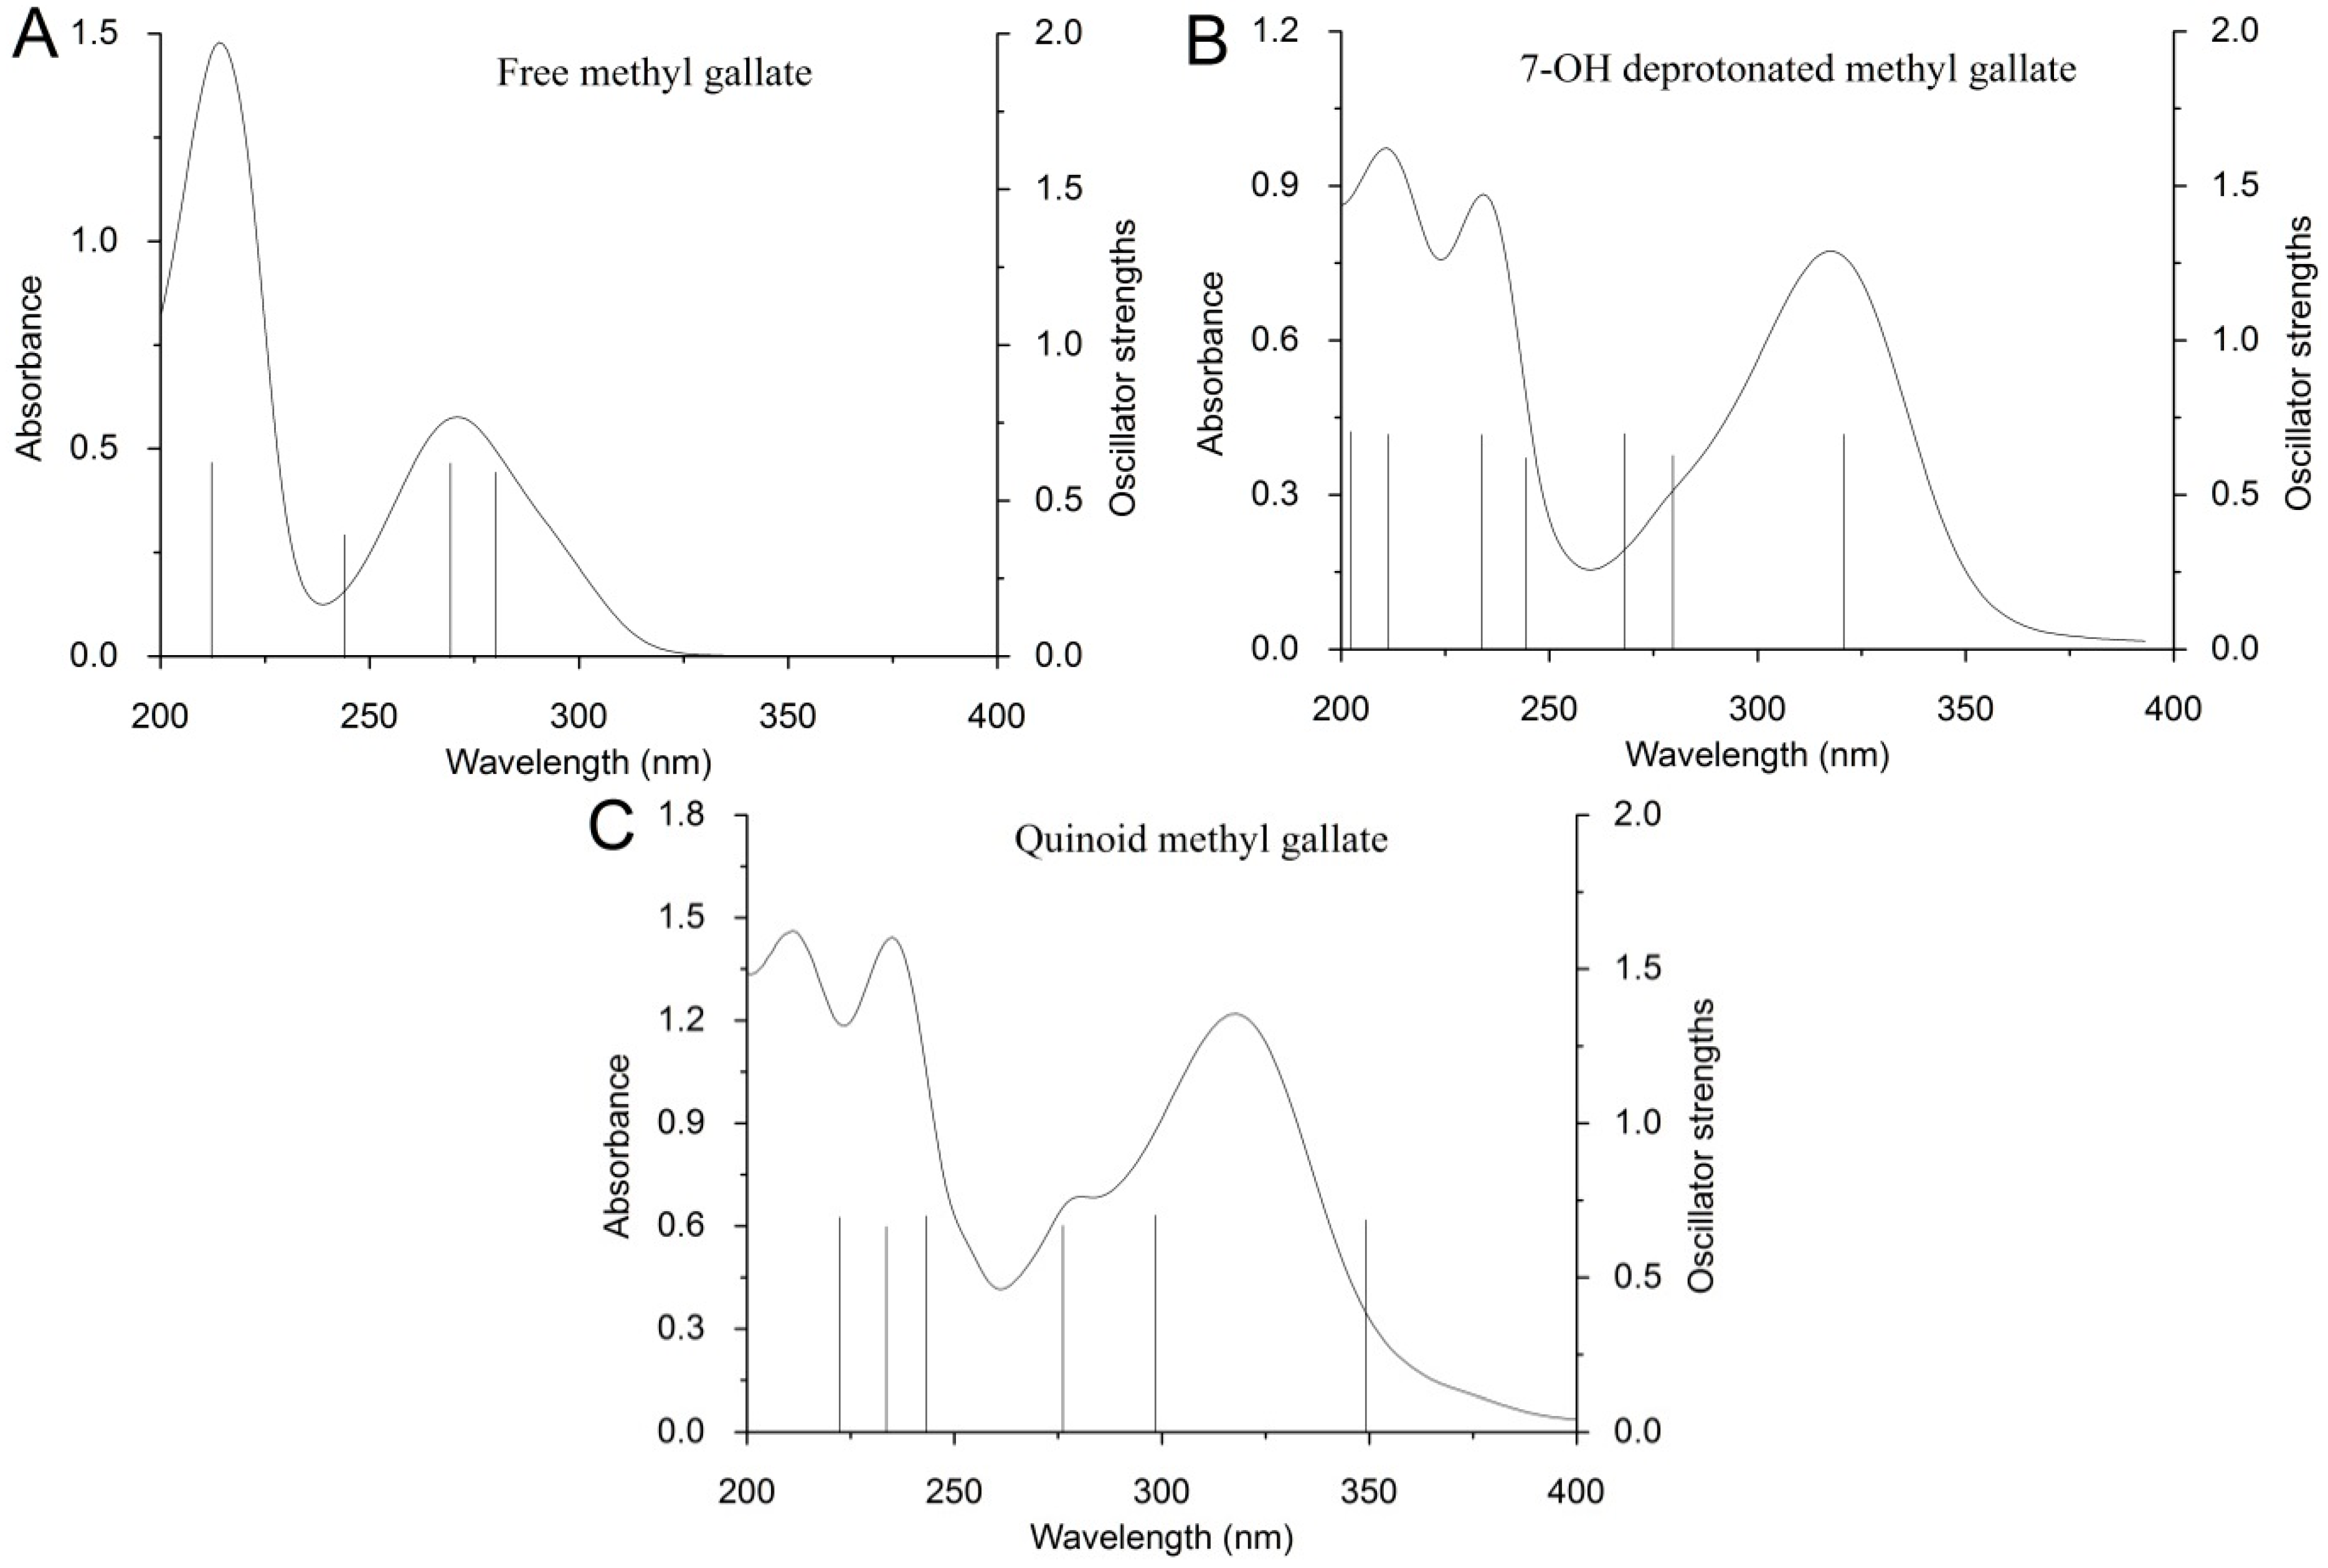
| MeG fully protonated, A | 279.84 | 4.4305 | 0.59652 |
| MeG 6-OH deprotonated, B | 392.35 | 3.16 | 0.70062 |
| MeG 7-OH deprotonated, C | 320.25 | 3.8715 | 0.69726 |
| MeG 8-OH deprotonated, D | 366.87 | 3.3795 | 0.6963 |
| MeG 6,7-OH deprotonated, E | 429.8 | 2.8847 | 0.68639 |
| MeG 7,8-OH deprotonated, F | 419.25 | 2.9573 | 0.68916 |
| MeG fully deprotonated, G | 430.4 | 2.8807 | 0.707 |
| Oxidate MeG, H | 429.76 | 2.8849 | 0.68639 |
| Oxidate MeG, I | 423.56 | 2.9272 | 0.68758 |
© 2018 by the authors. Licensee MDPI, Basel, Switzerland. This article is an open access article distributed under the terms and conditions of the Creative Commons Attribution (CC BY) license (http://creativecommons.org/licenses/by/4.0/).
Share and Cite
Zhang, L.; Liu, Y.; Wang, Y. Deprotonation Mechanism of Methyl Gallate: UV Spectroscopic and Computational Studies. Int. J. Mol. Sci. 2018, 19, 3111. https://doi.org/10.3390/ijms19103111
Zhang L, Liu Y, Wang Y. Deprotonation Mechanism of Methyl Gallate: UV Spectroscopic and Computational Studies. International Journal of Molecular Sciences. 2018; 19(10):3111. https://doi.org/10.3390/ijms19103111
Chicago/Turabian StyleZhang, Liangliang, Yuchen Liu, and Yongmei Wang. 2018. "Deprotonation Mechanism of Methyl Gallate: UV Spectroscopic and Computational Studies" International Journal of Molecular Sciences 19, no. 10: 3111. https://doi.org/10.3390/ijms19103111
APA StyleZhang, L., Liu, Y., & Wang, Y. (2018). Deprotonation Mechanism of Methyl Gallate: UV Spectroscopic and Computational Studies. International Journal of Molecular Sciences, 19(10), 3111. https://doi.org/10.3390/ijms19103111