
A Genomics-Based Model for Prediction of Severe Bioprosthetic Mitral Valve Calcification

Abstract
:
1. Introduction
2. Results
3. Discussion
4. Materials and Methods
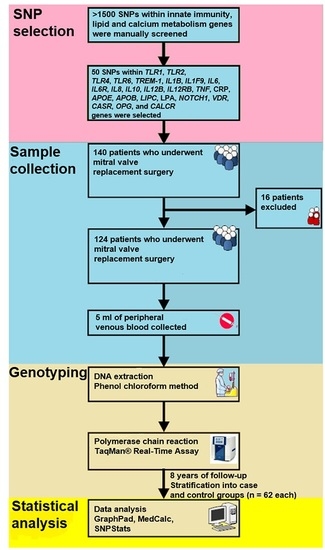
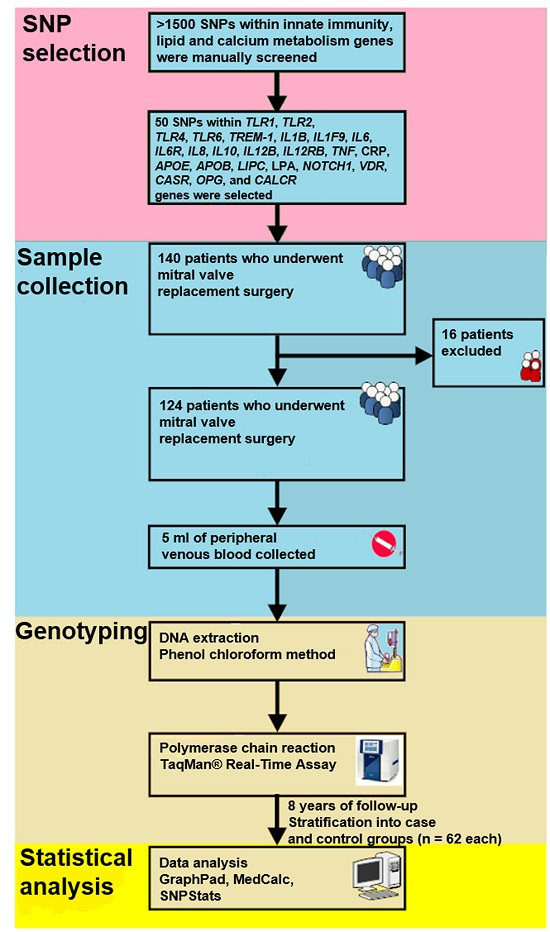
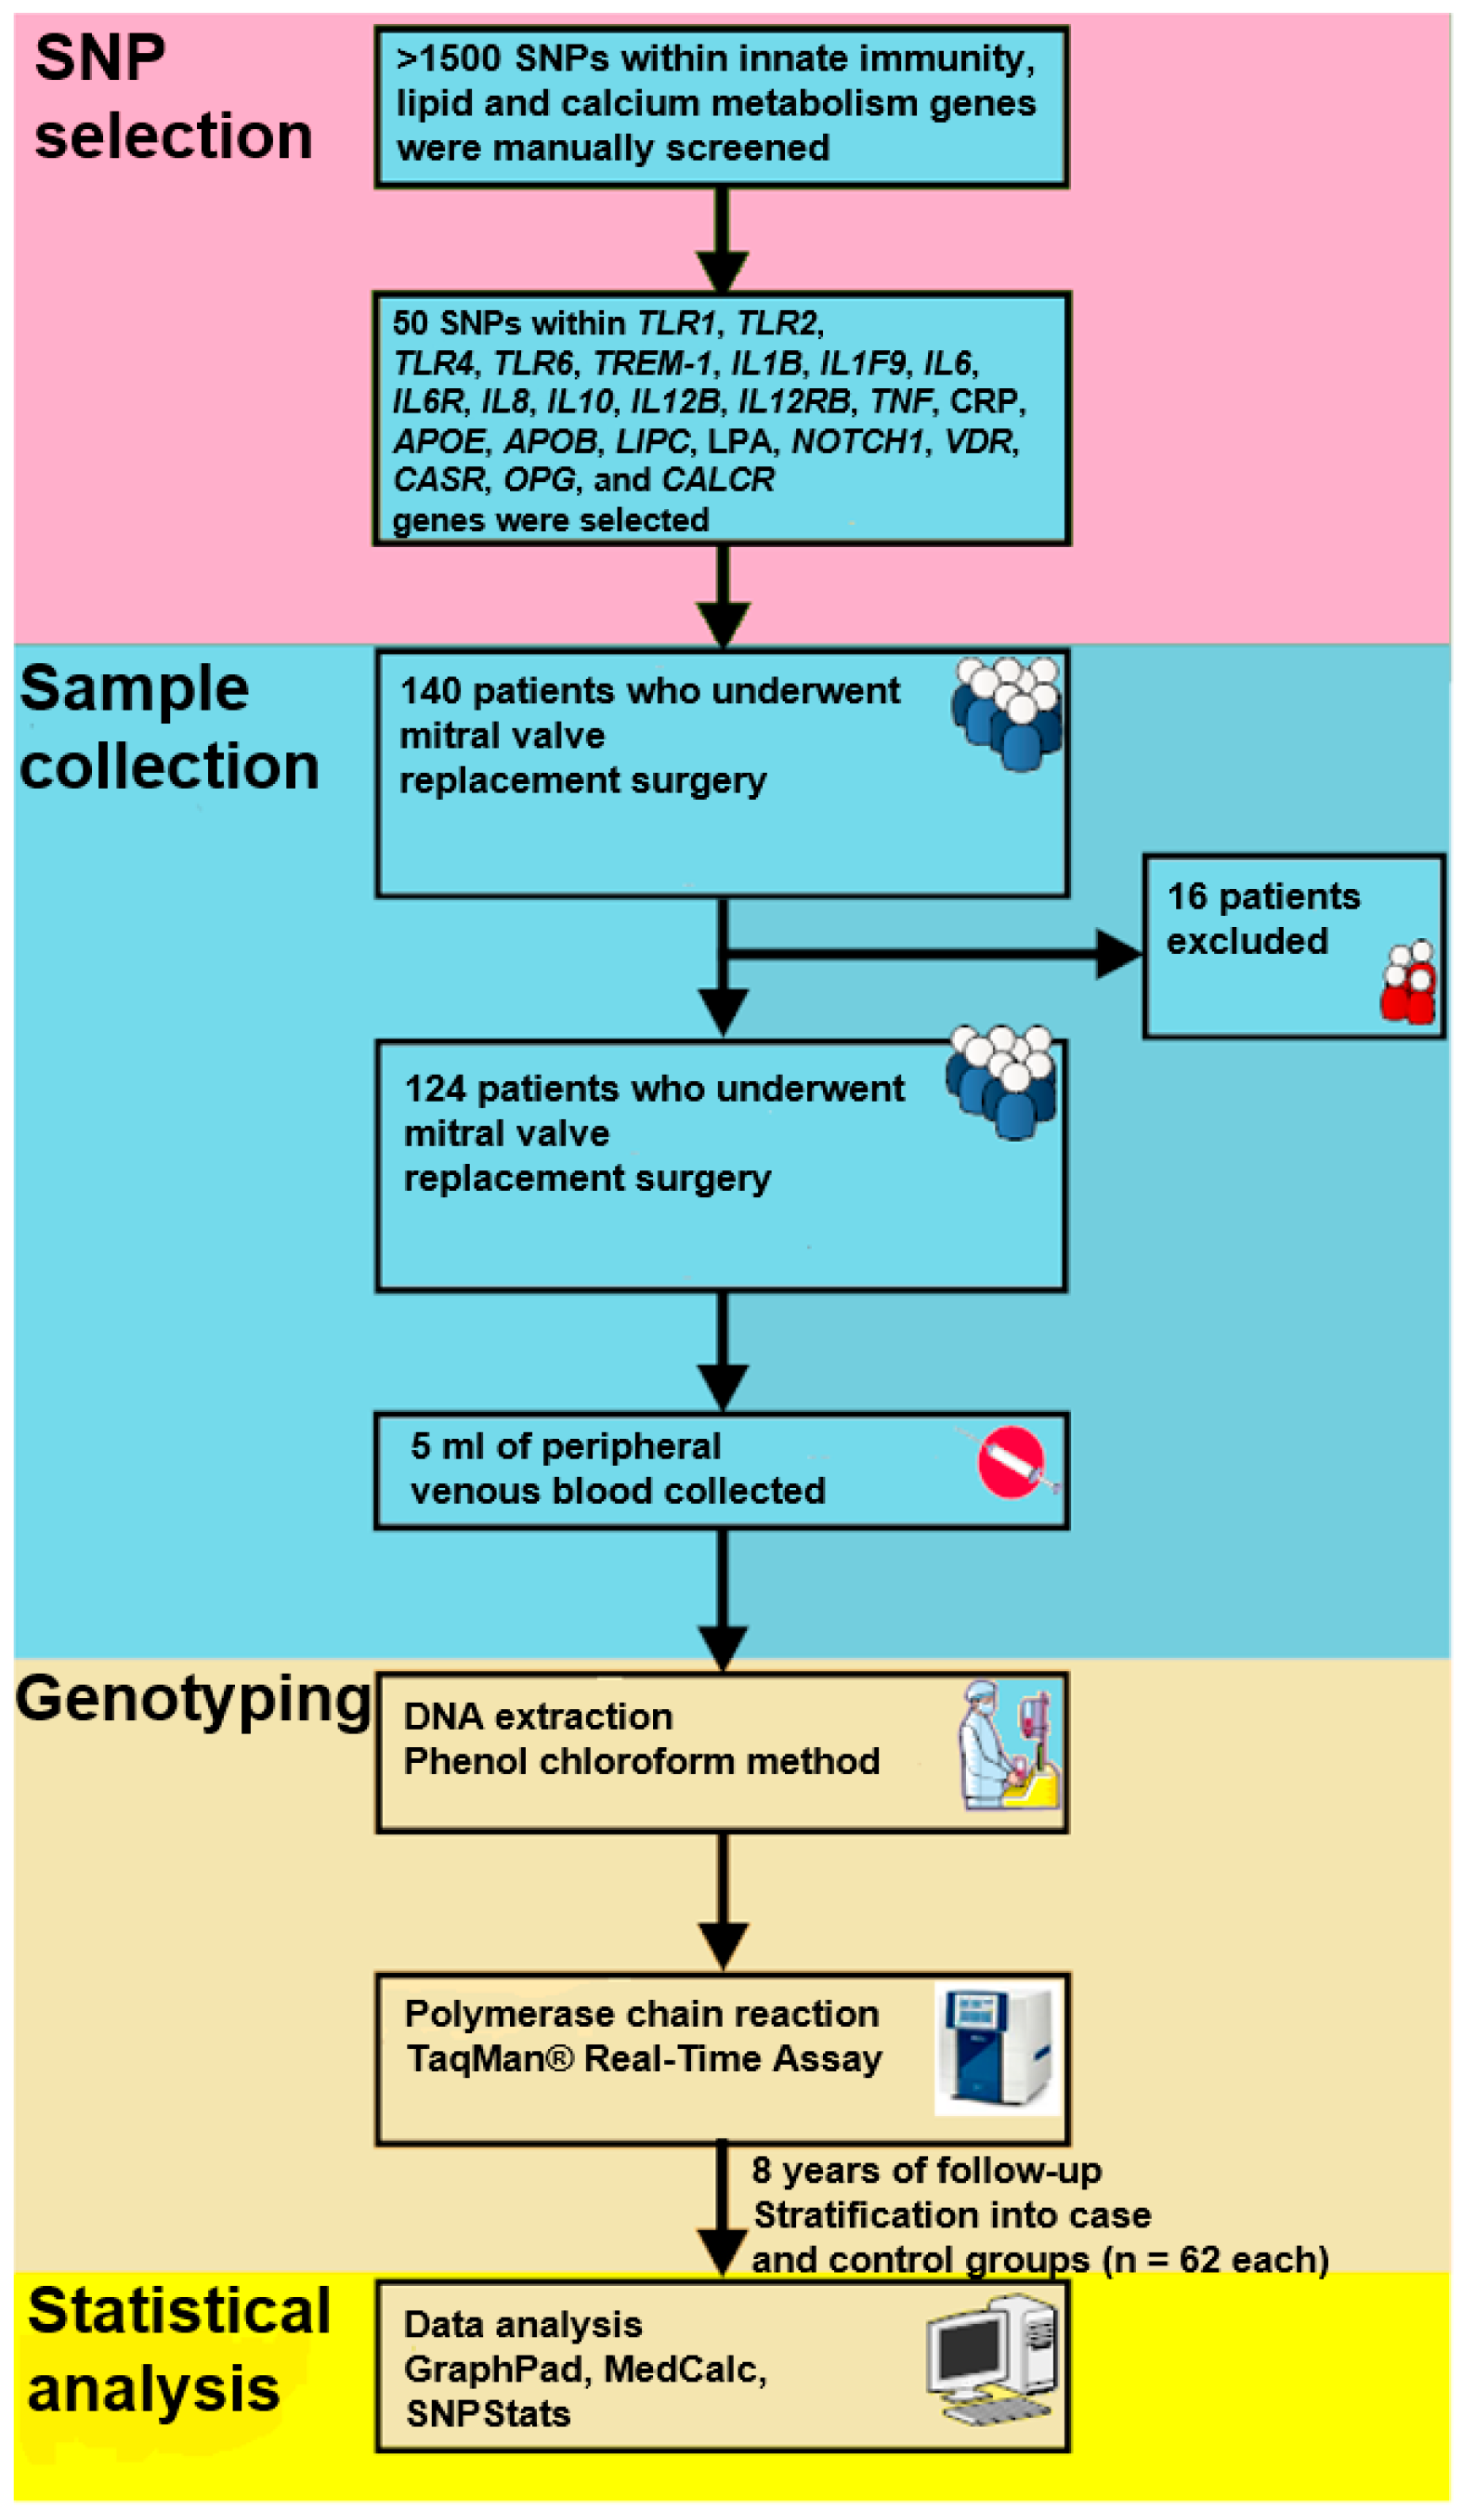
4.1. Population
4.2. SNP Selection and Genotyping
4.3. Statistical Analysis
Acknowledgments
Author Contributions
Conflicts of Interest
References
- Nishimura, R.A.; Otto, C.M.; Bonow, R.O.; Carabello, B.A.; Erwin, J.P., 3rd; Guyton, R.A.; O’Gara, P.T.; Ruiz, C.E.; Skubas, N.J.; Sorajja, P.; et al. 2014 AHA/ACC guideline for the management of patients with valvular heart disease: A report of the American College of Cardiology/American Heart Association Task Force on Practice Guidelines. J. Am. Coll. Cardiol. 2014, 63, 57–185. [Google Scholar] [CrossRef] [PubMed]
- Roberts, W.C. The senile cardiac calcification syndrome. Am. J. Cardiol. 1986, 58, 572–574. [Google Scholar] [CrossRef]
- Eric Jamieson, W.R.; Marchand, M.A.; Pelletier, C.L.; Norton, R.; Pellerin, M.; Dubiel, T.W.; Aupart, M.R.; Daenen, W.J.; Holden, M.P.; David, T.E.; et al. Structural valve deterioration in mitral replacement surgery: Comparison of Carpentier-Edwards supra-annular porcine and perimount pericardial bioprostheses. J. Thorac. Cardiovasc. Surg. 1999, 118, 297–304. [Google Scholar] [CrossRef]
- Jamieson, W.R.; Riess, F.C.; Raudkivi, P.J.; Metras, J.; Busse, E.F.; Goldstein, J.; Fradet, G.J. Medtronic Mosaic porcine bioprosthesis: Assessment of 12-year performance. J. Thorac. Cardiovasc. Surg. 2011, 142, 302–307. [Google Scholar] [CrossRef] [PubMed]
- Barbarash, O.; Rutkovskaya, N.; Hryachkova, O.; Gruzdeva, O.; Uchasova, E.; Ponasenko, A.; Kondyukova, N.; Odarenko, Y.; Barbarash, L. Impact of recipient-related factors on structural dysfunction of xenoaortic bioprosthetic heart valves. Patient Pref. Adherence 2015, 9, 389–399. [Google Scholar]
- Bella, J.N.; Tang, W.; Kraja, A.; Rao, D.C.; Hunt, S.C.; Miller, M.B.; Palmieri, V.; Roman, M.J.; Kitzman, D.W.; Oberman, A.; et al. Genome-wide linkage mapping for valve calcification susceptibility loci in hypertensive sibships: The Hypertension Genetic Epidemiology Network Study. Hypertension 2007, 49, 453–460. [Google Scholar] [CrossRef] [PubMed]
- Kutikhin, A.G.; Yuzhalin, A.E.; Brusina, E.B.; Ponasenko, A.V.; Golovkin, A.S.; Barbarash, O.L. Genetic predisposition to calcific aortic stenosis and mitral annular calcification. Mol. Biol. Rep. 2014, 41, 5645–5663. [Google Scholar] [CrossRef] [PubMed]
- Yuzhalin, A.E.; Kutikhin, A.G. Integrative systems of genomic risk markers for cancer and other diseases: Future of predictive medicine. Cancer Manag. Res. 2012, 4, 131–135. [Google Scholar] [CrossRef] [PubMed]
- Bakhtiar, S.M.; Ali, A.; Baig, S.M.; Barh, D.; Miyoshi, A.; Azevedo, V. Identifying human disease genes: Advances in molecular genetics and computational approaches. Genet. Mol. Res. 2014, 13, 5073–5087. [Google Scholar] [CrossRef] [PubMed]
- Novaro, G.M.; Sachar, R.; Pearce, G.L.; Sprecher, D.L.; Griffin, B.P. Association between apolipoprotein E alleles and calcific valvular heart disease. Circulation 2003, 108, 1804–1808. [Google Scholar] [CrossRef] [PubMed]
- Tangri, N.; Alam, A.; Wooten, E.C.; Huggins, G.S. Lack of association of Klotho gene variants with valvular and vascular calcification in Caucasians: A candidate gene study of the Framingham Offspring Cohort. Nephrol. Dial. Transplant. 2011, 26, 3998–4002. [Google Scholar] [CrossRef] [PubMed]
- Davutoglu, V.; Nacak, M. Influence of angiotensin-converting enzyme gene insertion/deletion polymorphism on rheumatic valve involvement, valve severity and subsequent valve calcification. J. Heart Valve Dis. 2005, 14, 277–281. [Google Scholar] [PubMed]
- Thanassoulis, G.; Campbell, C.Y.; Owens, D.S.; Smith, J.G.; Smith, A.V.; Peloso, G.M.; Kerr, K.F.; Pechlivanis, S.; Budoff, M.J.; Harris, T.B.; et al. Genetic associations with valvular calcification and aortic stenosis. N. Engl. J. Med. 2013, 368, 503–512. [Google Scholar] [CrossRef] [PubMed]
- Ponasenko, A.V.; Khutornaya, M.V.; Kutikhin, A.G.; Yuzhalin, A.E.; Hryachkova, O.N.; Golovkin, A.S. Toll-like receptor 2 gene polymorphism is associated with risk of mitral valve disease. Med. Kuzbasse 2015, 14, 24–32. [Google Scholar]
- Davutoglu, V.; Celik, A.; Aksoy, M. Contribution of selected serum inflammatory mediators to the progression of chronic rheumatic valve disease, subsequent valve calcification and NYHA functional class. J. Heart Valve Dis. 2005, 14, 251–256. [Google Scholar] [PubMed]
- Elmariah, S.; Budoff, M.J.; Delaney, J.A.; Hamirani, Y.; Eng, J.; Fuster, V.; Kronmal, R.A.; Halperin, J.L.; O’Brien, K.D. Risk factors associated with the incidence and progression of mitral annulus calcification: The multi-ethnic study of atherosclerosis. Am. Heart J. 2013, 166, 904–912. [Google Scholar] [CrossRef] [PubMed]
- Bre, L.P.; McCarthy, R.; Wang, W. Prevention of bioprosthetic heart valve calcification: Strategies and outcomes. Curr. Med. Chem. 2014, 21, 2553–2556. [Google Scholar] [CrossRef] [PubMed]
- American College of Cardiology; American Heart Association Task Force on Practice Guidelines (Writing Committee to revise the 1998 guidelines for the management of patients with valvular heart disease); Society of Cardiovascular Anesthesiologists; Bonow, R.O.; Carabello, B.A.; Chatterjee, K.; de Leon, A.C., Jr.; Faxon, D.P.; Freed, M.D.; Gaasch, W.H.; et al. ACC/AHA 2006 guidelines for the management of patients with valvular heart disease: A report of the American College of Cardiology/American Heart Association Task Force on Practice Guidelines (writing Committee to Revise the 1998 guidelines for the management of patients with valvular heart disease) developed in collaboration with the Society of Cardiovascular Anesthesiologists endorsed by the Society for Cardiovascular Angiography and Interventions and the Society of Thoracic Surgeons. J. Am. Coll. Cardiol. 2006, 48, 1–148. [Google Scholar]
- Astapov, D.A.; Karas’kov, A.M.; Semenova, E.I.; Demidov, D.P. The mithral valve replacement with biological prostheses: Early and long-term results. Khirurgiia 2013, 9, 18–23. [Google Scholar] [PubMed]
- Xu, Z.; Taylor, J.A. SNPinfo: Integrating GWAS and candidate gene information into functional SNP selection for genetic association studies. Nucleic Acids Res. 2009, 37, 600–605. [Google Scholar] [CrossRef] [PubMed]
- Dayem Ullah, A.Z.; Lemoine, N.R.; Chelala, C. SNPnexus: A web server for functional annotation of novel and publicly known genetic variants (2012 update). Nucleic Acids Res. 2012, 40, 65–70. [Google Scholar] [CrossRef] [PubMed]
- Golovkin, A.S.; Ponasenko, A.V.; Khutornaya, M.V.; Kutikhin, A.G.; Salakhov, R.R.; Yuzhalin, A.E.; Zhidkova, I.I.; Barbarash, O.L.; Barbarash, L.S. Association of TLR and TREM-1 gene polymorphisms with risk of coronary artery disease in a Russian population. Gene 2014, 550, 101–109. [Google Scholar] [CrossRef] [PubMed]
- Golovkin, A.S.; Ponasenko, A.V.; Yuzhalin, A.E.; Salakhov, R.R.; Khutornaya, M.V.; Kutikhin, A.G.; Rutkovskaya, N.V.; Savostyanova, Y.Y.; Barbarash, L.S. An association between single nucleotide polymorphisms within TLR and TREM-1 genes and infective endocarditis. Cytokine 2015, 71, 16–21. [Google Scholar] [CrossRef] [PubMed]
- Kutikhin, A.G.; Ponasenko, A.V.; Khutornaya, M.V.; Yuzhalin, A.E.; Zhidkova, I.I.; Salakhov, R.R.; Golovkin, A.S.; Barbarash, O.L.; Barbarash, L.S. Association of TLR and TREM-1 gene polymorphisms with atherosclerosis severity in a Russian population. Meta Gene 2016, 9, 76–89. [Google Scholar] [CrossRef] [PubMed]
- Solé, X.; Guinó, E.; Valls, J.; Iniesta, R.; Moreno, V. SNPStats: A web tool for the analysis of association studies. Bioinformatics 2006, 22, 1928–1929. [Google Scholar] [CrossRef] [PubMed]


| Model | Genotype | Without Severe Bioprosthetic Mitral Valve Calcification | With Severe Bioprosthetic Mitral Valve Calcification | OR (95% CI) | p-Value | AIC | HWE |
|---|---|---|---|---|---|---|---|
| TLR1 rs5743551 | |||||||
| Codominant | T/T | 31 (50%) | 35 (56.5%) | 1.00 | 0.39 | 171.7 | 0.06 |
| C/T | 30 (48.4%) | 25 (40.3%) | 0.69 (0.32–1.45) | ||||
| C/C | 1 (1.6%) | 2 (3.2%) | 2.71 (0.22–33.36) | ||||
| Dominant | T/T | 31 (50%) | 35 (56.5%) | 1.00 | 0.42 | 170.9 | |
| C/T-C/C | 31 (50%) | 27 (43.5%) | 0.74 (0.36–1.54) | ||||
| Recessive | T/T-C/T | 61 (98.4%) | 60 (96.8%) | 1.00 | 0.35 | 170.7 | |
| C/C | 1 (1.6%) | 2 (3.2%) | 3.17 (0.26–38.23) | ||||
| Overdominant | T/T-C/C | 32 (51.6%) | 37 (59.7%) | 1.00 | 0.27 | 170.4 | |
| C/T | 30 (48.4%) | 25 (40.3%) | 0.66 (0.31–1.39) | ||||
| Log-additive | --- | --- | --- | 0.85 (0.44–1.67) | 0.64 | 171.4 | |
| TLR1 rs5743611 | |||||||
| Codominant | C/C | 38 (61.3%) | 36 (58.1%) | 1.00 | 0.76 | 173 | 0.61 |
| C/G | 21 (33.9%) | 21 (33.9%) | 1.00 (0.46–2.19) | ||||
| G/G | 3 (4.8%) | 5 (8.1%) | 1.74 (0.38–7.96) | ||||
| Dominant | C/C | 38 (61.3%) | 36 (58.1%) | 1.00 | 0.81 | 171.5 | |
| C/G-G/G | 24 (38.7%) | 26 (41.9%) | 1.10 (0.52–2.30) | ||||
| Recessive | C/C-C/G | 59 (95.2%) | 57 (91.9%) | 1.00 | 0.46 | 171 | |
| G/G | 3 (4.8%) | 5 (8.1%) | 1.74 (0.39–7.75) | ||||
| Overdominant | C/C-G/G | 41 (66.1%) | 41 (66.1%) | 1.00 | 0.89 | 171.6 | |
| C/G | 21 (33.9%) | 21 (33.9%) | 0.94 (0.44–2.04) | ||||
| Log-additive | --- | --- | --- | 1.16 (0.64–2.09) | 0.62 | 171.3 | |
| TLR2 rs5743708 | |||||||
| --- | G/G | 57 (91.9%) | 56 (90.3%) | 1.00 | 0.67 | 171.4 | 0.99 |
| A/G | 5 (8.1%) | 6 (9.7%) | 1.33 (0.36–4.92) | ||||
| TLR2 rs3804099 | |||||||
| Codominant | T/T | 23 (37.1%) | 18 (29%) | 1.00 | 0.37 | 171.6 | 0.06 |
| C/T | 33 (53.2%) | 37 (59.7%) | 1.80 (0.79–4.13) | ||||
| C/C | 6 (9.7%) | 7 (11.3%) | 1.35 (0.36–5.06) | ||||
| Dominant | T/T | 23 (37.1%) | 18 (29%) | 1.00 | 0.18 | 169.8 | |
| C/T-C/C | 39 (62.9%) | 44 (71%) | 1.72 (0.77–3.82) | ||||
| Recessive | T/T-C/T | 56 (90.3%) | 55 (88.7%) | 1.00 | 0.93 | 171.6 | |
| C/C | 6 (9.7%) | 7 (11.3%) | 0.94 (0.28–3.17) | ||||
| Overdominant | T/T-C/C | 29 (46.8%) | 25 (40.3%) | 1.00 | 0.18 | 169.8 | |
| C/T | 33 (53.2%) | 37 (59.7%) | 1.68 (0.78–3.60) | ||||
| Log-additive | --- | --- | --- | 1.34 (0.73–2.46) | 0.33 | 170.6 | |
| TLR4 rs4986790 | |||||||
| Codominant | A/A | 53 (85.5%) | 53 (85.5%) | 1.00 | 0.46 | 172 | 0.53 |
| A/G | 8 (12.9%) | 9 (14.5%) | 1.19 (0.41–3.45) | ||||
| G/G | 1 (1.6%) | 0 (0%) | 0.00 (0.00–0.00) | ||||
| Dominant | A/A | 53 (85.5%) | 53 (85.5%) | 1.00 | 0.95 | 171.6 | |
| A/G-G/G | 9 (14.5%) | 9 (14.5%) | 1.03 (0.37–2.91) | ||||
| Recessive | A/A-A/G | 61 (98.4%) | 62 (100%) | 1.00 | 0.23 | 170.1 | |
| G/G | 1 (1.6%) | 0 (0%) | 0.00 (0.00–0.00) | ||||
| Overdominant | A/A-G/G | 54 (87.1%) | 53 (85.5%) | 1.00 | 0.73 | 171.5 | |
| A/G | 8 (12.9%) | 9 (14.5%) | 1.20 (0.41–3.50) | ||||
| Log-additive | --- | --- | --- | 0.91 (0.35–2.35) | 0.85 | 171.5 | |
| TLR4 rs4986791 | |||||||
| Codominant | C/C | 53 (85.5%) | 53 (85.5%) | 1.00 | 0.98 | 173.5 | 0.17 |
| C/T | 8 (12.9%) | 8 (12.9%) | 1.00 (0.33–2.97) | ||||
| T/T | 1 (1.6%) | 1 (1.6%) | 1.36 (0.08–23.62) | ||||
| Dominant | C/C | 53 (85.5%) | 53 (85.5%) | 1.00 | 0.95 | 171.6 | |
| C/T-T/T | 9 (14.5%) | 9 (14.5%) | 1.03 (0.37–2.91) | ||||
| Recessive | C/C-C/T | 61 (98.4%) | 61 (98.4%) | 1.00 | 0.83 | 171.5 | |
| T/T | 1 (1.6%) | 1 (1.6%) | 1.36 (0.08–23.58) | ||||
| Overdominant | C/C-T/T | 54 (87.1%) | 54 (87.1%) | 1.00 | 0.99 | 171.6 | |
| C/T | 8 (12.9%) | 8 (12.9%) | 0.99 (0.33–2.95) | ||||
| Log-additive | --- | --- | --- | 1.05 (0.43–2.56) | 0.91 | 171.6 | |
| TLR6 rs3775073 | |||||||
| Codominant | T/T | 12 (19.4%) | 20 (32.3%) | 1.00 | 0.092 | 168.8 | 0.72 |
| T/C | 32 (51.6%) | 33 (53.2%) | 0.71 (0.29–1.75) | ||||
| C/C | 18 (29%) | 9 (14.5%) | 0.31 (0.10–0.94) | ||||
| Dominant | T/T | 12 (19.4%) | 20 (32.3%) | 1.00 | 0.18 | 169.8 | |
| T/C-C/C | 50 (80.7%) | 42 (67.7%) | 0.56 (0.24–1.32) | ||||
| Recessive | T/T-T/C | 44 (71%) | 53 (85.5%) | 1.00 | 0.04 | 167.4 | |
| C/C | 18 (29%) | 9 (14.5%) | 0.39 (0.15–0.98) | ||||
| Overdominant | T/T-C/C | 30 (48.4%) | 29 (46.8%) | 1.00 | 0.59 | 171.3 | |
| T/C | 32 (51.6%) | 33 (53.2%) | 1.22 (0.58–2.55) | ||||
| Log-additive | --- | --- | --- | 0.56 (0.32–0.98) | 0.037 | 167.2 | |
| TLR6 rs5743810 | |||||||
| Codominant | G/G | 35 (56.5%) | 24 (38.7%) | 1.00 | 0.09 | 168.8 | 0.67 |
| A/G | 25 (40.3%) | 30 (48.4%) | 1.57 (0.73–3.38) | ||||
| A/A | 2 (3.2%) | 8 (12.9%) | 5.19 (0.97–27.93) | ||||
| Dominant | G/G | 35 (56.5%) | 24 (38.7%) | 1.00 | 0.11 | 169 | |
| A/G-A/A | 27 (43.5%) | 38 (61.3%) | 1.83 (0.87–3.84) | ||||
| Recessive | G/G-A/G | 60 (96.8%) | 54 (87.1%) | 1.00 | 0.062 | 168.1 | |
| A/A | 2 (3.2%) | 8 (12.9%) | 4.17 (0.81–21.53) | ||||
| Overdominant | G/G-A/A | 37 (59.7%) | 32 (51.6%) | 1.00 | 0.53 | 171.2 | |
| A/G | 25 (40.3%) | 30 (48.4%) | 1.26 (0.61–2.64) | ||||
| Log-additive | --- | --- | --- | 1.87 (1.02–3.44) | 0.039 | 167.3 | |
| TREM1 rs2234246 | |||||||
| Codominant | C/C | 15 (24.2%) | 18 (29%) | 1.00 | 0.54 | 172.3 | 0.99 |
| C/T | 29 (46.8%) | 33 (53.2%) | 1.05 (0.43–2.52) | ||||
| T/T | 18 (29%) | 11 (17.7%) | 0.63 (0.22–1.81) | ||||
| Dominant | C/C | 15 (24.2%) | 18 (29%) | 1.00 | 0.8 | 171.5 | |
| C/T-T/T | 47 (75.8%) | 44 (71%) | 0.90 (0.39–2.07) | ||||
| Recessive | C/C-C/T | 44 (71%) | 51 (82.3%) | 1.00 | 0.27 | 170.3 | |
| T/T | 18 (29%) | 11 (17.7%) | 0.61 (0.25–1.47) | ||||
| Overdominant | C/C-T/T | 33 (53.2%) | 29 (46.8%) | 1.00 | 0.48 | 171.1 | |
| C/T | 29 (46.8%) | 33 (53.2%) | 1.30 (0.63–2.70) | ||||
| Log-additive | --- | --- | --- | 0.80 (0.47–1.36) | 0.41 | 170.9 | |
| TREM1 rs4711668 | |||||||
| Codominant | C/C | 26 (41.9%) | 21 (33.9%) | 1.00 | 0.46 | 172 | 0.85 |
| T/C | 30 (48.4%) | 30 (48.4%) | 1.29 (0.58–2.85) | ||||
| T/T | 6 (9.7%) | 11 (17.7%) | 2.07 (0.64–6.75) | ||||
| Dominant | C/C | 26 (41.9%) | 21 (33.9%) | 1.00 | 0.35 | 170.7 | |
| T/C-T/T | 36 (58.1%) | 41 (66.1%) | 1.43 (0.67–3.04) | ||||
| Recessive | C/C-T/C | 56 (90.3%) | 51 (82.3%) | 1.00 | 0.29 | 170.4 | |
| T/T | 6 (9.7%) | 11 (17.7%) | 1.80 (0.60–5.37) | ||||
| Overdominant | C/C-T/T | 32 (51.6%) | 32 (51.6%) | 1.00 | 0.87 | 171.5 | |
| T/C | 30 (48.4%) | 30 (48.4%) | 1.07 (0.51–2.21) | ||||
| Log-additive | --- | --- | --- | 1.40 (0.81–2.41) | 0.23 | 170.1 | |
| TREM1 rs3804277 | |||||||
| Codominant | C/C | 16 (25.8%) | 18 (29%) | 1.00 | 0.52 | 172.3 | 0.86 |
| C/T | 28 (45.2%) | 33 (53.2%) | 1.13 (0.47–2.69) | ||||
| T/T | 18 (29%) | 11 (17.7%) | 0.66 (0.23–1.89) | ||||
| Dominant | C/C | 16 (25.8%) | 18 (29%) | 1.00 | 0.92 | 171.6 | |
| C/T-T/T | 46 (74.2%) | 44 (71%) | 0.96 (0.42–2.18) | ||||
| Recessive | C/C-C/T | 44 (71%) | 51 (82.3%) | 1.00 | 0.27 | 170.3 | |
| T/T | 18 (29%) | 11 (17.7%) | 0.61 (0.25–1.47) | ||||
| Overdominant | C/C-T/T | 34 (54.8%) | 29 (46.8%) | 1.00 | 0.41 | 170.9 | |
| C/T | 28 (45.2%) | 33 (53.2%) | 1.36 (0.66–2.83) | ||||
| Log-additive | --- | --- | --- | 0.82 (0.49–1.39) | 0.47 | 171 | |
| TREM1 rs2234237 | |||||||
| Codominant | T/T | 49 (79%) | 50 (80.7%) | 1.00 | 0.39 | 171.7 | 0.99 |
| A/T | 13 (21%) | 11 (17.7%) | 0.69 (0.27–1.79) | ||||
| A/A | 0 (0%) | 1 (1.6%) | 0.00 (0.00–0.00) | ||||
| Dominant | T/T | 49 (79%) | 50 (80.7%) | 1.00 | 0.55 | 171.2 | |
| A/T-A/A | 13 (21%) | 12 (19.4%) | 0.76 (0.30–1.92) | ||||
| Recessive | T/T-A/T | 62 (100%) | 61 (98.4%) | 1.00 | 0.26 | 170.3 | |
| A/A | 0 (0%) | 1 (1.6%) | 0.00 (0.00–0.00) | ||||
| Overdominant | T/T-A/A | 49 (79%) | 51 (82.3%) | 1.00 | 0.41 | 170.9 | |
| A/T | 13 (21%) | 11 (17.7%) | 0.67 (0.26–1.74) | ||||
| Log-additive | --- | --- | --- | 0.86 (0.36–2.05) | 0.73 | 171.5 | |
| TREM1 rs6910730 | |||||||
| Codominant | A/A | 49 (79%) | 48 (77.4%) | 1.00 | 0.49 | 172.2 | 0.99 |
| A/G | 13 (21%) | 13 (21%) | 0.84 (0.34–2.10) | ||||
| G/G | 0 (0%) | 1 (1.6%) | 0.00 (0.00–0.00)) | ||||
| Dominant | A/A | 49 (79%) | 48 (77.4%) | 1.00 | 0.83 | 171.5 | |
| A/G-G/G | 13 (21%) | 14 (22.6%) | 0.91 (0.37–2.24) | ||||
| Recessive | A/A-A/G | 62 (100%) | 61 (98.4%) | 1.00 | 0.26 | 170.3 | |
| G/G | 0 (0%) | 1 (1.6%) | 0.00 (0.00–0.00) | ||||
| Overdominant | A/A-G/G | 49 (79%) | 49 (79%) | 1.00 | 0.67 | 171.4 | |
| A/G | 13 (21%) | 13 (21%) | 0.82 (0.33–2.05) | ||||
| Log-additive | --- | --- | --- | 1.00 (0.43–2.34) | 1 | 171.6 | |
| TREM1 rs1817537 | |||||||
| Codominant | C/C | 16 (25.8%) | 18 (29%) | 1.00 | 0.52 | 172.3 | 0.86 |
| C/G | 28 (45.2%) | 33 (53.2%) | 1.13 (0.47–2.69) | ||||
| G/G | 18 (29%) | 11 (17.7%) | 0.66 (0.23–1.89) | ||||
| Dominant | C/C | 16 (25.8%) | 18 (29%) | 1.00 | 0.92 | 171.6 | |
| C/G-G/G | 46 (74.2%) | 44 (71%) | 0.96 (0.42–2.18) | ||||
| Recessive | C/C-C/G | 44 (71%) | 51 (82.3%) | 1.00 | 0.27 | 170.3 | |
| G/G | 18 (29%) | 11 (17.7%) | 0.61 (0.25–1.47) | ||||
| Overdominant | C/C-G/G | 34 (54.8%) | 29 (46.8%) | 1.00 | 0.41 | 170.9 | |
| C/G | 28 (45.2%) | 33 (53.2%) | 1.36 (0.66–2.83) | ||||
| Log-additive | --- | --- | --- | 0.82 (0.49–1.39) | 0.47 | 171 | |
| TREM1 rs9471535 | |||||||
| Codominant | T/T | 49 (79%) | 50 (80.7%) | 1.00 | 0.39 | 171.7 | 0.99 |
| C/T | 13 (21%) | 11 (17.7%) | 0.69 (0.27–1.79) | ||||
| C/C | 0 (0%) | 1 (1.6%) | 0.00 (0.00–0.00) | ||||
| Dominant | T/T | 49 (79%) | 50 (80.7%) | 1.00 | 0.55 | 171.2 | |
| C/T-C/C | 13 (21%) | 12 (19.4%) | 0.76 (0.30–1.92) | ||||
| Recessive | T/T-C/T | 62 (100%) | 61 (98.4%) | 1.00 | 0.26 | 170.3 | |
| C/C | 0 (0%) | 1 (1.6%) | 0.00 (0.00–0.00) | ||||
| Overdominant | T/T-C/C | 49 (79%) | 51 (82.3%) | 1.00 | 0.41 | 170.9 | |
| C/T | 13 (21%) | 11 (17.7%) | 0.67 (0.26–1.74) | ||||
| Log-additive | --- | --- | --- | 0.86 (0.36–2.05) | 0.73 | 171.5 | |
| TREM1 rs7768162 | |||||||
| Codominant | G/G | 26 (41.9%) | 21 (33.9%) | 1.00 | 0.57 | 172.4 | 0.25 |
| A/G | 31 (50%) | 33 (53.2%) | 1.35 (0.62–2.96) | ||||
| A/A | 5 (8.1%) | 8 (12.9%) | 1.88 (0.51–6.85) | ||||
| Dominant | G/G | 26 (41.9%) | 21 (33.9%) | 1.00 | 0.35 | 170.7 | |
| A/G-A/A | 36 (58.1%) | 41 (66.1%) | 1.43 (0.67–3.04) | ||||
| Recessive | G/G-A/G | 57 (91.9%) | 54 (87.1%) | 1.00 | 0.46 | 171 | |
| A/A | 5 (8.1%) | 8 (12.9%) | 1.58 (0.47–5.29) | ||||
| Overdominant | G/G-A/A | 31 (50%) | 29 (46.8%) | 1.00 | 0.66 | 171.4 | |
| A/G | 31 (50%) | 33 (53.2%) | 1.18 (0.57–2.45) | ||||
| Log-additive | --- | --- | --- | 1.36 (0.77–2.43) | 0.29 | 170.4 | |
| IL1B rs16944 | |||||||
| Codominant | G/G | 26 (41.9%) | 25 (40.3%) | 1.00 | 0.88 | 173.3 | 0.42 |
| G/A | 31 (50%) | 30 (48.4%) | 0.92 (0.42–1.99) | ||||
| A/A | 5 (8.1%) | 7 (11.3%) | 1.27 (0.33–4.79) | ||||
| Dominant | G/G | 26 (41.9%) | 25 (40.3%) | 1.00 | 0.92 | 171.6 | |
| G/A-A/A | 36 (58.1%) | 37 (59.7%) | 0.96 (0.46–2.04) | ||||
| Recessive | G/G-G/A | 57 (91.9%) | 55 (88.7%) | 1.00 | 0.65 | 171.4 | |
| A/A | 5 (8.1%) | 7 (11.3%) | 1.33 (0.38–4.66) | ||||
| Overdominant | G/G-A/A | 31 (50%) | 32 (51.6%) | 1.00 | 0.72 | 171.4 | |
| G/A | 31 (50%) | 30 (48.4%) | 0.88 (0.42–1.82) | ||||
| Log-additive | --- | --- | --- | 1.04 (0.58–1.86) | 0.89 | 171.6 | |
| IL1B rs1143634 | |||||||
| Codominant | G/G | 30 (48.4%) | 40 (64.5%) | 1.00 | 0.18 | 170.2 | 0.48 |
| G/A | 27 (43.5%) | 17 (27.4%) | 0.48 (0.21–1.06) | ||||
| A/A | 5 (8.1%) | 5 (8.1%) | 0.63 (0.16–2.54) | ||||
| Dominant | G/G | 30 (48.4%) | 40 (64.5%) | 1.00 | 0.07 | 168.3 | |
| G/A-A/A | 32 (51.6%) | 22 (35.5%) | 0.50 (0.24–1.07) | ||||
| Recessive | G/G-G/A | 57 (91.9%) | 57 (91.9%) | 1.00 | 0.79 | 171.5 | |
| A/A | 5 (8.1%) | 5 (8.1%) | 0.83 (0.21–3.24) | ||||
| Overdominant | G/G-A/A | 35 (56.5%) | 45 (72.6%) | 1.00 | 0.084 | 168.6 | |
| G/A | 27 (43.5%) | 17 (27.4%) | 0.51 (0.23–1.10) | ||||
| Log-additive | --- | --- | --- | 0.64 (0.36–1.15) | 0.13 | 169.3 | |
| IL1F9 rs17659543 | |||||||
| Codominant | C/C | 49 (79%) | 48 (78.7%) | 1.00 | 0.65 | 172 | 0.99 |
| C/T | 12 (19.4%) | 13 (21.3%) | 1.03 (0.41–2.55) | ||||
| T/T | 1 (1.6%) | 0 (0%) | 0.00 (0.00–0.00) | ||||
| Dominant | C/C | 49 (79%) | 48 (78.7%) | 1.00 | 0.94 | 170.8 | |
| C/T-T/T | 13 (21%) | 13 (21.3%) | 0.97 (0.40–2.37) | ||||
| Recessive | C/C-C/T | 61 (98.4%) | 61 (100%) | 1.00 | 0.35 | 170 | |
| T/T | 1 (1.6%) | 0 (0%) | 0.00 (0.00–0.00) | ||||
| Overdominant | C/C-T/T | 50 (80.7%) | 48 (78.7%) | 1.00 | 0.93 | 170.8 | |
| C/T | 12 (19.4%) | 13 (21.3%) | 1.04 (0.42–2.59) | ||||
| Log-additive | --- | --- | --- | 0.91 (0.39–2.13) | 0.83 | 170.8 | |
| IL6 rs1554606 | |||||||
| Codominant | T/T | 17 (27.4%) | 13 (21%) | 1.00 | 0.59 | 172.5 | 0.47 |
| G/T | 30 (48.4%) | 37 (59.7%) | 1.43 (0.58–3.52) | ||||
| G/G | 15 (24.2%) | 12 (19.4%) | 0.94 (0.32–2.82) | ||||
| Dominant | T/T | 17 (27.4%) | 13 (21%) | 1.00 | 0.58 | 171.3 | |
| G/T-G/G | 45 (72.6%) | 49 (79%) | 1.27 (0.54–3.02) | ||||
| Recessive | T/T-G/T | 47 (75.8%) | 50 (80.7%) | 1.00 | 0.5 | 171.1 | |
| G/G | 15 (24.2%) | 12 (19.4%) | 0.73 (0.30–1.80) | ||||
| Overdominant | T/T-G/G | 32 (51.6%) | 25 (40.3%) | 1.00 | 0.3 | 170.5 | |
| G/T | 30 (48.4%) | 37 (59.7%) | 1.47 (0.70–3.07) | ||||
| Log-additive | --- | --- | --- | 0.98 (0.57–1.69) | 0.94 | 171.6 | |
| IL6 rs1800796 | |||||||
| Codominant | G/G | 53 (85.5%) | 49 (79%) | 1.00 | 0.69 | 172.8 | 0.10 |
| C/G | 8 (12.9%) | 11 (17.7%) | 1.51 (0.54–4.24) | ||||
| C/C | 1 (1.6%) | 2 (3.2%) | 1.66 (0.14–20.27) | ||||
| Dominant | G/G | 53 (85.5%) | 49 (79%) | 1.00 | 0.39 | 170.8 | |
| C/G-C/C | 9 (14.5%) | 13 (21%) | 1.53 (0.58–4.06) | ||||
| Recessive | G/G-C/G | 61 (98.4%) | 60 (96.8%) | 1.00 | 0.73 | 171.5 | |
| C/C | 1 (1.6%) | 2 (3.2%) | 1.54 (0.13–18.69) | ||||
| Overdominant | G/G-C/C | 54 (87.1%) | 51 (82.3%) | 1.00 | 0.44 | 171 | |
| C/G | 8 (12.9%) | 11 (17.7%) | 1.49 (0.53–4.17) | ||||
| Log-additive | --- | --- | --- | 1.42 (0.62–3.26) | 0.4 | 170.9 | |
| IL6 rs2069827 | |||||||
| Codominant | G/G | 48 (77.4%) | 51 (82.3%) | 1.00 | 0.68 | 172.8 | 0.63 |
| G/T | 13 (21%) | 10 (16.1%) | 0.66 (0.26–1.69) | ||||
| T/T | 1 (1.6%) | 1 (1.6%) | 0.87 (0.05–15.09) | ||||
| Dominant | G/G | 48 (77.4%) | 51 (82.3%) | 1.00 | 0.39 | 170.8 | |
| G/T-T/T | 14 (22.6%) | 11 (17.7%) | 0.67 (0.27–1.68) | ||||
| Recessive | G/G-G/T | 61 (98.4%) | 61 (98.4%) | 1.00 | 0.97 | 171.6 | |
| T/T | 1 (1.6%) | 1 (1.6%) | 0.95 (0.06–16.33) | ||||
| Overdominant | G/G-T/T | 49 (79%) | 52 (83.9%) | 1.00 | 0.39 | 170.8 | |
| G/T | 13 (21%) | 10 (16.1%) | 0.66 (0.26–1.69) | ||||
| Log-additive | --- | --- | --- | 0.73 (0.32–1.64) | 0.44 | 171 | |
| IL6R rs2228145 | |||||||
| Codominant | A/A | 25 (40.3%) | 28 (45.2%) | 1.00 | 0.81 | 173.2 | 0.99 |
| C/A | 29 (46.8%) | 28 (45.2%) | 1.00 (0.46–2.18) | ||||
| C/C | 8 (12.9%) | 6 (9.7%) | 0.68 (0.20–2.34) | ||||
| Dominant | A/A | 25 (40.3%) | 28 (45.2%) | 1.00 | 0.84 | 171.5 | |
| C/A-C/C | 37 (59.7%) | 34 (54.8%) | 0.93 (0.44–1.94) | ||||
| Recessive | A/A-C/A | 54 (87.1%) | 56 (90.3%) | 1.00 | 0.52 | 171.2 | |
| C/C | 8 (12.9%) | 6 (9.7%) | 0.68 (0.21–2.20) | ||||
| Overdominant | A/A-C/C | 33 (53.2%) | 34 (54.8%) | 1.00 | 0.83 | 171.5 | |
| C/A | 29 (46.8%) | 28 (45.2%) | 1.08 (0.52–2.27) | ||||
| Log-additive | --- | --- | --- | 0.88 (0.51–1.53) | 0.65 | 171.4 | |
| IL6R rs2229238 | |||||||
| Codominant | C/C | 42 (67.7%) | 35 (56.5%) | 1.00 | 0.03 | 166.6 | 0.30 |
| C/T | 14 (22.6%) | 25 (40.3%) | 2.48 (1.07–5.73) | ||||
| T/T | 6 (9.7%) | 2 (3.2%) | 0.40 (0.07–2.25) | ||||
| Dominant | C/C | 42 (67.7%) | 35 (56.5%) | 1.00 | 0.12 | 169.2 | |
| C/T-T/T | 20 (32.3%) | 27 (43.5%) | 1.83 (0.84–3.96) | ||||
| Recessive | C/C-C/T | 56 (90.3%) | 60 (96.8%) | 1.00 | 0.13 | 169.3 | |
| T/T | 6 (9.7%) | 2 (3.2%) | 0.30 (0.05–1.59) | ||||
| Overdominant | C/C-T/T | 48 (77.4%) | 37 (59.7%) | 1.00 | 0.016 | 165.8 | |
| C/T | 14 (22.6%) | 25 (40.3%) | 2.70 (1.18–6.16) | ||||
| Log-additive | --- | --- | --- | 1.21 (0.66–2.21) | 0.54 | 171.2 | |
| IL8 rs2227306 | |||||||
| Codominant | C/C | 20 (32.3%) | 20 (32.3%) | 1.00 | 0.97 | 173.5 | 0.72 |
| C/T | 29 (46.8%) | 30 (48.4%) | 1.05 (0.45–2.43) | ||||
| T/T | 13 (21%) | 12 (19.4%) | 0.92 (0.33–2.61) | ||||
| Dominant | C/C | 20 (32.3%) | 20 (32.3%) | 1.00 | 0.99 | 171.6 | |
| C/T-T/T | 42 (67.7%) | 42 (67.7%) | 1.01 (0.46–2.22) | ||||
| Recessive | C/C-C/T | 49 (79%) | 50 (80.7%) | 1.00 | 0.82 | 171.5 | |
| T/T | 13 (21%) | 12 (19.4%) | 0.90 (0.36–2.23) | ||||
| Overdominant | C/C-T/T | 33 (53.2%) | 32 (51.6%) | 1.00 | 0.84 | 171.5 | |
| C/T | 29 (46.8%) | 30 (48.4%) | 1.08 (0.52–2.26) | ||||
| Log-additive | --- | --- | --- | 0.97 (0.58–1.62) | 0.9 | 171.6 | |
| IL10 rs1800871 | |||||||
| Codominant | G/G | 34 (54.8%) | 31 (50%) | 1.00 | 0.029 | 166.5 | 0.09 |
| A/G | 24 (38.7%) | 31 (50%) | 1.81 (0.83–3.95) | ||||
| A/A | 4 (6.5%) | 0 (0%) | 0.00 (0.00–0.00) | ||||
| Dominant | G/G | 34 (54.8%) | 31 (50%) | 1.00 | 0.26 | 170.3 | |
| A/G-A/A | 28 (45.2%) | 31 (50%) | 1.55 (0.72–3.32) | ||||
| Recessive | G/G-A/G | 58 (93.5%) | 62 (100%) | 1.00 | 0.029 | 166.8 | |
| A/A | 4 (6.5%) | 0 (0%) | 0.00 (0.00–0.00) | ||||
| Overdominant | G/G-A/A | 38 (61.3%) | 31 (50%) | 1.00 | 0.07 | 168.3 | |
| A/G | 24 (38.7%) | 31 (50%) | 2.02 (0.93–4.38) | ||||
| Log-additive | --- | --- | --- | 1.15 (0.59–2.24) | 0.68 | 171.4 | |
| IL10 rs1800872 | |||||||
| Codominant | G/G | 34 (54.8%) | 30 (49.2%) | 1.00 | 0.028 | 165.7 | 0.09 |
| T/G | 24 (38.7%) | 31 (50.8%) | 1.84 (0.84–4.00) | ||||
| T/T | 4 (6.5%) | 0 (0%) | 0.00 (0.00–0.00) | ||||
| Dominant | G/G | 34 (54.8%) | 30 (49.2%) | 1.00 | 0.24 | 169.5 | |
| T/G-T/T | 28 (45.2%) | 31 (50.8%) | 1.57 (0.73–3.36) | ||||
| Recessive | G/G-T/G | 58 (93.5%) | 61 (100%) | 1.00 | 0.029 | 166.1 | |
| T/T | 4 (6.5%) | 0 (0%) | 0.00 (0.00–0.00) | ||||
| Overdominant | G/G-T/T | 38 (61.3%) | 30 (49.2%) | 1.00 | 0.065 | 167.4 | |
| T/G | 24 (38.7%) | 31 (50.8%) | 2.05 (0.95–4.44) | ||||
| Log-additive | --- | --- | --- | 1.17 (0.60–2.27) | 0.65 | 170.6 | |
| IL10 rs1800896 | |||||||
| Codominant | T/T | 17 (27.4%) | 16 (25.8%) | 1.00 | 0.46 | 172 | 0.86 |
| T/C | 30 (48.4%) | 34 (54.8%) | 1.41 (0.58–3.41) | ||||
| C/C | 15 (24.2%) | 12 (19.4%) | 0.79 (0.27–2.34) | ||||
| Dominant | T/T | 17 (27.4%) | 16 (25.8%) | 1.00 | 0.68 | 171.4 | |
| T/C-C/C | 45 (72.6%) | 46 (74.2%) | 1.19 (0.52–2.74) | ||||
| Recessive | T/T-T/C | 47 (75.8%) | 50 (80.7%) | 1.00 | 0.33 | 170.6 | |
| C/C | 15 (24.2%) | 12 (19.4%) | 0.64 (0.26–1.58) | ||||
| Overdominant | T/T-C/C | 32 (51.6%) | 28 (45.2%) | 1.00 | 0.24 | 170.2 | |
| T/C | 30 (48.4%) | 34 (54.8%) | 1.56 (0.74–3.29) | ||||
| Log-additive | --- | --- | --- | 0.92 (0.54–1.56) | 0.75 | 171.5 | |
| IL12B rs3212227 | |||||||
| Codominant | T/T | 38 (61.3%) | 36 (58.1%) | 1.00 | 0.77 | 173 | 0.80 |
| G/T | 21 (33.9%) | 22 (35.5%) | 1.30 (0.59–2.85) | ||||
| G/G | 3 (4.8%) | 4 (6.5%) | 1.42 (0.28–7.32) | ||||
| Dominant | T/T | 38 (61.3%) | 36 (58.1%) | 1.00 | 0.47 | 171.1 | |
| G/T-G/G | 24 (38.7%) | 26 (41.9%) | 1.32 (0.62–2.79) | ||||
| Recessive | T/T-G/T | 59 (95.2%) | 58 (93.5%) | 1.00 | 0.75 | 171.5 | |
| G/G | 3 (4.8%) | 4 (6.5%) | 1.29 (0.26–6.47) | ||||
| Overdominant | T/T-G/G | 41 (66.1%) | 40 (64.5%) | 1.00 | 0.55 | 171.2 | |
| G/T | 21 (33.9%) | 22 (35.5%) | 1.26 (0.58–2.73) | ||||
| Log-additive | --- | --- | --- | 1.25 (0.67–2.31) | 0.48 | 171.1 | |
| IL12RB rs375947 | |||||||
| Codominant | A/A | 27 (43.5%) | 26 (41.9%) | 1.00 | 0.77 | 173.1 | 0.84 |
| A/G | 26 (41.9%) | 29 (46.8%) | 1.21 (0.56–2.66) | ||||
| G/G | 9 (14.5%) | 7 (11.3%) | 0.82 (0.25–2.67) | ||||
| Dominant | A/A | 27 (43.5%) | 26 (41.9%) | 1.00 | 0.77 | 171.5 | |
| A/G-G/G | 35 (56.5%) | 36 (58.1%) | 1.11 (0.53–2.33) | ||||
| Recessive | A/A-A/G | 53 (85.5%) | 55 (88.7%) | 1.00 | 0.6 | 171.3 | |
| G/G | 9 (14.5%) | 7 (11.3%) | 0.74 (0.25–2.26) | ||||
| Overdominant | A/A-G/G | 36 (58.1%) | 33 (53.2%) | 1.00 | 0.52 | 171.2 | |
| A/G | 26 (41.9%) | 29 (46.8%) | 1.27 (0.61–2.65) | ||||
| Log-additive | --- | --- | --- | 0.99 (0.58–1.69) | 0.96 | 171.6 | |
| TNF rs361525 | |||||||
| --- | G/G | 56 (90.3%) | 60 (96.8%) | 1.00 | 0.092 | 168.7 | 0.99 |
| A/G | 6 (9.7%) | 2 (3.2%) | 0.25 (0.04–1.41) | ||||
| TNF rs1800629 | |||||||
| Codominant | G/G | 48 (77.4%) | 54 (87.1%) | 1.00 | 0.39 | 171.7 | 0.06 |
| A/G | 11 (17.7%) | 7 (11.3%) | 0.60 (0.21–1.73) | ||||
| A/A | 3 (4.8%) | 1 (1.6%) | 0.31 (0.03–3.19) | ||||
| Dominant | G/G | 48 (77.4%) | 54 (87.1%) | 1.00 | 0.2 | 170 | |
| A/G-A/A | 14 (22.6%) | 8 (12.9%) | 0.53 (0.20–1.42) | ||||
| Recessive | G/G-A/G | 59 (95.2%) | 61 (98.4%) | 1.00 | 0.32 | 170.6 | |
| A/A | 3 (4.8%) | 1 (1.6%) | 0.34 (0.03–3.42) | ||||
| Overdominant | G/G-A/A | 51 (82.3%) | 55 (88.7%) | 1.00 | 0.38 | 170.8 | |
| A/G | 11 (17.7%) | 7 (11.3%) | 0.62 (0.21–1.80) | ||||
| Log-additive | --- | --- | --- | 0.58 (0.26–1.29) | 0.17 | 169.7 | |
| TNF rs1799964 | |||||||
| Codominant | T/T | 41 (66.1%) | 41 (66.1%) | 1.00 | 0.87 | 173.3 | 0.25 |
| C/T | 17 (27.4%) | 18 (29%) | 0.95 (0.42–2.16) | ||||
| C/C | 4 (6.5%) | 3 (4.8%) | 0.65 (0.13–3.35) | ||||
| Dominant | T/T | 41 (66.1%) | 41 (66.1%) | 1.00 | 0.78 | 171.5 | |
| C/T-C/C | 21 (33.9%) | 21 (33.9%) | 0.90 (0.41–1.94) | ||||
| Recessive | T/T-C/T | 58 (93.5%) | 59 (95.2%) | 1.00 | 0.61 | 171.3 | |
| C/C | 4 (6.5%) | 3 (4.8%) | 0.66 (0.13–3.33) | ||||
| Overdominant | T/T-C/C | 45 (72.6%) | 44 (71%) | 1.00 | 0.97 | 171.6 | |
| C/T | 17 (27.4%) | 18 (29%) | 0.99 (0.44–2.21) | ||||
| Log-additive | --- | --- | --- | 0.88 (0.47–1.63) | 0.68 | 171.4 | |
| CRP rs3093077 | |||||||
| --- | C/C | 55 (88.7%) | 56 (90.3%) | 1.00 | 0.86 | 171.5 | 0.99 |
| A/C | 7 (11.3%) | 6 (9.7%) | 1.11 (0.34–3.70) | ||||
| CRP rs1130864 | |||||||
| Codominant | G/G | 33 (53.2%) | 22 (35.5%) | 1.00 | 0.13 | 169.4 | 0.99 |
| A/G | 24 (38.7%) | 31 (50%) | 1.98 (0.90–4.34) | ||||
| A/A | 5 (8.1%) | 9 (14.5%) | 2.72 (0.77–9.59) | ||||
| Dominant | G/G | 33 (53.2%) | 22 (35.5%) | 1.00 | 0.053 | 167.7 | |
| A/G-A/A | 29 (46.8%) | 40 (64.5%) | 2.10 (1.00–4.45) | ||||
| Recessive | G/G-A/G | 57 (91.9%) | 53 (85.5%) | 1.00 | 0.27 | 170.4 | |
| A/A | 5 (8.1%) | 9 (14.5%) | 1.93 (0.58–6.36) | ||||
| Overdominant | G/G-A/A | 38 (61.3%) | 31 (50%) | 1.00 | 0.2 | 170 | |
| A/G | 24 (38.7%) | 31 (50%) | 1.61 (0.77–3.38) | ||||
| Log-additive | --- | --- | --- | 1.76 (1.00–3.09) | 0.051 | 167.6 | |
| CRP rs1205 | |||||||
| Codominant | C/C | 19 (30.6%) | 28 (45.2%) | 1.00 | 0.09 | 168.8 | 0.99 |
| C/T | 32 (51.6%) | 27 (43.5%) | 0.42 (0.18–0.98) | ||||
| T/T | 11 (17.7%) | 7 (11.3%) | 0.41 (0.13–1.30) | ||||
| Dominant | C/C | 19 (30.6%) | 28 (45.2%) | 1.00 | 0.028 | 166.8 | |
| C/T-T/T | 43 (69.3%) | 34 (54.8%) | 0.42 (0.19–0.93) | ||||
| Recessive | C/C-C/T | 51 (82.3%) | 55 (88.7%) | 1.00 | 0.43 | 170.9 | |
| T/T | 11 (17.7%) | 7 (11.3%) | 0.66 (0.23–1.87) | ||||
| Overdominant | C/C-T/T | 30 (48.4%) | 35 (56.5%) | 1.00 | 0.12 | 169.1 | |
| C/T | 32 (51.6%) | 27 (43.5%) | 0.55 (0.25–1.17) | ||||
| Log-additive | --- | --- | --- | 0.58 (0.34–1.02) | 0.052 | 167.8 | |
| APOB rs1042031 | |||||||
| Codominant | C/C | 43 (71.7%) | 42 (70%) | 1.00 | 0.84 | 168.2 | 0.99 |
| C/T | 16 (26.7%) | 16 (26.7%) | 1.14 (0.48–2.67) | ||||
| T/T | 1 (1.7%) | 2 (3.3%) | 1.94 (0.15–24.67) | ||||
| Dominant | C/C | 43 (71.7%) | 42 (70%) | 1.00 | 0.68 | 166.3 | |
| C/T-T/T | 17 (28.3%) | 18 (30%) | 1.19 (0.52–2.72) | ||||
| Recessive | C/C-C/T | 59 (98.3%) | 58 (96.7%) | 1.00 | 0.62 | 166.3 | |
| T/T | 1 (1.7%) | 2 (3.3%) | 1.89 (0.15–23.70) | ||||
| Overdominant | C/C-T/T | 44 (73.3%) | 44 (73.3%) | 1.00 | 0.8 | 166.4 | |
| C/T | 16 (26.7%) | 16 (26.7%) | 1.12 (0.48–2.62) | ||||
| Log-additive | --- | --- | --- | 1.21 (0.58–2.51) | 0.61 | 166.2 | |
| APOB rs6725189 | |||||||
| Codominant | G/G | 41 (68.3%) | 39 (65%) | 1.00 | 0.81 | 168.1 | 0.56 |
| G/T | 17 (28.3%) | 18 (30%) | 1.25 (0.55–2.88) | ||||
| T/T | 2 (3.3%) | 3 (5%) | 1.53 (0.23–10.15) | ||||
| Dominant | G/G | 41 (68.3%) | 39 (65%) | 1.00 | 0.53 | 166.1 | |
| G/T-T/T | 19 (31.7%) | 21 (35%) | 1.29 (0.58–2.84) | ||||
| Recessive | G/G-G/T | 58 (96.7%) | 57 (95%) | 1.00 | 0.71 | 166.4 | |
| T/T | 2 (3.3%) | 3 (5%) | 1.43 (0.22–9.29) | ||||
| Overdominant | G/G-T/T | 43 (71.7%) | 42 (70%) | 1.00 | 0.63 | 166.3 | |
| G/T | 17 (28.3%) | 18 (30%) | 1.22 (0.54–2.78) | ||||
| Log-additive | --- | --- | --- | 1.25 (0.64–2.42) | 0.51 | 166.1 | |
| APOE rs7412 | |||||||
| --- | C/C | 50 (80.7%) | 54 (87.1%) | 1.00 | 0.54 | 171.2 | 0.99 |
| C/T | 12 (19.4%) | 8 (12.9%) | 0.73 (0.27–2.00) | ||||
| APOE rs429358 | |||||||
| --- | T/T | 51 (82.3%) | 46 (74.2%) | 1.00 | 0.42 | 170.9 | 0.36 |
| C/T | 11 (17.7%) | 16 (25.8%) | 1.45 (0.59–3.57) | ||||
| LIPC rs1800588 | |||||||
| Codominant | C/C | 38 (61.3%) | 37 (60.7%) | 1.00 | 0.27 | 169.6 | 0.44 |
| C/T | 22 (35.5%) | 18 (29.5%) | 0.86 (0.39–1.92) | ||||
| T/T | 2 (3.2%) | 6 (9.8%) | 3.43 (0.62–19.08) | ||||
| Dominant | C/C | 38 (61.3%) | 37 (60.7%) | 1.00 | 0.87 | 170.2 | |
| C/T-T/T | 24 (38.7%) | 24 (39.3%) | 1.07 (0.50–2.26) | ||||
| Recessive | C/C-C/T | 60 (96.8%) | 55 (90.2%) | 1.00 | 0.11 | 167.7 | |
| T/T | 2 (3.2%) | 6 (9.8%) | 3.61 (0.66–19.64) | ||||
| Overdominant | C/C-T/T | 40 (64.5%) | 43 (70.5%) | 1.00 | 0.52 | 169.8 | |
| C/T | 22 (35.5%) | 18 (29.5%) | 0.77 (0.35–1.69) | ||||
| Log-additive | --- | --- | --- | 1.26 (0.69–2.30) | 0.45 | 169.6 | |
| LPA rs10455872 | |||||||
| --- | A/A | 52 (83.9%) | 59 (96.7%) | 1.00 | 0.019 | 165.3 | 0.99 |
| A/G | 10 (16.1%) | 2 (3.3%) | 0.18 (0.04–0.91) | ||||
| NOTCH1 rs13290979 | |||||||
| Codominant | A/A | 26 (41.9%) | 20 (32.8%) | 1.00 | 0.1 | 168.3 | 0.35 |
| A/G | 28 (45.2%) | 26 (42.6%) | 1.28 (0.56–2.93) | ||||
| G/G | 8 (12.9%) | 15 (24.6%) | 3.15 (1.05–9.46) | ||||
| Dominant | A/A | 26 (41.9%) | 20 (32.8%) | 1.00 | 0.2 | 169.2 | |
| A/G-G/G | 36 (58.1%) | 41 (67.2%) | 1.65 (0.76–3.57) | ||||
| Recessive | A/A-A/G | 54 (87.1%) | 46 (75.4%) | 1.00 | 0.04 | 166.6 | |
| G/G | 8 (12.9%) | 15 (24.6%) | 2.75 (1.02–7.43) | ||||
| Overdominant | A/A-G/G | 34 (54.8%) | 35 (57.4%) | 1.00 | 0.72 | 170.7 | |
| A/G | 28 (45.2%) | 26 (42.6%) | 0.87 (0.42–1.82) | ||||
| Log-additive | --- | --- | --- | 1.68 (0.99–2.85) | 0.05 | 167 | |
| VDR rs731236 | |||||||
| Codominant | A/A | 32 (51.6%) | 29 (47.5%) | 1.00 | 0.54 | 171.6 | 0.67 |
| A/G | 26 (41.9%) | 24 (39.3%) | 1.04 (0.48–2.27) | ||||
| G/G | 4 (6.5%) | 8 (13.1%) | 2.07 (0.55–7.81) | ||||
| Dominant | A/A | 32 (51.6%) | 29 (47.5%) | 1.00 | 0.64 | 170.6 | |
| A/G-G/G | 30 (48.4%) | 32 (52.5%) | 1.19 (0.57–2.48) | ||||
| Recessive | A/A-A/G | 58 (93.5%) | 53 (86.9%) | 1.00 | 0.27 | 169.6 | |
| G/G | 4 (6.5%) | 8 (13.1%) | 2.03 (0.56–7.32) | ||||
| Overdominant | A/A-G/G | 36 (58.1%) | 37 (60.7%) | 1.00 | 0.85 | 170.8 | |
| A/G | 26 (41.9%) | 24 (39.3%) | 0.93 (0.44–1.96) | ||||
| Log-additive | --- | --- | --- | 1.27 (0.73–2.22) | 0.39 | 170.1 | |
| VDR rs2228570 | |||||||
| Codominant | G/G | 16 (25.8%) | 19 (31.1%) | 1.00 | 0.62 | 171.9 | 0.58 |
| A/G | 36 (58.1%) | 29 (47.5%) | 0.70 (0.30–1.64) | ||||
| A/A | 10 (16.1%) | 13 (21.3%) | 1.02 (0.34–3.07) | ||||
| Dominant | G/G | 16 (25.8%) | 19 (31.1%) | 1.00 | 0.53 | 170.4 | |
| A/G-A/A | 46 (74.2%) | 42 (68.8%) | 0.77 (0.34–1.74) | ||||
| Recessive | G/G-A/G | 52 (83.9%) | 48 (78.7%) | 1.00 | 0.59 | 170.6 | |
| A/A | 10 (16.1%) | 13 (21.3%) | 1.29 (0.50–3.33) | ||||
| Overdominant | G/G-A/A | 26 (41.9%) | 32 (52.5%) | 1.00 | 0.33 | 169.9 | |
| A/G | 36 (58.1%) | 29 (47.5%) | 0.69 (0.33–1.44) | ||||
| Log-additive | --- | --- | --- | 0.97 (0.57–1.67) | 0.91 | 170.8 | |
| CASR rs1042636 | |||||||
| Codominant | A/A | 47 (75.8%) | 50 (82%) | 1.00 | 0.25 | 170.1 | 0.08 |
| A/G | 14 (22.6%) | 8 (13.1%) | 0.51 (0.19–1.38) | ||||
| G/G | 1 (1.6%) | 3 (4.9%) | 2.79 (0.26–29.85) | ||||
| Dominant | A/A | 47 (75.8%) | 50 (82%) | 1.00 | 0.38 | 170.1 | |
| A/G-G/G | 15 (24.2%) | 11 (18%) | 0.67 (0.27–1.65) | ||||
| Recessive | A/A-A/G | 61 (98.4%) | 58 (95.1%) | 1.00 | 0.33 | 169.9 | |
| G/G | 1 (1.6%) | 3 (4.9%) | 3.04 (0.29–32.42) | ||||
| Overdominant | A/A-G/G | 48 (77.4%) | 53 (86.9%) | 1.00 | 0.16 | 168.9 | |
| A/G | 14 (22.6%) | 8 (13.1%) | 0.50 (0.19–1.35) | ||||
| Log-additive | --- | --- | --- | 0.87 (0.42–1.80) | 0.7 | 170.7 | |
| OPG rs3134069 | |||||||
| Codominant | A/A | 49 (79%) | 52 (85.2%) | 1.00 | 0.59 | 171.8 | 0.99 |
| A/C | 12 (19.4%) | 9 (14.8%) | 0.80 (0.30–2.12) | ||||
| C/C | 1 (1.6%) | 0 (0%) | 0.00 (0.00–0.00) | ||||
| Dominant | A/A | 49 (79%) | 52 (85.2%) | 1.00 | 0.56 | 170.5 | |
| A/C-C/C | 13 (21%) | 9 (14.8%) | 0.75 (0.29–1.97) | ||||
| Recessive | A/A-A/C | 61 (98.4%) | 61 (100%) | 1.00 | 0.35 | 170 | |
| C/C | 1 (1.6%) | 0 (0%) | 0.00 (0.00–0.00) | ||||
| Overdominant | A/A-C/C | 50 (80.7%) | 52 (85.2%) | 1.00 | 0.68 | 170.7 | |
| A/C | 12 (19.4%) | 9 (14.8%) | 0.81 (0.31–2.16) | ||||
| Log-additive | --- | --- | --- | 0.72 (0.29–1.80) | 0.48 | 170.3 | |
| OPG rs2073618 | |||||||
| Codominant | G/G | 15 (24.2%) | 12 (19.7%) | 1.00 | 0.85 | 172.5 | 0.07 |
| C/G | 35 (56.5%) | 37 (60.7%) | 1.29 (0.51–3.27) | ||||
| C/C | 12 (19.4%) | 12 (19.7%) | 1.13 (0.35–3.61) | ||||
| Dominant | G/G | 15 (24.2%) | 12 (19.7%) | 1.00 | 0.62 | 170.6 | |
| C/G-C/C | 47 (75.8%) | 49 (80.3%) | 1.25 (0.51–3.08) | ||||
| Recessive | G/G-C/G | 50 (80.7%) | 49 (80.3%) | 1.00 | 0.88 | 170.8 | |
| C/C | 12 (19.4%) | 12 (19.7%) | 0.93 (0.37–2.37) | ||||
| Overdominant | G/G-C/C | 27 (43.5%) | 24 (39.3%) | 1.00 | 0.6 | 170.6 | |
| C/G | 35 (56.5%) | 37 (60.7%) | 1.22 (0.58–2.57) | ||||
| Log-additive | --- | --- | --- | 1.07 (0.60–1.91) | 0.82 | 170.8 | |
| OPG rs3102735 | |||||||
| Codominant | T/T | 39 (62.9%) | 46 (75.4%) | 1.00 | 0.39 | 171 | 0.53 |
| C/T | 19 (30.6%) | 14 (22.9%) | 0.69 (0.30–1.61) | ||||
| C/C | 4 (6.5%) | 1 (1.6%) | 0.29 (0.03–2.80) | ||||
| Dominant | T/T | 39 (62.9%) | 46 (75.4%) | 1.00 | 0.26 | 169.6 | |
| C/T-C/C | 23 (37.1%) | 15 (24.6%) | 0.63 (0.28–1.41) | ||||
| Recessive | T/T-C/T | 58 (93.5%) | 60 (98.4%) | 1.00 | 0.28 | 169.7 | |
| C/C | 4 (6.5%) | 1 (1.6%) | 0.32 (0.03–3.08) | ||||
| Overdominant | T/T-C/C | 43 (69.3%) | 47 (77%) | 1.00 | 0.48 | 170.3 | |
| C/T | 19 (30.6%) | 14 (22.9%) | 0.74 (0.32–1.70) | ||||
| Log-additive | --- | --- | --- | 0.63 (0.32–1.26) | 0.19 | 169.1 | |
| CALCR rs1801197 | |||||||
| Codominant | A/A | 32 (51.6%) | 37 (60.7%) | 1.00 | 0.48 | 171.4 | 0.99 |
| A/G | 27 (43.5%) | 20 (32.8%) | 0.64 (0.29–1.39) | ||||
| G/G | 3 (4.8%) | 4 (6.6%) | 1.19 (0.24–5.98) | ||||
| Dominant | A/A | 32 (51.6%) | 37 (60.7%) | 1.00 | 0.34 | 169.9 | |
| A/G-G/G | 30 (48.4%) | 24 (39.3%) | 0.69 (0.33–1.46) | ||||
| Recessive | A/A-A/G | 59 (95.2%) | 57 (93.4%) | 1.00 | 0.65 | 170.6 | |
| G/G | 3 (4.8%) | 4 (6.6%) | 1.43 (0.29–6.99) | ||||
| Overdominant | A/A-G/G | 35 (56.5%) | 41 (67.2%) | 1.00 | 0.23 | 169.4 | |
| A/G | 27 (43.5%) | 20 (32.8%) | 0.63 (0.29–1.35) | ||||
| Log-additive | --- | --- | --- | 0.82 (0.45–1.52) | 0.54 | 170.5 | |
| F2 rs1799963 | |||||||
| --- | G/G | 59 (98.3%) | 58 (98.3%) | 1.00 | 0.77 | 164.3 | 0.99 |
| A/G | 1 (1.7%) | 1 (1.7%) | 0.64 (0.04–11.58) | ||||
| F5 rs6025 | |||||||
| --- | C/C | 55 (91.7%) | 57 (96.6%) | 1.00 | 0.18 | 162.5 | 0.99 |
| C/T | 5 (8.3%) | 2 (3.4%) | 0.31 (0.05–1.84) | ||||
| F5 rs6027 | |||||||
| Codominant | T/T | 47 (78.3%) | 46 (78%) | 1.00 | 0.92 | 166.2 | 0.09 |
| C/T | 11 (18.3%) | 11 (18.6%) | 0.86 (0.33–2.29) | ||||
| C/C | 2 (3.3%) | 2 (3.4%) | 1.33 (0.17–10.31) | ||||
| Dominant | T/T | 47 (78.3%) | 46 (78%) | 1.00 | 0.87 | 164.3 | |
| C/T-C/C | 13 (21.7%) | 13 (22%) | 0.92 (0.37–2.29) | ||||
| Recessive | T/T-C/T | 58 (96.7%) | 57 (96.6%) | 1.00 | 0.77 | 164.3 | |
| C/C | 2 (3.3%) | 2 (3.4%) | 1.36 (0.18–10.49) | ||||
| Overdominant | T/T-C/C | 49 (81.7%) | 48 (81.4%) | 1.00 | 0.75 | 164.3 | |
| C/T | 11 (18.3%) | 11 (18.6%) | 0.85 (0.32–2.25) | ||||
| Log-additive | --- | --- | --- | 0.99 (0.47–2.07) | 0.97 | 164.4 | |
| F7 rs6046 | |||||||
| Codominant | G/G | 52 (86.7%) | 42 (71.2%) | 1.00 | 0.15 | 162.5 | 0.20 |
| A/G | 7 (11.7%) | 15 (25.4%) | 2.55 (0.91–7.16) | ||||
| A/A | 1 (1.7%) | 2 (3.4%) | 2.94 (0.25–35.06) | ||||
| Dominant | G/G | 52 (86.7%) | 42 (71.2%) | 1.00 | 0.052 | 160.5 | |
| A/G-A/A | 8 (13.3%) | 17 (28.8%) | 2.59 (0.98–6.90) | ||||
| Recessive | G/G-A/G | 59 (98.3%) | 57 (96.6%) | 1.00 | 0.46 | 163.8 | |
| A/A | 1 (1.7%) | 2 (3.4%) | 2.48 (0.21–29.33) | ||||
| Overdominant | G/G-A/A | 53 (88.3%) | 44 (74.6%) | 1.00 | 0.08 | 161.3 | |
| A/G | 7 (11.7%) | 15 (25.4%) | 2.45 (0.88–6.87) | ||||
| Log-additive | --- | --- | --- | 2.19 (0.94–5.11) | 0.058 | 160.8 | |
| F13A1 rs5985 | |||||||
| Codominant | C/C | 39 (65%) | 37 (62.7%) | 1.00 | 0.33 | 164.1 | 0.10 |
| A/C | 15 (25%) | 19 (32.2%) | 1.74 (0.72–4.21) | ||||
| A/A | 6 (10%) | 3 (5.1%) | 0.66 (0.15–2.91) | ||||
| Dominant | C/C | 39 (65%) | 37 (62.7%) | 1.00 | 0.4 | 163.7 | |
| A/C-A/A | 21 (35%) | 22 (37.3%) | 1.41 (0.63–3.14) | ||||
| Recessive | C/C-A/C | 54 (90%) | 56 (94.9%) | 1.00 | 0.41 | 163.7 | |
| A/A | 6 (10%) | 3 (5.1%) | 0.55 (0.13–2.37) | ||||
| Overdominant | C/C-A/A | 45 (75%) | 40 (67.8%) | 1.00 | 0.17 | 162.5 | |
| A/C | 15 (25%) | 19 (32.2%) | 1.83 (0.77–4.36) | ||||
| Log-additive | --- | --- | --- | 1.09 (0.60–1.98) | 0.78 | 164.3 | |
| ITGB3 rs5918 | |||||||
| Codominant | T/T | 45 (75%) | 42 (71.2%) | 1.00 | 0.95 | 166.3 | 0.08 |
| C/T | 12 (20%) | 14 (23.7%) | 1.11 (0.45–2.77) | ||||
| C/C | 3 (5%) | 3 (5.1%) | 0.83 (0.15–4.65) | ||||
| Dominant | T/T | 45 (75%) | 42 (71.2%) | 1.00 | 0.9 | 164.4 | |
| C/T-C/C | 15 (25%) | 17 (28.8%) | 1.05 (0.45–2.46) | ||||
| Recessive | T/T-C/T | 57 (95%) | 56 (94.9%) | 1.00 | 0.81 | 164.3 | |
| C/C | 3 (5%) | 3 (5.1%) | 0.81 (0.15–4.46) | ||||
| Overdominant | T/T-C/C | 48 (80%) | 45 (76.3%) | 1.00 | 0.8 | 164.3 | |
| C/T | 12 (20%) | 14 (23.7%) | 1.13 (0.46–2.79) | ||||
| Log-additive | --- | --- | --- | 1.00 (0.51–1.95) | 1 | 164.4 | |
| Clinical Markers | |
| Gender | Male gender OR = 2.80 (95% CI = 1.23–6.38) |
| Age | No statistically significant association |
| Coronary artery disease | No statistically significant association |
| Peripheral artery disease | No statistically significant association |
| Arterial hypertension | No statistically significant association |
| Diabetes mellitus | No statistically significant association |
| Genomic Markers | |
| rs3775073 (TLR6) | Carriers of T/T genotype: OR = 3.33 (95% CI = 1.14–9.75) |
| rs2229238 (IL6R) | Carriers of C/T genotype: OR = 3.70 (95% CI = 1.48–9.22) |
| rs10455872 (LPA) | Carriers of A/A genotype: OR = 5.67 (95% CI = 1.19–27.09) |
| rs5743810 (TLR6) | No statistically significant association |
| rs1800871 (IL10) | No statistically significant association |
| rs1800872 (IL10) | No statistically significant association |
| rs1205 (CRP) | No statistically significant association |
| rs13290979 (NOTCH1) | No statistically significant association |
| General Evaluation | |
| Sensitivity | 59.68% (37 true; 25 false-negatives) |
| Specificity | 74.19% (46 true; 16 false-positives) |
| Percent of cases correctly classified | 66.94% |
| Area under the ROC curve | 0.73 (95% CI = 0.64–0.81) |
| Standard error | 0.045 |
| Feature | Value, n (%) |
|---|---|
| Male gender | 50 (40.32%) |
| Age ≥ 50 years | 65 (52.42%) |
| Mitral stenosis and/or regurgitation with New York Heart Association functional class III-IV symptoms | 54 (43.55%) |
| Coronary artery disease | 14 (11.29%) |
| Peripheral artery disease | 6 (4.84%) |
| Arterial hypertension | 38 (30.64%) |
| Diabetes mellitus | 8 (6.45%) |
| Severe bioprosthetic mitral valve calcification within 8 years post-implantation | 62 (50.00%) |
| Feature | Without Severe Bioprosthetic Mitral Valve Calcification | With Severe Bioprosthetic Mitral Valve Calcification | Total | p Value |
|---|---|---|---|---|
| Basic characteristics | ||||
| Sample size | 62 (50.00%) | 62 (50.00%) | 124 (100.00%) | |
| Mean age | 50.60 (48.12–53.08) | 47.81 (45.68–49.94) | 49.20 (47.57–50.83) | 0.09 |
| Standard deviation of mean age | 9.76 | 8.39 | 9.17 | |
| Male gender | 19 (30.64%) | 31 (50.00%) | 50 (40.32%) | 0.03 |
| Female gender | 43 (69.36%) | 31 (50.00%) | 74 (59.68%) | |
| Echocardiography characteristics | ||||
| Left atrial diameter, cm | 6.70 (6.43–7.01) | 5.51 (5.22–5.69) | 6.10 (5.82–6.35) | 0.02 |
| Left ventricular end-diastolic diameter, cm | 5.42 (5.23–5.56) | 5.37 (5.17–5.50) | 5.39 (5.20–5.53) | 0.81 |
| Left ventricular end-systolic diameter, cm | 3.23 (3.05–3.39) | 3.41 (3.26–3.51) | 3.32 (3.15–3.45) | 0.36 |
| Left ventricular end-diastolic volume, cm3 | 139.03 (136.12–143.15) | 136.56 (134.01–139.76) | 137.79 (135.06–141.45) | 0.82 |
| Left ventricular end-systolic volume, cm3 | 40.23 (38.23–41.98) | 45.14 (43.24–47.12) | 42.68 (40.73–44.55) | 0.03 |
| Interventricular septal thickness, cm | 1.04 (0.97–1.12) | 1.08 (1.02–1.15) | 1.06 (0.99–1.13) | 0.89 |
| Left ventricular posterior wall thickness, cm | 1.03 (0.95–1.08) | 1.11 (1.00–1.18) | 1.07 (0.97–1.13) | 0.72 |
| Left ventricular ejection fraction, % | 71.00 (67.00–74.00) | 65.00 (61.00–68.00) | 68.00 (64.00–71.00) | 0.03 |
| Right atrial diameter, cm | 6.00 (5.87–6.16) | 4.70 (4.62–4.88) | 5.35 (5.24–5.52) | 0.03 |
| Right ventricular diameter, cm | 2.09 (2.01–2.17) | 2.03 (1.95–2.14) | 2.06 (1.98–2.15) | 0.76 |
| Aortic root diameter, cm | 3.30 (3.12–3.49) | 3.32 (3.14–3.50) | 3.31 (3.13–3.49) | 0.93 |
| Mitral valve area, cm2 | 1.72 (1.64–1.79) | 1.41 (1.35–1.47) | 1.56 (1.49–1.63) | 0.02 |
| Single Nucleotide Polymorphism | Nucleotide Substitution | Chromosomal Position | Amino Acid Substitution | Forward 5′-3′ and Reverse 3′-5′ Polymerase Chain Reaction Primers |
|---|---|---|---|---|
| TLR1 gene | ||||
| rs5743551 | T>C | 38807654 | 5′-upstream | F: agtgggcagggcagtaagggaagct R: ctcagcactctgaattcctgttttt |
| rs5743611 | C>G | 38800214 | Arg80Thr | F: aacactgatatcaagatactggatt R: tattatgagaaattatcaaaatcct |
| TLR2 gene | ||||
| rs3804099 | T>C | 154624656 | Asn199Asn | F: caaaaagtttgaagtcaattcagaa R: gtaagtcatctgatccttcatatga |
| rs5743708 | G>A | 154626317 | Arg753Gln | F: aagccattccccagcgcttctgcaagctgc R: gaagataatgaacaccaagacctacctgga |
| TLR4 gene | ||||
| rs4986790 | A>G | 120475302 | Asp299Gly | F: gattagcatacttagactactacctcgatg R: attattgacttatttaattgtttgacaaat |
| rs4986791 | C>T | 120475602 | Thr399Ile | F: gttgctgttctcaaagtgattttgggacaa R: agcctaaagtatttagatctgagcttcaat |
| TLR6 gene | ||||
| rs3775073 | T>C | 38829832 | Lys421Lys | F: cactatactctcaacccaagtgcagttttc R: ttatgtctaccagattccaaagaattccagc |
| rs5743810 | A>G | 38830350 | Ser249Pro | F: ttgagggtaaaattcagtaaggttg R: acctctggtgagttctgataaaaat |
| TREM-1 gene | ||||
| rs1817537 | C>G | 41244567 | intronic | F: acacagggacagacagatggcaatggaaca R: aaggccagatgcagagccagtgctatgcag |
| rs3804277 | C>T | 41245172 | intronic | F: ccagcatctctctcacccctcacatggtgg R: cactcagcatcctcagcatctgccccgatt |
| rs6910730 | A>G | 41246633 | 3′-downstream | F: catggagcaacaccaaggtctaggggcaag R: aatctaggatggattcgtgctgacttccca |
| rs7768162 | A>G | 41255511 | 5′-upstream | F: aaagattcctactgctaaataaacaaaaaa R: taacttggtttcttcaaaggaattgaaata |
| rs2234246 | C>T | 41243740 | 3′-UTR | F: ggaaggtgagacgctgactttagaaatagc R: ggtgattacagatttaattcatgttattaa |
| rs4711668 | T>C | 41246473 | 3′-downstream | F: gctagtgtggattccactttccagactgga R: ttggctgaaaggatagttcatattagatga |
| rs9471535 | T>C | 41255490 | 5’-upstream | F: aaaatttttaaatttaaataaaaagattcc R: ctgctaaataaacaaaaaaataacttggtt |
| rs2234237 | T>A | 41250466 | Thr25Ser | F: gcccctctttcagttcatacttttcctcag R: aatttagttgcagctcggagttctataagc |
| IL1B gene | ||||
| rs16944 | A>G | 113594867 | 5′-upstream | F: taccttgggtgctgttctctgcctc R: ggagctctctgtcaattgcaggagc |
| rs1143634 | G>A | 113590390 | Phe105Phe | F: cataagcctcgttatcccatgtgtc R: aagaagataggttctgaaatgtgga |
| IL1F9 gene | ||||
| rs17659543 | C>T | 113716306 | Not announced | F: tgtacctggacaagaggcataaattggggc R: gtcttaggaaagcagatatacagccatcct |
| IL6 gene | ||||
| rs1554606 | T>G | 22768707 | intronic | F: ttagttcatcctgggaaaggtactc R: cagggccttttccctctctggctgc |
| rs1800796 | G>C | 22766246 | 5′-upstream | F: atggccaggcagttctacaacagcc R: ctcacagggagagccagaacacaga |
| rs2069827 | G>T | 22765456 | 5′-upstream | F: gcccaacagaggtcactgttttatc R: atcttgaagagatctcttcttagca |
| IL6R gene | ||||
| rs2228145 | A>T/C | 154426970 | Asp358Val/Ala | F: aattttttttttaacctagtgcaag R: ttcttcttcagtaccactgcccaca |
| rs2229238 | T>C | 154437896 | 3′-UTR | F: ccagcagcctggaccctgtggatga R: aaaacacaaacgggctcagcaaaag |
| IL8 gene | ||||
| rs2227306 | C>T | 74607055 | intronic | F: aactctaactctttatataggaagt R: gttcaatgttgtcagttatgactgt |
| IL10 gene | ||||
| rs1800871 | A>G | 206946634 | 5′-upstream | F: agtgagcaaactgaggcacagagat R: ttacatcacctgtacaagggtacac |
| rs1800872 | T>G | 206946407 | 5’-upstream | F: ttttactttccagagactggcttcctacag R: acaggcggggtcacaggatgtgttccaggc |
| rs1800896 | T>C | 206946897 | 5′-upstream | F: tcctcttacctatccctacttcccc R: tcccaaagaagccttagtagtgttg |
| IL12B gene | ||||
| rs3212227 | T>G | 158742950 | 3′-UTR | F: attgtttcaatgagcatttagcatc R: aactatacaaatacagcaaagatat |
| IL12RB gene | ||||
| rs375947 | A>G | 18180451 | Met365Thr | F: aggctgccattcaatgcaatacgtc R: tgctctgagcccgggctggccaata |
| TNF gene | ||||
| rs361525 | G>A | 31543101 | 5′-upstream | F: ggcccagaagacccccctcggaatc R: gagcagggaggatggggagtgtgag |
| rs1800629 | G>A | 31543031 | 5′-upstream | F: gaggcaataggttttgaggggcatg R: ggacggggttcagcctccagggtcc |
| rs1799964 | T>C | 31542308 | 3′-downstream | F: gcaggggaagcaaaggagaagctgagaaga R: gaaggaaaagtcagggtctggaggggcggg |
| CRP gene | ||||
| rs3093077 | A>C | 159679636 | Not announced | F: ggaatccaggcaagtacgacaaccc R: tctgagactagtgggcagttgtcct |
| rs1130864 | G>A | 159683091 | 3′-UTR | F: cctcaaattctgattcttttggacc R: tttcccagcatagttaacgagctcc |
| rs1205 | C>T | 159682233 | 3′-UTR | F: acttccagtttggcttctgtcctca R: agtctctctccatgtggcaaacaag |
| APOB gene | ||||
| rs1042031 | C>T | 21225753 | Glu4181Lys | F: caatcagatgcttgactttcatatggaatt R: ttgagtaactcgtaccaagccatcaaacac |
| rs6725189 | G>T | 21219001 | Not announced | F: ttcccagcctcagctcaacagagctatggg R: cagcagtcggccctctctattgttctttcc |
| APOE gene | ||||
| rs7412 | C>T | 45412079 | Arg176Cys | F: ctcctccgcgatgccgatgacctgcagaag R: gcctggcagtgtaccaggccggggcccgcg |
| rs429358 | T>C | 45411941 | Cys130Arg | F: gcccggctgggcgcggacatggaggacgtg R: gcggccgcctggtgcagtaccgcggcgagg |
| LIPC gene | ||||
| rs1800588 | C>T | 58723675 | 5′-upstream | F: tctttgcttcttcgtcagctccttttgaca R: gggggtgaagggttttctgcaccacacttt |
| LPA gene | ||||
| rs10455872 | A>G | 161010118 | intronic | F: tcagacaccttgttctcagaaccca R: tgtgtttatacaggttagaggagaa |
| NOTCH1 gene | ||||
| rs13290979 | A>G | 139425634 | intronic | F: ccagcccagcagtgaagaaactgagcccac R: accctcctggcctgacctacactcgggctt |
| VDR gene | ||||
| rs731236 | A>G | 48238757 | Ile352Ile | F: tgtgttggacaggcggtcctggatggcctc R: atcagcgcggcgtcctgcaccccaggacga |
| rs2228570 | A>G | 48272895 | Met1Thr/Lys/Arg | F: ggcagggaagtgctggccgccattgcctcc R: tccctgtaagaacagcaagcaggccacggt |
| CASR gene | ||||
| rs1042636 | A>G | 122003769 | Arg990Gly | F: gatgagcctcagaagaacgccatggcccac R: ggaattctacgcaccagaactccctggagg |
| OPG gene | ||||
| rs3134069 | A>C | 119964988 | 5′-upstream | F: ggagcttcctacgcgctgaacttctggagt R: gcctcctcgaggtctttccactagcctcaa |
| rs2073618 | G>C | 119964052 | Asn3Lys | F: gggacttaccacgagcgcgcagcacagcaa R: ttgttcattgtggtccccggaaacctcagg |
| rs3102735 | T>C | 119965070 | 5′-upstream | F: ctttgctctagggttcgctgtctcccccat R: aattccctggtctagaagttagacttgatg |
| CALCR gene | ||||
| rs1801197 | A>G | 93055753 | Leu481Pro | F: tcgccttggttgttggctggttcattcctc R: gctcctgatggcagatgtaaattgggatgt |
| F2 gene | ||||
| rs1799963 | G>A | 46761055 | 3′-UTR | F: gttcccaataaaagtgactctcagc R: agcctcaatgctcccagtgctattc |
| F5 gene | ||||
| rs6025 | T>C | 169519049 | Gln534Arg | F: ttacttcaaggacaaaatacctgtattcct R: gcctgtccagggatctgctcttacagatta |
| rs6027 | T>C | 169483561 | Asp2222Gly | F: gggtttttgaatgttcaattctagtaaata R: cacagccaaagagttccaggcgaagtgcaa |
| F7 gene | ||||
| rs6046 | G>A | 113773159 | Arg412Gln/Pro/Leu | F: acagtggaggcccacatgccacccactacc R: gggcacgtggtacctgacgggcatcgtcag |
| F13A1 gene | ||||
| rs5985 | C>A | 6318795 | Val35Leu | F: taccttgcaggttgacgccccggggcacca R: gccctgaagctccactgtgggcaggtcatc |
| ITGB3 gene | ||||
| rs5918 | T>C | 45360730 | Leu59Pro | F: tttgggctcctgacttacaggccctgcctc R: gggctcacctcgctgtgacctgaaggagaa |
© 2016 by the authors; licensee MDPI, Basel, Switzerland. This article is an open access article distributed under the terms and conditions of the Creative Commons Attribution (CC-BY) license (http://creativecommons.org/licenses/by/4.0/).
Share and Cite
Ponasenko, A.V.; Khutornaya, M.V.; Kutikhin, A.G.; Rutkovskaya, N.V.; Tsepokina, A.V.; Kondyukova, N.V.; Yuzhalin, A.E.; Barbarash, L.S. A Genomics-Based Model for Prediction of Severe Bioprosthetic Mitral Valve Calcification. Int. J. Mol. Sci. 2016, 17, 1385. https://doi.org/10.3390/ijms17091385
Ponasenko AV, Khutornaya MV, Kutikhin AG, Rutkovskaya NV, Tsepokina AV, Kondyukova NV, Yuzhalin AE, Barbarash LS. A Genomics-Based Model for Prediction of Severe Bioprosthetic Mitral Valve Calcification. International Journal of Molecular Sciences. 2016; 17(9):1385. https://doi.org/10.3390/ijms17091385
Chicago/Turabian StylePonasenko, Anastasia V., Maria V. Khutornaya, Anton G. Kutikhin, Natalia V. Rutkovskaya, Anna V. Tsepokina, Natalia V. Kondyukova, Arseniy E. Yuzhalin, and Leonid S. Barbarash. 2016. "A Genomics-Based Model for Prediction of Severe Bioprosthetic Mitral Valve Calcification" International Journal of Molecular Sciences 17, no. 9: 1385. https://doi.org/10.3390/ijms17091385
APA StylePonasenko, A. V., Khutornaya, M. V., Kutikhin, A. G., Rutkovskaya, N. V., Tsepokina, A. V., Kondyukova, N. V., Yuzhalin, A. E., & Barbarash, L. S. (2016). A Genomics-Based Model for Prediction of Severe Bioprosthetic Mitral Valve Calcification. International Journal of Molecular Sciences, 17(9), 1385. https://doi.org/10.3390/ijms17091385