Abstract
While both the pro- and anti-inflammatory effects of several eicosanoids have been widely studied, the degree of inflammation in cells that results from various eicosanoids has yet to be comprehensively studied. The objective of this study was to assess the effect of lipopolysaccharide (LPS) treatment on eicosanoid content in RAW264.7 cells. An Ultra performance liquid chromatography coupled to tandem mass spectrometry (UPLC-MS/MS)-based profiling method was used to analyze the eicosanoid contents of RAW264.7 cells treated with different LPS concentrations. The profiling data were subjected to statistical analyses, such as principal component analysis (PCA) and hierarchical clustering analysis. LPS treatment increased nitric oxide production and secretion of pro-inflammatory cytokines, such as tumor necrosis factor-α and interleukin-6, in a concentration-dependent manner. In total, 79 eicosanoids were identified in the cells. RAW264.7 cells treated with different LPS concentrations were well differentiated in the PCA score plot. A heatmap was used to identify the eicosanoids that were up- or down-regulated according to the degree of inflammation and LPS concentration. Thirty-nine eicosanoids were upregulated and seven were down-regulated by LPS treatment in a concentration-dependent manner. Our novel UPLC-MS/MS technique can profile eicosanoids, and can evaluate the correlations between inflammation and eicosanoid metabolism.
1. Introduction
Eicosanoids, such as prostaglandins (PGs), leukotrienes (LTs), and a number of hydroxyl and epoxy compounds (Figure 1), are bioactive lipid mediators that play vital roles in physiological and pathophysiological conditions [1,2]. They are key mediators and regulators of inflammation and exert both pro- and anti-inflammatory effects [3,4,5]. Inflammation, a mechanism to protect the host from harmful stimuli, is implicated in the pathogenesis of a number of diseases, including cardiovascular disease, diabetes, allergic diseases, obesity, and cancer [6,7,8,9,10]. Thus, many studies have attempted to identify biomarkers of inflammation, for which the eicosanoids have been targeted as critical metabolites [11,12]. The levels of eicosanoids in biological systems have been assessed to investigate their roles in cell function and pathophysiological events [13,14].
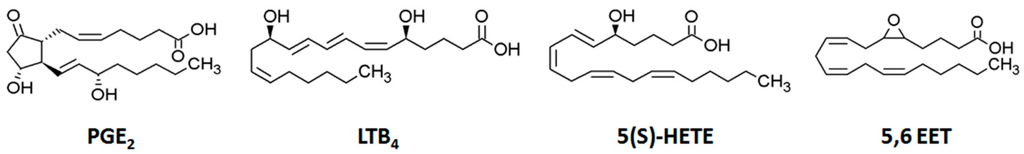
Figure 1.
Chemical structures of typical eicosanoids: prostaglandin E2 (PGE2), leukotriene B4 (LTB4), 5-hydroxy-eicosatetraenoic acid (5(S)-HETE), and 5,6-epoxy-eicosatrienoic acid (5,6 EET).
Enzyme-linked immunosorbent assays (ELISAs) are widely used to quantify eicosanoids [15,16]. However, these assays are limited by the lack of commercially available antibodies and their non-specificity. They are also insufficient for multiplex analyses because a large quantity of sample is required to quantify multiple target compounds. For the simultaneous analysis of diverse eicosanoids in a mixture, chromatographic separation using gas chromatography (GC) or liquid chromatography (LC) has been used [17,18]. However, LC is more applicable to analyze various eicosanoids than GC, which requires derivatization to increase the volatility and thermal stability of compounds. Furthermore, ultraviolet (UV) detection lacks sensitivity and is applicable only to a limited number of UV-light-absorbing analytes [19]. Thus, LC coupled to mass spectrometry (MS)-based techniques have been recently used to profile eicosanoids [20,21,22,23]. Ultra-performance LC (UPLC) with a small-particle-size column provides fast and effective separation of various molecules [24]. Multiple reaction monitoring (MRM) based on tandem MS (MS/MS) is also effective for the sensitive and selective profiling of each molecular species [25]. Finally, UPLC-MS/MS is a good tool for the comprehensive profiling of eicosanoids. Such characterization of eicosanoids may provide insight into their correlations with inflammatory conditions.
Macrophages, which are the major source of various lipid mediators, respond to a variety of stimuli by producing various eicosanoids [26,27]. The RAW264.7 murine macrophage cell line has been used in numerous studies as a model of primary macrophages. Lipopolysaccharide (LPS) induces cytokine production and the acute-phase response, and so has been used extensively in mechanistic studies of inflammation [28,29]. In this study, UPLC-MS/MS was used to profile the eicosanoid content of RAW264.7 cells treated with various concentrations of LPS. The degree of cellular inflammation may differ depending on LPS concentration. The objective of this study was to perform a comprehensive profiling of eicosanoids known to be related to inflammation as well as other less known species in inflammatory cells. The characterization of eicosanoids altered in RAW264.7 cells by different levels of inflammation may help elucidate the correlation between inflammation and eicosanoid metabolism.
2. Results
2.1. Effect of Lipopolysaccharide (LPS) on RAW264.7 Cells
LPS-stimulated RAW264.7 cells were used to elucidate the correlation between inflammation and eicosanoid metabolism. The cells were treated with 0, 1, 10, 100, 1000 ng/mL LPS for 18 h, and monitored under optical microscopy. LPS is known to induce the differentiation of RAW264.7 cells into dendritic-like cells [30,31]. We observed that LPS-activated RAW264.7 cells had a differentiated form with accelerated spreading and forming pseudopodia (Figure 2). Next, the supernatants were subjected to quantification of nitric oxide (NO) and pro-inflammatory cytokine levels. LPS-induced NO production in RAW264.7 cells changed in a concentration-dependent manner (Figure 3A). NO production by cells treated with 1000 ng/mL LPS was 10-fold greater than that of the control. LPS also induced the secretion of pro-inflammatory cytokines, such as tumor necrosis factor-α (TNF-α) and interleukin-6 (IL-6), by RAW264.7 cells in a concentration-dependent fashion (Figure 3B,C). These results showed that LPS activated inflammatory signaling pathways.
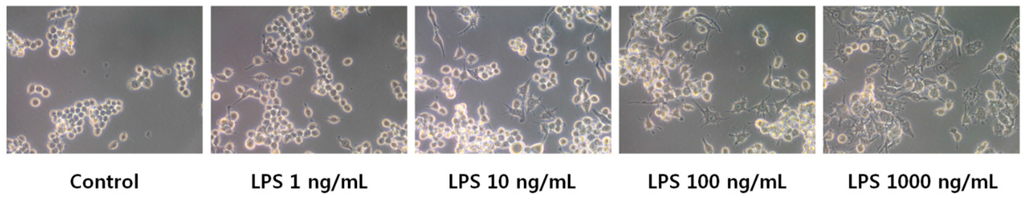
Figure 2.
Morphological changes in RAW264.7 cells treated with 0, 1, 10, 100, and 1000 ng/mL lipopolysaccharide (LPS). The morphology of RAW 264.7 cells was visualized by optical microscopy (400×).
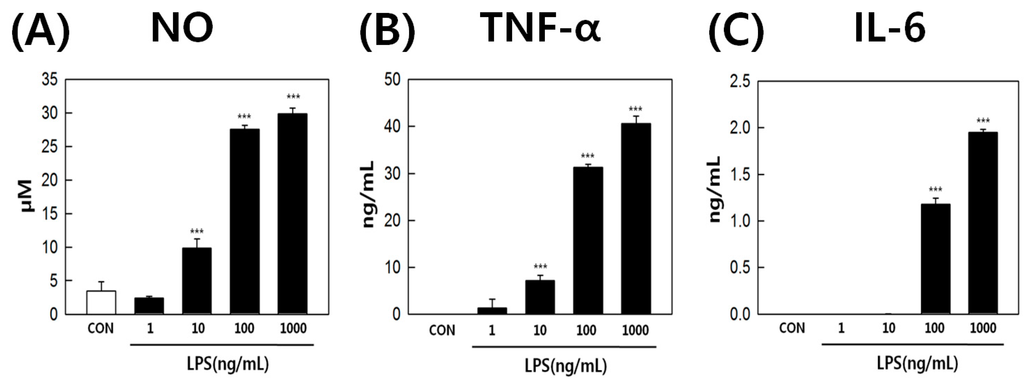
Figure 3.
(A) nitric oxide (NO); (B) tumor necrosis factor-α (TNF-α); and (C) interleukin-6 (IL-6) production by RAW264.7 cells treated with 0, 1, 10, 100, and 1000 ng/mL LPS. *** p value < 0.001.
2.2. Profiling of Eicosanoids by Ultra Performance Liquid Chromatography Coupled to Tandem Mass Spectrometry (UPLC-MS/MS)
To profile the eicosanoid levels in RAW264.7 cells, we established a multiple-reaction monitoring (MRM) method based on UPLC-MS/MS. First, several standards, 5-hydroxy-eicosatetraenoic acid-d8 (5(S)HETE-d8), 14,15-epoxy-eicosatrienoic acid-d11 (14,15EET-d11), leukotriene B4-d4 (LTB4-d4), prostaglandin E2-d4 (PGE2-d4), prostaglandin D2-d4 (PGD2-d4), and arachidonic acid-d8 (AA-d8), were used to optimize the analytical conditions. The adduct ion of each eicosanoid was confirmed by MS scans and were detected primarily as [M ‒ H]− ions by electropray ionization (ESI) in the negative-ion mode. Previously reported MRM transitions for eicosanoids were employed in the current study [32]. Furthermore, source conditions (source temperature (Temp), nebulizer gas (GS1), heater gas (GS2)) and the compound parameters (collision energy (CE) and declustering potential (DP)) of the mass spectrometer were optimized using eicosanoid standards. Table 1 shows the MRM transitions (precursor m/z (Q1) > product m/z (Q3)), DP, and CE of the eicosanoid standards. Use of a UPLC system with a small-particle-size column enabled effective separation of these standards within 25 min at a flow rate of 0.5 mL/min (Figure 4).

Table 1.
Optimized multiple-reaction monitoring (MRM) conditions for eicosanoid standards.
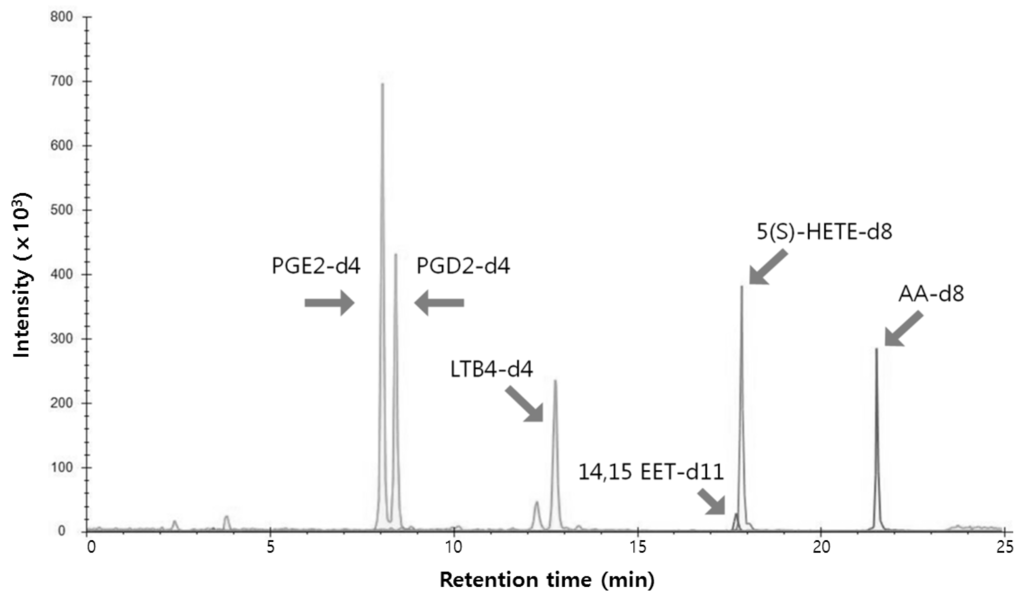
Figure 4.
Merged multiple reaction monitoring data of six standards—PGE2-d4, PGD2-d4, LTB4-d4, 14,15-EET-d11, 5(S)-HETE-d8, and AA-d8.
Next, the performance of eicosanoid analyses based on MRM was validated (Table 2). Each eicosanoid standard was analyzed six times and the relative standard deviations (RSDs) (%) were calculated. The RSDs (%) of the relative RTs and the relative peak areas were less than 0.3% and 8%, respectively. This method showed a high degree of reproducibility and the correlation coefficient (R2) for each eicosanoid analysis was at least 0.9959, indicating a high degree of reliability. The limit of detection (LOD) and the limit of quantification (LOQ) of the eicosanoid standards are also shown. With the exception of 14,15-EET-d11, the LC/MS method exhibited sufficient sensitivity for the standards. Thus, in the analysis of biological samples, a higher concentration of 14,15-EET-d11 was required for its use as an internal standard (IS).
Table 2.
Validation of the eicosanoid profiling method based on UPLC-MS/MS and the LOD and LOQ of each compound.
2.3. Quantification of Eicosanoids in LPS-Treated RAW264.7 Cells
The above UPLC/MS/MS-based method was used to quantify eicosanoids in RAW264.7 cells treated with 0, 1, 10, 100, and 1000 ng/mL LPS. Assays were performed in triplicate for each LPS concentration. Eicosanoids were extracted using 10% methanol. In this study, a total of 150 MRM transitions were used to profile eicosanoids. A total of 79 eicosanoids were identified in RAW264.7 cells (Table 3). To ensure reliable quantification, we used deuterated compounds, including 5(S)-HETE-d8, 14,15-EET-d11, AA-d8, LTB4-d4, and PGE2-d4, as ISs to normalize the data. The normalized data (peak areas of compounds/peak area of IS) were subjected to statistical analyses.
Table 3.
Eicosanoids identified in RAW264.7 cells.
First, we applied principal component analysis (PCA) [33,34] to differentiate the RAW264.7 cells treated with various LPS concentrations. This resulted in effective separation in the corresponding PCA score plot (Figure 5). Each point represents an individual sample and the scatter of samples indicates similarities or differences in eicosanoid composition. Samples treated with 0, 1, and 10 ng/mL LPS were scattered on the lower side of the plot and those treated with 100 and 1000 ng/mL LPS were scattered on the upper side. The degree of inflammation increased with increasing LPS concentration. This demonstrated that eicosanoid contents differ depending on the degree of inflammation.
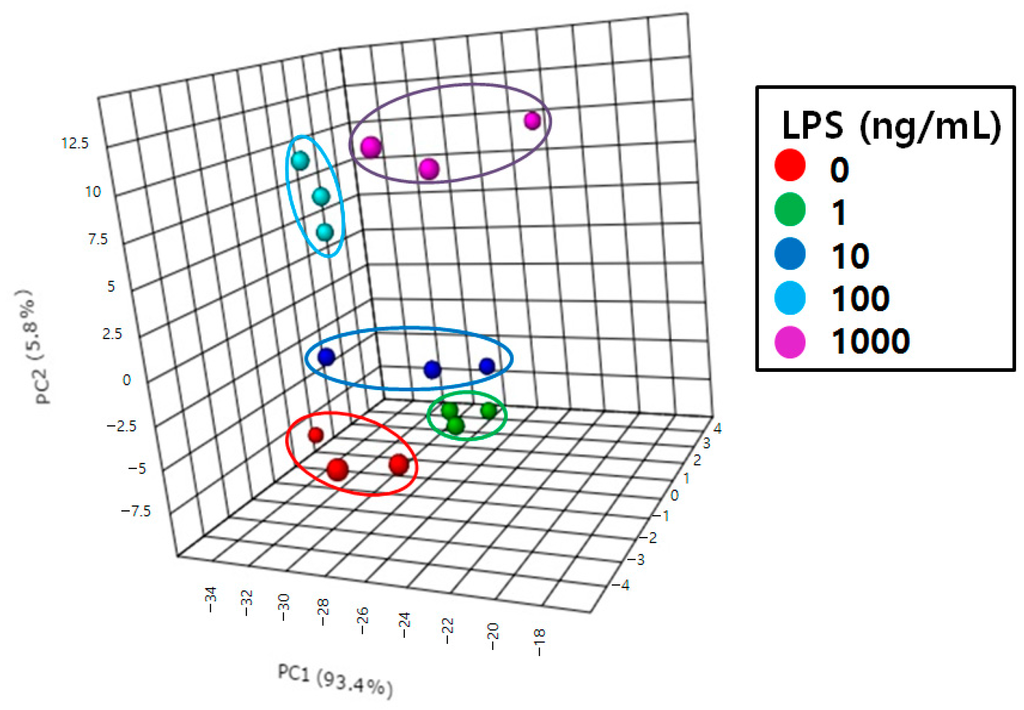
Figure 5.
Principal component analysis (PCA) score plot of RAW264.7 cells treated with 0, 1, 10, 100, and 1000 ng/mL LPS.
Second, changes in the levels of 79 eicosanoids can be described in a heatmap (Figure 6). This hierarchical clustering enabled effective differentiation of the five groups. Several of the 79 eicosanoid species were upregulated by treatments with 100 and 1000 ng/mL LPS. In contrast, the levels of other eicosanoids decreased with increasing LPS concentration. The levels of still other species were not correlated with LPS concentration. Therefore, up- and down-regulation of eicosanoids were associated with LPS-induced inflammation.
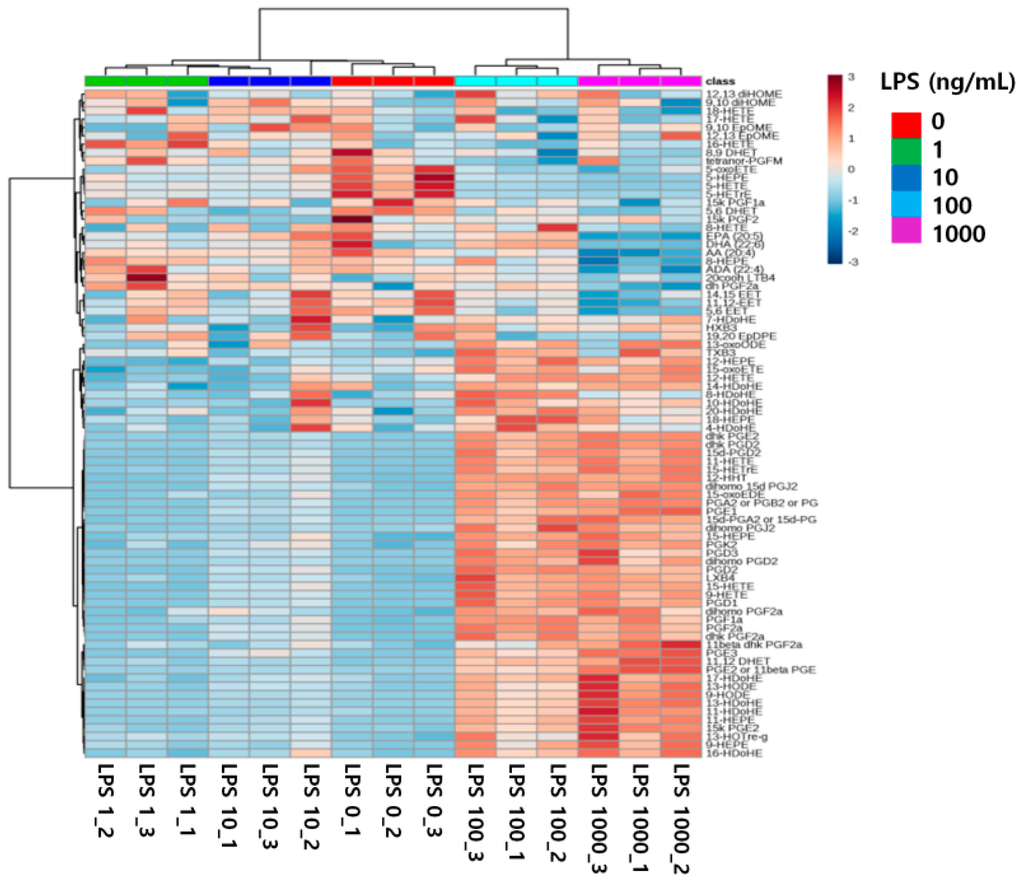
Figure 6.
Hierarchical clustering of 79 eicosanoid datasets from RAW264.7 cells treated with 0, 1, 10, 100, and 1000 ng/mL LPS.
3. Discussion
To evaluate altered eicosanoid metabolism in RAW264.7 cells, we focused on the pathway of eicosanoid synthesis from AA (Figure 7). Several PGs, such as PGD2, PGE2, and PGF2α, are synthesized from AA by cyclooxygenase (COX)-1 and COX-2. Furthermore, 15-HETE is synthesized from AA by 15-lipoxygenase (LOX). In addition, 12-LOX and 5-LOX also synthesize 12-HETE and 5-HETE, respectively, from AA. Our results showed that AA was down-regulated following treatment with high concentrations of LPS. This indicated that AA was used as the substrate to synthesize several eicosanoids. PGE2, which plays a pro-inflammatory role [35,36], was upregulated following treatment with high concentrations of LPS. In contrast, two other PGs (PGE2 and PGF2α) and 15-HETE were upregulated. In addition, 12-HETE was upregulated slightly and 5-HETE was down-regulated following treatments with high concentrations of LPS. Therefore, COX-1, COX-2, and 15-LOX were highly activated by LPS-induced inflammation, whereas 12-LOX was only slightly activated and 5-LOX was suppressed.
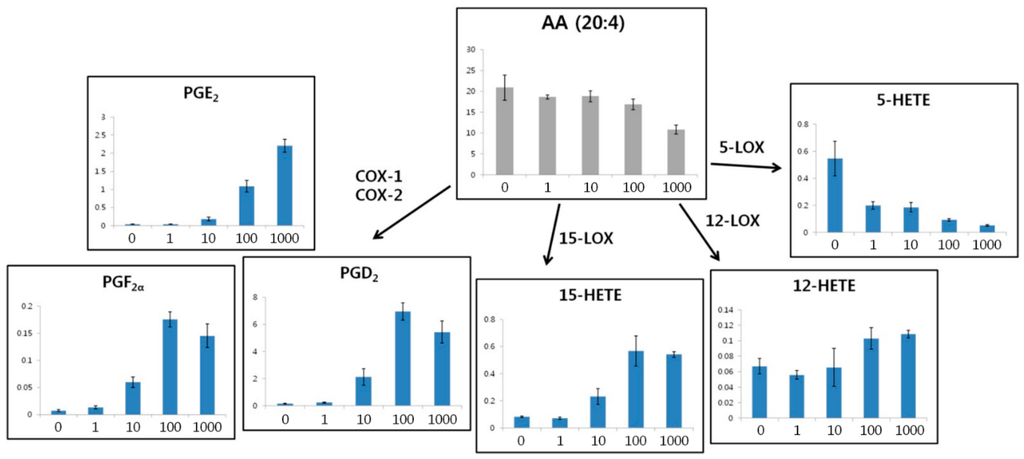
Figure 7.
The eicosanoid synthesis pathway from arachidonic acid (AA) and eicosanoid levels in RAW264.7 cells as a function of LPS concentration (0, 1, 10, 100, and 1000 ng/mL). COX, cyclooxygenase; LOX, lipoxygenase; PG, prostaglandin; HETE, hydroxyeicosatetraenoic acid.
Many previous studies have reported the utility of various eicosanoid species as biomarkers for diseases and pathophysiological conditions [11,37,38,39]. For example, the endogenous levels of AA, PGE2, and 12-HETE were significantly altered in cancerous mucosae [40]. This indicates that inflammation is correlated with tumorigenesis. Rago et al. [41] also reported the quantities of several eicosanoids in human plasma to develop biomarkers to distinguish three groups: healthy individuals, hypertensive patients, and severe atherosclerotic patients. The results showed that lower levels of 8-HETE, LTB4, 9-HODE, and 13-HODE are potential biomarkers for severe heart disease. Eicosanoid metabolism may differ depending on biological samples and pathophysiological events. However, the detailed metabolism of major and minor eicosanoids in human diseases that involve inflammation has yet to be studied.
To characterize eicosanoid metabolism in inflammatory cells, comprehensive profiling of various eicosanoids is required. In this study, we evaluated changes in the levels of not only known eicosanoids related to inflammation but also other, less well-known species. The following 39 eicosanoids were upregulated following treatment with high concentrations of LPS: (1) eicosanoids derived from AA: 9-HETE, 11-HETE, 12-HETE, 15-HETE, 11,12-DHET, 12-HHT, PGA2, PGD2, PGE2, PGF2α, dihomo PGD2, dihomo PGF2α, dihomo PGJ2, dihomo 15d PGJ2, 15d-PGA2, 15d-PGD2, 11β dhk PGF2α, dhk PGD2, dhk PGE2, PGK2, 15k PGF2, and LXB4; (2) eicosanoids derived from linoleic acid: 9-HODE, and 13-HODE; (3) eicosanoids derived from eicosapentaenoic acid: 9-HEPE, 11-HEPE, 15-HEPE, 15-oxoEDE, PGD3, and PGE3; (4) eicosanoids derived from docohexaenoic acid: 11-HDoHE, 13-HDoHE, 16-HDoHE, and 17-HDoHE; (5) eicosanoids derived from gamma-linoleic acid: 13-HOTre-g; and (6) eicosanoids derived from dihomo-gamma-linoleic acid: 15-HETrE, PGD1, PGE1, and PGF1α. The following seven eicosanoids were down-regulated following treatments with high concentrations of LPS: (1) eicosanoids derived from AA: 5-HETE, 5,6-DHET, 5,6-EET, and 11,12-EET; (2) eicosanoids derived from eicosapentaenoic acid: 5-HEPE; and (3) eicosanoids derived from dihomo-gamma-linoleic acid: 5-HETrE. Other eicosanoid species were not influenced by LPA treatment in a concentration-dependent manner.
In conclusion, a profiling method based on UPLC-MS/MS was used to characterize the effect of LPS treatment on eicosanoid metabolism in RAW264.7 cells. The degree of inflammation increased with increasing LPS concentration. A total of 79 eicosanoids were identified in RAW264.7 cells. PCA and heatmap generation were used to differentiate RAW264.7 cells treated with different concentrations of LPS. The five groups were well separated in the PCA score plot, and the heatmap was used to identify the up- or downregulation of eicosanoids according to LPS concentration. To our knowledge, this study is the first attempt to assess the levels of cellular eicosanoids altered by the degree of inflammation. A total of 39 eicosanoids were upregulated, and seven were down-regulated by LPS treatment in a concentration-dependent manner. Our novel UPLC-MS/MS technique has the potential for eicosanoid profiling and evaluating correlations between inflammation and eicosanoid metabolism. The eicosanoids up- or down-regulated by LPS can be applied as typical biomarkers for inflammation. In the future, the levels of inflammation-related eicosanoids in biological samples are needed to estimate their roles in cell function and pathophysiological events.
4. Materials and Methods
4.1. Reagents
HPLC-grade water, methanol, acetonitrile, and isopropyl alcohol were purchased from J.T. Baker (Avantor Performance Material, Inc., Center Valley, PA, USA). Acetic acid and ammonium acetate were obtained from Sigma-Aldrich (St. Louis, MO, USA). The eicosanoid standards were as follows: 14,15-EET-d11, 5(S)HETE-d8, LTB4-d4, PGE2-d4, PGD2-d4, and AA-d8 (Cayman Chemical, Ann Arbor, MI, USA). A Strata-x 33-µm polymerized solid reverse-phase extraction column (cat # 8B-S100-UBJ) was purchased from Phenomenex (Torrance, CA, USA). Dulbecco’s modified Eagle’s medium (DMEM), fetal bovine serum (FBS), penicillin-streptomycin, and trypsin-ethylenediaminetetraacetic acid (EDTA) were purchased from HyClone Laboratories Inc. (Logan, UT, USA). Escherichia coli LPS and Griess reagent were obtained from Sigma Chemical Co. (St Louis, MO, USA).
4.2. Cell Culture and LPS Treatment
Murine macrophage RAW264.7 cells (KCLB 40071; Korean Cell Line Bank, Seoul, Korea) were cultured in DMEM containing 10% heat-inactivated FBS, 100 U/mL penicillin, and 100 µg/mL streptomycin in a humidified atmosphere with 5% CO2 at 37 °C. Cells were seeded in a 100-mm Petri dish, cultured for 24 h, and incubated for a further 18 h after treatment with 100 µL LPS (0, 1, 10, 100, and 1000 ng/mL). Cell pellets were collected from each culture dish and the cells were enumerated using a hemocytometer. Finally, 1 × 10⁷ cells were used in the analyses.
4.3. Nitric Oxide (NO) and Enzyme-Linked Immunosorbent Assays (ELISAs) Analyses
NO concentrations in the culture supernatants were determined using a spectrophotometric assay based on the Griess reaction. A calibration curve was constructed using known concentrations (0–100 µM) of sodium nitrite. Levels of proinflammatory cytokines such as TNF-α and IL-6 were analyzed using commercial ELISA kits (BD Biosciences, San Diego, CA, USA) according to the manufacturer’s instructions.
4.4. Sample Preparation
A simple solid-phase extraction method was applied for the extraction of eicosanoids [25]. Cells were resuspended in 1 mL of 10% methanol in water (v/v) and sonicated for 5 min. Samples were then spiked with 10 ng of deuterated internal standards. Eicosanoids were extracted using Strata-x 33-µm polymerized solid reverse-phase extraction columns. Briefly, the columns were activated with 3.5 mL of 100% methanol followed by 3.5 mL of water for equilibration. After loading the samples, the columns were washed with 3.5 mL of 10% methanol in water to remove non-specific-binding metabolites. Eicosanoids were eluted into 1 mL methanol. The eluted samples were dried using a Speed-Vac concentrator (Labconco, Kansas City, MO, USA) and resuspended in 90 µL of Solvent A, as described below. The samples were stored at −80 °C until analysis.
4.5. UPLC-MS/MS Conditions
The UPLC analyses were performed on a Waters ACQUITY UPLC instrument (Waters Corp., Milford, MA, USA). The temperature of the column oven and autosampler were set at 40 and 4 °C, respectively. An Acquity BEH300 C18 column (2.1 × 150 mm ID; 1.7 µm; Waters Corp.) was used for the separation of eicosanoids. Solvent A consisted of water/acetonitrile/acetic acid (70:30:0.02; v/v/v) and solvent B of acetonitrile/isopropyl alcohol (50:50, v/v). The gradient elution program was as follows: 0–1 min, B 0%; 1–3 min, B 0%–25%; 3–11 min, B 25%–45%; 11–13 min, B 45%–60%; 13–18 min, B 60%–75%; 18–18.5 min, B 75%–90%; 18.5–20 min, B 90%; and 20–21 min, B 90%–0%. The column was equilibrated with 0% Solvent B for 4 min prior to analysis of the next sample. The total run time was 25 min for each analysis. The flow rate was 0.5 mL/min and the injection volume was 40 µL for each run.
For the MS analyses, an ABI/Sciex (Foster City, CA, USA) 5500 QTRAP hybrid, triple quadrupole, linear ion trap mass spectrometer equipped with a Turbo V ion source, together with the Analyst 1.5.1 software package (ABI/Sciex, Foster City, CA, USA), was used. Ultra-pure nitrogen gas was used as the collision gas for eicosanoids. The typical operating source conditions for the analysis of eicosanoids in negative ion ESI mode were optimized using deuterated standards as follows: curtain gas (CUR) = 10 psi, GS1 = 30 psi, GS2 = 30 psi, ionspray voltage (IS) = −4500 V, collision gas setting (CAD) = high, Temp = 525 °C, Ihe = on, entrance potential (EP) = −10 V, and collision cell exit potential (CXP) = −10 V.
4.6. Validation Study
External standard curves were established from the analysis of mixed eicosanoid standards at 16 different concentrations (0.1, 0.3, 0.6, 1, 3, 6, 10, 30, 60, 100, 300, 600, 1000, 3000, 6000, and 10,000 pg). In the case of 14,15 EET-d11, seven different concentrations (1000, 3000, 6000, 10,000, 30,000, 60,000, and 100,000 pg) were applied. The LOD, LOQ, linear ranges, and correlation (R2) values were determined by the external standard curve. The RSDs (%) of the relative RTs and the relative peak areas were estimated after six replicate analyses of 3000 pg of each standard.
4.7. Data Processing and Statistical Analysis
LC-MS data were obtained using the Analyst 1.5.1 software package (ABI/Sciex, Foster City, CA, USA). Eicosanoid peaks were assigned by comparisons of retention times with those of the internal standards. The Skyline software package (MacCoss Laboratory, University of Washington, Seattle, WA, USA) was used as an in-house database to determine the peak area of each assigned lipid from replicate raw data. The extracted peak areas of lipid peaks were normalized to the appropriate internal standard [42]. Hierarchical clustering of the quantified eicosanoids and PCA analyses was performed on the MetaboAnalyst web site [43].
Acknowledgments
This work was carried out with the support of the “Cooperative Research Program for Agriculture Science & Technology Development (Project No. PJ01135001)” Rural Development Administration, Korea.
Author Contributions
Jae Won Lee and Hyung Don Kim conceived and designed the experiments; Hyuck Jun Mok, Seung Chul Park, Myeong Soon Ban, and Jehun Choi performed the experiments; Jae Won Lee, Hyuck Jun Mok, and Seung Chul Park analyzed the data; Dae-Young Lee, Chun Geon Park, Young-Sup Ahn, and Kwang Pyo Kim contributed the reagents/materials/analysis tools; Jae Won Lee, Hyung Don Kim, and Hyuck Jun Mok wrote the paper.
Conflicts of Interest
The authors declare no conflicts of interest. The founding sponsors had no role in the design of the study; collection, analyses, or interpretation of the data; writing of the manuscript; or decision to publish the results.
Abbreviations
| LPS | Lipopolysaccharide |
| UPLC | Ultra performance liquid chromatography |
| MS | Mass spectrometry |
| PG | Prostaglandin |
| LT | Leukotriene |
| ELISA | Enzyme-linked immunosorbent assays |
| NO | Nitric oxide |
| TNF-α | Tumor necrosis factor-α |
| IL-6 | Interleukin-6 |
| MRM | Multiple reaction monitoring |
| CE | Collision energy |
| DP | Declustering potential |
| RSD | Relative standard deviation |
| LOD | The limit of detection |
| LOQ | The limit of quantification |
| IS | Internal standard |
| PCA | Principal component analysis |
| EDTA | Ethylenediaminetetraacetic acid |
References
- Sellmayer, A.; Koletzko, B. Long-chain polyunsaturated fatty acids and eicosanoids in infants—Physiological and pathophysiological aspects and open questions. Lipids 1999, 34, 199–205. [Google Scholar] [CrossRef] [PubMed]
- Funk, C.D. Prostaglandins and leukotrienes: Advances in eicosanoid biology. Science 2001, 294, 1871–1875. [Google Scholar] [CrossRef] [PubMed]
- Serhan, C.N.; Chiang, N.; van Dyke, T.E. Resolving inflammation: Dual anti-inflammatory and pro-resolution lipid mediators. Nat. Rev. Immunol. 2008, 8, 349–361. [Google Scholar] [CrossRef] [PubMed]
- Harizi, H.; Corcuff, J.B.; Gualde, N. Arachidonic-acid-derived eicosanoids: Roles in biology and immunopathology. Trends Mol. Med. 2008, 14, 461–469. [Google Scholar] [CrossRef] [PubMed]
- Williams, K.I.; Higgs, G.A. Eicosanoids and inflammation. J. Pathol. 1988, 156, 101–110. [Google Scholar] [CrossRef] [PubMed]
- Libby, P. Inflammation and cardiovascular disease mechanisms. Am. J. Clin. Nutr. 2006, 83, 456S–460S. [Google Scholar] [PubMed]
- Hartge, M.M.; Unger, T.; Kintscher, U. The endothelium and vascular inflammation in diabetes. Diabetes Vasc. Dis. Res. 2007, 4, 84–88. [Google Scholar] [CrossRef] [PubMed]
- Galli, S.J.; Tasi, M.; Piliponsky, A.M. The development of allergic inflammation. Nature 2008, 454, 445–454. [Google Scholar] [CrossRef] [PubMed]
- Lakoski, S.G.; Cushman, M.; Siscovick, D.S.; Blumenthal, R.S.; Palmas, W.; Burke, G.; Herrington, D.M. The relationship between inflammation, obesity and risk for hypertension in the Multi-Ethnic Study of Atherosclerosis (MESA). J. Hum. Hypertens. 2011, 25, 73–79. [Google Scholar] [CrossRef] [PubMed]
- Wang, D.; DuBois, R.N. Eicosanoids and cancer. Nat. Rev. Cancer 2010, 10, 181–193. [Google Scholar] [CrossRef] [PubMed]
- Ferreiro-Vera, C.; Mata-Granados, J.M.; Priego-Capote, F.; Quesada-Gomez, J.M.; Luque de Castro, M.D. Automated targeting analysis of eicosanoid inflammation biomarkers in human serum and in the exometabolome of stem cells by SPE-LC-MS/MS. Anal. Bioanal. Chem. 2011, 399, 1093–1103. [Google Scholar] [CrossRef] [PubMed]
- Norwood, S.; Liao, J.; Hammock, B.D.; Yang, G.Y. Epoxyeicosatrienoic acids and soluble epoxide hydrolase: Potential therapeutic target for inflammation and its induced carcinogenesis. Am. J. Transl. Res. 2010, 2, 447–457. [Google Scholar] [PubMed]
- Birney, Y.; Redmond, E.M.; Sitzmann, J.V.; Cahill, P.A. Eicosanoids in cirrhosis and portal hypertension. Prostaglandins Other Lipid Mediat. 2003, 72, 3–18. [Google Scholar] [CrossRef]
- Harizi, H.; Grosset, C.; Gualde, N. Prostaglandin E2 Modulates dendritic cell function via EP2 and EP4 receptor subtypes. J. Leukoc. Biol. 2003, 73, 1–8. [Google Scholar] [CrossRef]
- Miller, D.K.; Sadowski, S.; DeSousa, D.; Maycock, A.L.; Lombardo, D.L.; Young, R.N.; Hayes, E.C. Development of enzyme-linked immunosorbent assays for measurement of leukotrienes and prostaglandins. J. Immunol. Methods 1985, 81, 169–185. [Google Scholar] [CrossRef]
- Mazid, M.A.; Nishimura, K.; Nagao, K.; Jisaka, M.; Nagaya, T.; Yokota, K. Development of enzyme-linked immunosorbent assay for prostaglandin D2 using the stable isosteric analogue as a hapten mimic and its application. Prostaglandins Other Lipid Mediat. 2007, 83, 219–224. [Google Scholar] [CrossRef] [PubMed]
- Alber, D.; Moussard, C.; Toubin, M.; Henry, J.C.; Ottignon, Y.; Deschamps, J.P. Gas chromatographic/mass spectrometric quantitative analysis of eicosanoids in human oesophageal mucosa. Biomed. Environ. Mass Spectrom. 1988, 16, 299–304. [Google Scholar] [CrossRef] [PubMed]
- Deems, R.; Buczynski, M.W.; Bowers-Gentry, R.; Harkewicz, R.; Dennis, E.A. Detection and quantitation of eicosanoids via high performance liquid chromatography-electrospray ionization-mass spectrometry. Methods Enzymol. 2007, 432, 59–82. [Google Scholar] [PubMed]
- Wan, G.H.; Yan, D.C.; Tseng, H.Y.; Lee, J.T.; Lin, Y.W. Using high-performance liquid chromatography with UV detector to quantify exhaled leukotriene B4 level in nonatopic adults. J. Formos. Med. Assoc. 2014, 113, 566–568. [Google Scholar] [CrossRef] [PubMed]
- Kita, Y.; Takahashi, T.; Uozumi, N.; Shimizu, T. A multiplex quantitation method for eicosanoids and platelet-activating factor using column-switching reversed-phase liquid chromatography-tandem mass spectrometry. Anal. Biochem. 2005, 342, 134–143. [Google Scholar] [CrossRef] [PubMed]
- Martin-Venegas, R.; Jauregui, O.; Moreno, J.J. Liquid chromatography-tandem mass spectrometry analysis of eicosanoids and related compounds in cell models. J. Chromatogr. B 2014, 964, 41–49. [Google Scholar] [CrossRef] [PubMed]
- Paolo, M. LC/MS/MS analysis of leukotriene B4 and other eicosanoids in exhaled breath condensate for assessing lung inflammation. J. Chromatogr. B 2009, 877, 1272–1280. [Google Scholar]
- Kingsley, P.J.; Marnett, L.J. LC-MS-MS analysis of neutral eicosanoids. Methods Enzymol. 2007, 433, 91–112. [Google Scholar] [PubMed]
- Wang, Y.; Armando, A.M.; Quehenberger, O.; Yan, C.; Dennis, E.A. Comprehensive ultra-performance liquid chromatographic separation and mass spectrometric analysis of eicosanoid metabolites in human samples. J. Chromatogr. A 2014, 1359, 60–69. [Google Scholar] [CrossRef] [PubMed]
- Kortz, L.; Dorow, J.; Ceglarek, U. Liquid chromatography-tandem mass spectrometry for the analysis of eicosanoids and related lipids in human biological matrices: A review. J. Chromatogr. B Anal. Technol. Biomed. Life Sci. 2014, 964, 1–11. [Google Scholar] [CrossRef] [PubMed]
- Norris, P.C.; Dennis, E.A. A lipid perspective on inflammatory macrophage eicosanoid signaling. Adv. Biol. Regul. 2014, 54, 99–110. [Google Scholar] [CrossRef] [PubMed]
- Trebino, C.E.; Eskra, J.D.; Wachtmann, T.S.; Perez, J.R.; Carty, T.J.; Audoly, L.P. Redirection of eicosanoid metabolism in mPGES-1-deficient macrophages. J. Biol. Chem. 2005, 280, 16579–16585. [Google Scholar] [CrossRef] [PubMed]
- Bromfield, J.J.; Sheldon, I.M. Lipopolysaccharide initiates inflammation in bovine granulosa cells via the TLR4 pathway and perturbs oocyte meiotic progression in vitro. Endocrinology 2011, 152, 5029–5040. [Google Scholar] [CrossRef] [PubMed]
- Djoko, B.; Chiou, R.Y.Y.; Shee, J.J.; Liu, Y.W. Characterization of immunological activities of peanut stilbenoids, arachidin-1, piceatannol, and resveratrol on lipopolysaccharide-induced inflammation of RAW264.7 macrophages. J. Agric. Food Chem. 2007, 55, 2376–2383. [Google Scholar] [CrossRef] [PubMed]
- Saxena, R.K.; Vallyathan, V.; Lewis, D.M. Evidence for lipopolysaccharide-induced differentiation of RAW264.7 murine macrophage cell line into dendritic like cells. J. Biosci. 2003, 28, 129–134. [Google Scholar] [CrossRef] [PubMed]
- Kang, S.R.; Han, D.Y.; Park, K.I.; Park, H.S.; Cho, Y.B.; Lee, H.J.; Lee, W.S.; Ryu, C.H.; Ha, Y.L.; Lee, D.H.; et al. Suppressive effect on lipopolysaccharide-induced proinflammatory mediators by Citrus aurantium L. in macrophage RAW264.7 cells via NF-κB signal pathway. Evid. Based Complement. Altern. Med. 2011, 2011, 1–12. [Google Scholar]
- Dumlao, D.S.; Buczynski, M.W.; Norris, P.C.; Harkewicz, R.; Dennis, E.A. High-throughput lipidomic analysis of fatty acid derived eicosanoids and N-acylethanolamines. Biochim. Biophys. Acta 2011, 1811, 724–736. [Google Scholar] [CrossRef] [PubMed]
- Worley, B.; Halouska, S.; Powers, R. Utilities for quantifying separation in PCA/PLS-DA scores plots. Anal. Biochem. 2013, 433, 102–104. [Google Scholar] [CrossRef] [PubMed]
- Nyamundanda, G.; Brennan, L.; Gormley, I.C. Probabilistic principal component analysis for metabolomic data. BMC Bioinform. 2010, 11. [Google Scholar] [CrossRef] [PubMed]
- Almer, G.; Teismann, P.; Stevic, Z.; Halaschek-Wiener, J.; Deecke, L.; Kostic, V.; Przedborski, S. Increased levels of the pro-inflammatory prostaglandin PGE2 in CSF from ALS patients. Neurology 2001, 58, 1277–1279. [Google Scholar] [CrossRef]
- Kuehl, F.A.; Egan, R.W. Prostaglandins, arachidonic acid, and inflammation. Science 1980, 210, 978–984. [Google Scholar] [CrossRef] [PubMed]
- Higashi, N.; Mita, H.; Ono, E.; Fukutomi, Y.; Yamaguchi, H.; Kajiwara, K.; Tanimoto, H.; Sekiya, K.; Akiyama, K.; Taniguchi, M. Profile of eicosanoid generation in aspirin-intolerant asthma and anaphylaxis assessed by new biomarkers. J. Allergy Clin. Immunol. 2010, 125, 1084–1091. [Google Scholar] [CrossRef] [PubMed]
- Ecker, J. Profiling eicosanoids and phospholipids using LC-MS/MS: Principles and recent applications. J. Sep. Sci. 2012, 35, 1227–1235. [Google Scholar] [CrossRef] [PubMed]
- Drozdovszky, O.; Barta, I.; Antus, B. Sputum eicosanoid profiling in exacerbations of chronic obstructive pulmonary disease. Respiration 2014, 87, 408–415. [Google Scholar] [CrossRef] [PubMed]
- Mal, M.; Koh, P.K.; Cheah, P.Y.; Chan, E.C.Y. Ultra-pressure liquid chromatography/tandem mass spectrometry targeted profiling of arachidonic acid and eicosanoids in human colorectal cancer. Rapid Commun. Mass Spectrom. 2011, 25, 755–764. [Google Scholar] [CrossRef] [PubMed]
- Rago, B.; Fu, C. Development of a high-throughput ultra performance liquid chromatography-mass spectrometry assay to profile 18 eicosanoids as exploratory biomarkers for atherosclerotic diseases. J. Chromatogr. B 2013, 936, 25–32. [Google Scholar] [CrossRef] [PubMed]
- Han, X.; Yang, K.; Gross, R.W. Multi-dimensional mass spectrometry-based shotgun lipidomics and novel strategies for lipidomic analyses. Mass Spectrom. Rev. 2012, 31, 134–178. [Google Scholar] [CrossRef] [PubMed]
- MetaboAnalyst 3.0—A Comprehensive Tool Suite for Meabolomic Data Analysis. Avaliable online: http://www.metaboanalyst.ca (accessed on 1 April 2016).
© 2016 by the authors; licensee MDPI, Basel, Switzerland. This article is an open access article distributed under the terms and conditions of the Creative Commons by Attribution (CC-BY) license (http://creativecommons.org/licenses/by/4.0/).