
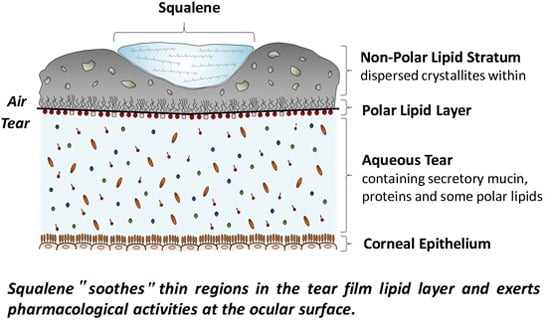
Surface Properties of Squalene/Meibum Films and NMR Confirmation of Squalene in Tears

 ,
, 
Abstract
:
1. Introduction

2. Results
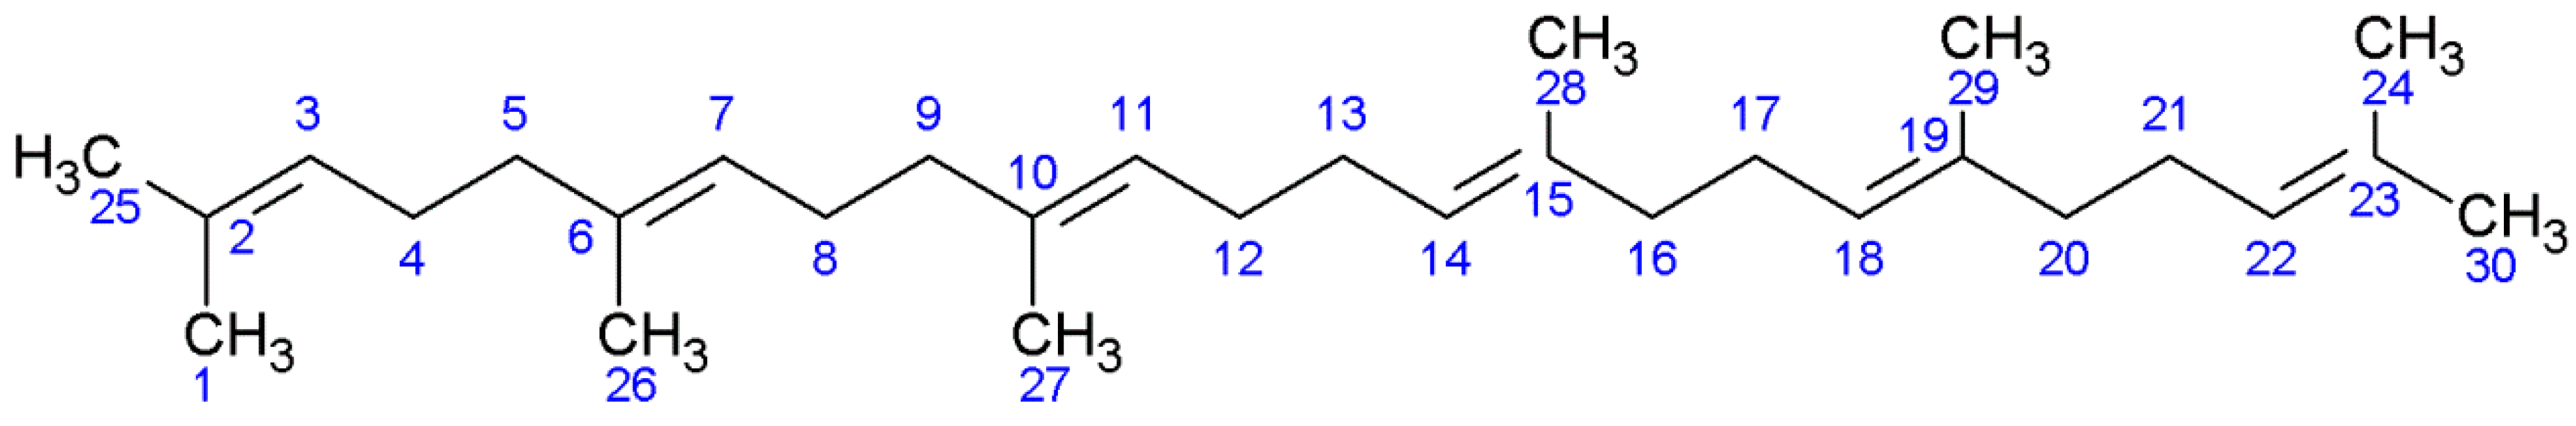
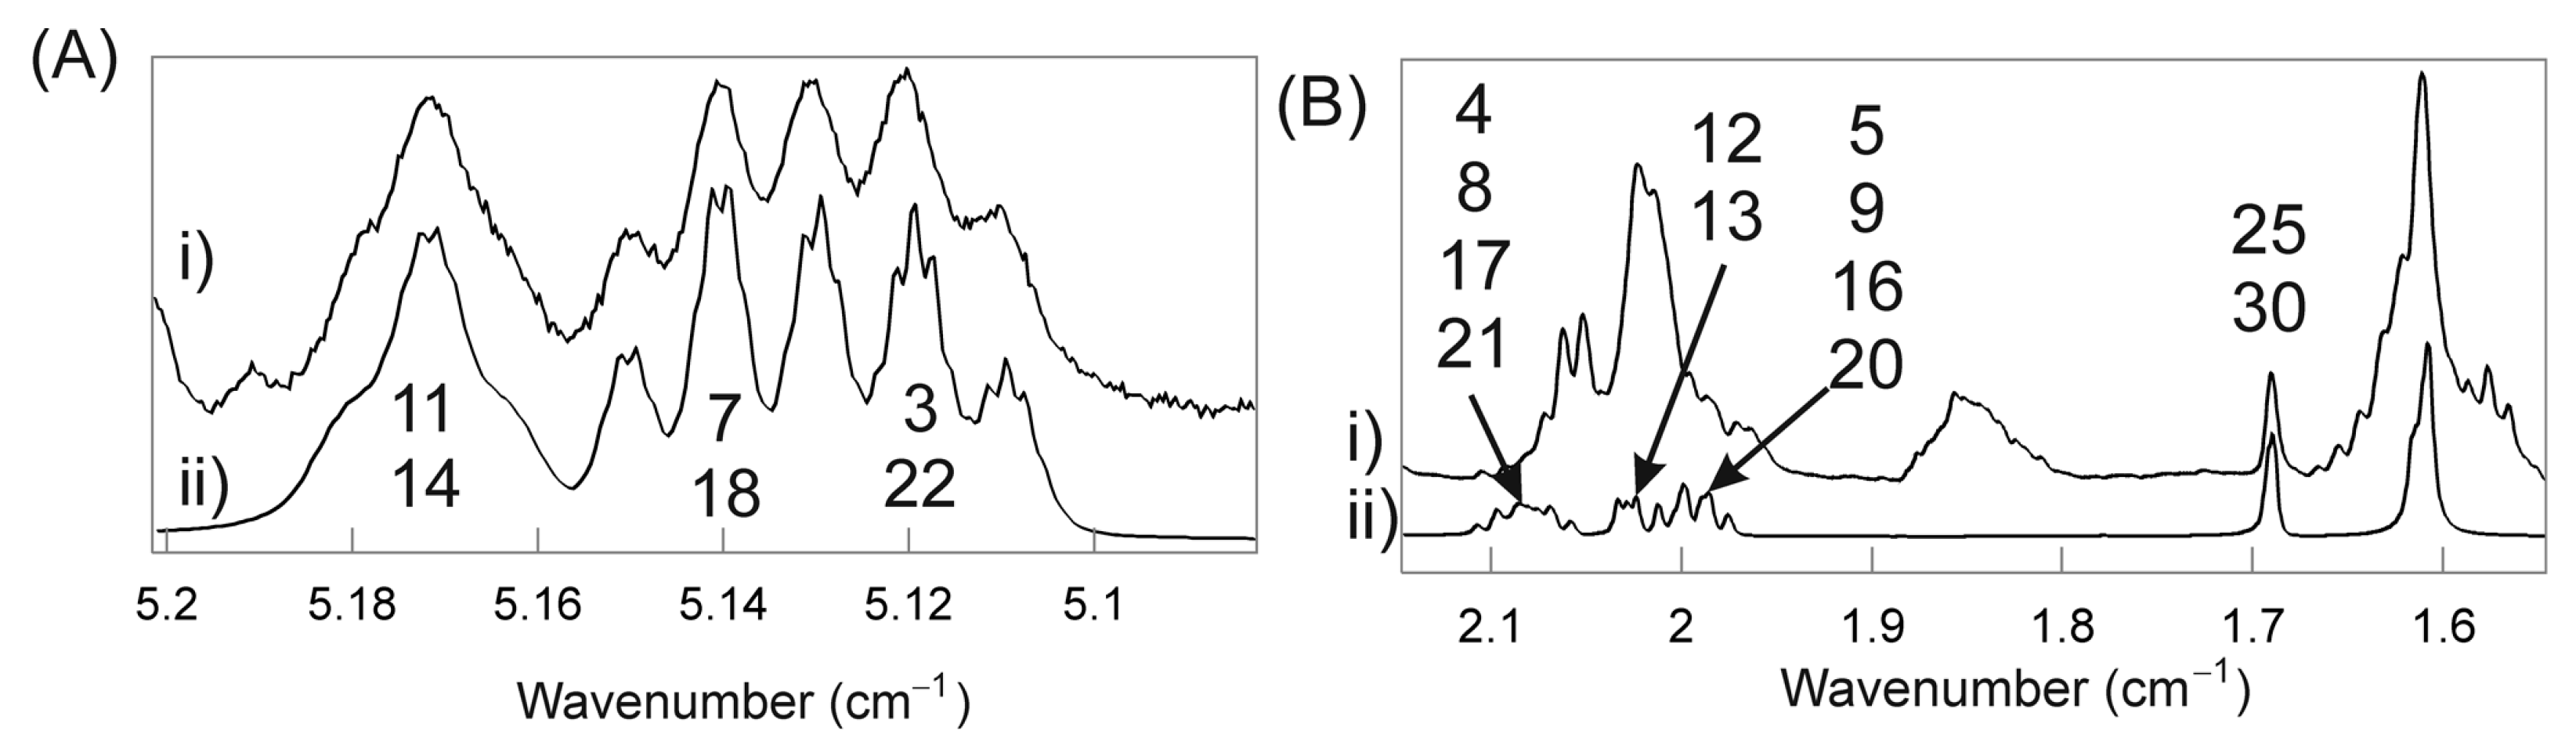
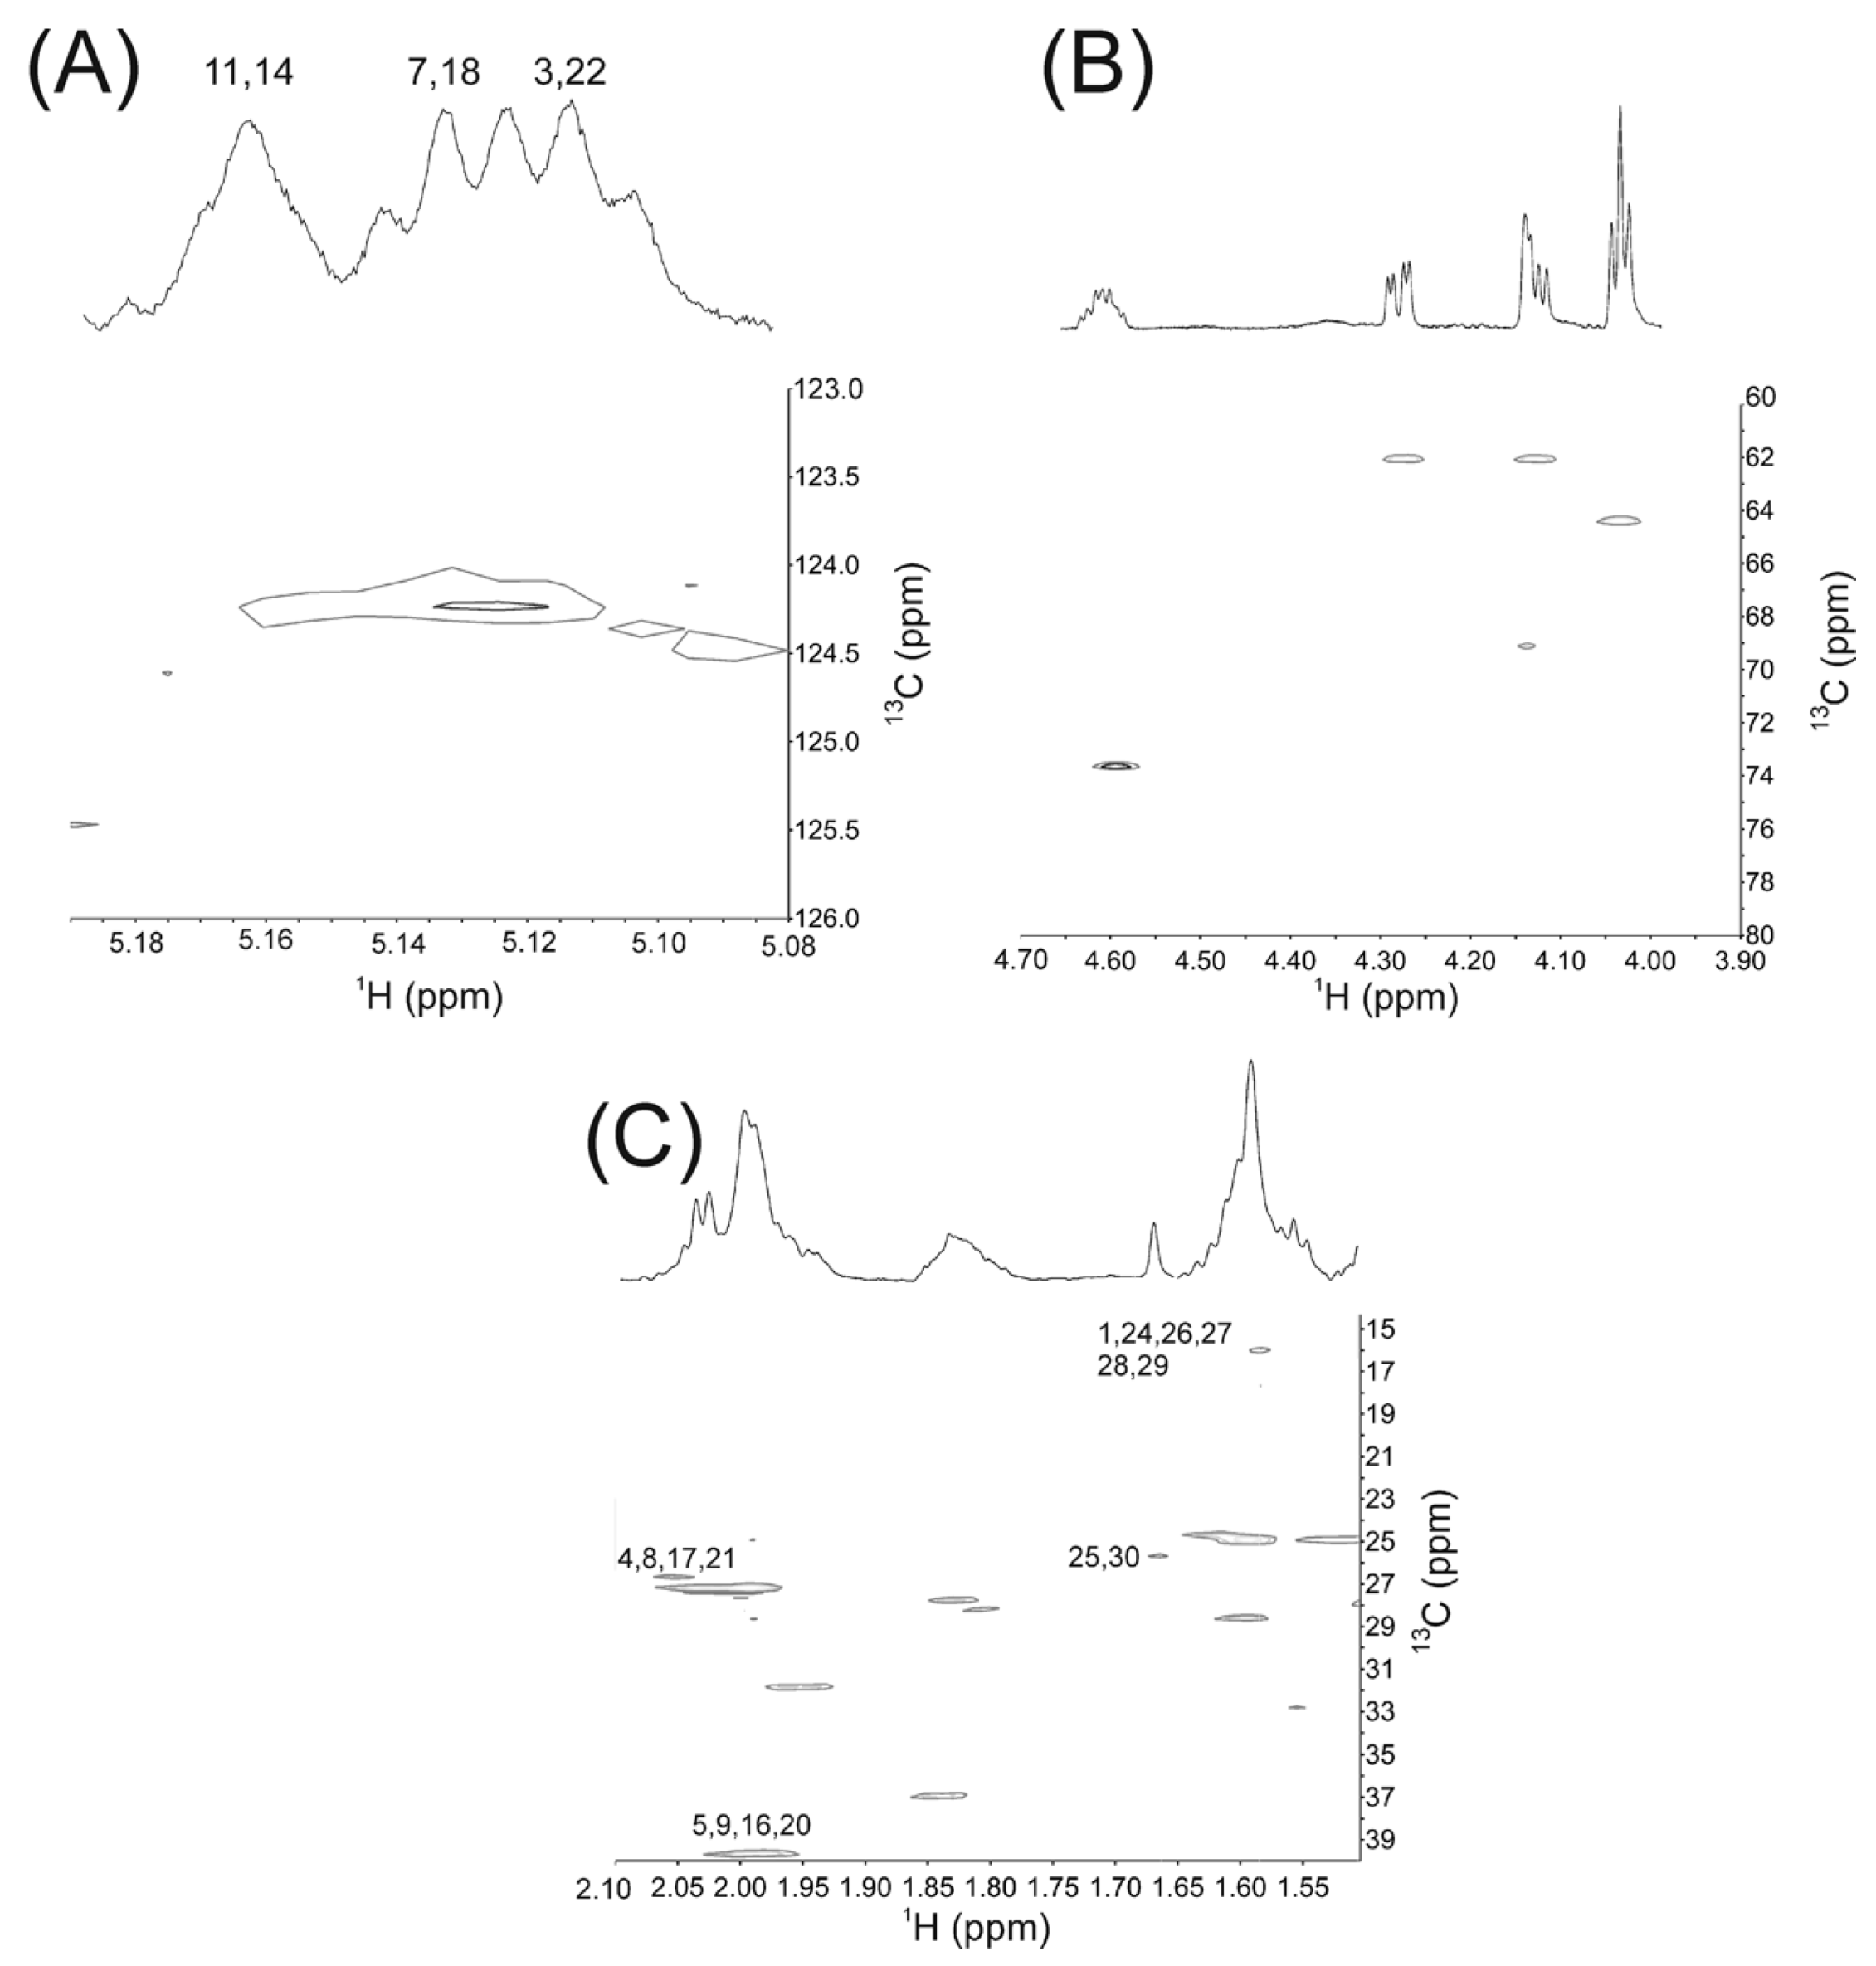
2.1. NMR Studies


| Squalene Moieties | Carbon Number | 1H δ (ppm) | Experimental Relative Area * | Calculated Relative Area * |
|---|---|---|---|---|
| CH3 | 1, 24 | 1.61 | Unresolved | 0.12 |
| 25, 30 | 1.67 | 0.12 | 0.12 | |
| 26, 29 | 1.61 | Unresolved | 0.12 | |
| 27, 28 | 1.62 | Unresolved | 0.12 | |
| CH2 | 4, 21 | 2.10 | 0.079 | 0.08 |
| 5, 20 | 2.00 | Unresolved | 0.08 | |
| 8, 17 | 2.07 | 0.079 | 0.08 | |
| 9, 16 | 2.00 | Unresolved | 0.08 | |
| 12, 13 | 2.03 | Unresolved | 0.08 | |
| CH | 3, 22 | 5.11 | 0.045 | 0.04 |
| 7, 18 | 5.13 | 0.037 | 0.04 | |
| 11, 14 | 5.16 | 0.038 | 0.04 |
| Moiety | Carbon Number | 1H δ (ppm) Squalene * | 1H δ (ppm) SSTE | 13C δ (ppm) Squalene * | 13C δ (ppm) SSTE | HSQC Confirmation |
|---|---|---|---|---|---|---|
| CH3 | 1, 24 | 1.61 | 1.61 | 17.67 | 16.0 | CH3 or CH |
| 25, 30 | 1.69 | 1.67 | 25.77 | 25.8 | CH3 or CH | |
| 26, 29 | 1.61 | 1.61 | 15.97 | 16.0 | CH3 or CH | |
| 27, 28 | 1.62 | 1.62 | 15.97 | 16.0 | CH3 or CH | |
| CH2 | 4, 21 | 2.09 | 2.10 | 26.79 | 27.2 | CH2 |
| 5, 20 | 2.00 | 2.00 | 39.74 | 39.6 | CH2 | |
| 8, 17 | 2.09 | 2.07 | 26.79 | 27.2 | CH2 | |
| 9, 16 | 2.00 | 2.00 | 39.74 | 39.6 | CH2 | |
| 12, 13 | 2.03 | 2.03 | 28.37 | 28.3 | CH2 | |
| CH | 3, 22 | 5.11 | 5.11 | 124.31 | 124.25 | CH3 or CH |
| 7, 18 | 5.13 | 5.13 | 124.15 | 124.25 | CH3 or CH | |
| 11, 14 | 5.17 | 5.16 | 124.19 | 124.25 | CH3 or CH |

| Moiety | Mole Fraction | |||
|---|---|---|---|---|
| SSTE * | Calculated 22 mol % Sebum Plus Meibum | Sebum † | Meibum † | |
| Squalene | 0.07 | 0.07 | 0.28 ± 0.06 | 0.01 |
| Cholesteryl esters | 0.38 | 0.27 | 0.03 ± 0.01 | 0.34 |
| Triglycerides | 0.10 | 0.09 | 0.38 ± 0.02 | 0.01 |
| Wax esters | 0.45 | 0.56 | 0.29 ± 0.05 | 0.64 |

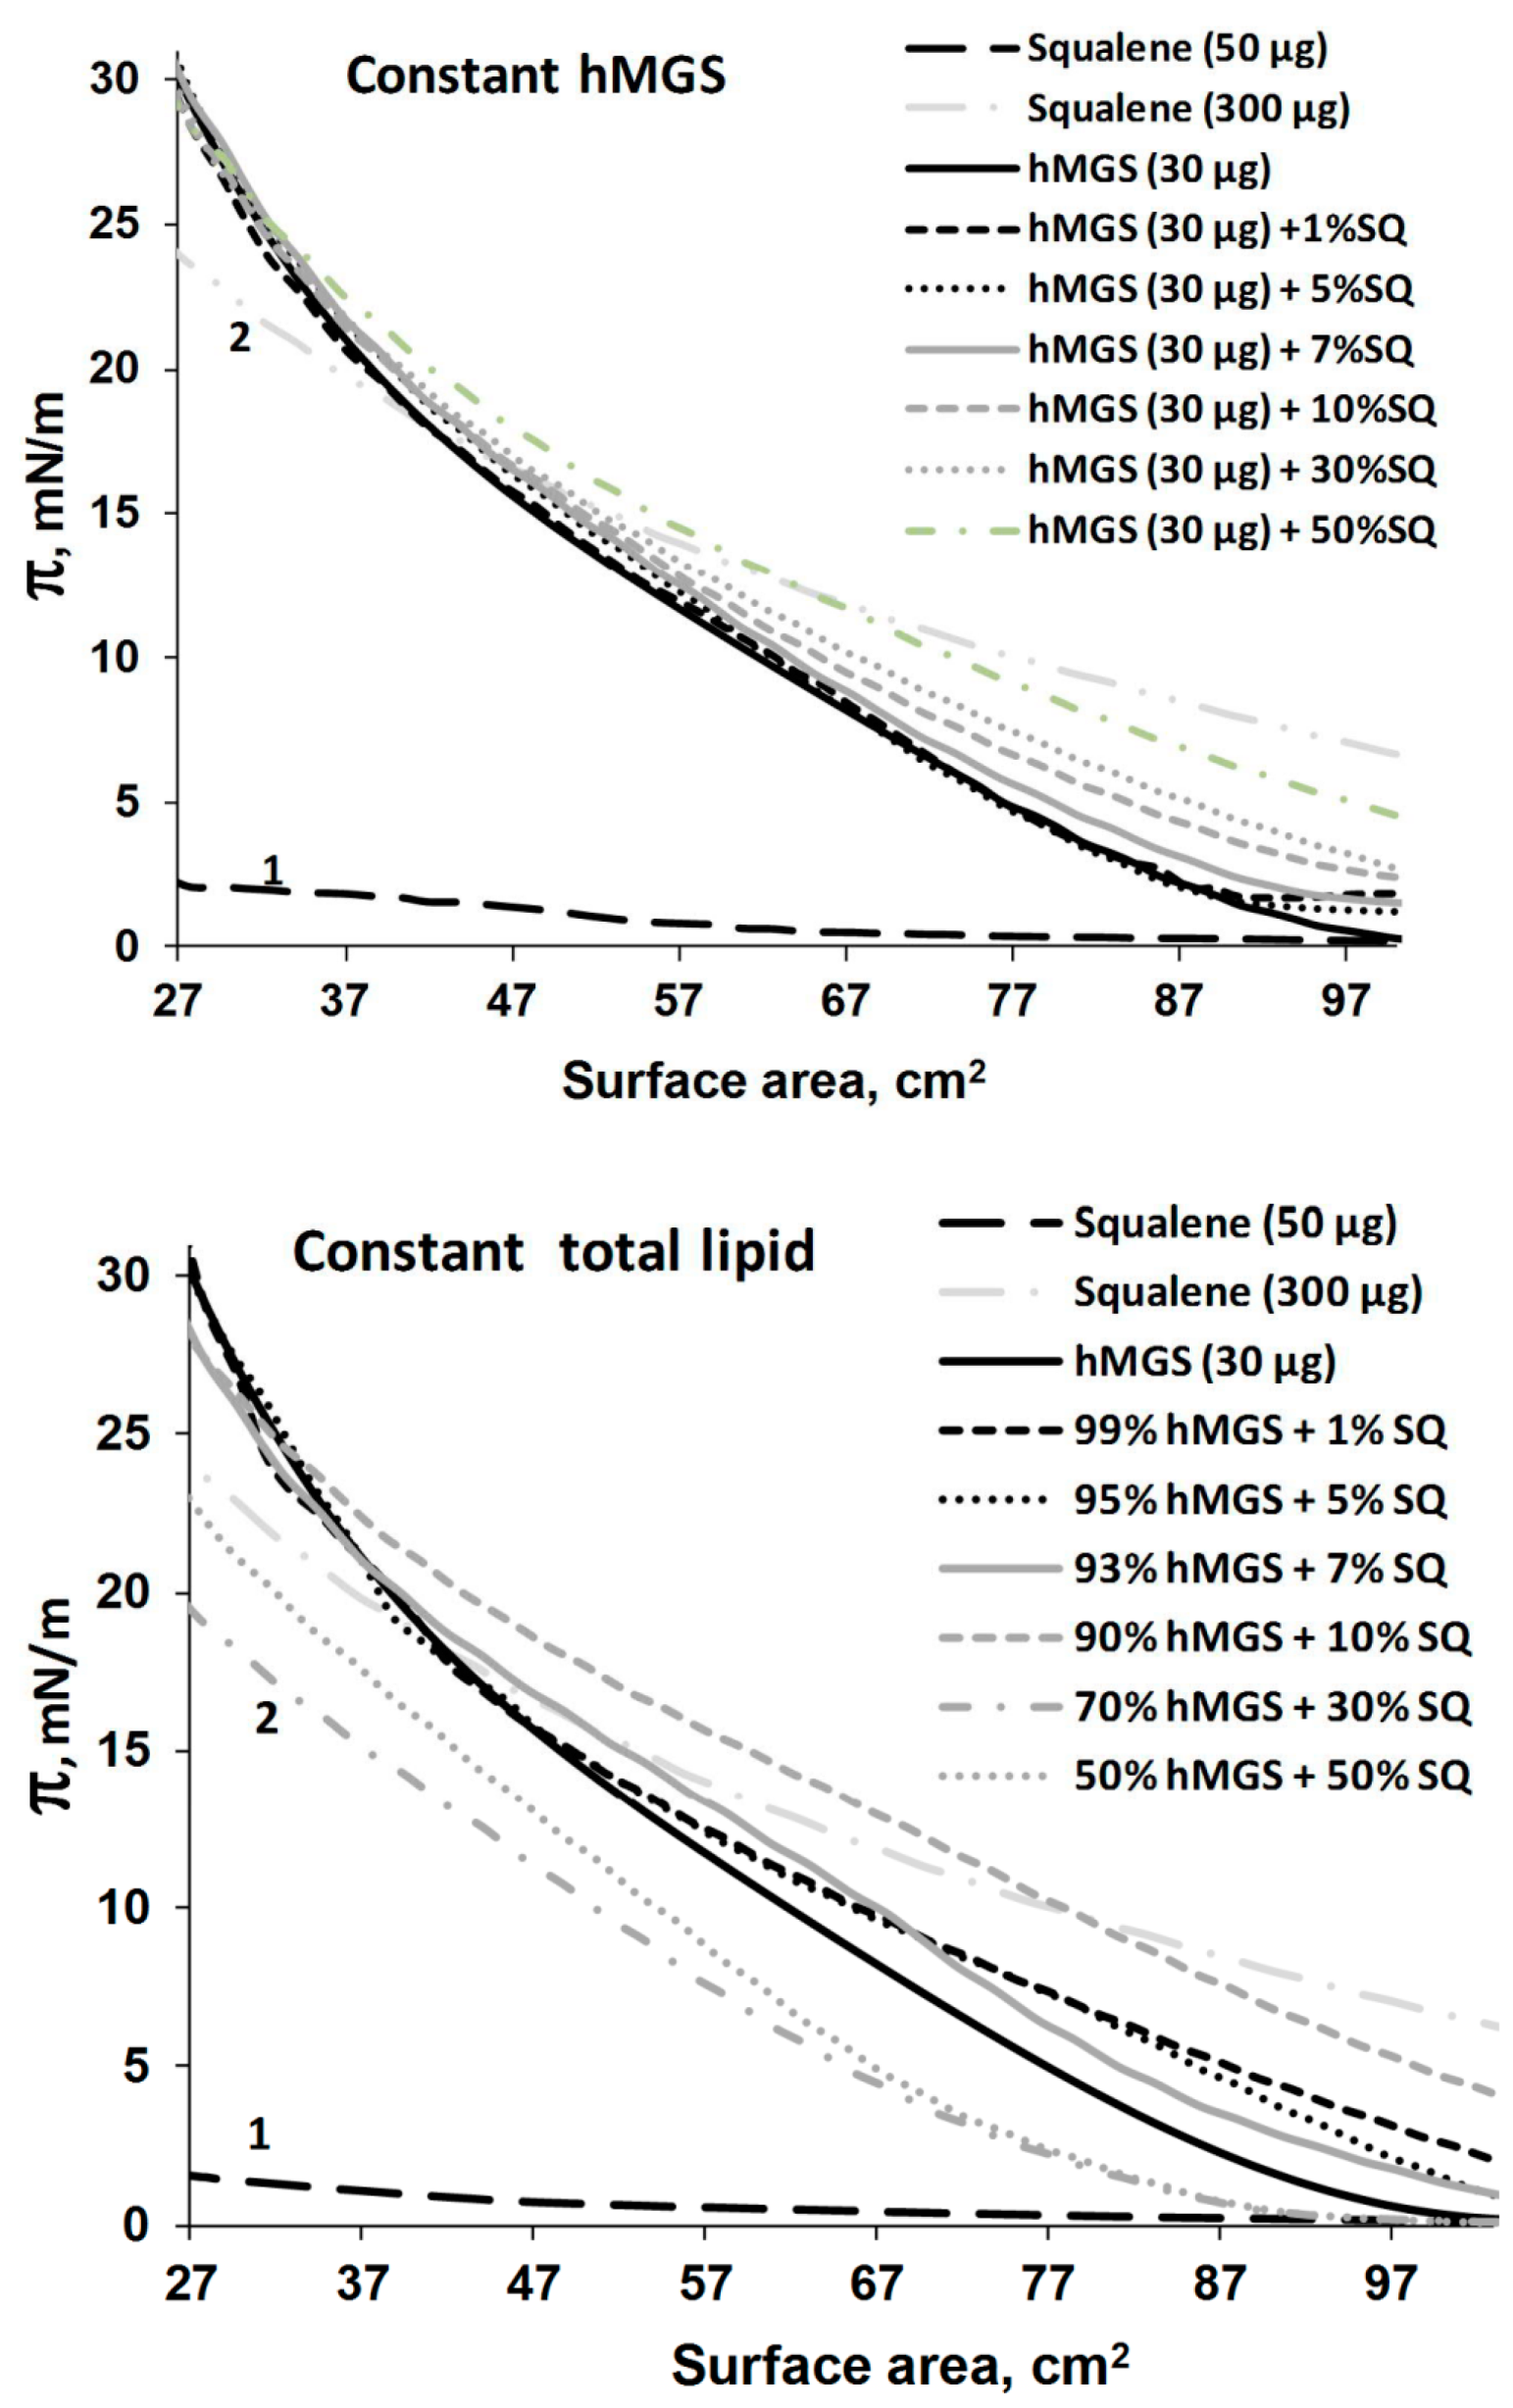
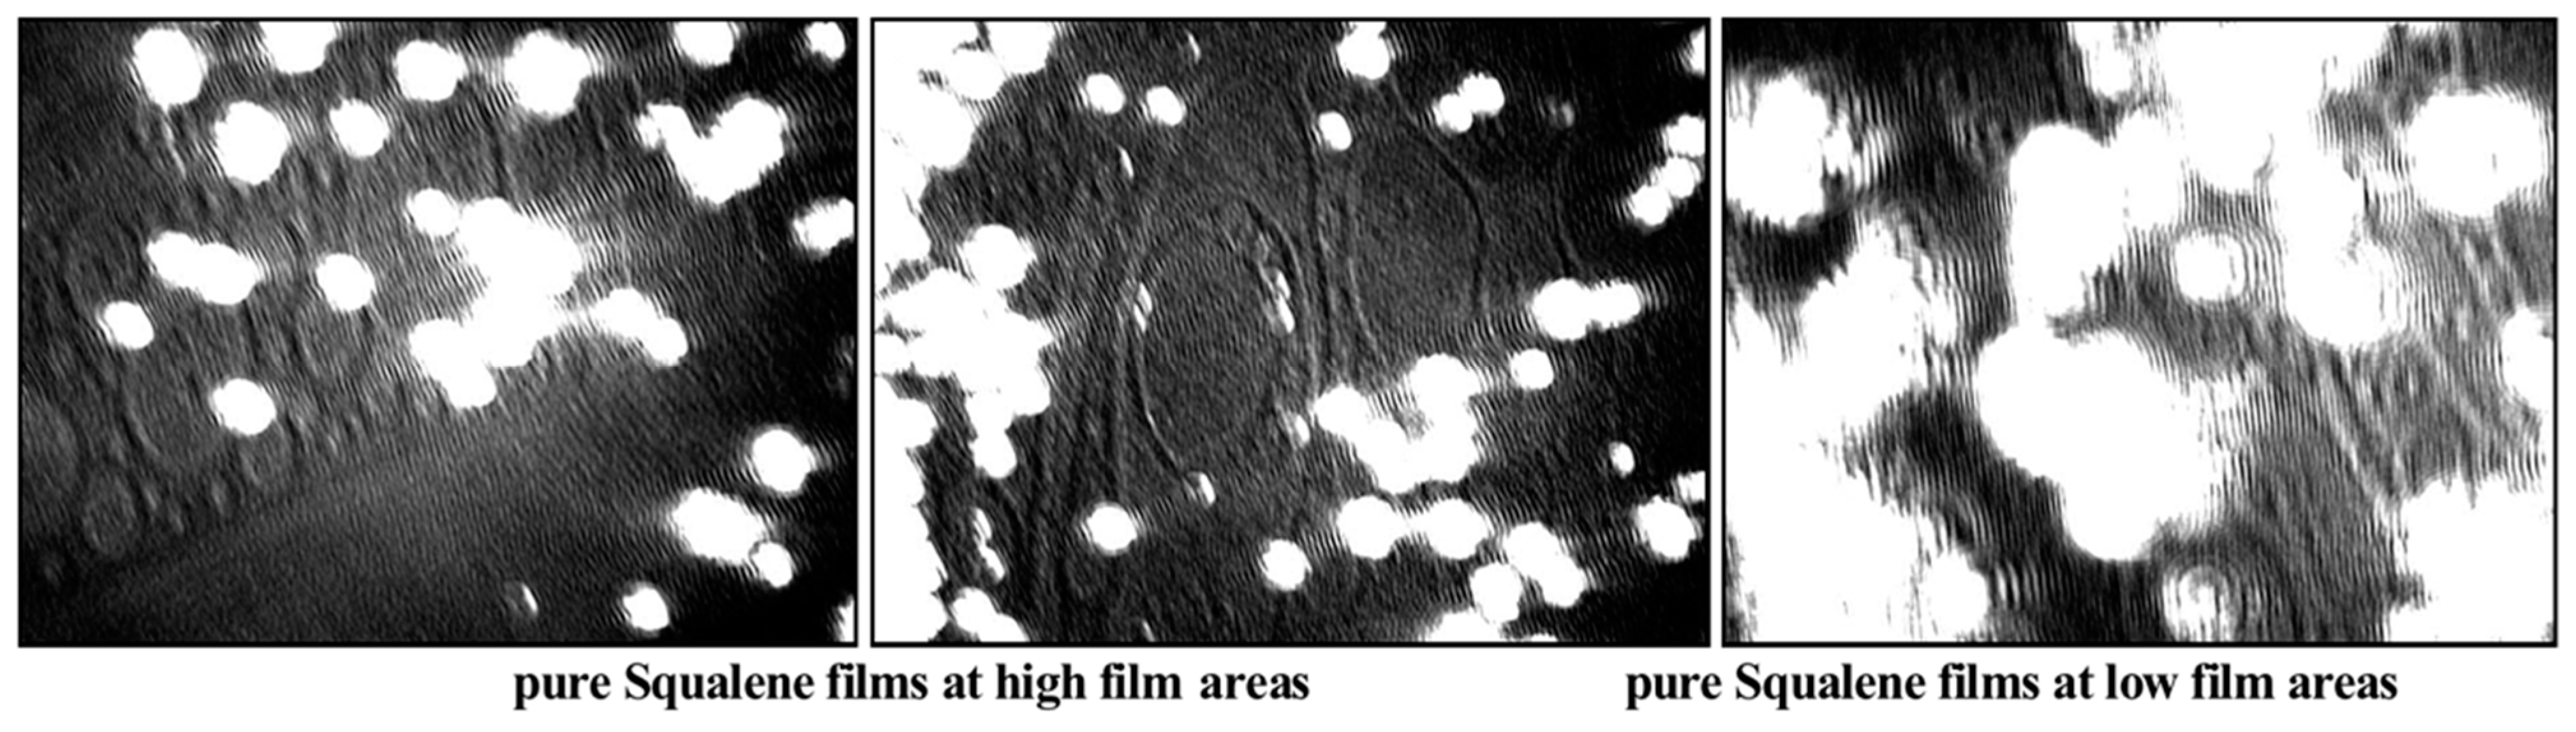
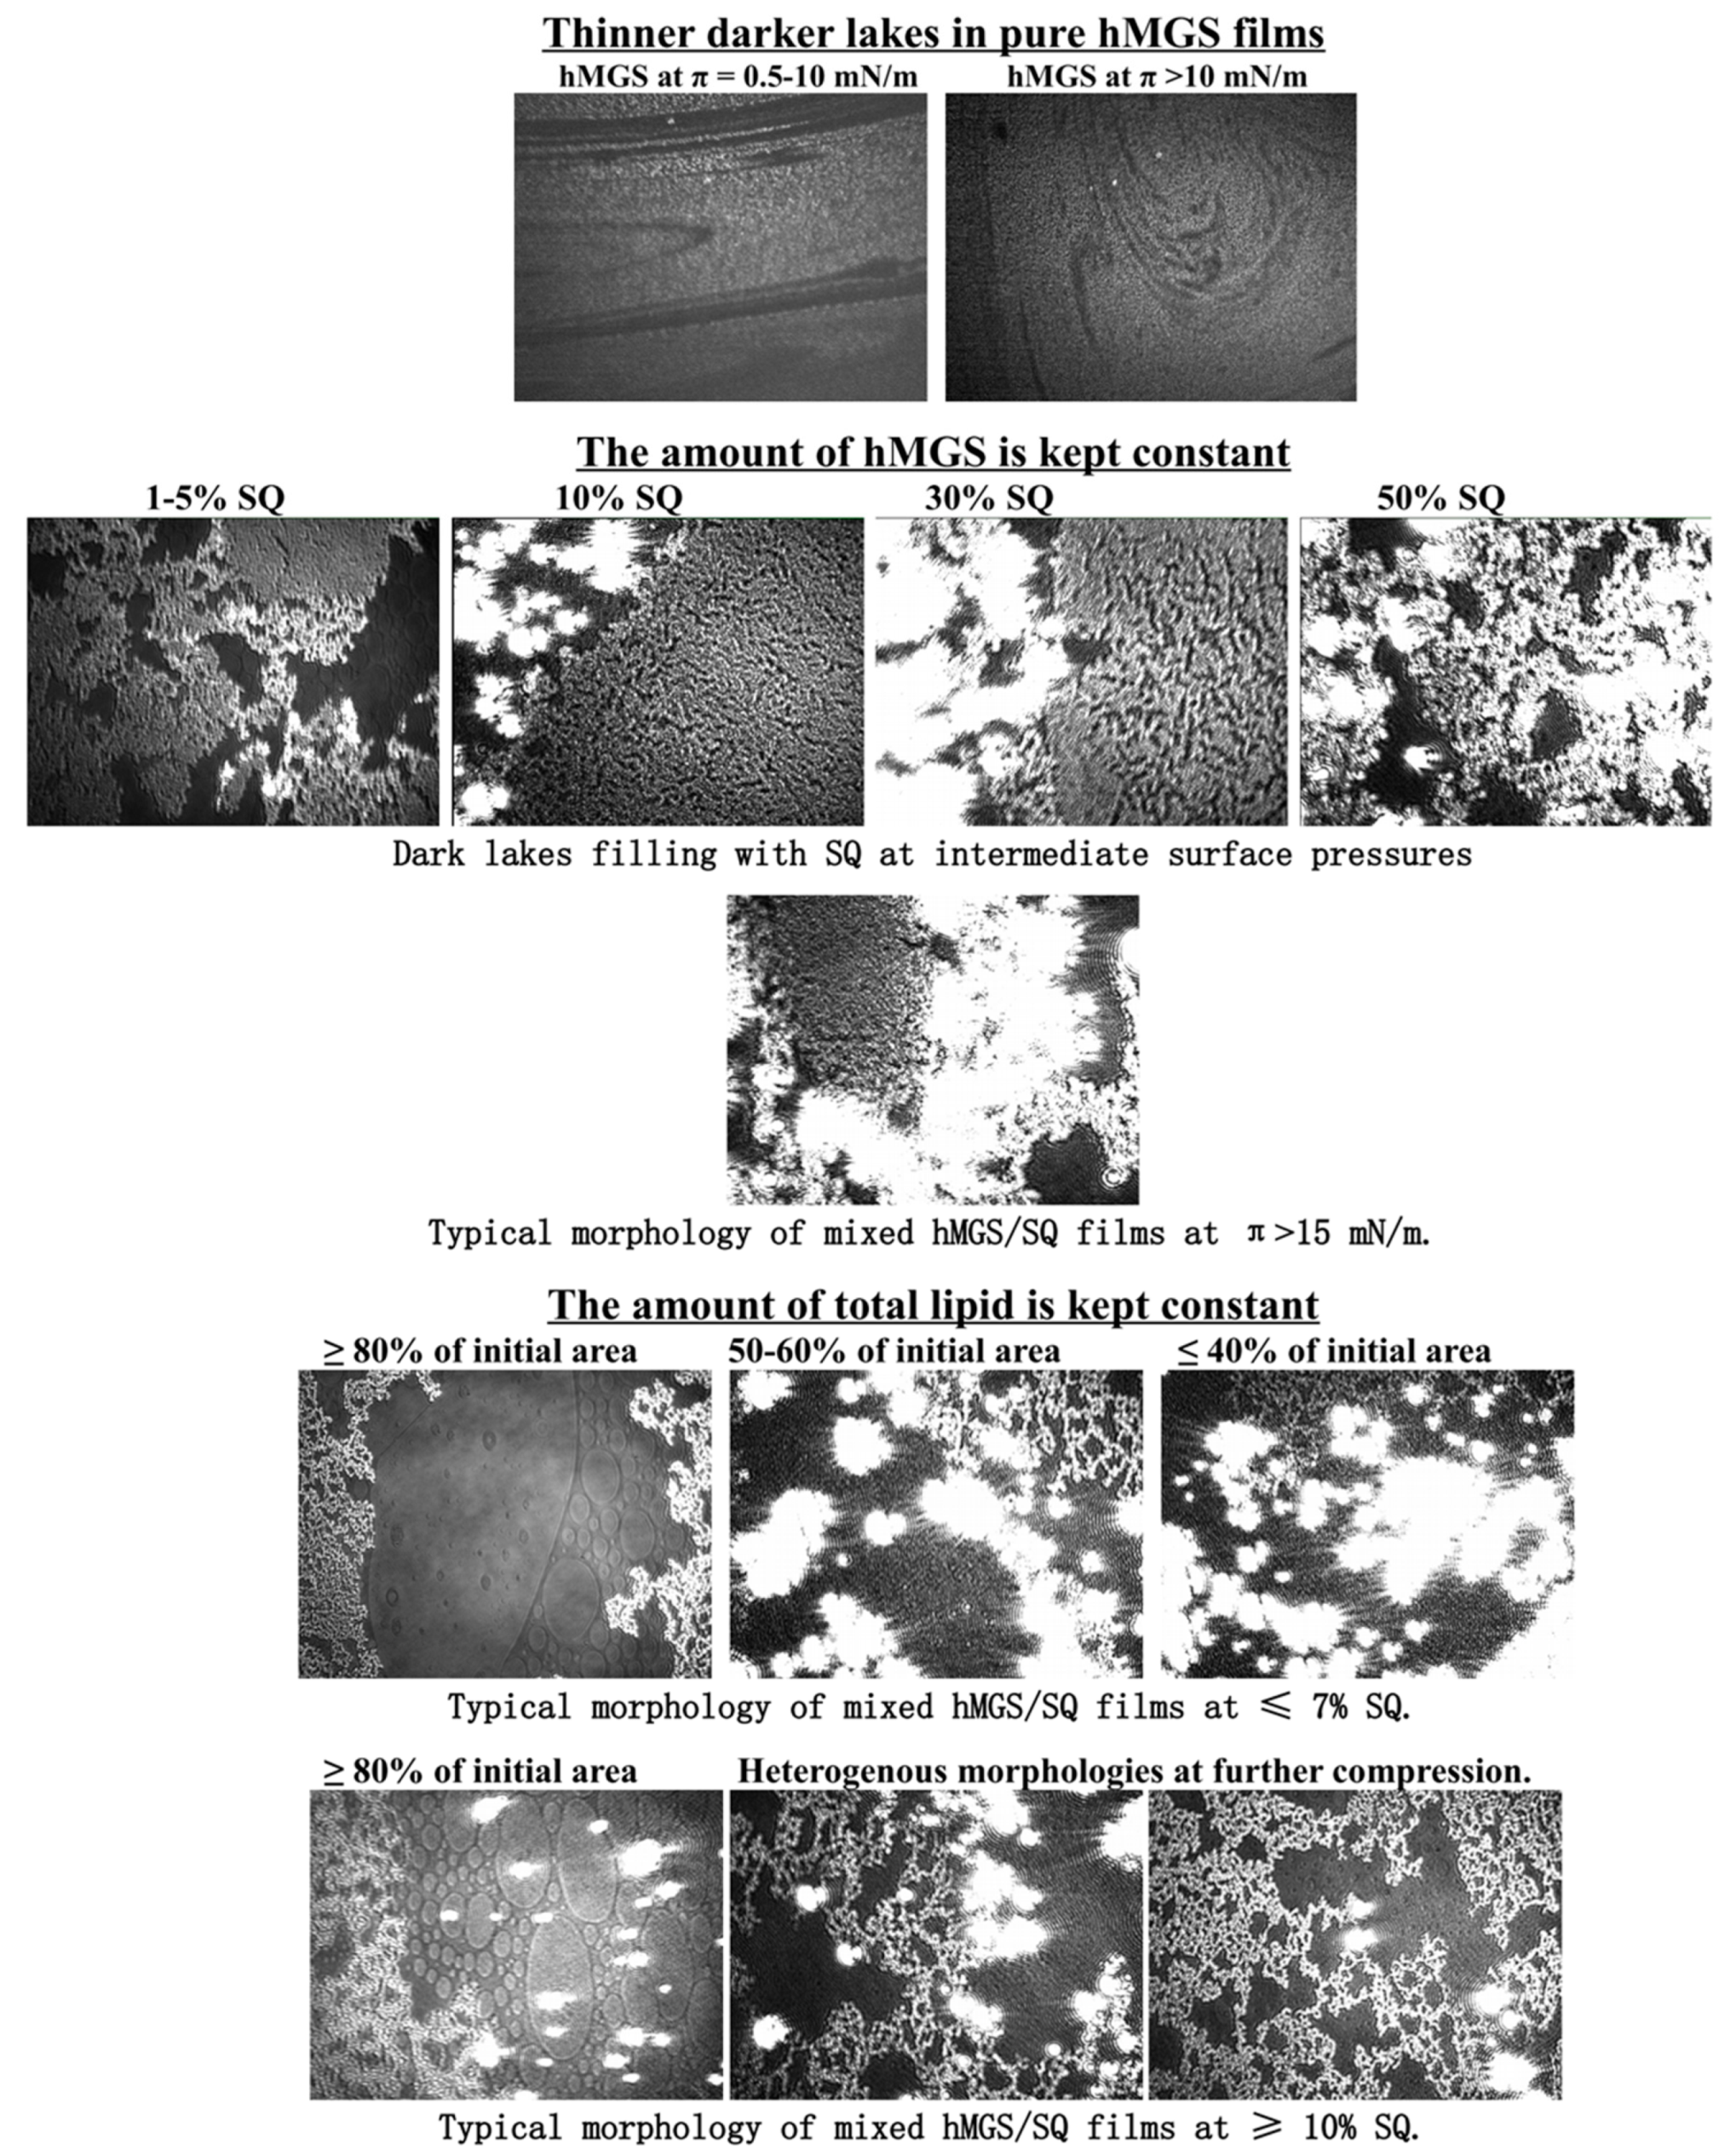
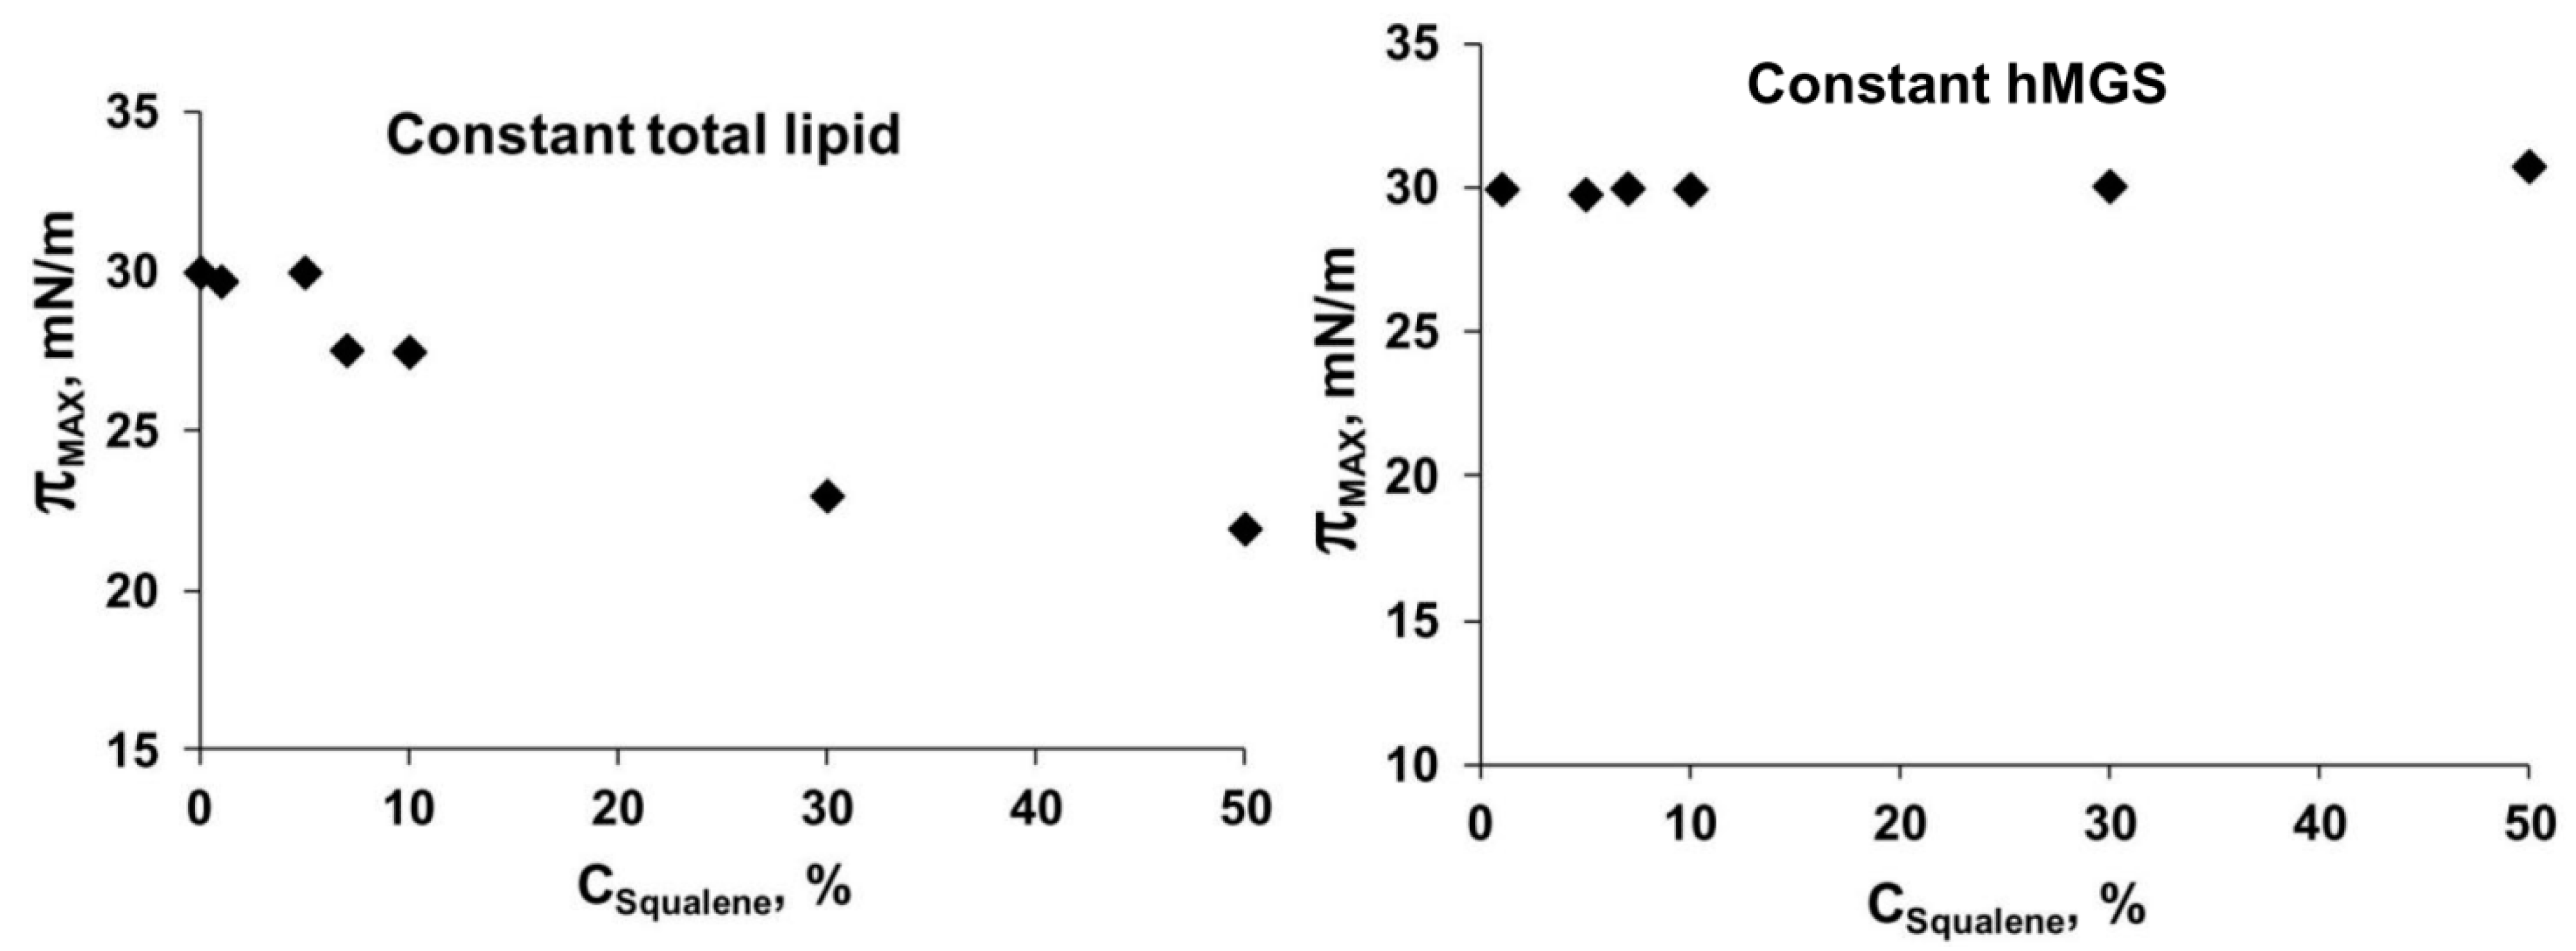
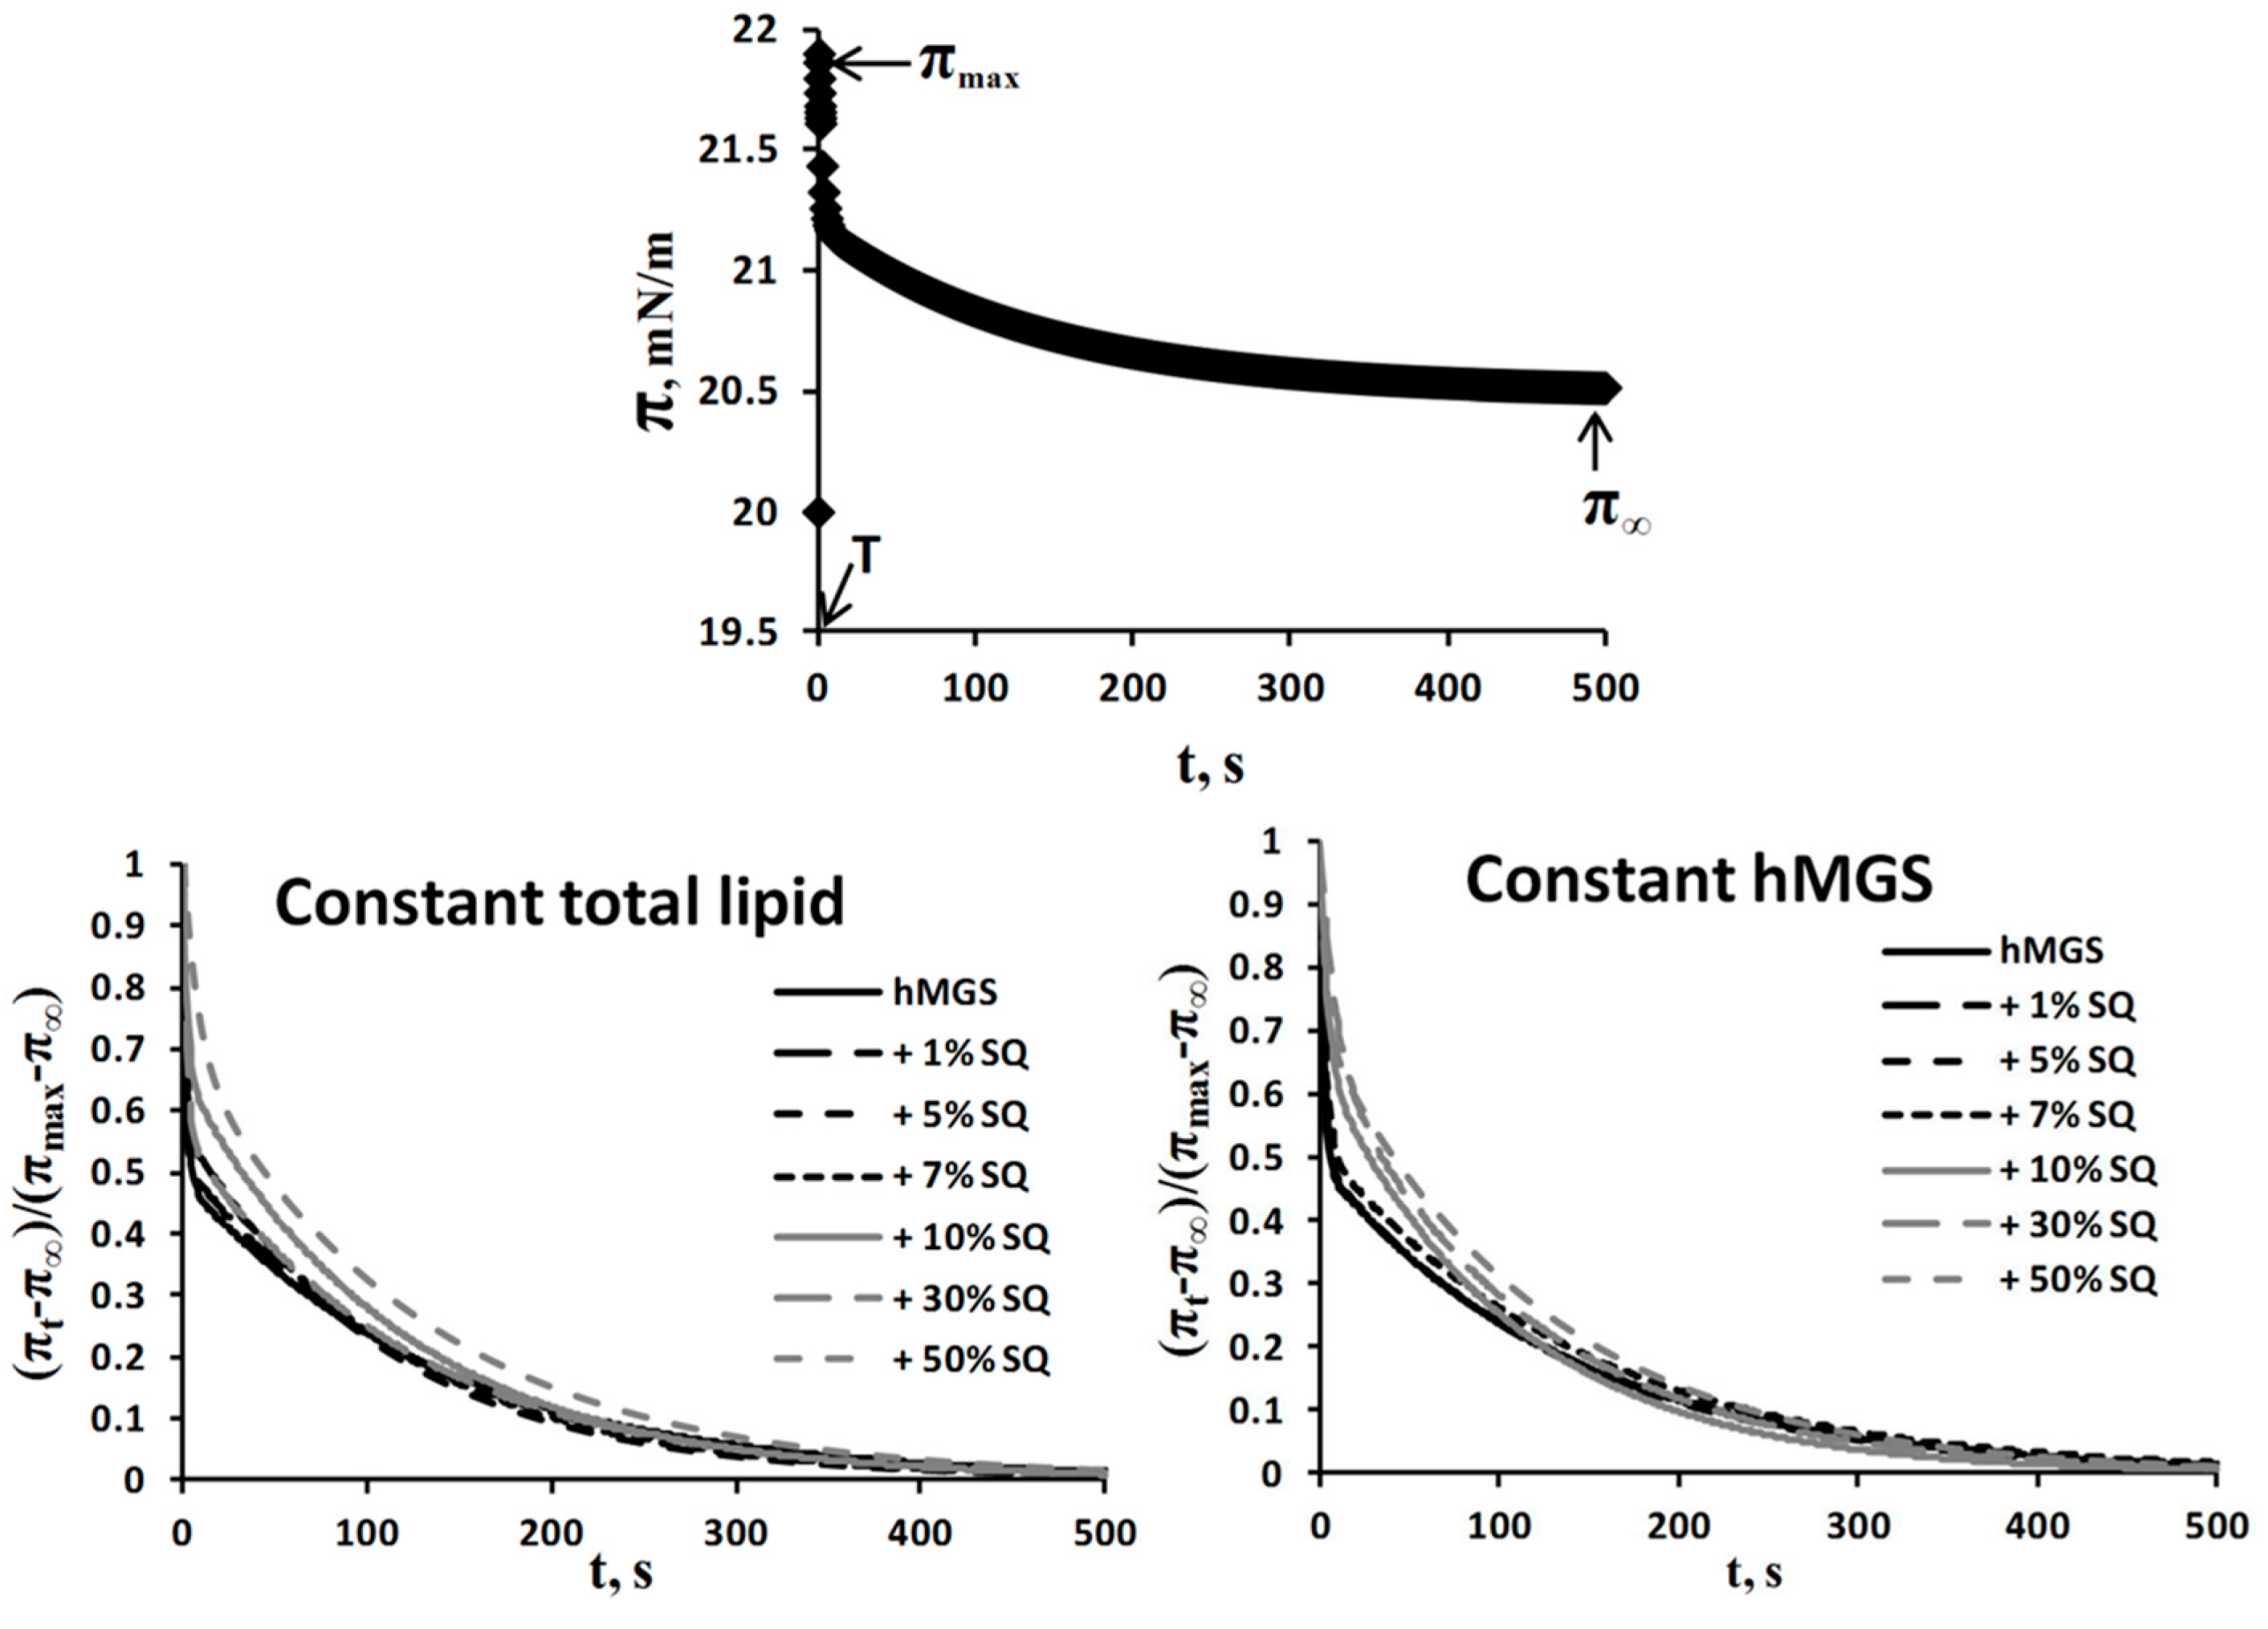
2.2. Langmuir Trough Studies


Analysis of Dilatation Rheology Properties of hMGS/SQ Films Evaluated in Stress/Relaxation Experiments
| Film Composition | τfast (s) | Afast | τslow (s) | Aslow | Afast/Aslow | |
|---|---|---|---|---|---|---|
| Constant hMGS (30 µg); SQ Addition Increases Total Lipid | hMGS | 1.98 | 0.51 | 138.35 | 0.49 | 1.04 |
| +1% SQ | 2.57 | 0.51 | 140.05 | 0.49 | 1.04 | |
| +5% SQ | 2.18 | 0.50 | 134.17 | 0.50 | 1 | |
| +7% SQ | 2.93 | 0.48 | 145.32 | 0.52 | 0.92 | |
| +10% SQ | 4.03 | 0.35 | 105.87 | 0.65 | 0.53 | |
| +30% SQ | 8.27 | 0.33 | 115.32 | 0.67 | 0.49 | |
| +50% SQ | 3.59 | 0.30 | 124.08 | 0.70 | 0.43 | |
| Constant Total Lipid (30 µg); SQ Addition Is at the Expense of Decreasing hMGS Amount | hMGS | 1.98 | 0.51 | 138.35 | 0.49 | 1.04 |
| +1% SQ | 1.05 | 0.48 | 128.03 | 0.52 | 0.92 | |
| +5% SQ | 1.37 | 0.43 | 109.16 | 0.57 | 0.75 | |
| +7% SQ | 1.43 | 0.43 | 115.83 | 0.57 | 0.75 | |
| +10% SQ | 2.39 | 0.34 | 116.30 | 0.66 | 0.52 | |
| +30% SQ | 2.19 | 0.44 | 123.29 | 0.56 | 0.78 | |
| +50% SQ | 7.53 | 0.30 | 129.55 | 0.70 | 0.43 | |
3. Discussion
4. Experimental Section
4.1. Collection and Processing of Human Meibum for Langmuir Trough Analysis
4.2. Collection of Tears for NMR Spectroscopic Analysis
4.3. NMR Spectral Measurements
4.4. Langmuir Trough Studies
4.4.1. Compression Isotherms
4.4.2. Stress-Relaxation Studies via the Small Deformations Method
Acknowledgments
Author Contributions
Conflicts of Interest
References
- Green-Church, K.B.; Butovich, I.; Willcox, M.; Borchman, D.; Paulsen, F.; Barabino, S.; Glasgow, B.J. The international workshop on meibomian gland dysfunction: Report of the subcommittee on tear film lipids and lipid-protein interactions in health and disease. Investig. Ophthalmol. Vis. Sci. 2011, 52, 1979–1993. [Google Scholar] [CrossRef] [PubMed]
- Butovich, I.A. On the lipid composition of human meibum and tears: Comparative analysis of nonpolar lipids. Investig. Ophthalmol. Vis. Sci. 2008, 49, 3779–3789. [Google Scholar] [CrossRef] [PubMed]
- Foulks, G.N. The correlation between the tear film lipid layer and dry eye disease. Surv. Ophthalmol. 2007, 52, 369–374. [Google Scholar] [CrossRef] [PubMed]
- Holly, F.J. Physical chemistry of the normal and disordered tear film. Trans. Ophthalmol. Soc. UK 1985, 104, 374–380. [Google Scholar] [PubMed]
- King-Smith, P.E.; Fink, B.A.; Nichols, J.J.; Nichols, K.K.; Braun, R.J.; McFadden, G.B. The contribution of lipid layer movement to tear film thinning and breakup. Investig. Ophthalmol. Vis. Sci. 2009, 50, 2747–2756. [Google Scholar] [CrossRef] [PubMed]
- Knop, E.; Knop, N.; Schirra, F. Meibomian glands. Part II: Physiology, characteristics, distribution and function of meibomian oil. Ophthalmologe 2009, 106, 884–892. [Google Scholar] [CrossRef] [PubMed]
- Pucker, A.D.; Nichols, J.J. Analysis of meibum and tear lipids. Ocul. Surf. 2012, 10, 230–250. [Google Scholar] [CrossRef] [PubMed]
- McMahon, A.; Lu, H.; Butovich, I.A. The spectrophotometric sulfo-phospho-vanillin assessment of total lipids in human meibomian gland secretions. Lipids 2013, 48, 513–525. [Google Scholar] [CrossRef] [PubMed]
- Shrestha, R.K.; Borchman, D.; Foulks, G.N.; Yappert, M.C.; Milliner, S.E. Analysis of the composition of lipid in human meibum from normal infants, children, adolescents, adults, and adults with meibomian gland dysfunction using 1H-NMR spectroscopy. Investig. Ophthalmol. Vis. Sci. 2011, 52, 7350–7358. [Google Scholar] [CrossRef] [PubMed]
- Georgiev, G.A.; Yokoi, N.; Ivanova, S.; Tonchev, V.; Nencheva, Y.; Krastev, R. Surface relaxations as a tool to distinguish the dynamic interfacial properties of films formed by normal and diseased meibomian lipids. Soft Matter 2014, 10, 5579–5588. [Google Scholar] [CrossRef] [PubMed]
- King-Smith, P.E.; Bailey, M.D.; Braun, R.J. Four characteristics and a model of an effective tear film lipid layer (TFLL). Ocul. Surf. 2013, 11, 236–245. [Google Scholar] [CrossRef] [PubMed]
- Millar, T.J. A mechanism to explain the behaviour of spread films of meibomian lipids. Curr. Eye Res. 2013, 38, 220–223. [Google Scholar] [CrossRef] [PubMed]
- Rosenfeld, L.; Cerretani, C.; Leiske, D.L.; Toney, M.F.; Radke, C.J.; Fuller, G.G. Structural and rheological properties of meibomian lipid. Investig. Ophthalmol. Vis. Sci. 2013, 54, 2720–2732. [Google Scholar] [CrossRef] [PubMed]
- Lam, S.M.; Tong, L.; Duan, X.; Petznick, A.; Wenk, M.R.; Shui, G. Extensive characterization of human tear fluid collected using different techniques unravels the presence of novel lipid amphiphiles. J. Lipid Res. 2014, 55, 289–298. [Google Scholar] [CrossRef] [PubMed]
- Brown, S.H.; Kunnen, C.M.; Duchoslav, E.; Dolla, N.K.; Kelso, M.J.; Papas, E.B.; Lazon de la Jara, P.; Willcox, M.D.; Blanksby, S.J.; Mitchell, T.W. A comparison of patient matched meibum and tear lipidomes. Investig. Ophthalmol. Vis. Sci. 2013, 54, 7417–7424. [Google Scholar] [CrossRef] [PubMed]
- Dean, A.W.; Glasgow, B.J. Mass spectrometric identification of phospholipids in human tears and tear lipocalin. Investig. Ophthalmol. Vis. Sci. 2012, 53, 1773–1782. [Google Scholar] [CrossRef] [PubMed]
- Pucker, A.D.; Haworth, K.M. The presence and significance of polar meibum and tear lipids. Ocul. Surf. 2015, 13, 26–42. [Google Scholar] [CrossRef] [PubMed]
- Rantamaki, A.H.; Seppanen-Laakso, T.; Oresic, M.; Jauhiainen, M.; Holopainen, J.M. Human tear fluid lipidome: From composition to function. PLoS ONE 2011, 6, e19553. [Google Scholar] [CrossRef] [PubMed]
- Saville, J.T.; Zhao, Z.; Willcox, M.D.; Ariyavidana, M.A.; Blanksby, S.J.; Mitchell, T.W. Identification of phospholipids in human meibum by nano-electrospray ionisation tandem mass spectrometry. Exp. Eye Res. 2011, 92, 238–240. [Google Scholar] [CrossRef] [PubMed]
- Wollensak, G.; Mur, E.; Mayr, A.; Baier, G.; Gottinger, W.; Stoffler, G. Effective methods for the investigation of human tear film proteins and lipids. Graefes Arch. Clin. Exp. Ophthalmol. 1990, 228, 78–82. [Google Scholar] [CrossRef] [PubMed]
- Borchman, D.; Yappert, M.C.; Milliner, S.E.; Smith, R.J.; Bhola, R. Confirmation of the presence of squalene in human eyelid lipid by heteronuclear single quantum correlation spectroscopy. Lipids 2013, 48, 1269–1277. [Google Scholar] [CrossRef] [PubMed]
- Mudgil, P.B.D.; Gerlach, D.; Yappert, M.C.; Whitehall, J.S. Sebum/meibum surface film interactions and phase transitional differences. Exp. Eye Res. submitted. 2015. [Google Scholar]
- Robosky, L.C.; Wade, K.; Woolson, D.; Baker, J.D.; Manning, M.L.; Gage, D.A.; Reily, M.D. Quantitative evaluation of sebum lipid components with nuclear magnetic resonance. J. Lipid Res. 2008, 49, 686–692. [Google Scholar] [CrossRef] [PubMed]
- Uchino, M.; Schaumberg, D.A. Dry eye disease: Impact on quality of life and vision. Curr. Ophthalmol. Rep. 2013, 1, 51–57. [Google Scholar] [CrossRef] [PubMed]
- Bron, A.J.; Tiffany, J.M.; Gouveia, S.M.; Yokoi, N.; Voon, L.W. Functional aspects of the tear film lipid layer. Exp. Eye Res. 2004, 78, 347–360. [Google Scholar] [CrossRef] [PubMed]
- Norn, M.S. Natural fat in external eye. Vital-stained by Sudan III powder. Acta Ophthalmol. 1980, 58, 331–336. [Google Scholar] [CrossRef]
- Tiffany, J.M. The lipid secretion of the meibomian glands. Adv. Lipid Res. 1987, 22, 1–62. [Google Scholar] [PubMed]
- Chew, C.K.; Hykin, P.G.; Jansweijer, C.; Dikstein, S.; Tiffany, J.M.; Bron, A.J. The casual level of meibomian lipids in humans. Curr. Eye Res. 1993, 12, 255–259. [Google Scholar] [CrossRef] [PubMed]
- Tsubota, K.; Yagi, Y.; Goto, E.; Shimmura, S. New treatment of dry eye: The effect of calcium ointment through eyelid skin delivery. Br. J. Ophthalmol. 1999, 83, 767–770. [Google Scholar] [CrossRef] [PubMed]
- McDonald, J.E. Surface phenomena of tear films. Trans. Am. Ophthalmol. Soc. 1968, 66, 905–939. [Google Scholar] [CrossRef]
- Holly, F.J. Formation and rupture of the tear film. Exp. Eye Res. 1973, 15, 515–525. [Google Scholar] [CrossRef]
- Tiffany, J.M. Individual variations in human meibomian lipid composition. Exp. Eye Res. 1978, 27, 289–300. [Google Scholar] [CrossRef]
- Borchman, D.; Yappert, M.C.; Milliner, S.E.; Duran, D.; Cox, G.W.; Smith, R.J.; Bhola, R. 13C and 1H NMR ester region resonance assignments and the composition of human infant and child meibum. Exp. Eye Res. 2013, 112, 151–159. [Google Scholar] [CrossRef] [PubMed]
- Ashraf, Z.; Pasha, U.; Greenstone, V.; Akbar, J.; Apenbrinck, E.; Foulks, G.N.; Borchman, D. Quantification of human sebum on skin and human meibum on the eye lid margin using Sebutape®, spectroscopy and chemical analysis. Curr. Eye Res. 2011, 36, 553–562. [Google Scholar] [CrossRef] [PubMed]
- Vishnubhatla, S.; Borchman, D.; Foulks, G.N. Contact lenses and the rate of evaporation measured in vitro; the influence of wear, squalene and wax. Contact Lens Anterior Eye 2012, 35, 277–281. [Google Scholar] [CrossRef] [PubMed]
- Huang, Z.R.; Lin, Y.K.; Fang, J.Y. Biological and pharmacological activities of squalene and related compounds: Potential uses in cosmetic dermatology. Molecules 2009, 14, 540–554. [Google Scholar] [CrossRef] [PubMed]
- Kim, S.K.; Karadeniz, F. Biological importance and applications of squalene and squalane. Adv. Food Nutr. Res. 2012, 65, 223–233. [Google Scholar] [PubMed]
- Borchman, D.; Foulks, G.N.; Yappert, M.C.; Milliner, S.E. Differences in human meibum lipid composition with meibomian gland dysfunction using NMR and principal component analysis. Investig. Ophthalmol. Vis. Sci. 2012, 53, 337–347. [Google Scholar] [CrossRef] [PubMed]
- Foulks, G.N.; Borchman, D.; Yappert, M.; Kim, S.H.; McKay, J.W. Topical azithromycin therapy for meibomian gland dysfunction: Clinical response and lipid alterations. Cornea 2010, 29, 781–788. [Google Scholar] [CrossRef] [PubMed]
- Foulks, G.N.; Borchman, D.; Yappert, M.; Kakar, S. Topical azithromycin and oral doxycycline therapy of meibomian gland dysfunction: A comparative clinical and spectroscopic pilot study. Cornea 2012, 32, 44–53. [Google Scholar] [CrossRef] [PubMed]
- Oshima, Y.; Sato, H.; Zaghloul, A.; Foulks, G.N.; Yappert, M.C.; Borchman, D. Characterization of human meibum lipid using raman spectroscopy. Curr. Eye Res. 2009, 34, 824–835. [Google Scholar] [CrossRef] [PubMed]
- Gilmore, S.F.; Yao, A.I.; Tietel, Z.; Kind, T.; Facciotti, M.T.; Parikh, A.N. Role of squalene in the organization of monolayers derived from lipid extracts of Halobacterium salinarum. Langmuir 2013, 29, 7922–7930. [Google Scholar] [CrossRef] [PubMed]
- Castelli, F.; Sarpietro, M.G.; Micieli, D.; Stella, B.; Rocco, F.; Cattel, L. Enhancement of gemcitabine affinity for biomembranes by conjugation with squalene: Differential scanning calorimetry and Langmuir-Blodgett studies using biomembrane models. J. Colloid Interface Sci. 2007, 316, 43–52. [Google Scholar] [CrossRef] [PubMed]
- Ambike, A.; Rosilio, V.; Stella, B.; Lepêtre-Mouelhi, S.; Couvreur, P. Interaction of self assembled squalenoyl gemcitabine nanoparticles with phospholipidcholesterol monolayers mimicking a biomembrane. Langmuir 2011, 27, 4891–4899. [Google Scholar] [CrossRef] [PubMed]
- Jacobsen, N.E. NMR Spectroscopy Explained: Simplified Theory, Applications and Examples for Organic Chemistry and Structural Biology; Wiley-Interscience: Cambridge, UK, 2007. [Google Scholar]
- Sozzani, P.; di Silvestro, G. New assignment of 13C NMR-spectrum of squalene. Gazz. Chim. Italiana 1988, 118, 385–389. [Google Scholar]
- Leiske, D.; Leiske, C.; Toney, M.; Senchyna, M.; Ketelson, H.; Meadows, D.; Fuller, G.G. Temperature-induced transitions in the structure and interfacial rheology of human meibum. Biophys. J. 2012, 102, 369–376. [Google Scholar] [CrossRef] [PubMed]
- Bois, A.G.; Panaiotov, I. Nonsteady effects due to a small surface pressure perturbation in an elastic insoluble monolayer. J. Colloid Interface Sci. 1995, 170, 25–30. [Google Scholar] [CrossRef]
- Georgiev, G.A.; Yokoi, N.; Ivanova, S.; Krastev, R.; Lalchev, Z. Surface chemistry study of the interactions of pharmaceutical ingredients with human meibum films. Investig. Ophthalmol. Vis. Sci. 2012, 53, 4605–4615. [Google Scholar] [CrossRef] [PubMed]
- Kaercher, T.; Honig, D.; Mobius, D. Brewster angle microscopy. A new method of visualizing the spreading of Meibomian lipids. Int. Ophthalmol. 1993, 17, 341–348. [Google Scholar] [CrossRef] [PubMed]
© 2015 by the authors; licensee MDPI, Basel, Switzerland. This article is an open access article distributed under the terms and conditions of the Creative Commons Attribution license (http://creativecommons.org/licenses/by/4.0/).
Share and Cite
Ivanova, S.; Tonchev, V.; Yokoi, N.; Yappert, M.C.; Borchman, D.; Georgiev, G.A. Surface Properties of Squalene/Meibum Films and NMR Confirmation of Squalene in Tears. Int. J. Mol. Sci. 2015, 16, 21813-21831. https://doi.org/10.3390/ijms160921813
Ivanova S, Tonchev V, Yokoi N, Yappert MC, Borchman D, Georgiev GA. Surface Properties of Squalene/Meibum Films and NMR Confirmation of Squalene in Tears. International Journal of Molecular Sciences. 2015; 16(9):21813-21831. https://doi.org/10.3390/ijms160921813
Chicago/Turabian StyleIvanova, Slavyana, Vesselin Tonchev, Norihiko Yokoi, Marta C. Yappert, Douglas Borchman, and Georgi As. Georgiev. 2015. "Surface Properties of Squalene/Meibum Films and NMR Confirmation of Squalene in Tears" International Journal of Molecular Sciences 16, no. 9: 21813-21831. https://doi.org/10.3390/ijms160921813
APA StyleIvanova, S., Tonchev, V., Yokoi, N., Yappert, M. C., Borchman, D., & Georgiev, G. A. (2015). Surface Properties of Squalene/Meibum Films and NMR Confirmation of Squalene in Tears. International Journal of Molecular Sciences, 16(9), 21813-21831. https://doi.org/10.3390/ijms160921813