
Biogas Production from Sugarcane Waste: Assessment on Kinetic Challenges for Process Designing


Abstract
:1. Introduction
2. Results and Discussion
2.1. Physical-Chemical Composition
2.1.1. Basic Characteristics

| Parameters | Units | Vinasse | Filter Cake (n = 9) | Bagasse (n = 9) | Straw (n = 12) | Recommendation | |||||||
|---|---|---|---|---|---|---|---|---|---|---|---|---|---|
| Autonomous (n = 6) | Annexed (n = 15) | ||||||||||||
| AV | SD | AV | SD | AV | SD | AV | SD | AV | SD | [13] | [14] | ||
| TS a | % FM d | 1.15 | ±0.12 | 3.44 | ±1.11 | 28.9 | ±3.77 | 55.4 | ±4.19 | 76.7 | ±21.6 | - | - |
| VS b | % TS | 76.0 | ±6.99 | 70.6 | ±3.84 | 74.2 | ±10.8 | 96.0 | ±2.70 | 86.3 | ±11.9 | - | - |
| COD c | g·L−1 | 22.1 | ±0.46 | 32.4 | ±10.0 | - | - | - | - | - | - | - | - |
| C | % TS | 37.0 | ±4.24 | 39.0 | ±8.61 | 42.7 | ±6.95 | 47.6 | ±2.69 | 43.4 | ±4.78 | C:N 20–40:1 | - |
| N | % TS | 2.94 | ±0.35 | 2.31 | ±0.35 | 1.76 | ±0.24 | 0.41 | ±0.04 | 0.52 | ±0.21 | - | |
| P | % TS | 0.16 | ±0.05 | 0.35 | ±0.12 | 0.60 | ±0.25 | 0.04 | ±0.02 | 0.06 | ±0.03 | C:N:P:S 600:15:5:3 | - |
| S | % TS | 0.87 | ±0.49 | 2.12 | ±0.27 | 0.18 | ±0.02 | 0.05 | ±0.03 | 0.21 | ±0.06 | - | |
| Ca | mg·L−1 | 77.4 | ±24.3 | 655 | ±211 | 4139 | ±1667 | 704 | ±215 | 2981 | ±1656 | - | 100–200 |
| Na | mg·L−1 | 16.4 | ±9.39 | 24.5 | ±9.58 | 7.75 | ±5.98 | 11.3 | ±8.83 | 37.1 | ±25.1 | - | 100–200 |
| K | mg·L−1 | 1306 | ±708 | 6021 | ±565 | 740 | ±280 | 1651 | ±1036 | 5002 | ±2344 | - | 200–400 |
| Mg | mg·L−1 | 173.6 | ±72.4 | 771 | ±177 | 971 | ±259 | 409 | ±173 | 1140 | ±404 | - | 75–150 |
2.1.2. Macronutrients
2.1.3. Trace Elements
| Parameters | Units | Vinasse | Filter Cake (n = 9) | Bagasse (n = 9) | Straw (n = 12) | Recommendation | |||||||
|---|---|---|---|---|---|---|---|---|---|---|---|---|---|
| Autonomous (n = 6) | Annexed (n = 15) | ||||||||||||
| AV | SD | AV | SD | AV | SD | AV | SD | AV | SD | [22] | [28] | ||
| Fe | mg·kgTS−1 | 200 | ±177 | 488 | ±142 | 27,267 | ±24,625 | 2012 | ±1530 | 14,949 | ±23,435 | 100–5000 | 750–5000 |
| Ni | mg·kgTS−1 | 0.49 | ±0.03 | 2.30 | ±0.92 | 14.3 | ±5.81 | 4.04 | ±3.17 | 7.17 | ±5.22 | 5–20 | 4–30 |
| Co | mg·kgTS−1 | 0.55 | ±0.02 | 0.62 | ±0.46 | 3.36 | ±1.34 | 0.52 | ±0.25 | 2.87 | ±3.73 | <1–5 | 0.4–10 |
| Mo | mg·kgTS−1 | 0.48 | ±0.01 | 0.84 | ±0.20 | 1.03 | ±0.74 | 0.58 | ±0.37 | 0.71 | ±0.25 | <1–5 | 0.05–16 |
| W | mg·kgTS−1 | Nd | - | 0.08 | ±0.04 | 0.29 | ±0.50 | 0.19 | ±0.05 | 0.24 | ±0.05 | <1 | 0.1–30 |
| Mn | mg·kgTS−1 | 59.6 | ±5.94 | 194 | ±49.2 | 566 | ±188 | 43.4 | ±11.1 | 177 | ±85.1 | - | 100–1500 |
| Cu | mg·kgTS−1 | 3.62 | ±0.14 | 7.96 | ±4.03 | 43.8 | ±4.04 | 4.82 | ±1.93 | 10.7 | ±12.7 | - | 10–80 |
| Se | mg·kgTS−1 | Nd | - | 0.08 | ±0.06 | 0.01 | ±0.02 | 0.83 | ±0.12 | 0.19 | ±0.24 | - | 0.05–4 |
| Zn | mg·kgTS−1 | 36.8 | ±10.5 | 32.6 | ±4.45 | 132 | ±7.21 | 17.2 | ±10.1 | 10.1 | ±14.9 | - | 30–400 |
2.1.4. Nutritional Values
| Parameters | Units | Vinasse | Filter Cake (n = 9) | Bagasse (n = 6) | Straw (n = 9) | |||||||
|---|---|---|---|---|---|---|---|---|---|---|---|---|
| Autonomous (n = 6) | Annexed (n = 6) | |||||||||||
| AV | SD | AV | SD | AV | SD | AV | SD | AV | SD | |||
| Raw protein | - | g·kgTS−1 | 137 | ±5.17 | 159 | ±11.5 | 124 | ±12.8 | 17.9 | ±3.89 | 27.7 | ±8.36 |
| Raw fat | - | g·kgTS−1 | 0.72 | ±0.85 | 0.12 | ±0.10 | 39.5 | ±5.11 | 7.20 | ±3.27 | 9.18 | ±1.55 |
| Carbohydrate | NFC a | g·kgTS−1 | 372 | ±44.7 | 263 | ±69.9 | 118 | ±136 | 181 | ±216 | 107 | ±41.2 |
| Cellulose | g·kgTS−1 | 34.9 | ±11.7 | 60.9 | ±13.8 | 126 | ±19.2 | 357 | ±96.1 | 311 | ±88.1 | |
| Hemi-cellulose | g·kgTS−1 | 101 | ±27.5 | 243 | ±176 | 164 | ±16.3 | 233 | ±93.1 | 227 | ±14.5 | |
| Lignin | - | g·kgTS−1 | 56.5 | ±15.5 | 34.3 | ±3.03 | 116 | ±27.1 | 124 | ±38.2 | 162 | ±26.2 |
| Raw ash | - | g·kgTS−1 | 296 | ±82.0 | 238 | ±101 | 309 | ±125 | 78.3 | ±10.1 | 154 | ±120 |
| TKN b | - | g·kgTS−1 | 22.2 | ±0.78 | 49.6 | ±32.1 | 20.0 | ±2.09 | 2.90 | ±0.65 | 4.48 | ±1.36 |
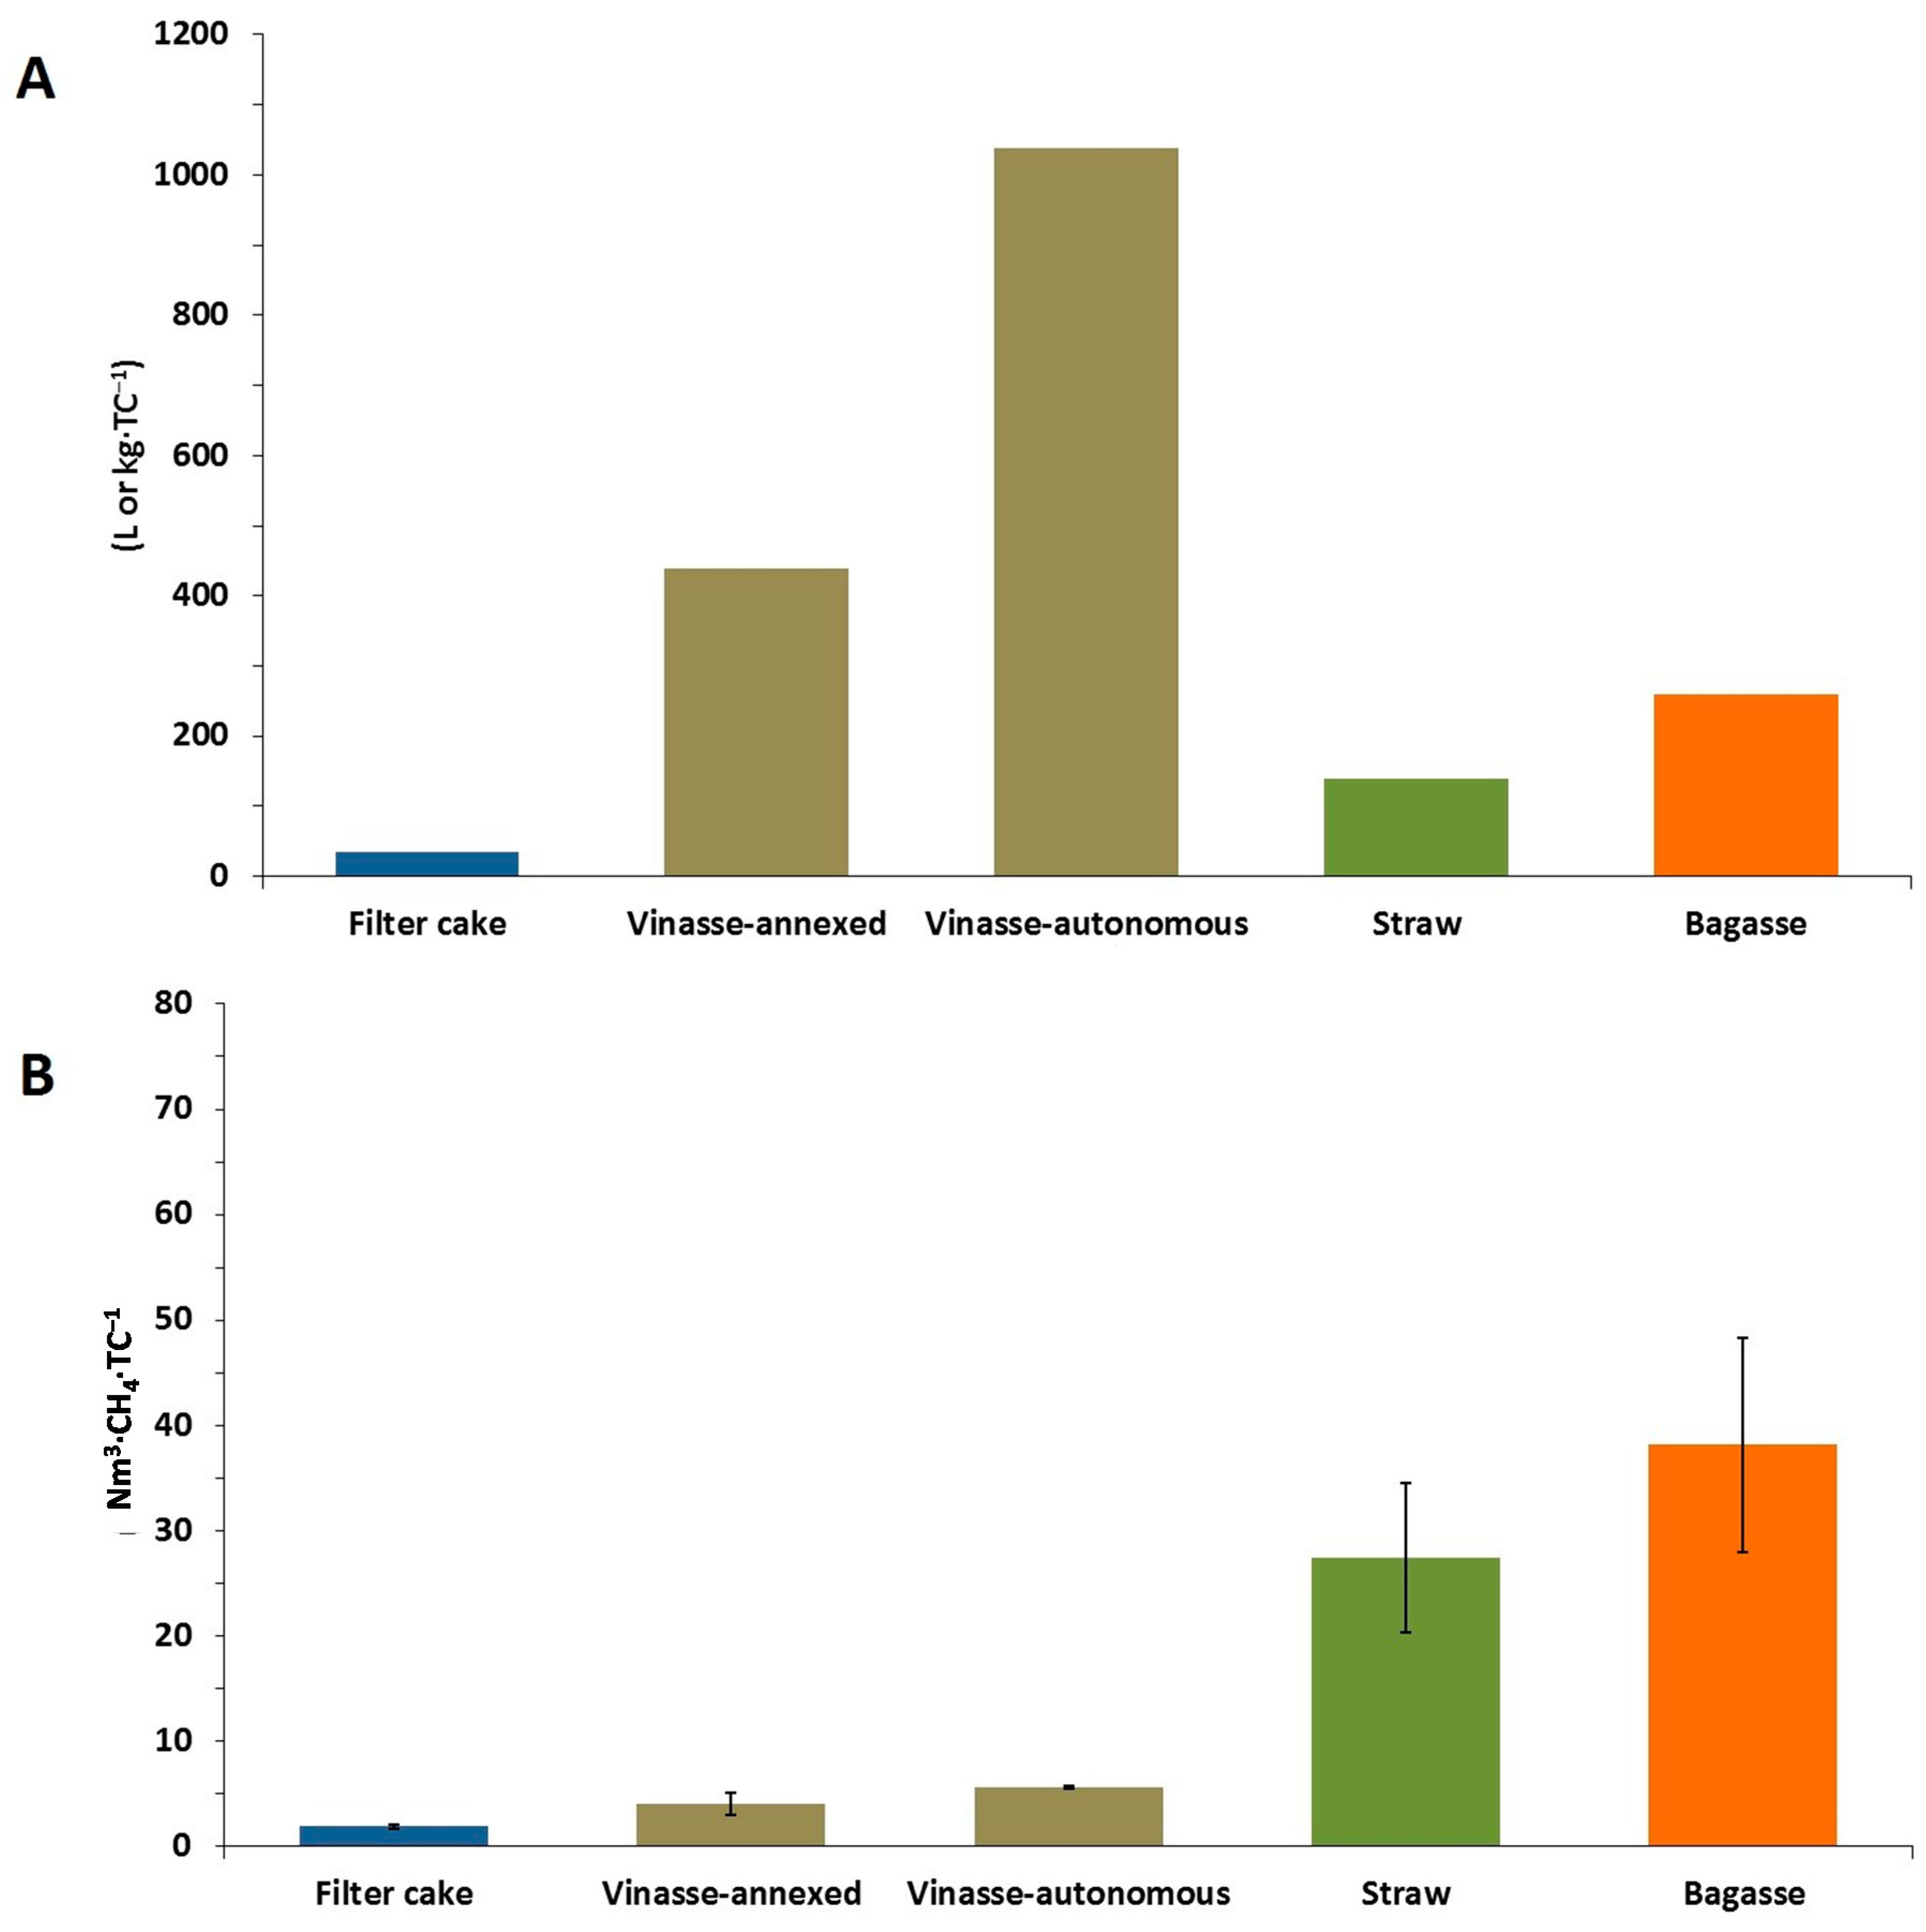
2.2. Biochemical Methane Potential
2.2.1. Methane Yields
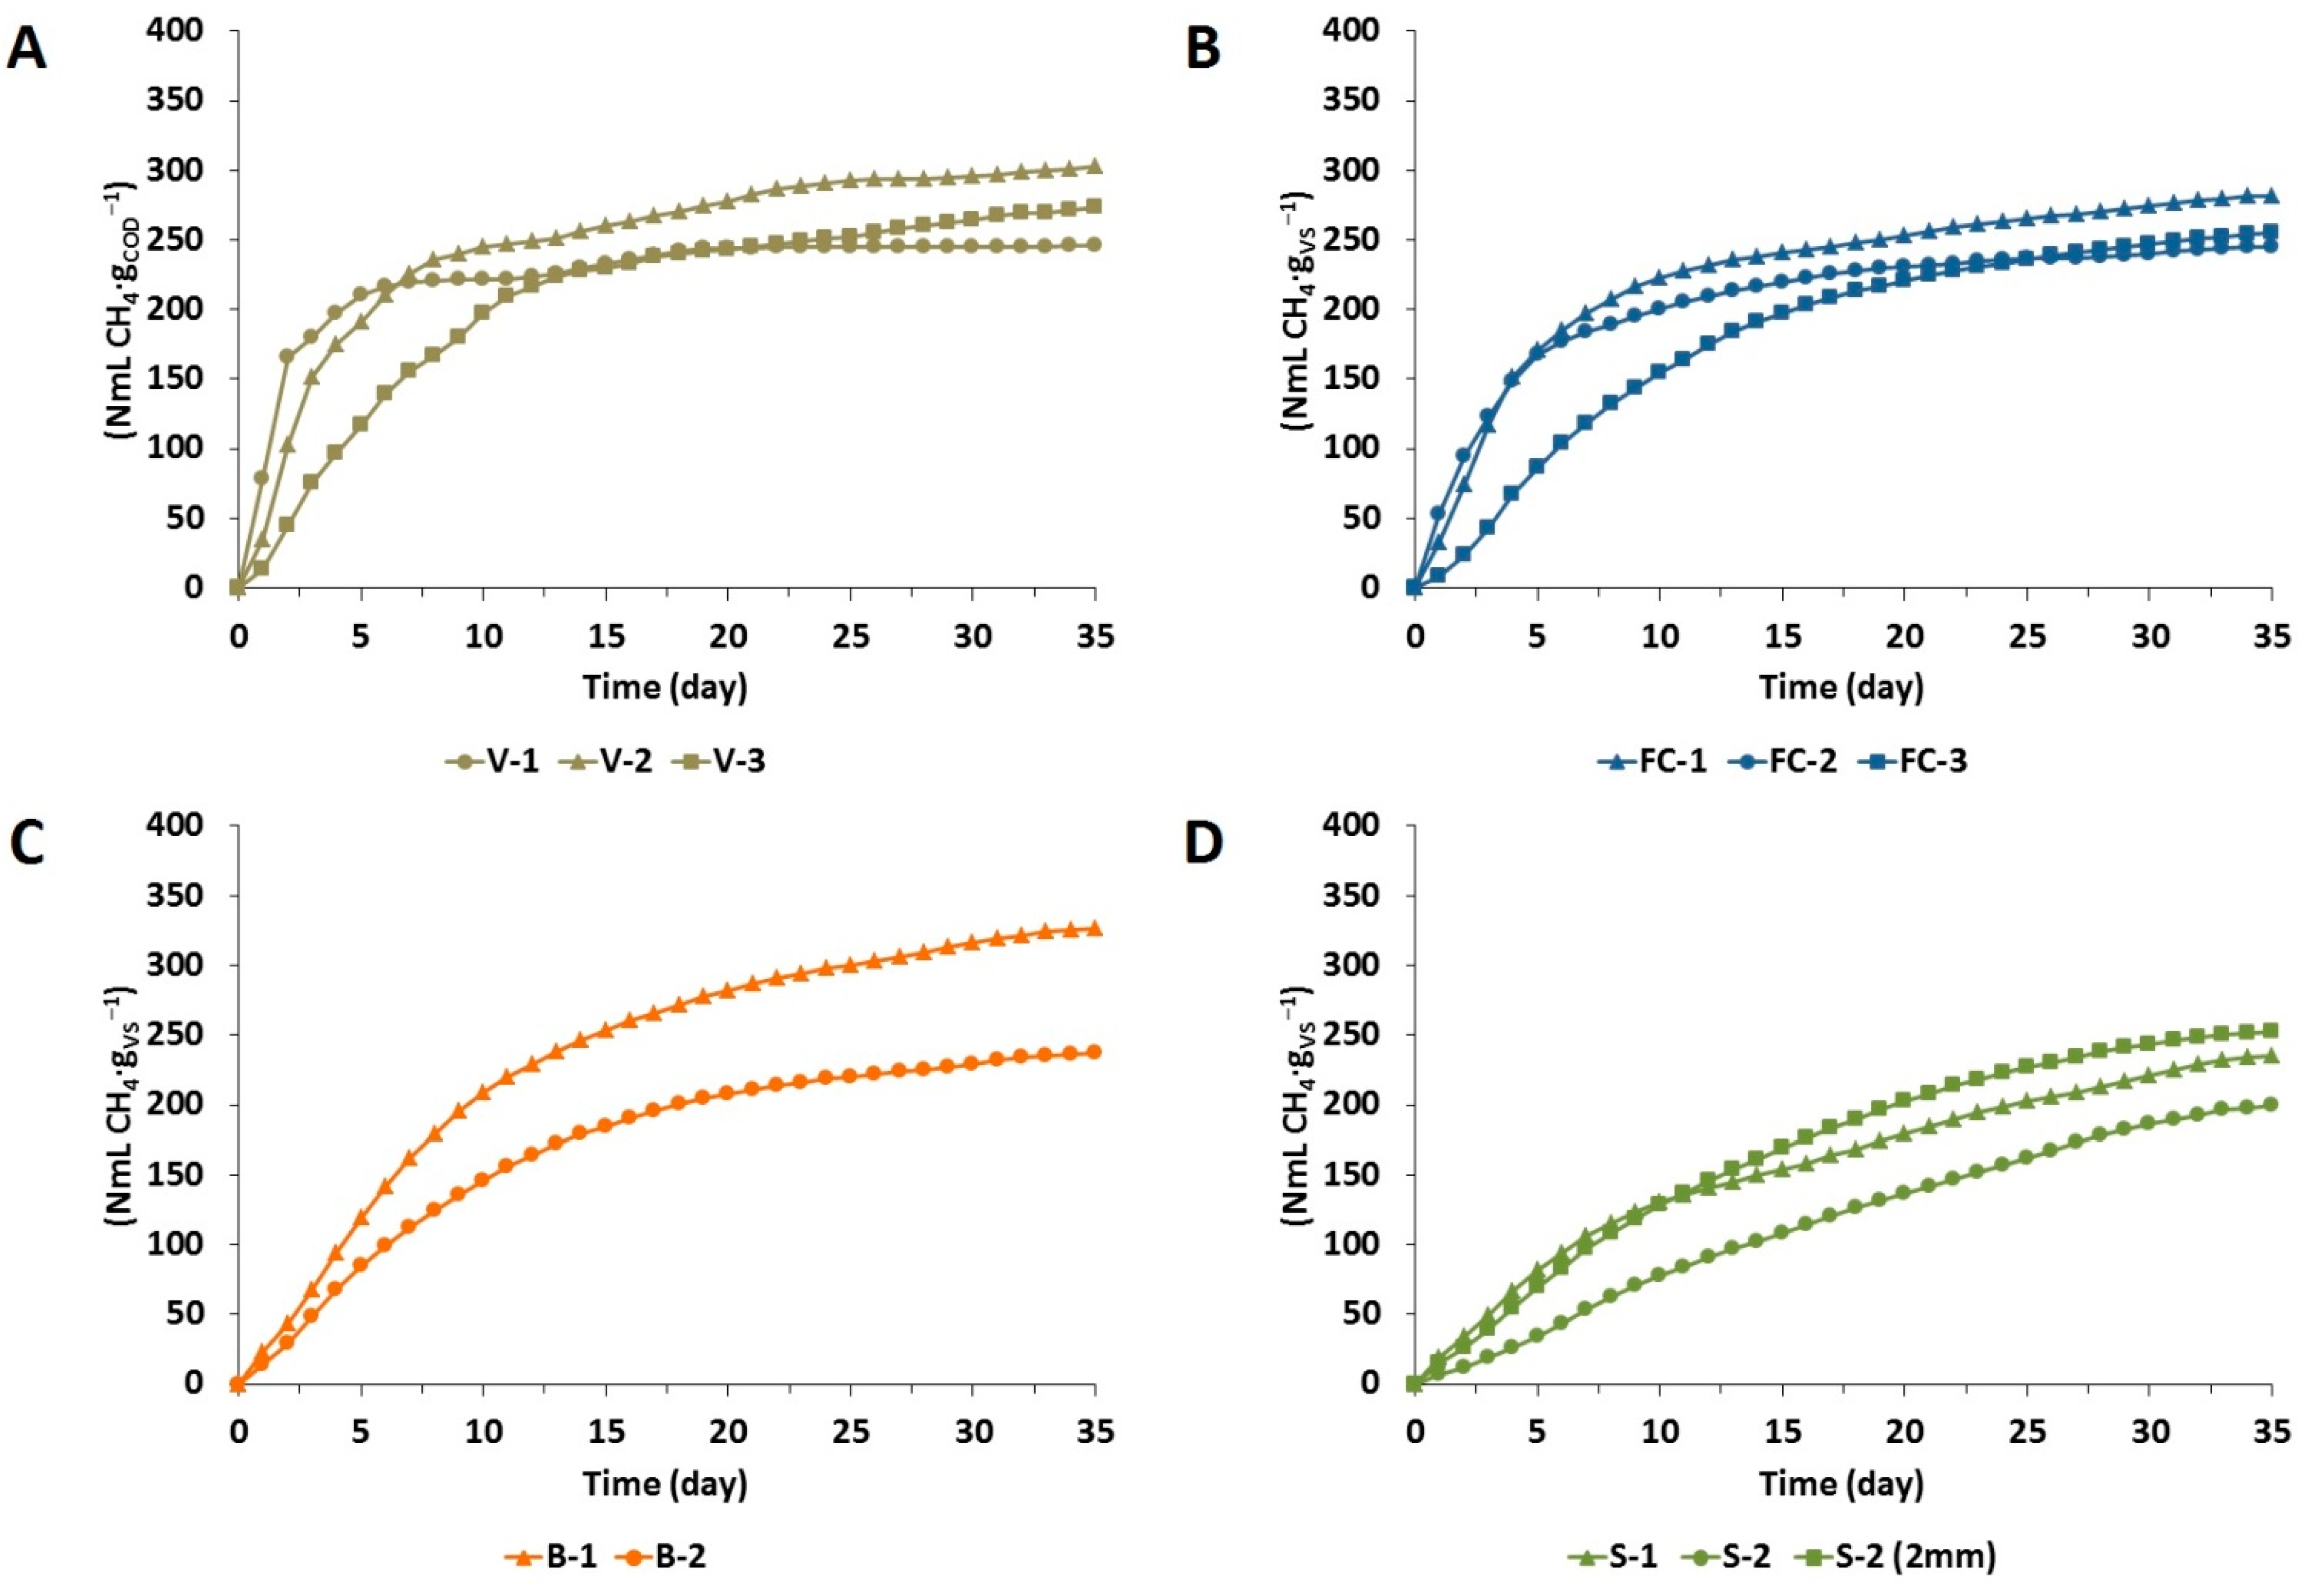
| Substrates | Samples | Methane Yield * [NmL·gVS−1or NmL·gCOD−1] | Methane Yield [Nm3·tonFM−1] | K [day−1] |
|---|---|---|---|---|
| Straw | S-1 | 234 ± 03 | 101 ± 01 | 0.091 |
| S-2 | 199 ± 23 | 126 ± 15 | 0.075 | |
| S-2 (2mm) | 252 ± 02 | 160 ± 01 | 0.102 | |
| Bagasse | B-1 | 326 ± 04 | 181 ± 02 | 0.119 |
| B-2 | 236 ± 05 | 119 ± 02 | 0.124 | |
| Filter cake | FC-1 | 281 ± 04 | 58 ± 01 | 0.159 |
| FC-2 | 245 ± 01 | 50 ± 01 | 0.178 | |
| FC-3 | 254 ± 08 | 54 ± 02 | 0.091 | |
| Vinasse | V-1 | 246 ± 15 | 05 ± 01 | 0.413 |
| V-2 | 302 ± 06 | 08 ± 01 | 0.209 | |
| V-3 | 273 ± 02 | 11 ± 01 | 0.107 |
2.2.2. Reaction Rates
2.2.3. Substrate Conversion in a CSTR System
| HRT (Days) | Vinasse | Filter Cake | Bagasse | Straw | |||||||
|---|---|---|---|---|---|---|---|---|---|---|---|
| V-1 | V-2 | V-3 | FC-1 | FC-2 | FC-3 | B-1 | B-2 | S-1 | S-2 | S-2 (2 mm) | |
| 5 | 0.67 | 0.51 | 0.35 | 0.45 | 0.47 | 0.31 | 0.37 | 0.38 | 0.31 | 0.27 | 0.34 |
| 10 | 0.80 | 0.68 | 0.52 | 0.62 | 0.64 | 0.48 | 0.54 | 0.55 | 0.48 | 0.43 | 0.50 |
| 15 | 0.86 | 0.76 | 0.62 | 0.71 | 0.73 | 0.58 | 0.64 | 0.65 | 0.58 | 0.53 | 0.60 |
| 20 | 0.89 | 0.81 | 0.68 | 0.77 | 0.78 | 0.65 | 0.70 | 0.71 | 0.64 | 0.60 | 0.67 |
| 25 | 0.91 | 0.84 | 0.73 | 0.80 | 0.82 | 0.70 | 0.75 | 0.76 | 0.69 | 0.65 | 0.72 |
| 30 | 0.93 | 0.86 | 0.76 | 0.83 | 0.84 | 0.73 | 0.78 | 0.79 | 0.73 | 0.69 | 0.75 |
| 35 | 0.94 | 0.88 | 0.79 | 0.85 | 0.86 | 0.76 | 0.81 | 0.81 | 0.78 | 0.72 | 0.78 |
| 40 | 0.94 | 0.89 | 0.81 | 0.87 | 0.88 | 0.79 | 0.83 | 0.83 | 0.78 | 0.75 | 0.80 |
| 45 | 0.95 | 0.90 | 0.83 | 0.88 | 0.89 | 0.80 | 0.84 | 0.85 | 0.80 | 0.77 | 0.82 |
| 50 | 0.95 | 0.91 | 0.84 | 0.89 | 0.90 | 0.82 | 0.86 | 0.86 | 0.82 | 0.79 | 0.84 |
| 55 | 0.96 | 0.92 | 0.86 | 0.90 | 0.91 | 0.83 | 0.87 | 0.87 | 0.83 | 0.80 | 0.85 |
| 60 | 0.96 | 0.93 | 0.87 | 0.91 | 0.91 | 0.85 | 0.88 | 0.88 | 0.84 | 0.82 | 0.86 |
| 65 | 0.96 | 0.93 | 0.87 | 0.91 | 0.92 | 0.86 | 0.89 | 0.89 | 0.85 | 0.83 | 0.87 |
| 70 | 0.97 | 0.94 | 0.88 | 0.92 | 0.93 | 0.86 | 0.89 | 0.90 | 0.86 | 0.84 | 0.88 |
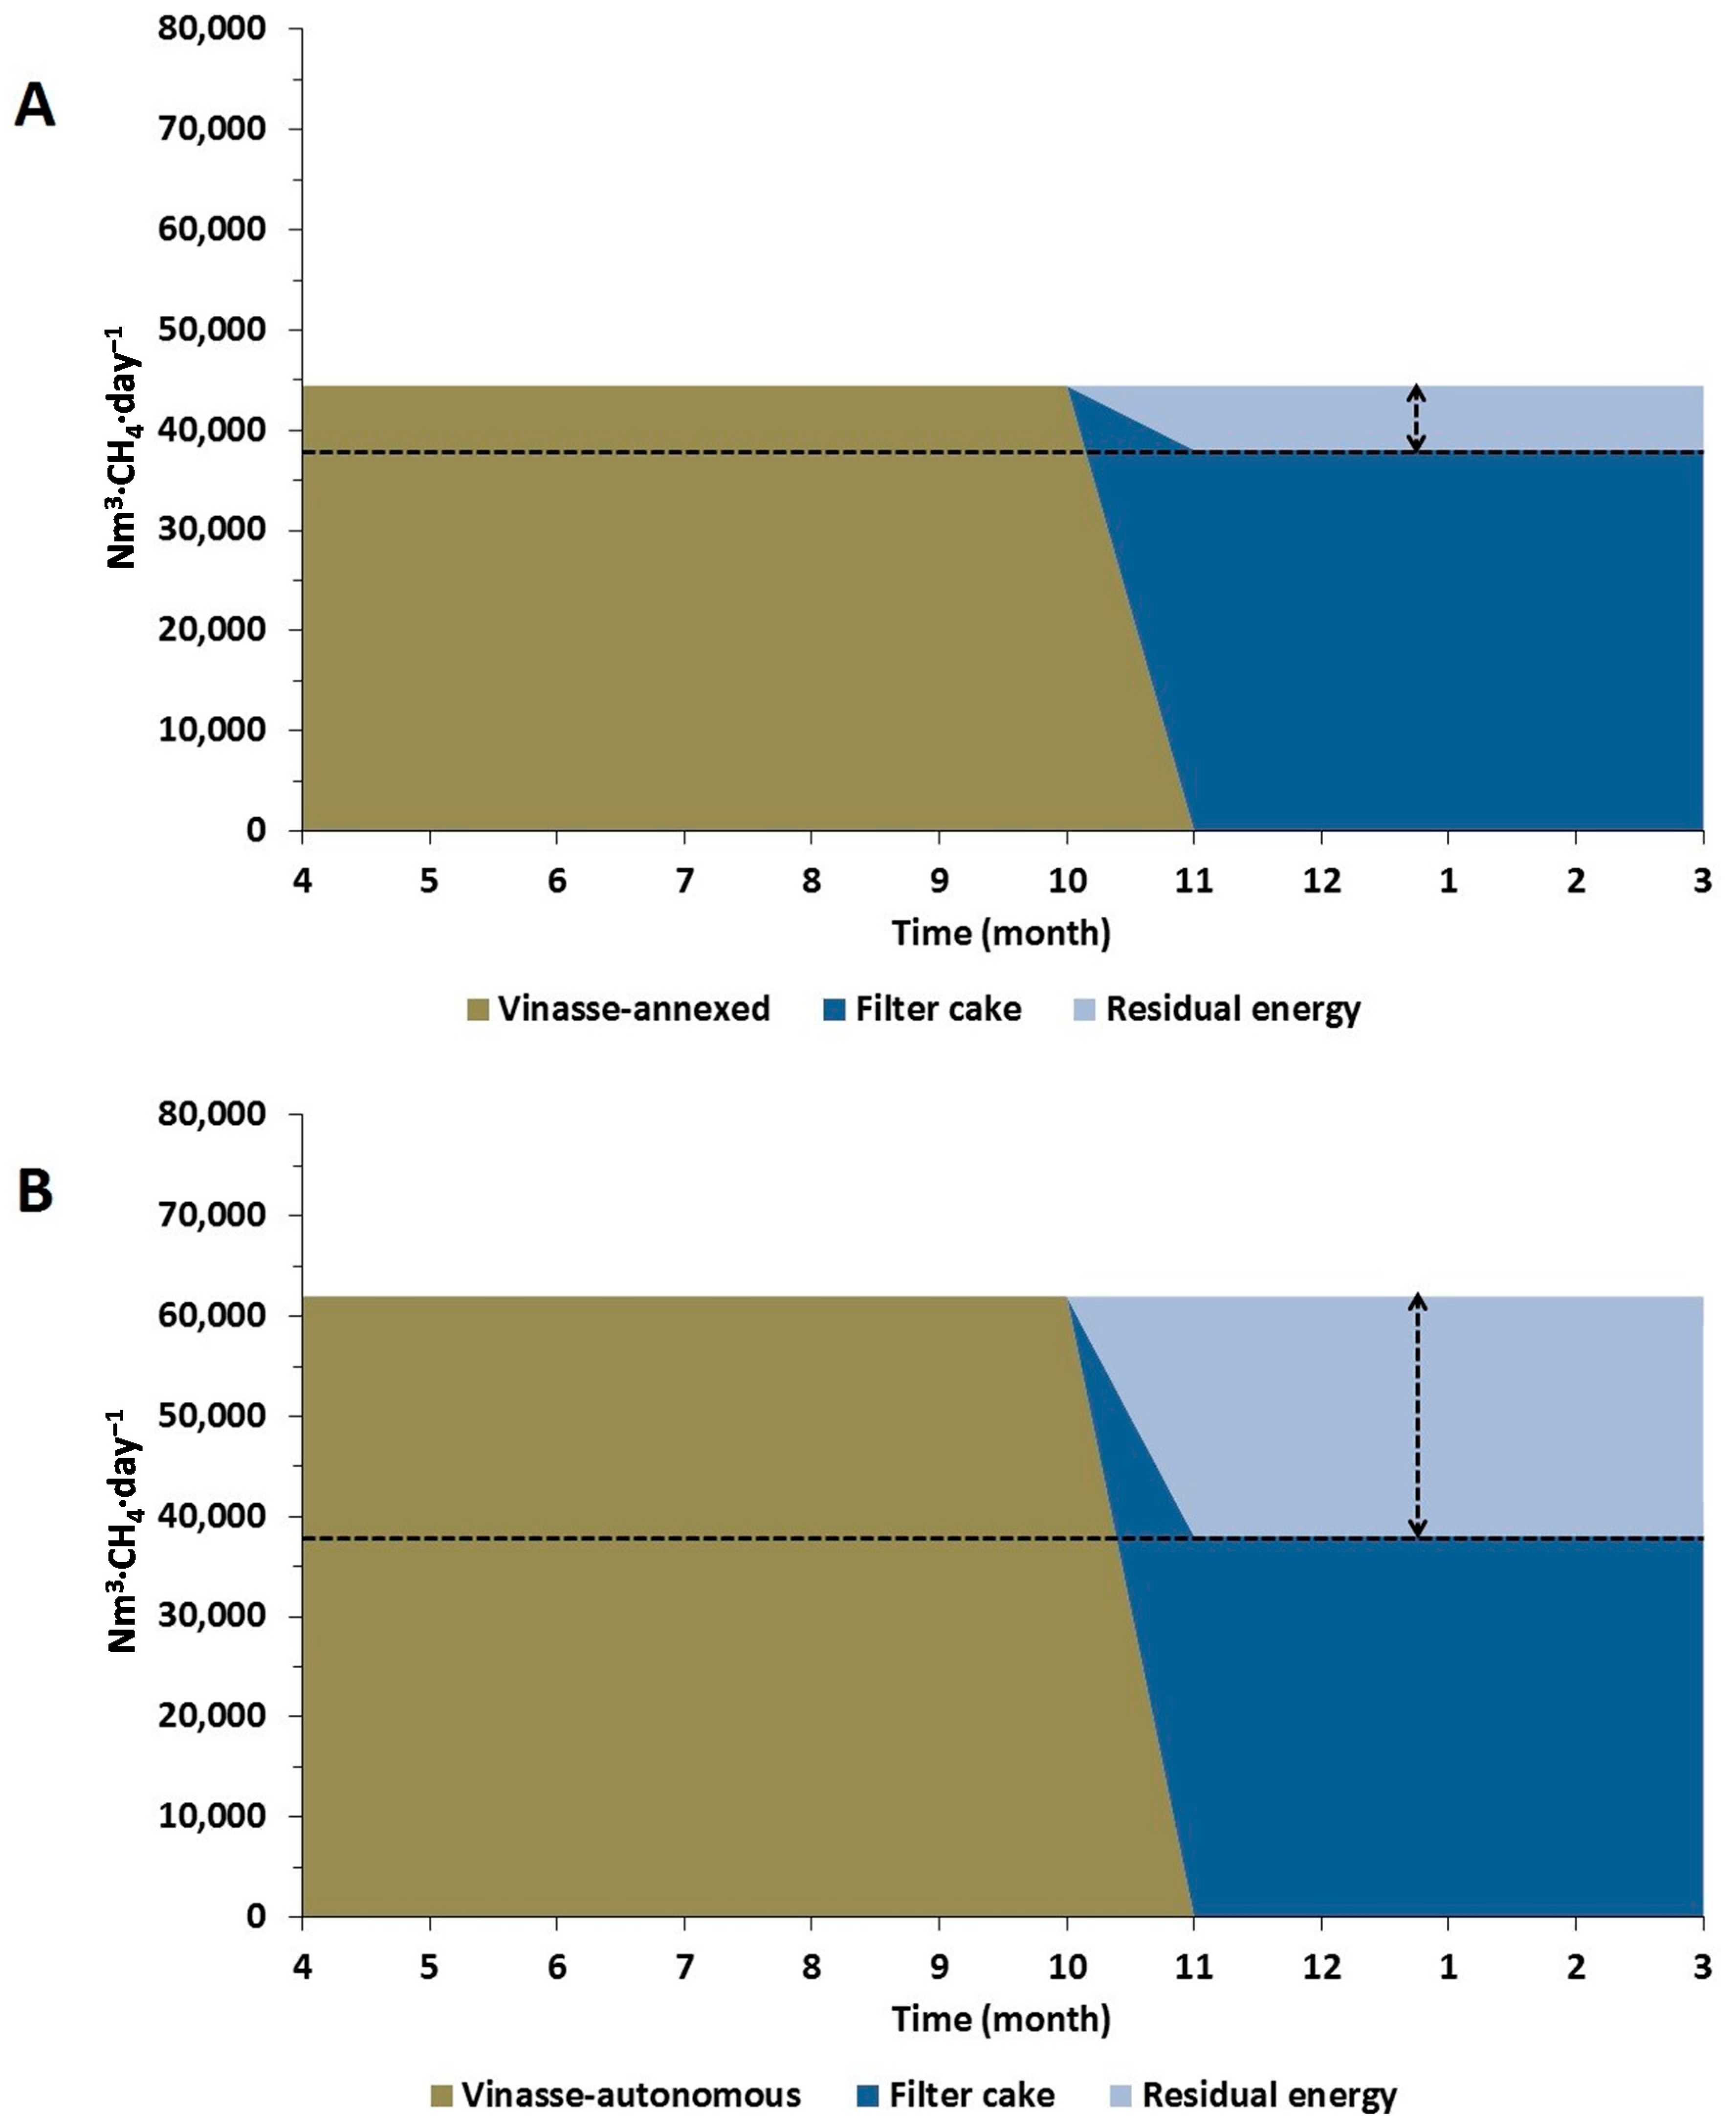
2.3. Process Design
2.3.1. Energy Potential
2.3.2. Energy Complementarities

| Aspects | Vinasse | Filter cake | Bagasse | Straw |
|---|---|---|---|---|
| Reactor type | Biomass immobilization system (e.g., UASB) | CSTR or combination with biomass immobilization system | CSTR with high HRT (>35 days) | CSTR with high HRT (>40 days) |
| Pre-treatment | Not necessary | Recommended | Highly recommended | Highly recommended |
| Macronutrients | Phosphorous addition to balance C:P ratio at autonomous plant | Sulfur addition to balance C:S ratio | Nitrogen, sulfur and phosphorus addition to balance C:N:P:S ratio | Nitrogen, sulfur and phosphorus addition to balance C:N:P:S ratio |
| Trace elements | Lack of Fe, Ni, Co, Mo, W, Mn, Cu, Se, and Zn | Lack of Mo, W, and Se | Lack of Fe, Ni, Co, Mo, W, Mn, Cu, Se, and Zn | Lack of Fe, Ni, Co, Mo, W, Mn, Cu, Se, and Zn |
| Major challenge | High sulfur content, especially at annexed plants | Storage in case of use during sugarcane offseason | Low biomass availability; High lignin content; | Substrate logistic; High lignin content |
3. Experimental Section
3.1. Substrates
3.2. Analytical Methods
3.3. Biochemical Methane Potential
3.4. Energy Assessment
4. Conclusions
Acknowledgments
Author Contributions
Conflicts of Interest
References
- Elbehri, A.; Segerstedt, A.; Liu, P. Biofuels and the Sustainability Challenge: A Global Assessment of Sustainability Issues, Trends and Policies for Biofuels and Related Feedstocks; FAO: Rome, Italy, 2013; p. 15. [Google Scholar]
- De Carvalho Macedo, I. Sugar Cane’s Energy—Twelve Studies on Brazilian Sugar Cane, 2nd ed.; UNICA: São Paulo, Brazil, 2007; pp. 119–137. [Google Scholar]
- UNICA (União da Indústria da Cana-de-açúcar) Unicadata: Brazilian sugarcane crushing during 2013/2014 season. Available online: http://www.unicadata.com.br (accessed on 11 August 2015).
- ANA (Agência Nacional de Águas). Manual de Conservação e Reuso de Água na Agroindústria Sucoenergética; Universidade de Brasília: Brasília, Brazil, 2009. (In Portuguese) [Google Scholar]
- De Paoli, F.; Bauer, A.; Leonhartsberger, C.; Amon, B.; Amon, T. Utilization of by-products from ethanol production as substrate for biogas production. Bioresour. Technol. 2011, 102, 6621–6624. [Google Scholar] [CrossRef] [PubMed]
- Leal, M.R.L.V; Galdos, M.V.; Scarpare, F.V.; Seabra, J.E.A; Walter, A.; Oliveira, C.O.F. Sugarcane straw availability, quality, recovery and energy use: A literature review. Biomass Bioenergy 2013, 53, 11–19. [Google Scholar] [CrossRef]
- UNICA (União da Indústria da Cana-de-açúcar). Moagem de cana-de-açúcar no Estado de São Paulo. Available online: http://www.unicadata.com.br/ (accessed on 15 February 2015). (In Portuguese)
- CEPE (Conselho Estadual de Política Energética). Plano Paulista de Energia—PPE 2020; Governo do Estado de São Paulo: São Paulo, Brazil, 2012. (In Portuguese)
- Governo do Estado de São Paulo. Programa Paulista de Biogás-Decreto n. 58.659. Available online: http://www.legislacao.sp.gov.br/legislacao/dg280202.nsf/5fb5269ed17b47ab83256cfb00501469/0250b268dd46ba4c83257acb004382ef?OpenDocument (accessed on 18 January 2015). (In Portuguese)
- Al Seadi, T.; Rutz, D.; Prassl, H.; Köttner, M.; Finsterwalder, T. Biogas Handbook; University of Southern Denmark: Funen, Denmark, 2008. [Google Scholar]
- Moraes, B.S.; Junqueira, T.L.; Pavanello, L.G.; Cavalett, O.; Mantelatto, P.E.; Bonomi, A.; Zaiat, M. Anaerobic digestion of vinasse from sugarcane biorefineries in Brazil from energy, environmental, and economic perspectives: Profit or expense? Appl. Energy 2014, 113, 825–835. [Google Scholar] [CrossRef]
- Janke, L.; Leite, A.F.; Wedwitschka, H.; Schmidt, T.; Nikolausz, M.; Stinner, W. Biomethane production integrated to the Brazilian sugarcane industry: The case study of São Paulo state. In Proceedings of the 22nd European Biomass Conference and Exhibition, Hamburg, Germany, 23–26 June 2014; pp. 23–26.
- FNR (Fachagentur Nachwachsende Rohstoffe e.V.). Guide to Biogas—From Production to Use; Fachagentur Nachwachsende Rohstoffe e.V. (FNR): Gülzow, Brazil, 2010; p. 24. [Google Scholar]
- Mccarty, P.L. Anaerobic Waste Treatment Fundamentals. Public Work 1964, 95, 107–112. [Google Scholar]
- Lv, Z.; Hu, M.; Harms, H.; Richnow, H.H.; Liebetrau, J.; Nikolausz, M. Stable isotope composition of biogas allows early warning of complete process failure as a result of ammonia inhibition in anaerobic digesters. Bioresour. Technol. 2014, 167, 251–259. [Google Scholar] [CrossRef] [PubMed]
- Britz, T.; Noeth, C.; Lategan, P. Nitrogen and phosphate requirements for the anaerobic digestion of a petrochemical effluent. Water Res. 1988, 22, 163–169. [Google Scholar] [CrossRef]
- Scherer, P.; Neumann, L.; Demirel, B.; Schmidt, O.; Unbehauen, M. Long term fermentation studies about the nutritional requirements for biogasification of fodder beet silage as mono-substrate. Biomass Bioenergy 2009, 33, 873–881. [Google Scholar] [CrossRef]
- Oremland, R.S.; Polcin, S. Methanogenesis and sulfate reduction: competitive and noncompetitive substrates in estuarine sediments. Appl. Environ. Microbiol. 1982, 44, 1270–1276. [Google Scholar] [PubMed]
- Raskin, L.; Rittmann, B.E.; Stahl, D.A. Competition and coexistence of sulfate-reducing and methanogenic populations in anaerobic biofilms. Appl. Environ. Microbiol. 1996, 62, 3847–3857. [Google Scholar] [PubMed]
- Lauterböck, B.; Nikolausz, M.; Lv, Z.; Baumgartner, M.; Liebhard, G.; Fuchs, W. Improvement of anaerobic digestion performance by continuous nitrogen removal with a membrane contactor treating a substrate rich in ammonia and sulfide. Bioresour. Technol. 2014, 158, 209–216. [Google Scholar] [CrossRef] [PubMed]
- Ramos, I.; Peña, M.; Fdz-Polanco, M. Where does the removal of H2S from biogas occur in microaerobic reactors? Bioresour. Technol. 2014, 166, 151–157. [Google Scholar] [CrossRef] [PubMed]
- Kayhanian, M.; Rich, D. Pilot-scale high solids thermophilic anaerobic digestion of municipal solid waste with an emphasis on nutrient requirements. Biomass Bioenergy 1995, 8, 433–444. [Google Scholar] [CrossRef]
- Schmidt, T.; Nelles, M.; Scholwin, F.; Pröter, J. Trace element supplementation in the biogas production from wheat stillage—Optimization of metal dosing. Bioresour. Technol. 2014, 168, 80–85. [Google Scholar] [CrossRef] [PubMed]
- Gustavsson, J.; Shakeri Yekta, S.; Sundberg, C.; Karlsson, A.; Ejlertsson, J.; Skyllberg, U.; Svensson, B.H. Bioavailability of cobalt and nickel during anaerobic digestion of sulfur-rich stillage for biogas formation. Appl. Energy 2013, 112, 473–477. [Google Scholar] [CrossRef]
- Shakeri, S.; Svensson, B.H.; Björn, A.; Skyllberg, U. Thermodynamic modeling of iron and trace metal solubility and speciation under sulfidic and ferruginous conditions in full scale continuous stirred tank biogas reactors. Appl. Geochem. 2014, 47, 61–73. [Google Scholar] [CrossRef]
- Radjaram, B.; Saravanane, R. Assessment of optimum dilution ratio for biohydrogen production by anaerobic co-digestion of press mud with sewage and water. Bioresour. Technol. 2011, 102, 2773–2780. [Google Scholar] [CrossRef] [PubMed]
- Shakeri Yekta, S.; Lindmark, A.; Skyllberg, U.; Danielsson, Å.; Svensson, B.H. Importance of reduced sulfur for the equilibrium chemistry and kinetics of Fe(II), Co(II) and Ni(II) supplemented to semi-continuous stirred tank biogas reactors fed with stillage. J. Hazard. Mater. 2014, 269, 83–88. [Google Scholar] [CrossRef] [PubMed]
- Oechsner, H.-W.; Lemmer, A.; Hamhold, D.; Mathies, E.; Mayrhuber, E.; Preißler, D. Method for Producing Biogas in Controlled Concentrations of Trace Elements. Patent US20100304457 A1, 2 December 2008. [Google Scholar]
- Leite, A.F.; Janke, L.; Harms, H.; Zang, J.W.; Fonseca-Zang, W.A.; Stinner, W.; Nikolausz, M. Assessment of the variations in characteristics and methane potential of major waste products from the Brazilian bioethanol industry along an operating season. Energy Fuels 2015, 29, 4022–4029. [Google Scholar] [CrossRef]
- Janke, L.; Leite, A.; Batista, K.; Weinrich, S.; Sträuber, H.; Nikolausz, M.; Nelles, M.; Stinner, W. Optimization of hydrolysis and volatile fatty acids production from sugarcane filter cake: Effects of urea supplementation and sodium hydroxide pretreatment. Bioresour. Technol. 2015. [CrossRef] [PubMed]
- Zheng, Y.; Zhao, J.; Xu, F.; Li, Y. Pretreatment of lignocellulosic biomass for enhanced biogas production. Prog. Energy Combust. Sci. 2014, 42, 35–53. [Google Scholar] [CrossRef]
- Zhu, J.; Wan, C.; Li, Y. Enhanced solid-state anaerobic digestion of corn stover by alkaline pretreatment. Bioresour. Technol. 2010, 101, 7523–7528. [Google Scholar] [CrossRef] [PubMed]
- Montgomery, L.F.R.; Bochmann, G. Pretreatment of Feedstock for Enhanced Biogas Production; IEA Bioenergy: Dublin, Ireland, 2014; p. 4. [Google Scholar]
- Wilkie, A.C.; Riedesel, K.J.; Owens, J.M. Stillage characterization and anaerobic treatment of ethanol stillage from conventional and cellulosic feedstocks. Biomass Bioenergy 2000, 19, 63–102. [Google Scholar] [CrossRef]
- Fang, H.H.P. Environmental Anaerobic Technology: Applications and New Developments; Imperial College Press: London, UK, 2010; p. 59. [Google Scholar]
- López González, L.M.; Vervaeren, H.; Pereda Reyes, I.; Dumoulin, A.; Romero Romero, O.; Dewulf, J. Thermo-chemical pre-treatment to solubilize and improve anaerobic biodegradability of press mud. Bioresour. Technol. 2013, 131, 250–257. [Google Scholar] [CrossRef] [PubMed]
- López González, L.M.; Pereda Reyes, I.; Dewulf, J.; Budde, J.; Heiermann, M.; Vervaeren, H. Effect of liquid hot water pre-treatment on sugarcane press mud methane yield. Bioresour. Technol. 2014, 169, 284–290. [Google Scholar] [CrossRef] [PubMed]
- VDI 4630-Fermentation of Organic Materials: Characterisation of the Substrate, Sampling, Collection of Material Data, Fermentation Tests; VDI-Gesselschaft Energietechnik, Beuth Verlag: Berlin, Germany, 2006; p. 11.
- Liebetrau, J.; Pfeiffer, D.; Thrän, D. Messmethodensammlummg Biogas—Methoden zur Bestimmung von analytischen und prozessbeshreibenden Parametern im Biogasbereich; Liebetrau, J., Pfeiffer, D., Thrän, D., Eds.; DBFZ Deutsches Biomasseforschungszentrum: Leipzig, Germany, 2015; pp. 38–50. [Google Scholar]
- DIN EN ISO 15587-2-2002: Water Quality—Digestion for the Determination of Selected Elements in Water—Part 2: Nitric Acid Digestion (ISO 15587-2:2002); DIN Deutsches Institut für Normung e. V.: Berlin, Germany, 2002; p. 13.
- DIN EN 16170: Schlamm, Behandelter Bioabfall und Boden—Bestimmung von Spurenelementen Mittels Optischer Emissionsspektrometrie mit Induktiv Gekoppeltem Plasma (ICP-OES); DIN Deutsches Institut für Normung e. V.: Berlin, Germany, 2011; p. 7.
- DIN, DIN EN 15104: Feste Biobrennstoffe—Bestimmung des Gesamtgehaltes an Kohlenstoff, Wasserstoff und Stickstoff—Instrumentelle Verfahren; DIN Deutsches Institut für Normung e. V.: Berlin, Germany, 2011; p. 8.
- Schumacher, B.; Wedwitschka, H.; Hofmann, J.; Denysenko, V.; Lorenz, H.; Liebetrau, J. Disintegration in the biogas sector—Technologies and effects. Bioresour. Technol. 2014, 168, 2–6. [Google Scholar] [CrossRef] [PubMed]
© 2015 by the authors; licensee MDPI, Basel, Switzerland. This article is an open access article distributed under the terms and conditions of the Creative Commons Attribution license (http://creativecommons.org/licenses/by/4.0/).
Share and Cite
Janke, L.; Leite, A.; Nikolausz, M.; Schmidt, T.; Liebetrau, J.; Nelles, M.; Stinner, W. Biogas Production from Sugarcane Waste: Assessment on Kinetic Challenges for Process Designing. Int. J. Mol. Sci. 2015, 16, 20685-20703. https://doi.org/10.3390/ijms160920685
Janke L, Leite A, Nikolausz M, Schmidt T, Liebetrau J, Nelles M, Stinner W. Biogas Production from Sugarcane Waste: Assessment on Kinetic Challenges for Process Designing. International Journal of Molecular Sciences. 2015; 16(9):20685-20703. https://doi.org/10.3390/ijms160920685
Chicago/Turabian StyleJanke, Leandro, Athaydes Leite, Marcell Nikolausz, Thomas Schmidt, Jan Liebetrau, Michael Nelles, and Walter Stinner. 2015. "Biogas Production from Sugarcane Waste: Assessment on Kinetic Challenges for Process Designing" International Journal of Molecular Sciences 16, no. 9: 20685-20703. https://doi.org/10.3390/ijms160920685
APA StyleJanke, L., Leite, A., Nikolausz, M., Schmidt, T., Liebetrau, J., Nelles, M., & Stinner, W. (2015). Biogas Production from Sugarcane Waste: Assessment on Kinetic Challenges for Process Designing. International Journal of Molecular Sciences, 16(9), 20685-20703. https://doi.org/10.3390/ijms160920685