HQSAR Model Development
At first, the hologram sizes were set as the prime numbers available in the HQSAR program in order to minimize the probability of bad fragment collisions. Then, maintaining the default fragment size values (4–7 atoms), the maximum number of components (NC) was set to fifteen, which is smaller than half the number of training set compounds (
N = 36). Finally, various fragment distinction (FD) parameters were tested, obtaining sixteen different models (
Table 1).
Table 1.
Summary of the HQSAR statistical indexes for various fragment distinction (FD) parameters using the default fragment size (4–7 atoms) for the 6-arylquinazolin-4-amine derivatives (N = 36).
Table 1.
Summary of the HQSAR statistical indexes for various fragment distinction (FD) parameters using the default fragment size (4–7 atoms) for the 6-arylquinazolin-4-amine derivatives (N = 36).
| FD b | Statistical Indexes a |
|---|
| q2 | R2 | SE | SEcv | NC | HL |
|---|
| A/B | 0.732 | 0.847 | 0.373 | 0.493 | 3 | 61 |
| A/C | 0.728 | 0.799 | 0.421 | 0.489 | 2 | 353 |
| A/H | 0.640 | 0.782 | 0.444 | 0.571 | 3 | 199 |
| A/DA | 0.697 | 0.896 | 0.323 | 0.551 | 6 | 59 |
| B/C | 0.711 | 0.841 | 0.380 | 0.512 | 3 | 53 |
| B/H | 0.727 | 0.824 | 0.400 | 0.498 | 3 | 59 |
| C/H | 0.740 | 0.801 | 0.419 | 0.478 | 2 | 353 |
| C/DA | 0.720 | 0.834 | 0.394 | 0.512 | 4 | 61 |
| A/B/C | 0.724 | 0.855 | 0.323 | 0.500 | 3 | 53 |
| A/B/H | 0.670 | 0.781 | 0.446 | 0.547 | 3 | 401 |
| A/C/H | 0.656 | 0.818 | 0.413 | 0.567 | 4 | 401 |
| A/C/DA | 0.721 | 0.842 | 0.394 | 0.511 | 4 | 61 |
| B/C/Ch | 0.711 | 0.841 | 0.380 | 0.512 | 3 | 53 |
| A/B/C/H | 0.691 | 0.777 | 0.443 | 0.521 | 2 | 353 |
| A/C/Ch/DA | 0.742 | 0.876 | 0.341 | 0.491 | 4 | 257 |
| A/B/C/Ch/DA | 0.743 | 0.917 | 0.284 | 0.498 | 5 | 53 |
According to
Table 2, all the HQSAR models were acceptable, since the lowest cross-validated correlation coefficient (
q2) is 0.640. However, considering only models showing
q2 values higher than 0.730, there were four best models,
i.e.,
A/B/C/Ch/DA (
q2 = 0.743),
A/C/Ch/DA (
q2 = 0.742),
C/H (
q2 = 0.740), and
A/B (
q2 = 0.732), which were used to evaluate the influence of fragment size on model quality.
In order to improve the previously calculated models, eight new templates were generated to each of the four best models, considering different fragment sizes, starting from two to twelve atoms, varying in four units each fragment (2–5, 3–6, 4–7, 5–8, 6–9, 7–10, 8–11, and 9–12 atoms). Only the statistical indexes obtained for the models using the
A/B/C/Ch/DA (
Table 2) and
A/B (
Table 3) parameters are shown, since the statistical indexes obtained for the models using the
C/H and
A/C/Ch/DA parameters did not show improvement. The fragment size variation improved the
q2 and
R2 values and minimizes the SE values, resulting in two best models (
Table 2 and
Table 3).
Table 2.
Summary of the HQSAR statistical indexes for the influence of various fragment sizes (FS, 2–12 atoms) using the fragment distinction parameter A/B/C/Ch/DA for the 6-arylquinazolin-4-amine derivatives (N = 36).
Table 2.
Summary of the HQSAR statistical indexes for the influence of various fragment sizes (FS, 2–12 atoms) using the fragment distinction parameter A/B/C/Ch/DA for the 6-arylquinazolin-4-amine derivatives (N = 36).
| FS | Statistical Indexes a |
|---|
| q2 | R2 | SE | SEcv | NC | HL |
|---|
| 2–5 | 0.734 | 0.855 | 0.362 | 0.491 | 3 | 401 |
| 3–6 | 0.757 | 0.937 | 0.251 | 0.493 | 6 | 53 |
| 4–7 | 0.743 | 0.917 | 0.284 | 0.498 | 5 | 53 |
| 5–8 | 0.751 | 0.883 | 0.331 | 0.483 | 4 | 53 |
| 6–9 | 0.738 | 0.871 | 0.347 | 0.496 | 4 | 61 |
| 7–10 | 0.732 | 0.920 | 0.282 | 0.518 | 6 | 53 |
| 8–11 | 0.681 | 0.906 | 0.302 | 0.556 | 5 | 151 |
| 9–12 | 0.642 | 0.804 | 0.421 | 0.570 | 3 | 151 |
Table 3.
Summary of the HQSAR statistical indexes for the influence of various fragment sizes (FS, 2–12 atoms) using the fragment distinction parameter A/B for the 6-arylquinazolin-4-amine derivatives (N = 36).
Table 3.
Summary of the HQSAR statistical indexes for the influence of various fragment sizes (FS, 2–12 atoms) using the fragment distinction parameter A/B for the 6-arylquinazolin-4-amine derivatives (N = 36).
| FS | Statistical Indexes a |
|---|
| q2 | R2 | SE | SEcv | NC | HL |
|---|
| 2–5 | 0.737 | 0.848 | 0.372 | 0.488 | 3 | 61 |
| 3–6 | 0.717 | 0.858 | 0.359 | 0.507 | 3 | 83 |
| 4–7 | 0.732 | 0.847 | 0.373 | 0.493 | 3 | 61 |
| 5–8 | 0.713 | 0.839 | 0.382 | 0.510 | 3 | 61 |
| 6–9 | 0.719 | 0.848 | 0.377 | 0.513 | 4 | 61 |
| 7–10 | 0.748 | 0.847 | 0.372 | 0.478 | 3 | 199 |
| 8–11 | 0.724 | 0.848 | 0.371 | 0.500 | 3 | 401 |
| 9–12 | 0.705 | 0.829 | 0.394 | 0.517 | 3 | 83 |
The best model of the fragment distinction parameter
A/B/C/Ch/DA contains 3–6 atoms per fragment (
Table 2), while the best model of the fragment distinction parameter
A/B contains 7–10 atoms per fragment (
Table 3). It is worthy to note that the best model is the one containing five fragment distinction parameters (
A/B/C/Ch/DA) and a fragment size of 3–6 atoms (
Table 2), which means that the biological activity of this series of compounds seems to be better explained by a varied set of parameters in a fragment of reduced size. Thus, removing any of these parameters in the model leads to significant loss of information.
The Y-randomization test was carried out in order to analyze the robustness of the best models obtained (
Table 2 and
Table 3). In this test, the biological activity values were randomized and new HQSAR runs were performed (
Table 4). According to
Table 4, all models obtained by the Y-randomization test were very poor (the highest
q2 value was 0.211) and this result reinforced the robustness of the original models, since there were low probability that the observed correlation occurred by chance.
Table 4.
Summary of the HQSAR statistical indexes in the Y-randomization test using the default fragment size (4–7 atoms) for the 6-arylquinazolin-4-amine derivatives (N = 36).
Table 4.
Summary of the HQSAR statistical indexes in the Y-randomization test using the default fragment size (4–7 atoms) for the 6-arylquinazolin-4-amine derivatives (N = 36).
| FD b | Statistical Indexes a |
|---|
| q2 | R2 | SE | SEcv | NC | HL |
|---|
| A/B | 0.143 | 0.396 | 0.694 | 0.827 | 2 | 353 |
| A/C | 0.117 | 0.722 | 0.502 | 0.895 | 6 | 59 |
| A/H | 0.058 | 0.381 | 0.703 | 0.867 | 2 | 199 |
| A/DA | 0.113 | 0.586 | 0.593 | 0.868 | 4 | 59 |
| B/C | 0.062 | 0.183 | 0.795 | 0.852 | 1 | 53 |
| B/H | 0.041 | 0.824 | 0.400 | 0.498 | 3 | 59 |
| C/H | 0.055 | 0.264 | 0.756 | 0.868 | 2 | 401 |
| C/DA | 0.089 | 0.202 | 0.785 | 0.840 | 1 | 53 |
| A/B/C | 0.211 | 0.713 | 0.510 | 0.846 | 6 | 61 |
| A/B/H | 0.044 | 0.351 | 0.719 | 0.873 | 2 | 401 |
| A/C/H | 0.045 | 0.359 | 0.715 | 0.872 | 2 | 353 |
| A/C/DA | 0.098 | 0.215 | 0.779 | 0.835 | 1 | 71 |
| B/C/Ch | 0.062 | 0.183 | 0.794 | 0.852 | 1 | 53 |
| A/B/C/H | 0.051 | 0.314 | 0.739 | 0.870 | 2 | 257 |
| A/C/Ch/DA | 0.106 | 0.222 | 0.776 | 0.832 | 1 | 71 |
| A/B/C/Ch/DA | 0.099 | 0.235 | 0.770 | 0.835 | 1 | 151 |
After generation and internal validation of the best model, the external validation was carried out in order to access its ability to predict the biological activity values for the test set compounds,
i.e., those compounds excluded from the training set used for model generation. The predictive ability of the HQSAR model is expressed by predictive
R2 values, which are similar to cross-validated
R2 (
q2), and calculated using Equation (1).
The experimental (pIC
50Exp) and predicted (pIC
50Pred) biological activities, and residuals (pIC
50Exp − pIC
50Pred) of the 6-arylquinazolin-4-amine derivatives obtained by the best HQSAR models from the fragment distinction parameters
A/B/C/Ch/DA and
A/B are reported in
Table 5 and
Table 6, respectively. The comparison plots between the pIC
50Exp and pIC
50Pred values of both training and test sets of the best HQSAR models from the fragment distinction parameters
A/B/C/Ch/DA and
A/B are shown in
Figure 1 and
Figure 2, respectively.
Table 5.
Experimental pIC50 (Exp) and predicted pIC50 (Pred) biological activities, and residuals (Res = Exp − Pred) of the 6-arylquinazolin-4-amine derivatives using the best HQSAR model with the fragment distinction parameters A/B/C/Ch/DA.
Table 5.
Experimental pIC50 (Exp) and predicted pIC50 (Pred) biological activities, and residuals (Res = Exp − Pred) of the 6-arylquinazolin-4-amine derivatives using the best HQSAR model with the fragment distinction parameters A/B/C/Ch/DA.
| # a | Exp | Pred | Res | # a | Exp | Pred | Res |
|---|
| 1 | 7.21 | 6.86 | 0.35 | 26 | 7.29 | 7.36 | −0.07 |
| 2 | 5.90 | 5.52 | 0.38 | 27 | 7.59 | 7.38 | 0.21 |
| 3 * | 5.46 | 5.26 | 0.20 | 28 | 6.81 | 6.79 | 0.02 |
| 4 | 5.24 | 5.53 | −0.29 | 29 * | 6.04 | 6.78 | −0.74 |
| 5 | 5.50 | 5.45 | 0.05 | 30 | 6.27 | 6.25 | 0.02 |
| 6 | 5.05 | 4.98 | 0.07 | 31 | 6.92 | 6.76 | 0.16 |
| 7 | 6.79 | 6.82 | −0.03 | 32 (R) * | 7.03 | 7.13 | −0.10 |
| 8 | 5.35 | 5.35 | 0.00 | 32 (S) * | 7.03 | 7.25 | −0.22 |
| 9 | 6.74 | 6.81 | −0.07 | 33 (R) * | 6.87 | 6.99 | −0.12 |
| 10 | 5.84 | 5.89 | −0.05 | 33 (S) * | 6.87 | 6.98 | −0.11 |
| 11 * | 5.33 | 6.14 | −0.81 | 34 (R) * | 7.52 | 6.97 | 0.55 |
| 12 | 7.51 | 7.26 | 0.25 | 34 (S) * | 7.52 | 6.97 | 0.55 |
| 13 | 7.42 | 7.30 | 0.12 | 35 | 7.12 | 7.09 | 0.03 |
| 14 | 5.94 | 6.39 | 0.45 | 36 * | 7.77 | 6.93 | 0.84 |
| 15 | 6.59 | 7.33 | −0.74 | 37 | 5.94 | 5.98 | 0.04 |
| 16 | 7.46 | 6.97 | 0.49 | 38 | 6.25 | 6.00 | 0.25 |
| 17 | 7.08 | 7.16 | −0.08 | 39 | 6.23 | 6.20 | 0.03 |
| 18 | 7.01 | 7.08 | −0.07 | 40 | 5.44 | 5.43 | 0.01 |
| 19 | 7.13 | 7.03 | 0.10 | 41 | 5.47 | 5.25 | 0.22 |
| 20 * | 7.24 | 6.78 | 0.46 | 42 | 5.82 | 5.19 | 0.63 |
| 21 | 6.90 | 6.83 | 0.07 | 43 * | 5.85 | 5.66 | 0.19 |
| 22 | 7.03 | 7.15 | −0.12 | 44 | 5.57 | 5.06 | 0.51 |
| 23 * | 6.69 | 6.56 | 0.13 | 45 | 5.31 | 5.19 | 0.13 |
| 24 | 7.85 | 7.92 | −0.07 | 46 | 5.08 | 4.73 | 0.35 |
| 25 | 7.15 | 7.28 | −0.13 | - | - | - | - |
Table 6.
Experimental pIC50 (Exp) and predicted pIC50 (Pred) biological activities, and residuals (Res = Exp − Pred) of the 6-arylquinazolin-4-amine derivatives using the best HQSAR model with the fragment distinction parameters A/B.
Table 6.
Experimental pIC50 (Exp) and predicted pIC50 (Pred) biological activities, and residuals (Res = Exp − Pred) of the 6-arylquinazolin-4-amine derivatives using the best HQSAR model with the fragment distinction parameters A/B.
| # a | Exp | Pred | Res | # a | Exp | Pred | Res |
|---|
| 1 | 7.21 | 6.89 | 0.32 | 26 | 7.29 | 7.25 | 0.04 |
| 2 | 5.90 | 5.35 | 0.55 | 27 | 7.59 | 7.30 | 0.29 |
| 3 * | 5.46 | 5.53 | −0.07 | 28 | 6.81 | 6.57 | 0.24 |
| 4 | 5.24 | 5.63 | −0.39 | 29 * | 6.04 | 6.98 | −0.94 |
| 5 | 5.50 | 5.89 | −0.39 | 30 | 6.27 | 6.88 | −0.61 |
| 6 | 5.05 | 5.19 | −0.14 | 31 | 6.92 | 7.08 | −0.16 |
| 7 | 6.79 | 7.07 | −0.28 | 32 (R) * | 7.03 | 7.10 | −0.07 |
| 8 | 5.35 | 5.00 | 0.35 | 32 (S) * | 7.03 | 7.10 | −0.07 |
| 9 | 6.74 | 6.68 | 0.06 | 33 (R) * | 6.87 | 7.13 | −0.26 |
| 10 | 5.84 | 5.39 | 0.45 | 33 (S) * | 6.87 | 7.13 | −0.26 |
| 11 * | 5.33 | 5.60 | −0.27 | 34 (R) * | 7.52 | 6.93 | 0.59 |
| 12 | 7.51 | 7.32 | 0.19 | 34 (S) * | 7.52 | 6.93 | 0.59 |
| 13 | 7.42 | 7.45 | −0.03 | 35 | 7.12 | 7.13 | −0.01 |
| 14 | 5.94 | 6.84 | −0.90 | 36 * | 7.77 | 7.25 | 0.52 |
| 15 | 6.59 | 7.35 | −0.76 | 37 | 5.94 | 5.81 | 0.13 |
| 16 | 7.46 | 6.91 | 0.55 | 38 | 6.25 | 6.05 | 0.20 |
| 17 | 7.08 | 6.82 | 0.26 | 39 | 6.23 | 6.20 | 0.03 |
| 18 | 7.01 | 7.26 | −0.25 | 40 | 5.44 | 5.36 | 0.08 |
| 19 | 7.13 | 6.99 | 0.14 | 41 | 5.47 | 5.19 | 0.28 |
| 20 * | 7.24 | 6.97 | 0.27 | 42 | 5.82 | 5.41 | 0.41 |
| 21 | 6.90 | 6.89 | 0.01 | 43 * | 5.85 | 5.39 | 0.46 |
| 22 | 7.03 | 6.85 | 0.18 | 44 | 5.57 | 5.07 | 0.50 |
| 23 * | 6.69 | 6.70 | −0.01 | 45 | 5.31 | 5.16 | 0.16 |
| 24 | 7.85 | 7.24 | 0.61 | 46 | 5.08 | 5.21 | −0.13 |
| 25 | 7.15 | 6.83 | 0.32 | | | | |
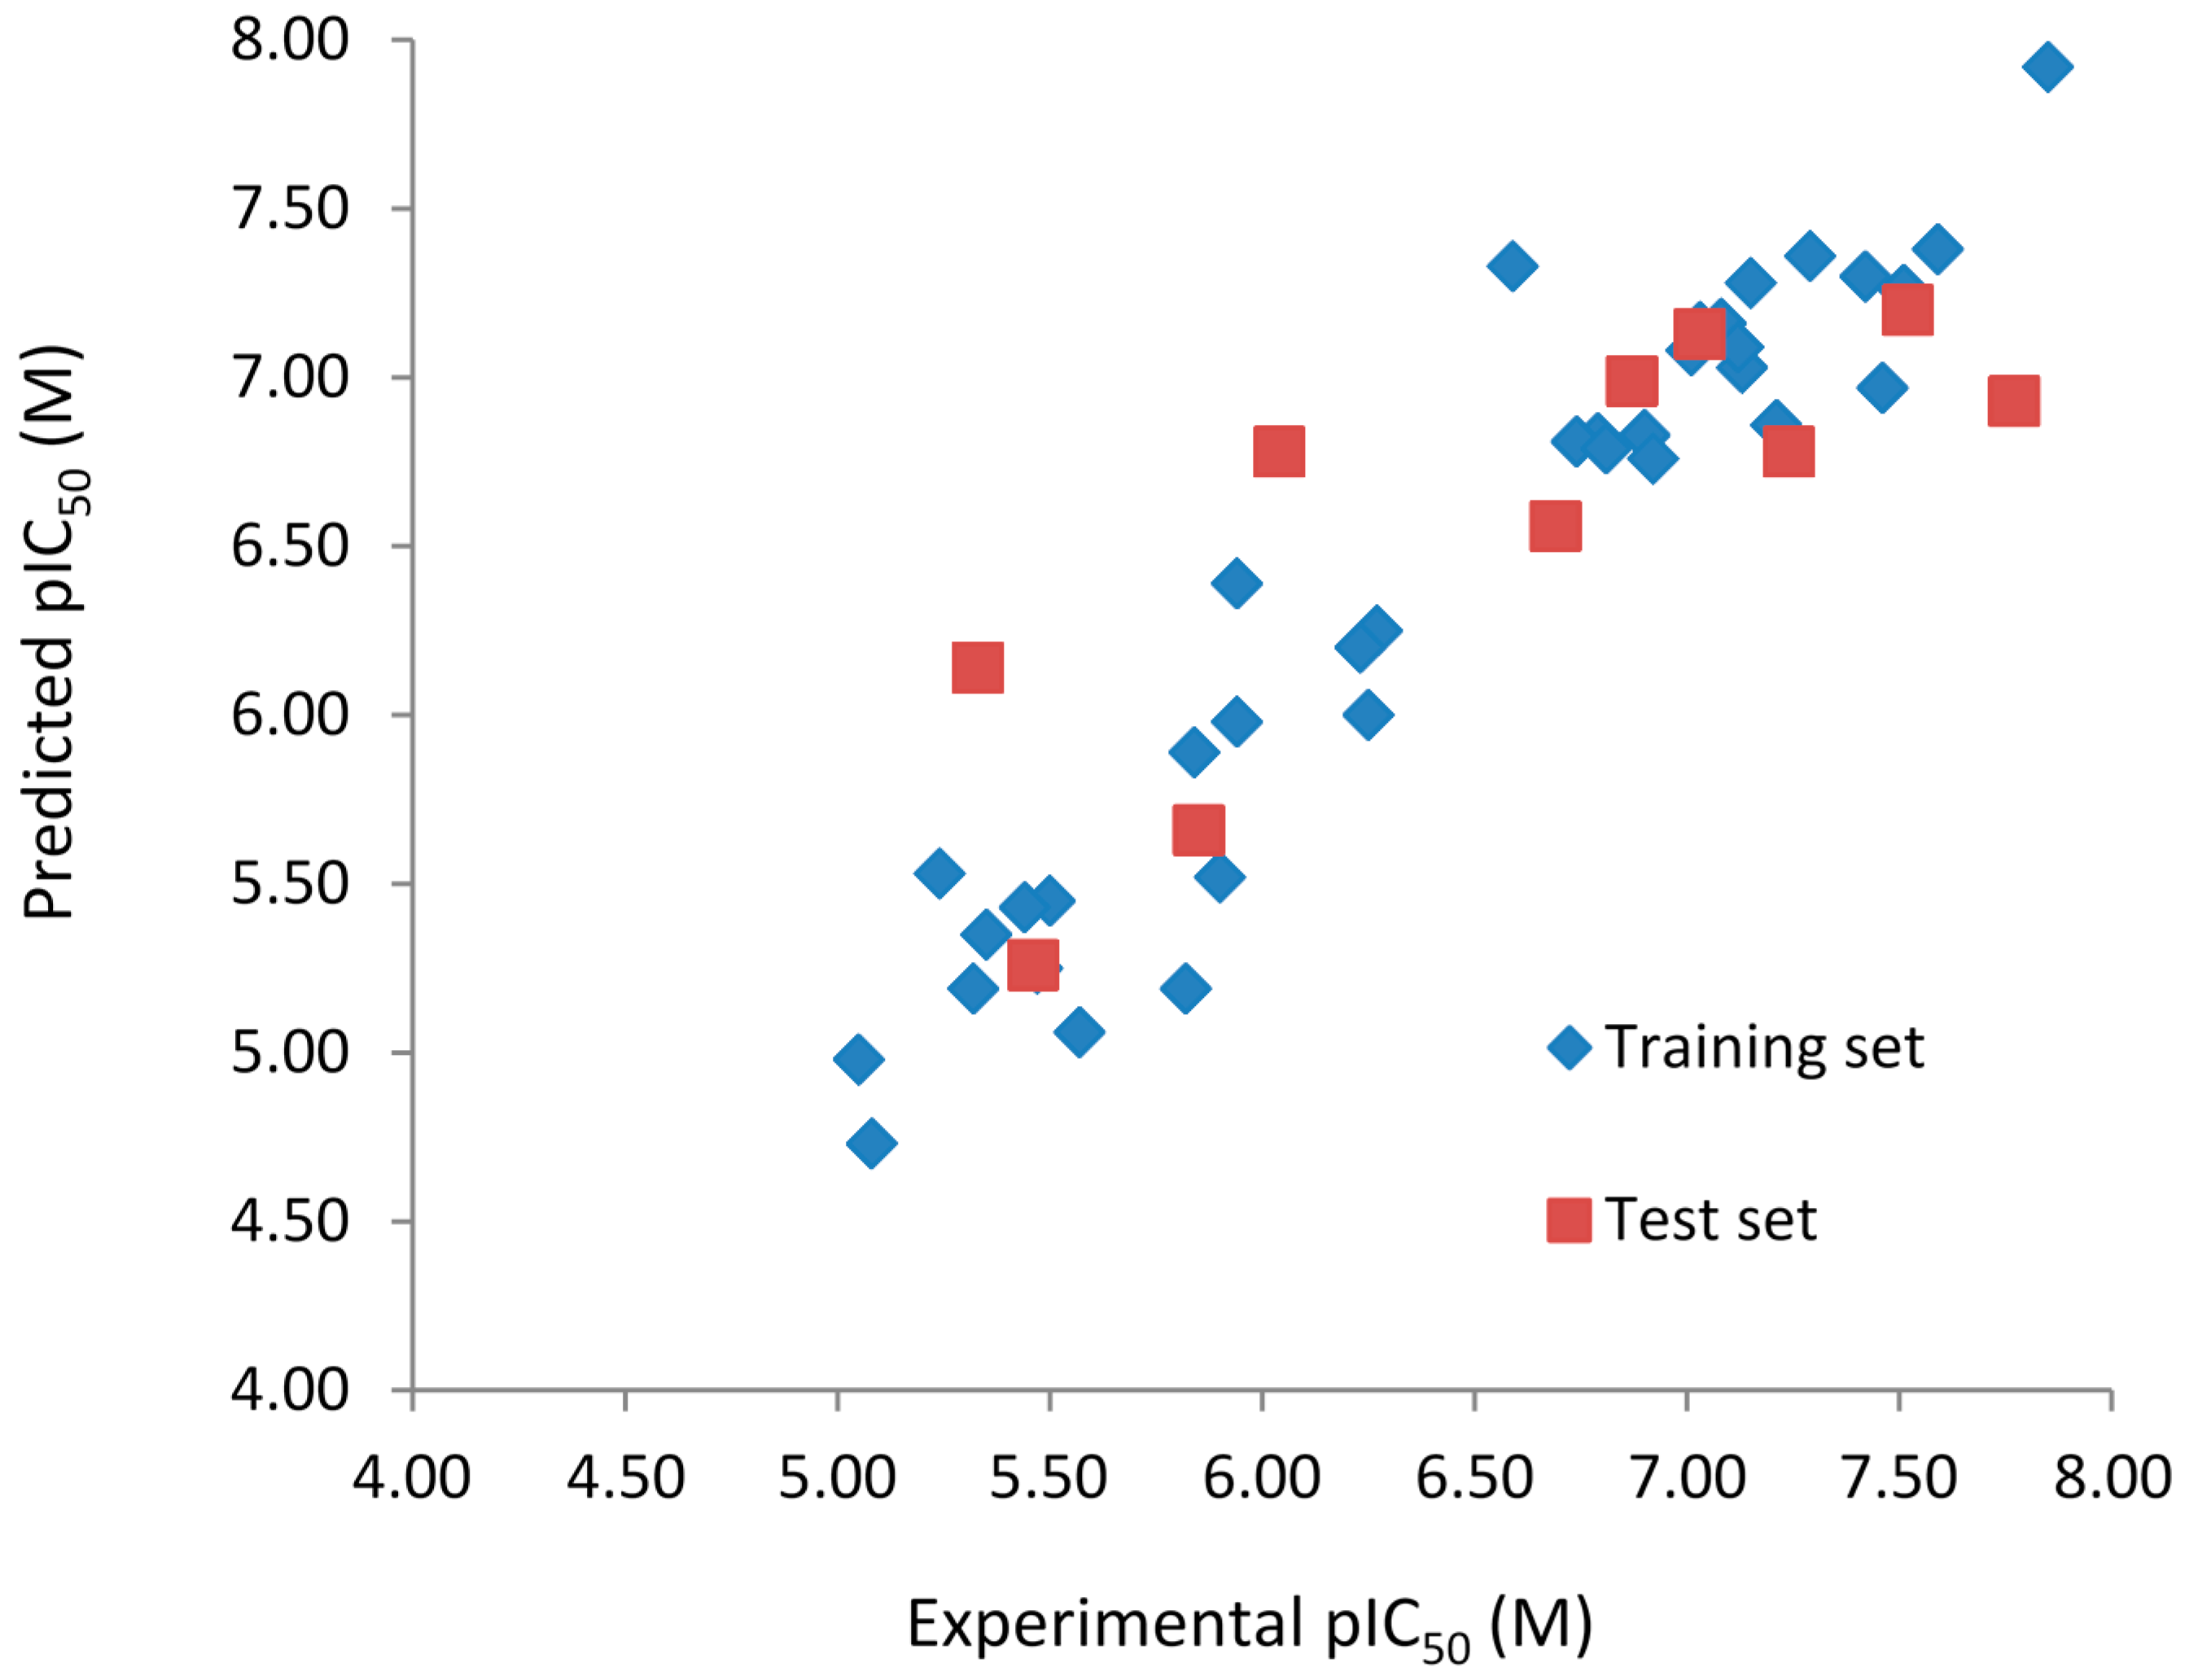
Figure 1.
Experimental vs. predicted pIC50 values of the training (blue) and test (red) sets obtained using the best model with the fragment distinction parameters A/B/C/Ch/DA.
Figure 1.
Experimental vs. predicted pIC50 values of the training (blue) and test (red) sets obtained using the best model with the fragment distinction parameters A/B/C/Ch/DA.
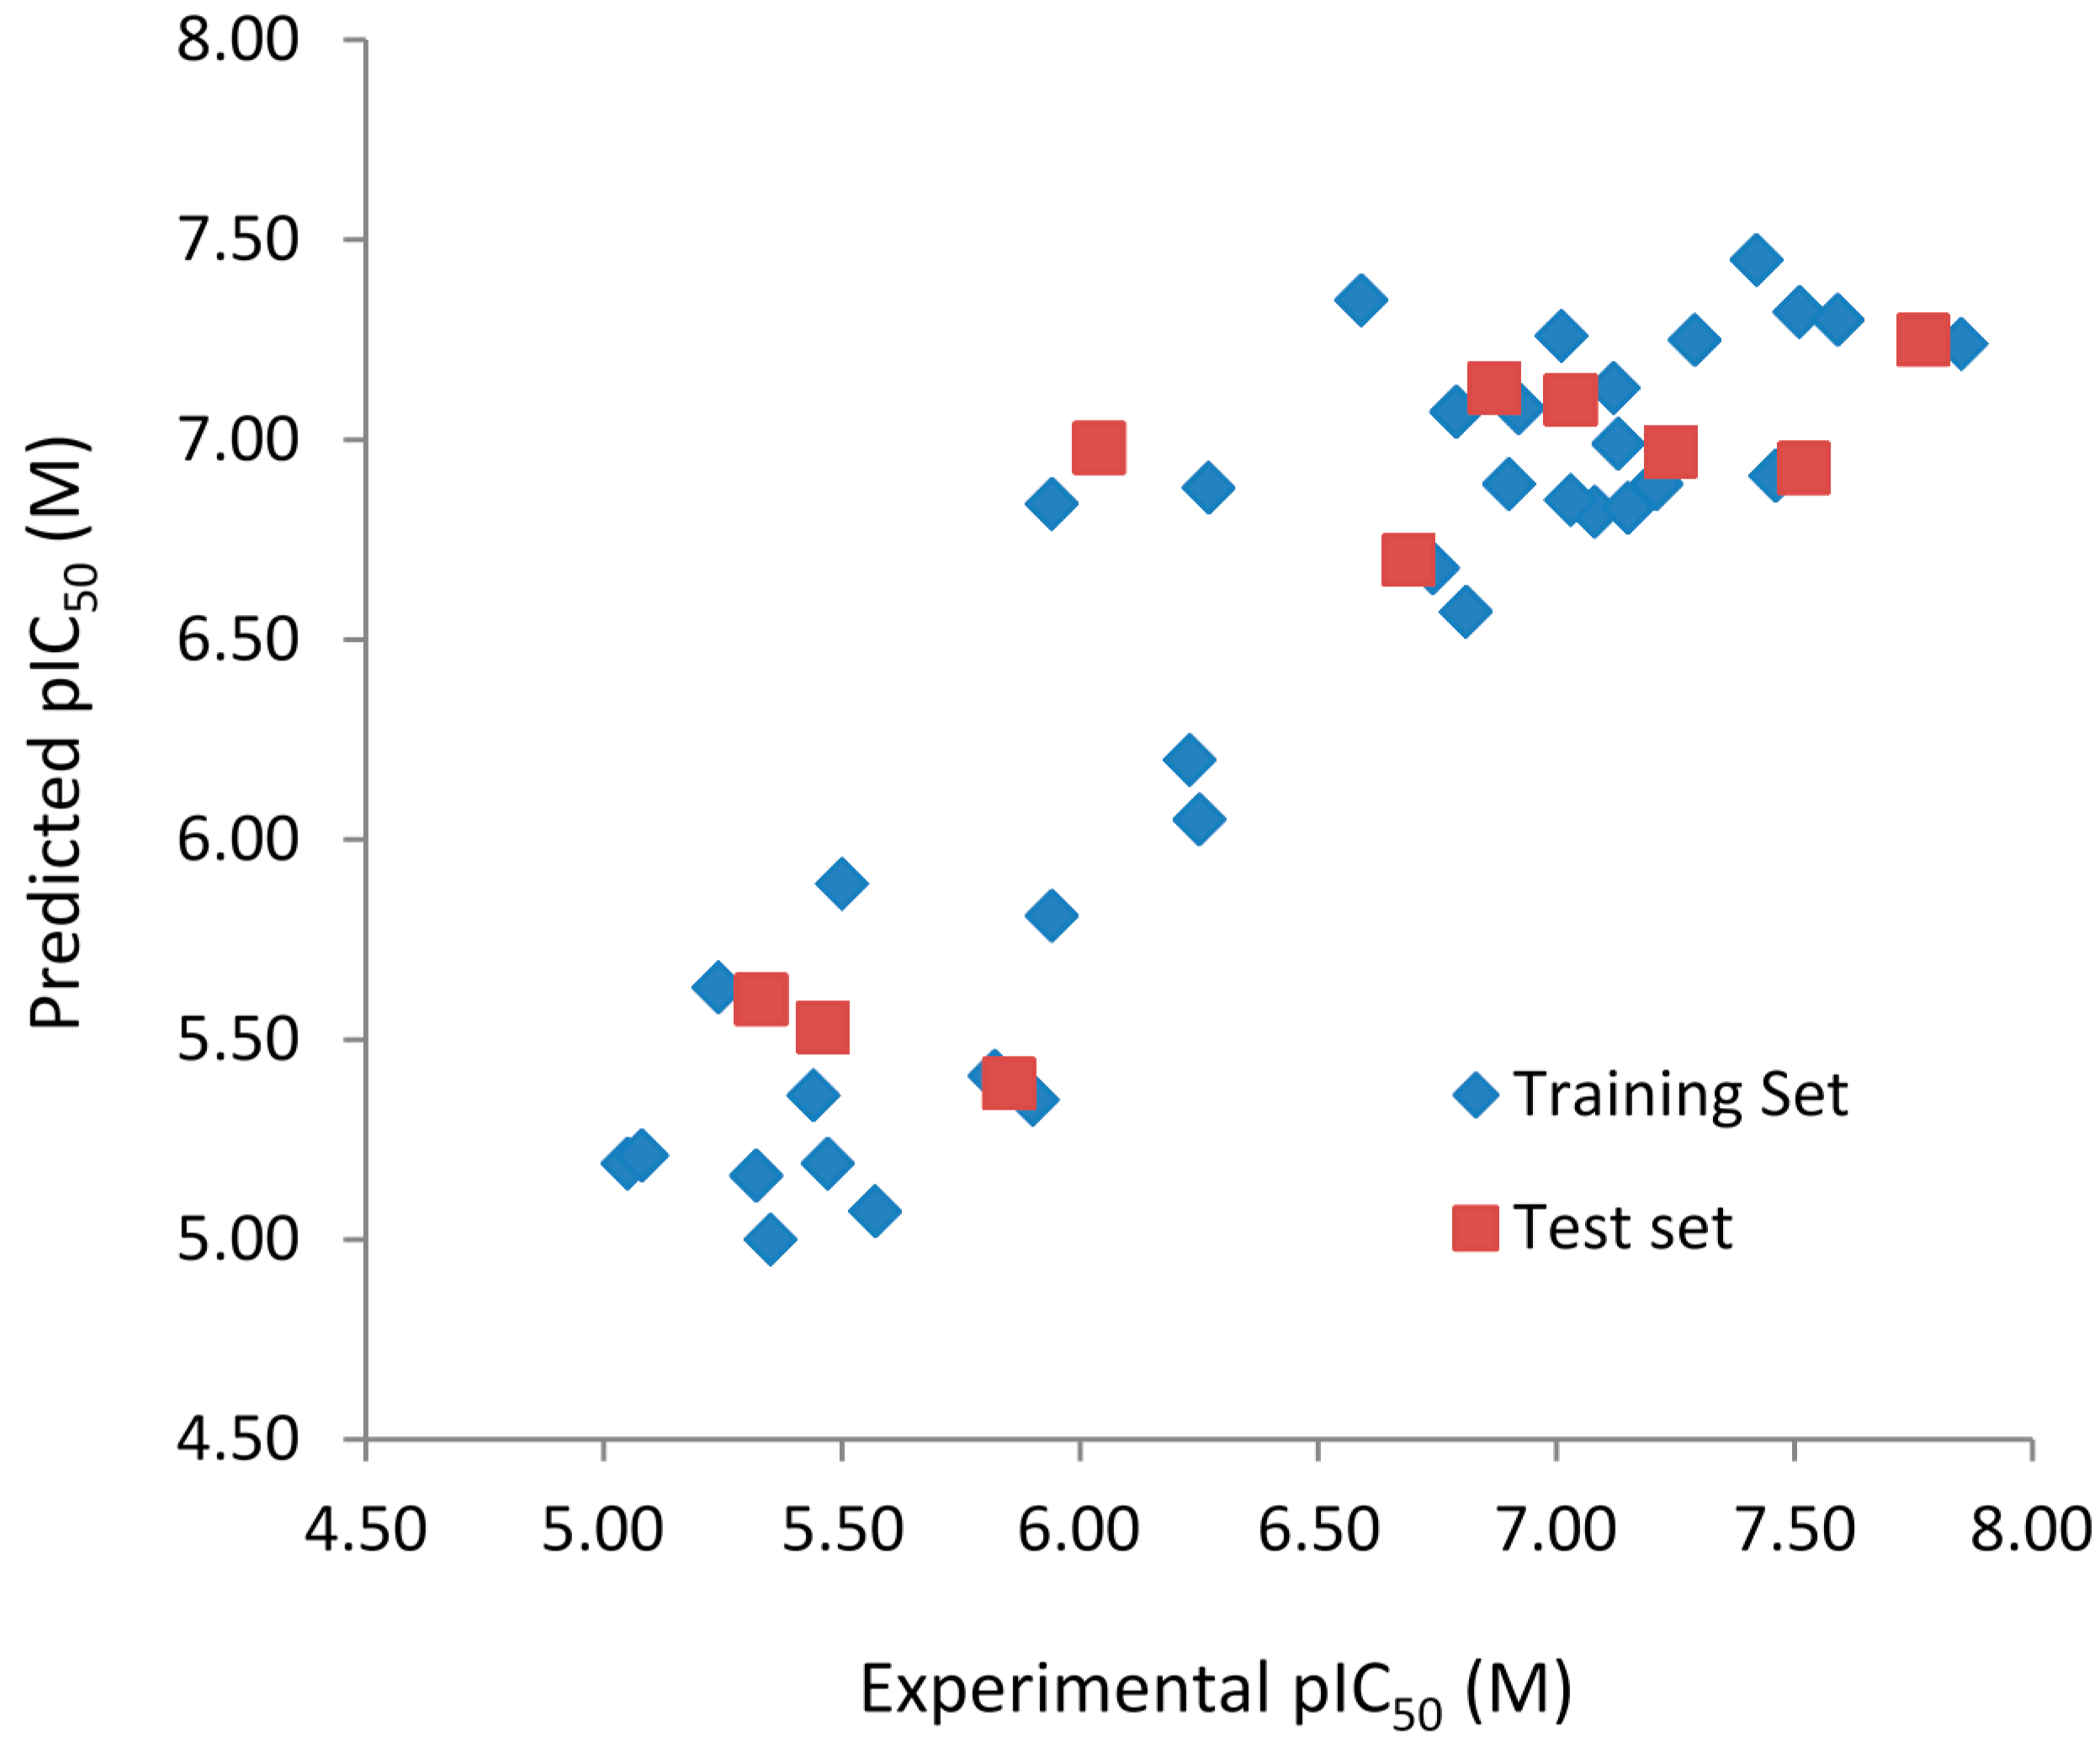
Figure 2.
Experimental vs. predicted pIC50 values of the training (blue) and test (red) sets obtained using the best model with the fragment distinction parameters A/B.
Figure 2.
Experimental vs. predicted pIC50 values of the training (blue) and test (red) sets obtained using the best model with the fragment distinction parameters A/B.
Both models do not contain outliers, defined as those compounds with residual values exceeding one logarithmic unit. However, the standard deviation (SD) of the residual values from the model with the fragment distinction parameters
A/B/C/Ch/DA (SD = 0.322) is lower than the model with the fragment distinction parameters
A/B (SD = 0.379), showing that the predicted pIC
50 values are closer to the respective experimental ones. Each of the three compounds containing one chiral center (
32,
33, and
34), modeled in both enantiomeric forms (
R and
S), presents identical or very close residual value, independent of the enantiomer and the model considered (
Table 6 and
Table 7), indicating that this chiral center has no relevance in the SAR study of this series of compounds. The correlation coefficient (
R2t) and root-mean-square error (RMSE) calculated for the test are (
R2t = 0.654; RMSE = 0.484) for the
A/B/C/Ch/DA model and (
R2t = 0.711; RMSE = 0.440) for the
A/B model. These values support the statistical quality of both models. The
R2pred values for models
A/B/C/Ch/DA (
R2pred = 0.659) and
A/B (
R2pred = 0.743) are higher than 0.5, indicating that both models have acceptable prediction power.
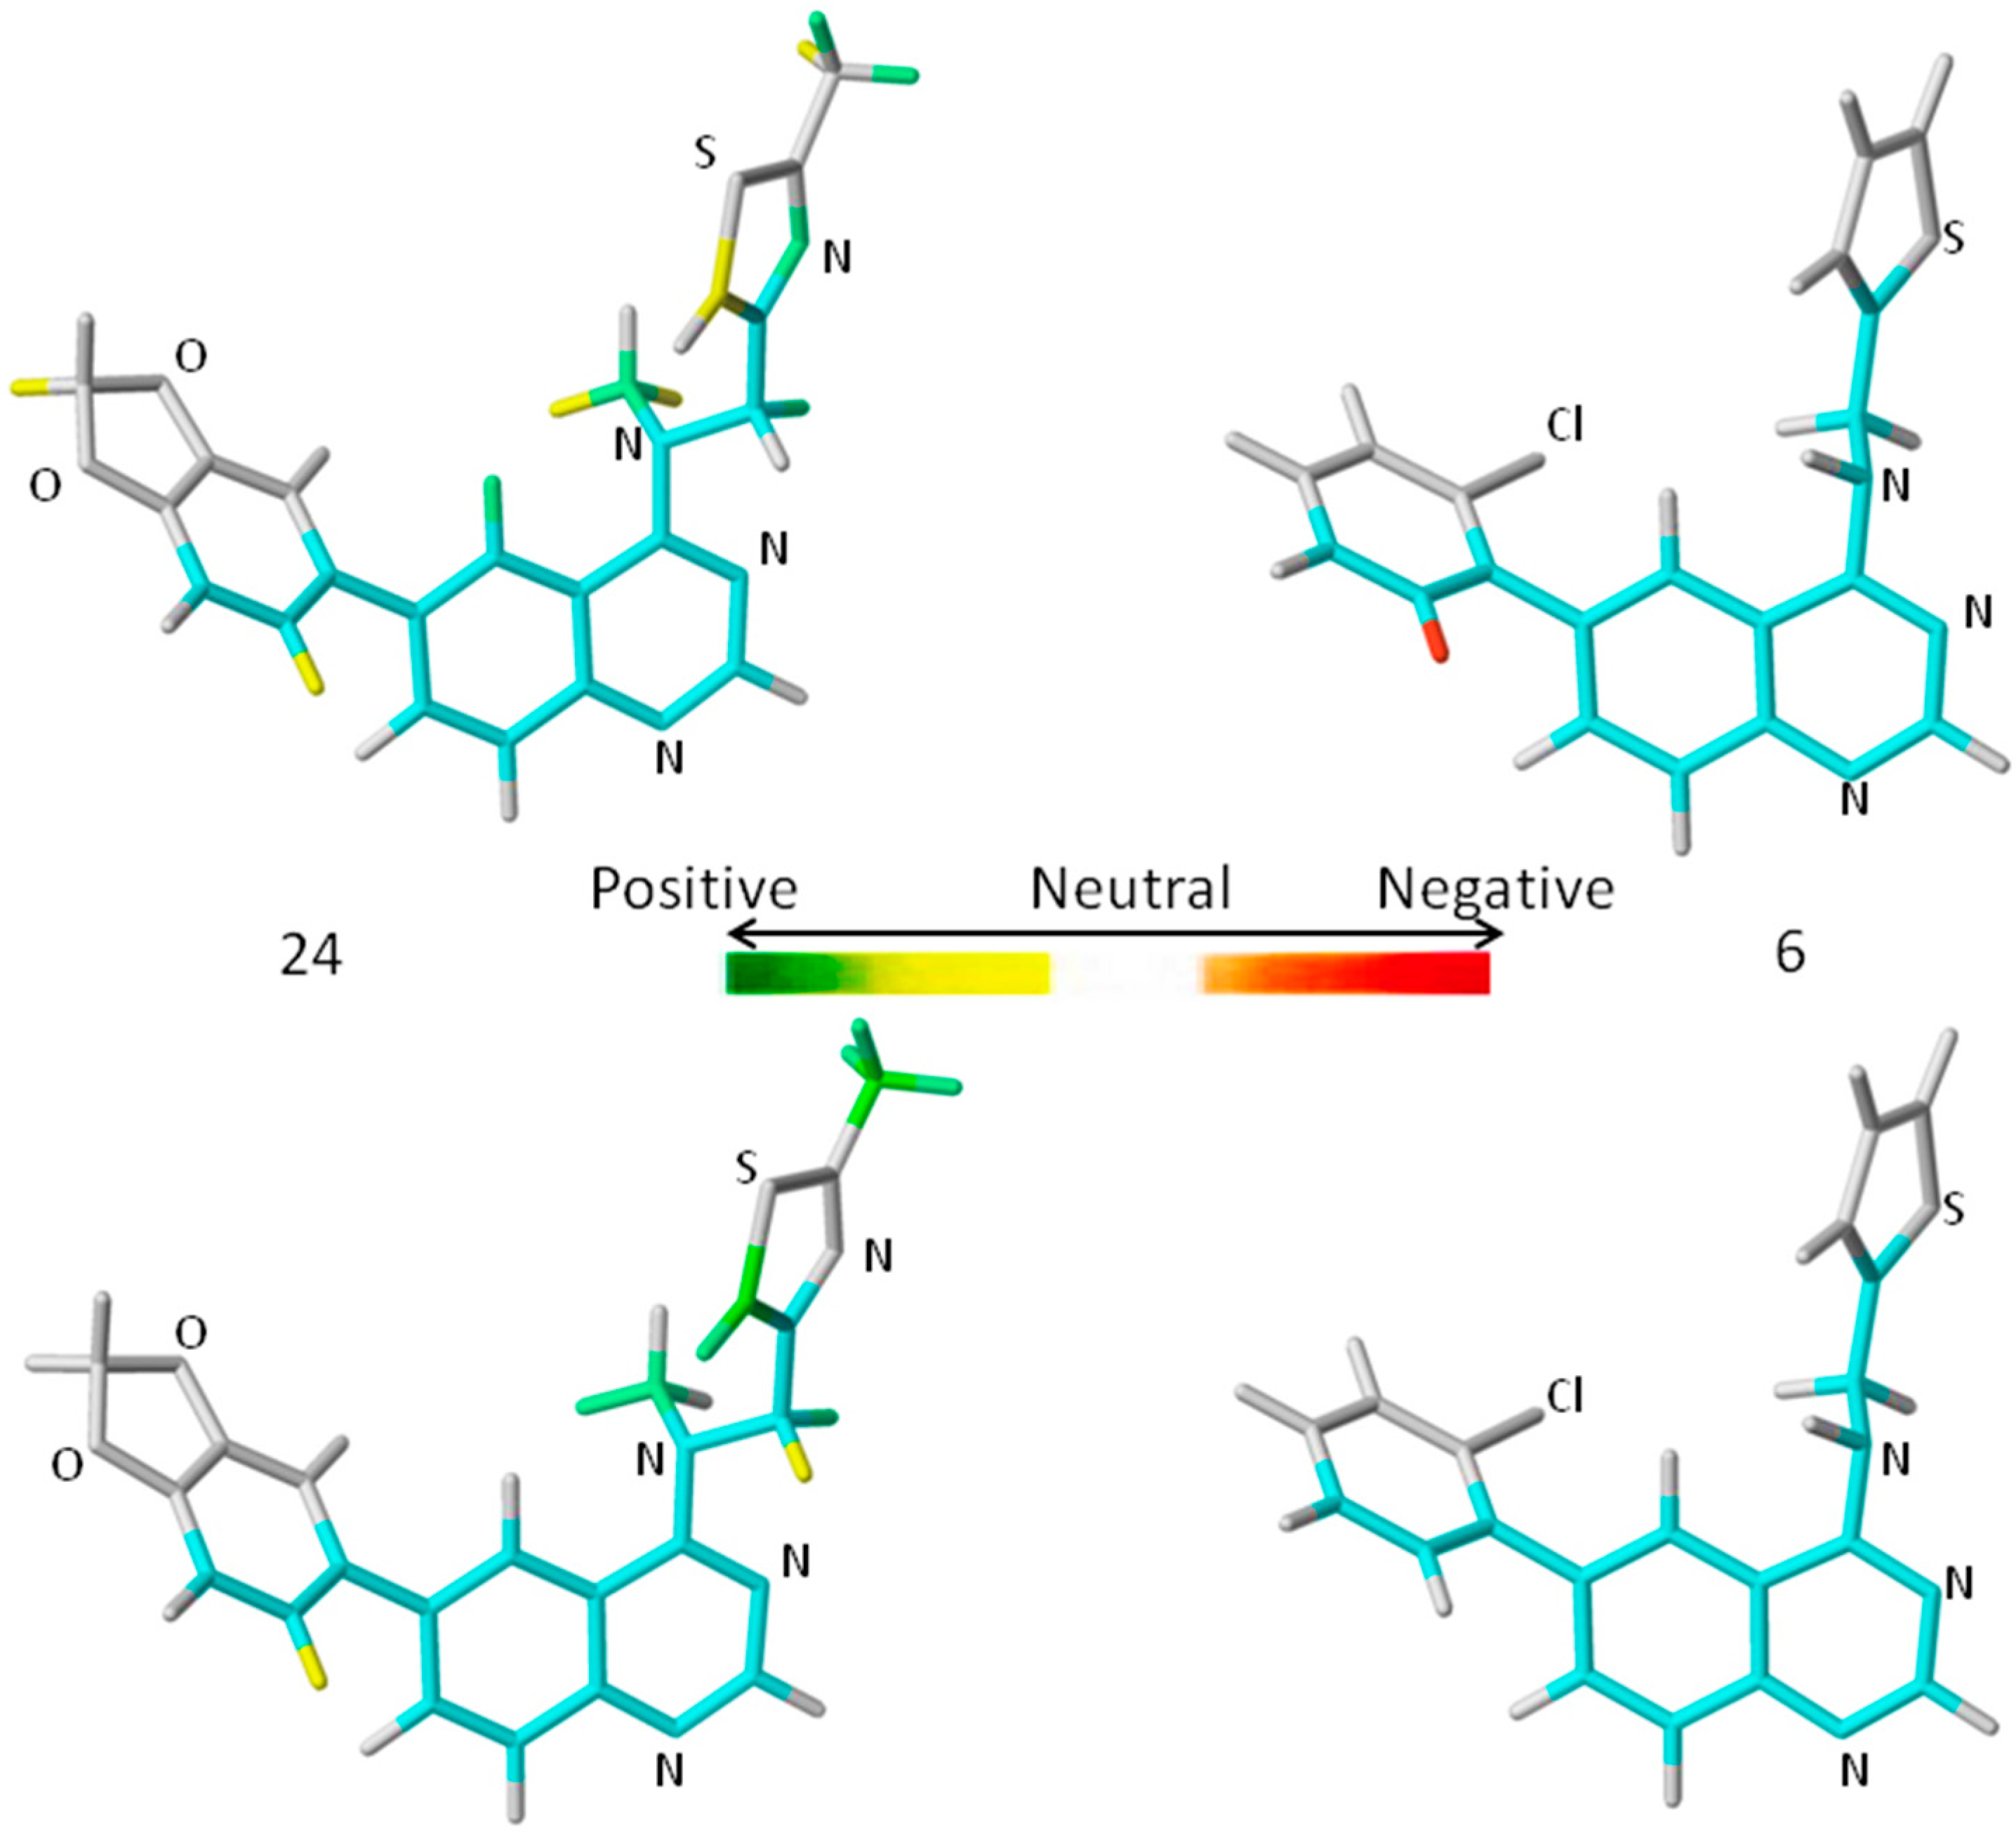
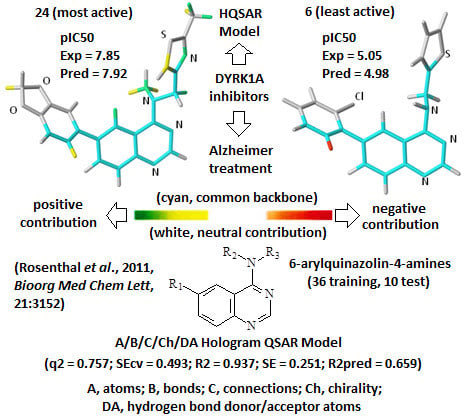
A comprehensive analysis also involves the interpretation of the corresponding HQSAR colored diagrams (contribution maps) in which the colors represent positive (yellow-to-green), neutral (white), and negative (orange-to-red) contributions to the biological activity.
Figure 3 shows the colored diagrams for the most (
24) and least (
6) active compounds for the two best models (
A/B/C/Ch/DA and
A/B), where the common backbone is colored in cyan.
Considering only the HQSAR contribution maps of
24 (most active,
Figure 3), both models are able to identify fragments which increase the biological activity, since in both models there are fragments colored in yellow and green. However, in the case of
6 (least active,
Figure 3), only the
A/B/C/Ch/DA model is able to identify fragments that decrease the activity, since only in this model is there at least one fragment colored in red. On the other hand, the
A/B model of
6 (
Figure 3) shows only fragments colored in white (neutral contribution) and cyan (common backbone), featuring fragments without correlation with the biological activity variation. Consequently, the
A/B/C/Ch/DA model seems to be the most able to distinguish among the most and least active compounds, and thus, it is the most useful in the medicinal chemistry context.
Figure 3.
The HQSAR contribution maps of the most (24, left) and least (6, right) active compounds, according to the two best HQSAR models A/B/C/Ch/DA (top) and A/B (bottom). Color code: yellow-to-green, white, and orange-to-red represent positive, neutral, and negative contributions to the biological activity, respectively, and cyan represents the common backbone. The Cl, N, O, and S heteroatoms are labeled by element symbol, C and H atoms are not labeled.
An additional feature, observed only in the
A/B/C/Ch/DA model of
24 (
Figure 3), is the presence of a green colored fragment that corresponds to the nitrogen atom of the thiazolyl group (R
3 substituent,
Table 7). Since only this model has the H-bond donor/acceptor (DA) fragment distinction parameter, this feature highlights the importance of this atom as an H-bond acceptor in a potential H-bonding interaction in the ligand-enzyme complex. Moreover, it also reinforces the
A/B/C/Ch/DA model as the best model. Therefore, only this model will be discussed from this point forward.
The contribution map of
24 (
Figure 3), according to the best HQSAR model, shows three substituents, namely R
1, R
2, and R
3 (
Table 7), which significantly influence the biological activity of this series. The benzodioxol (R
1), methyl (R
2), and thiazolyl (R
3) groups are present in the most active compounds, such as 24, 26, and 27. In fact, all these groups have fragments (at least one atom) colored in green or yellow, highlighting their positive contributions to biological activity.
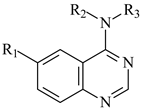
Table 7.
Biological activities (IC
50, nM) and its negative logarithmic values (pIC
50, M) for a series of 6-arylquinazolin-4-amine derivatives.
![Ijms 16 05235 i001]()
The contribution map of
6 (
Figure 3), according to the best HQSAR model, shows one atom colored in red located on the
ortho-chloro-phenyl group (R
1), which is detrimental to the biological activity, probably because the chlorine atom at the
ortho position would prevent higher co-planarity between the two aromatic groups, a feature which may be important in the ligand-protein interaction. Besides, the presence of a fragment colored in red, the lack of green or yellow colored fragments also contributes to the low activity of
6, such as the replacement of methyl (R
2) by hydrogen and thiazolyl (R
3) by thiophenyl.
Some of these results are in agreement with those presented by Pan
et al. [
34] in an atom-based 3D-QSAR modeling study, using this same series of 6-arylquinazolin-4-amines. They observed that the inhibitory activity increases when R
1 is a phenyl ring substituted with a hydrophilic and electron-withdrawing group, R
3 is a heterocyclic ring substituted with a hydrophobic group, and the nitrogen atom of the amine group is substituted with a bulky hydrophobic group. On the other hand, the inhibitory activity decreases when R
2 is a hydrogen atom and R
1/R
3 are hydrophobic groups [
34].


 ,
, 
