Article

X-ray-Induced Changes in the Expression of Inflammation-Related Genes in Human Peripheral Blood

1
Department of Toxicology, Henan Institute of Occupational Medicine, Zhengzhou 450052, China
2
College of Public Health, Zhengzhou University, Zhengzhou 450001, China
*
Author to whom correspondence should be addressed.
These authors contributed equally to this work.
Int. J. Mol. Sci. 2014, 15(11), 19516-19534; https://doi.org/10.3390/ijms151119516
Submission received: 24 August 2014 / Revised: 16 October 2014 / Accepted: 20 October 2014 / Published: 27 October 2014
(This article belongs to the Section Biochemistry)

Abstract

:
Using quantitative real-time polymerase chain reaction (PCR) array, we explored and compared the expression changes of inflammation-related genes in human peripheral blood irradiated with 0.5, 3, and 10 Gy doses of X-rays 24 h after exposure. Results indicated that the expression of 62 out of 84 genes was significantly altered after X-ray radiation. Among these 62 genes, 35 (such as TNFSF4) are known to be associated with radiation response, but others are novel. At a low radiation dose (0.5 Gy), 9 genes were up-regulated and 19 were down-regulated. With further increased dose to 3 Gy, 8 unique genes were up-regulated and 19 genes were down-regulated. We also identified 48 different genes that were differentially expressed significantly after 10 Gy of irradiation, and among these transcripts, up-regulated genes accounted for only one-third (16 genes) of the total. Of the 62 genes, 31 were significantly altered only at a specific dose, and a total of 10 genes were significantly expressed at all 3 doses. The dose- and time-dependent expression of CCL2 was confirmed by quantitative real-time reverse-transcription PCR. A number of candidate genes reported herein may be useful molecular biomarkers of radiation exposure in human peripheral blood.

1. Introduction

Exposure to ionizing radiation—whether for medical, occupational, or accidental reasons—may cause deleterious biological consequences, such as mortality or carcinogenesis. No dose of ionizing radiation exposure is considered safe, and the accurate estimation of the absorbed dose is critical in determining appropriate medical care. Hence, in the event of a large-scale radiation accident or attack, radiation dosimetry assays are imperative to assess the amount of radiation exposure as quickly as possible to accurately triage victims for appropriate care. The metaphase chromosomal aberration assay in human lymphocytes remains as the gold standard for assessing radiation dosimetry, and no functional equivalent has been found. However, this assay is labor intensive, requires mitotic cells, lacks specificity at very low and high doses, and requires skilled individuals [1,2]. Therefore, developing additional radiation dosimetry assays that are high throughput, automated and cost efficient is imperative [3]. Over the past few decades, numerous efforts have been exerted to design a fast, reliable, effective, easy, and cost-effective biological dosimeter that requires minimum invasive procedures. Currently, ionizing radiation-induced RNA-based gene expression change is the focus of a new generation of research on radiation biodosimetry [4]. RNA-based assays mainly include global expression platforms such as DNA microarray and expression assessment by quantitative real-time reverse-transcription polymerase chain reaction (qRT-PCR). DNA microarrays can reportedly be used to simultaneously identify and quantify thousands of ionizing radiation-induced expression changes within a single sample [5,6,7]. However, sweeping research methods, numerous verification works, and the complexities of objective things seriously limit the application of DNA microarrays in the area of radiobiology, particularly in biodosimetry. Quantitative real-time polymerase chain reaction (qPCR) array, which screens differentially expressed genes based on mRNA, is a highly sensitive and reliable method of gene-expression profiling. qPCR array combines qRT-PCR and gene chips and allows the simultaneous quantitative monitoring of expression levels of panel genes in a specific pathway or disease-related genes. qPCR array is a useful tool for functional genomic studies [8,9] and may thus be an ideal method for screening early biodosimetry. With the development of functional genomics research, qPCR array is becoming critical in studies on life science topics, such as drug resistance of tumors [10], pathogenic microorganisms [11,12], cellular and developmental biology [13,14], cytokines and inflammatory reactions [15,16], specific biological pathways [17], etc. However, studies on the applications of qPCR array in the field of radiobiology, especially biodosimetry, are few.
In the last decade, accumulated data from several researchers have indicated that low-dose radiation therapy (single dose = 0.5–1 Gy) can functionally modulate a wide multitude of inflammatory processes and cellular compounds [18]. With the help of microarray or qPCR, thousands of scholars have identified numerous inflammation-related genes associated with radiation-induced expression changes, such as IL1A, IL1B, IL6, BLC, C10, IP-10, CCL2, CCL7, MIP-1γ, RANTES, CCR1, CCR2, CCR5, CCR6, etc. [19,20]. The expression changes of these genes have been identified after a single dose irradiation; only one study has screened out a small part of inflammation-related genes. However, most inflammation-related genes simultaneously induced after low-, medium- and high-dose exposures have not been reported.
In the present work, we examined changes in the expression of inflammation-related genes in peripheral blood before and after exposure to a single dose (0, 0.5, 3, and 10 Gy) at the mRNA expression level of DNA damage response. We also determined whether the dose- or time-dependent expression of CCL2 was significant. The purpose was to identify inflammation-related genes with radiation-induced expression changes in human peripheral blood cells after in vitro irradiation. Another purpose was to better understand gene expression changes associated with low-, medium-, and high-dose radiation, which may provide insight into the molecular mechanisms of inflammatory reactions induced by ionizing radiation and lead to the development of novel biodosimeters.

2. Result and Discussion

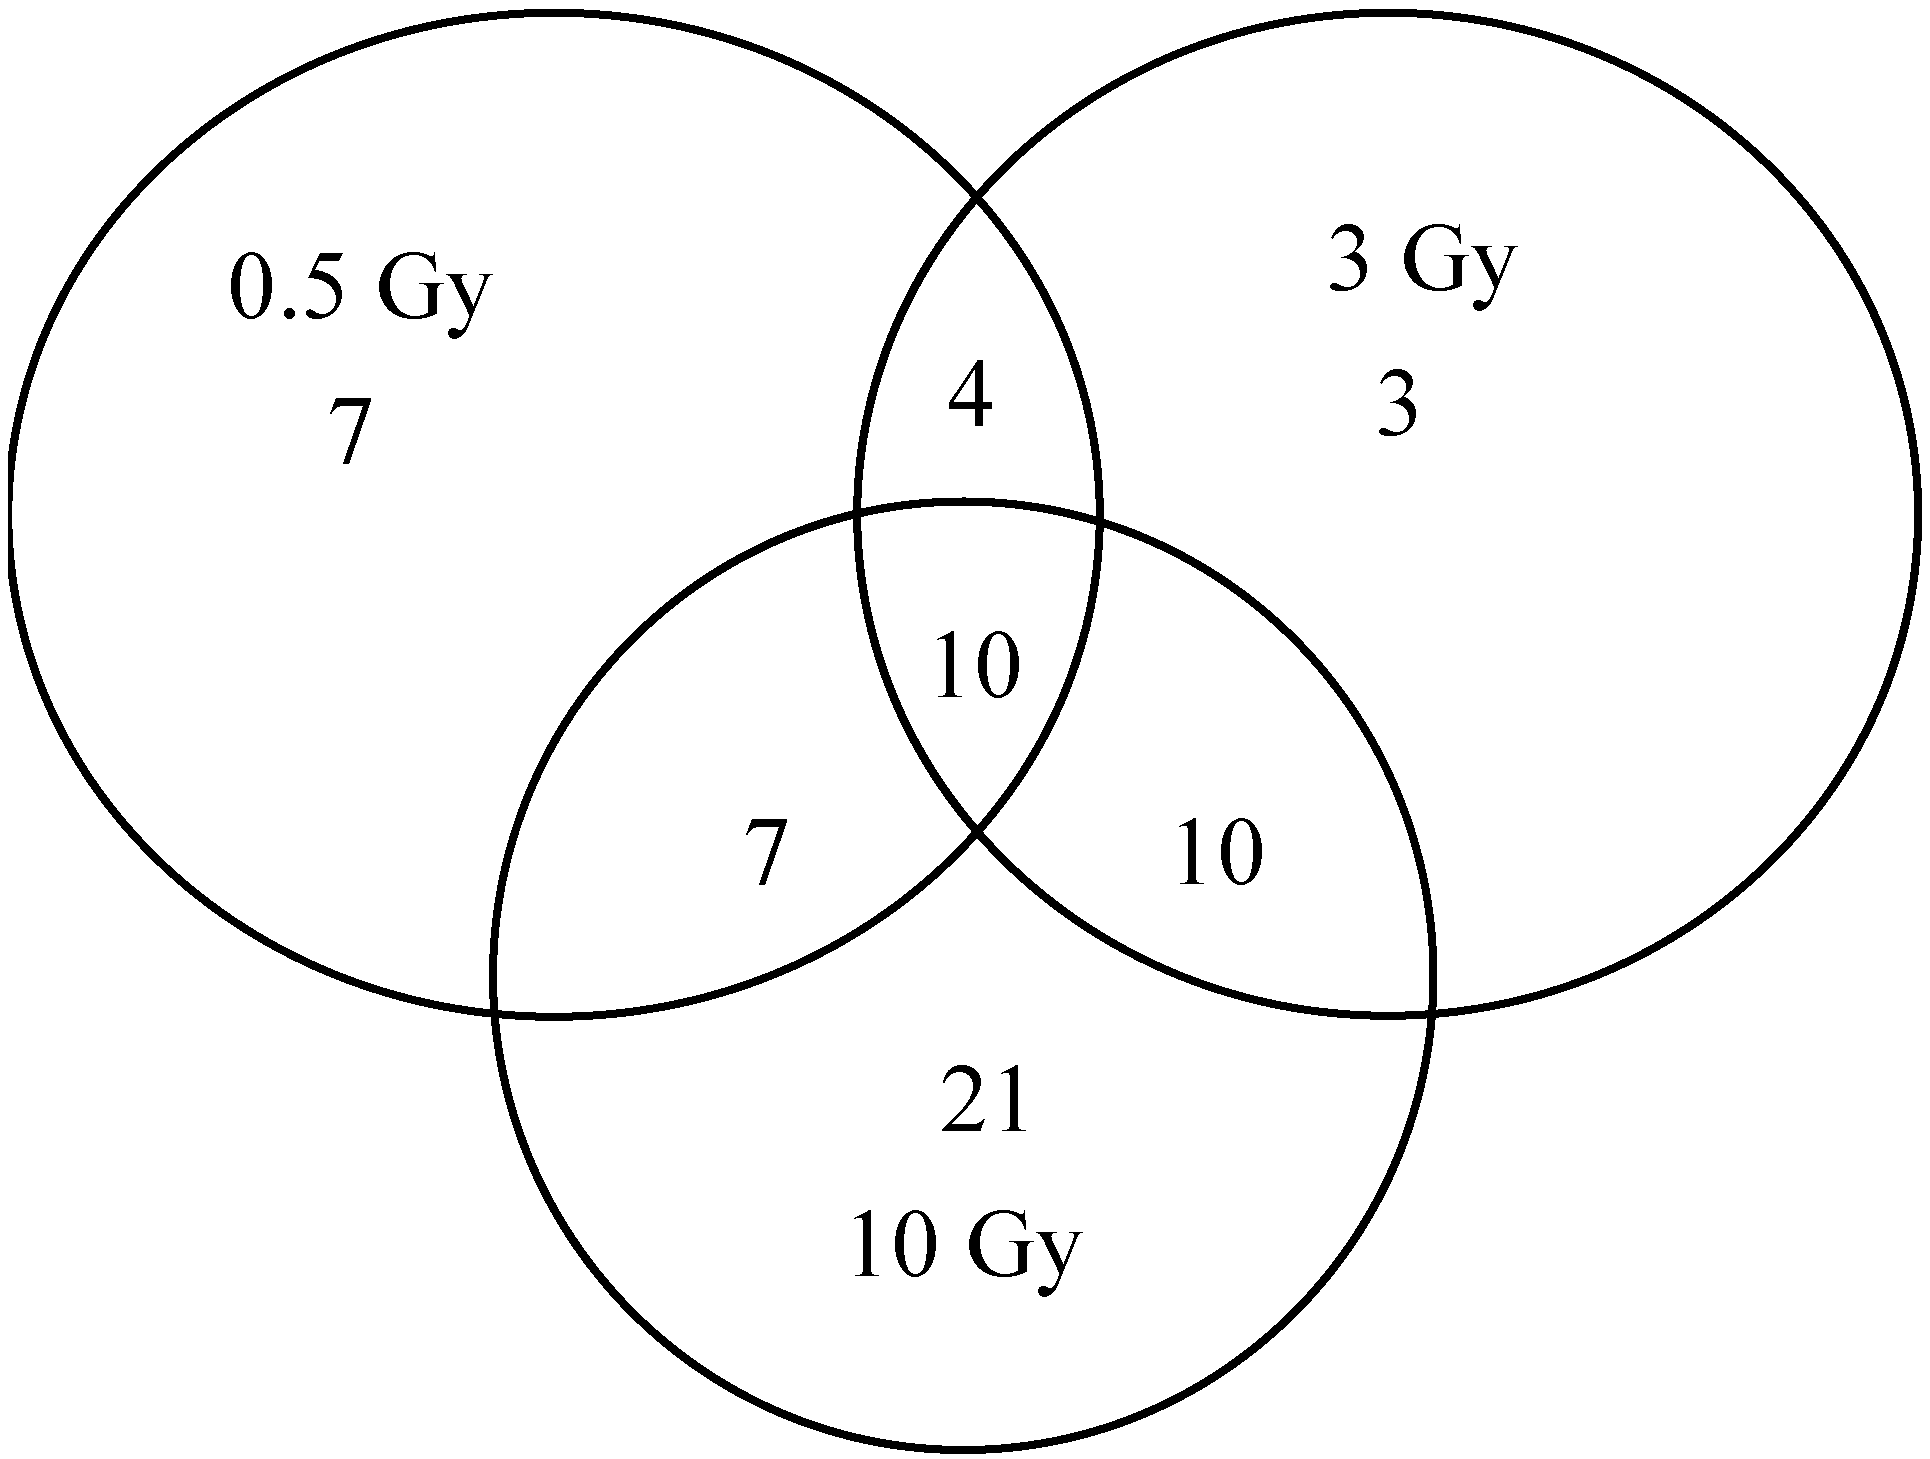
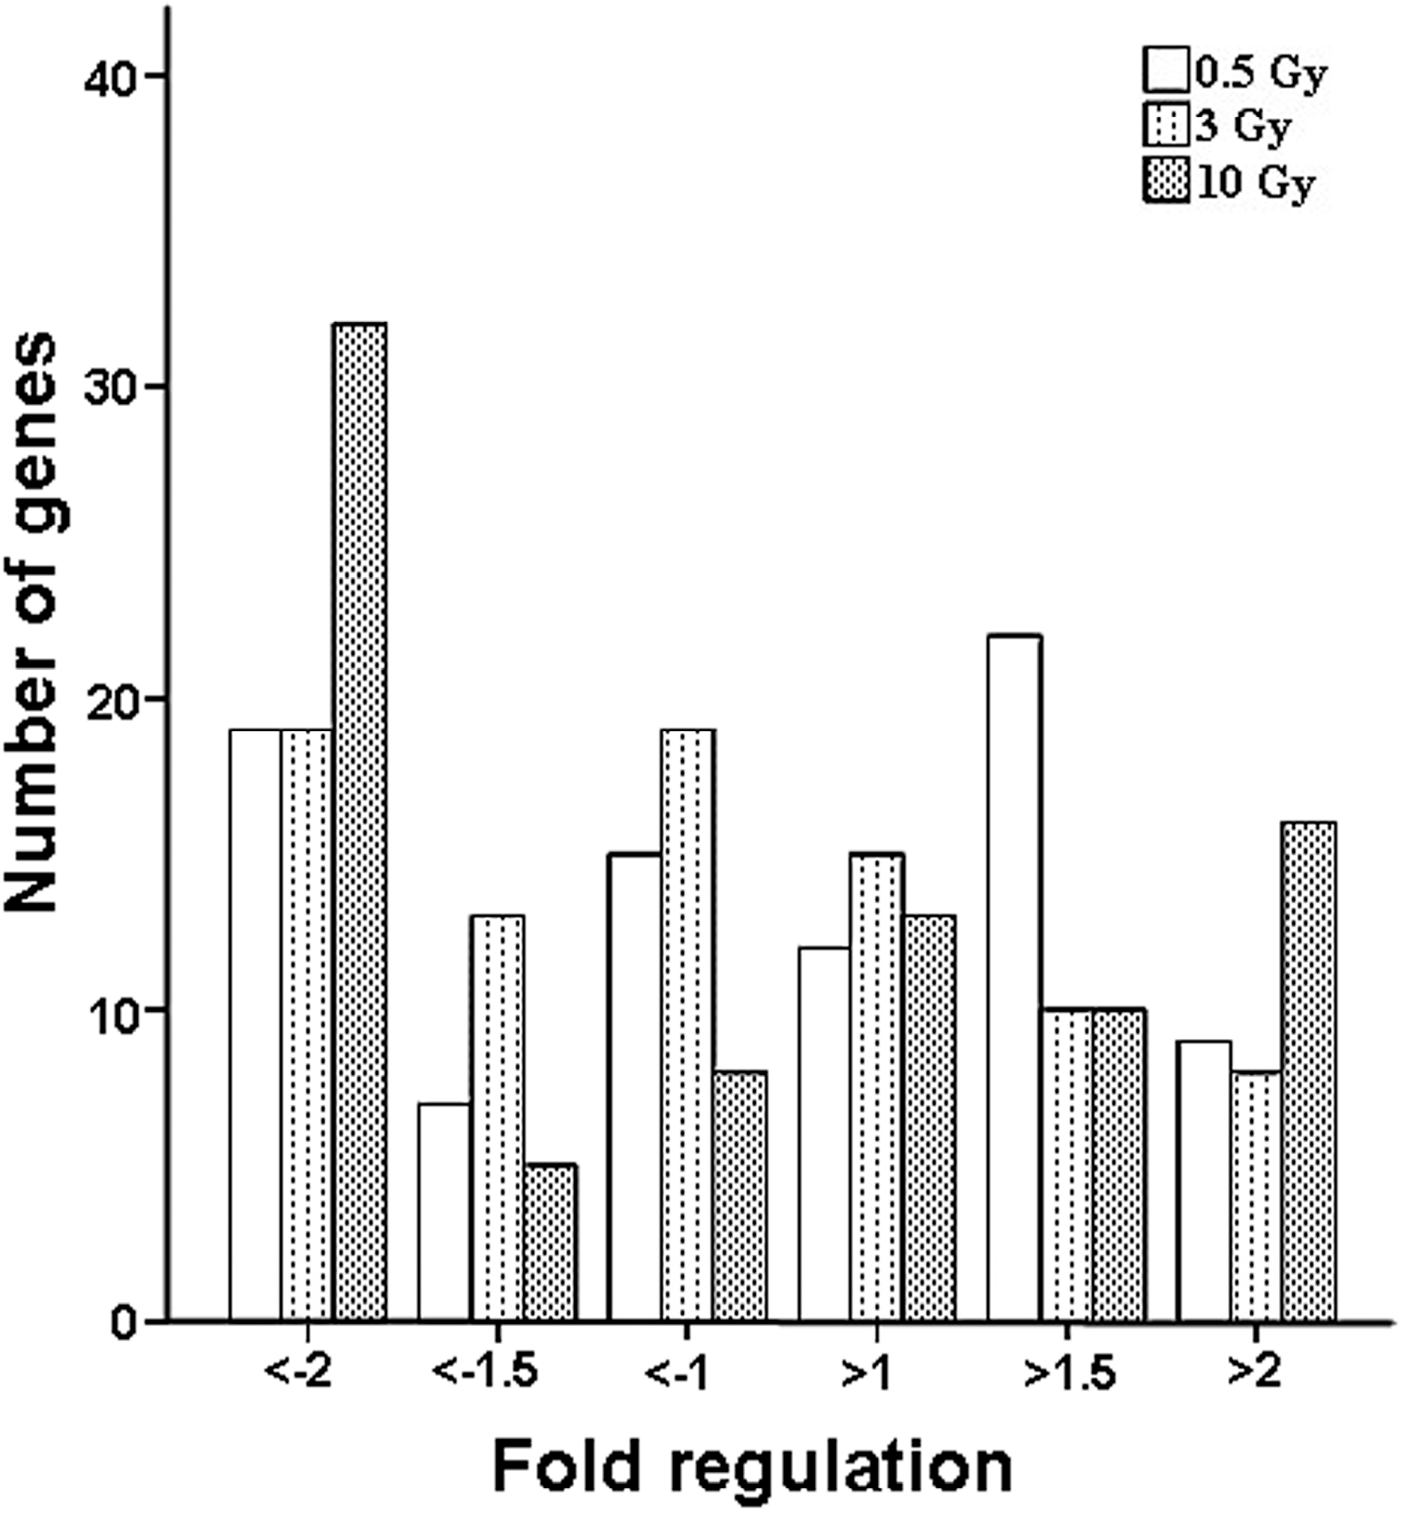
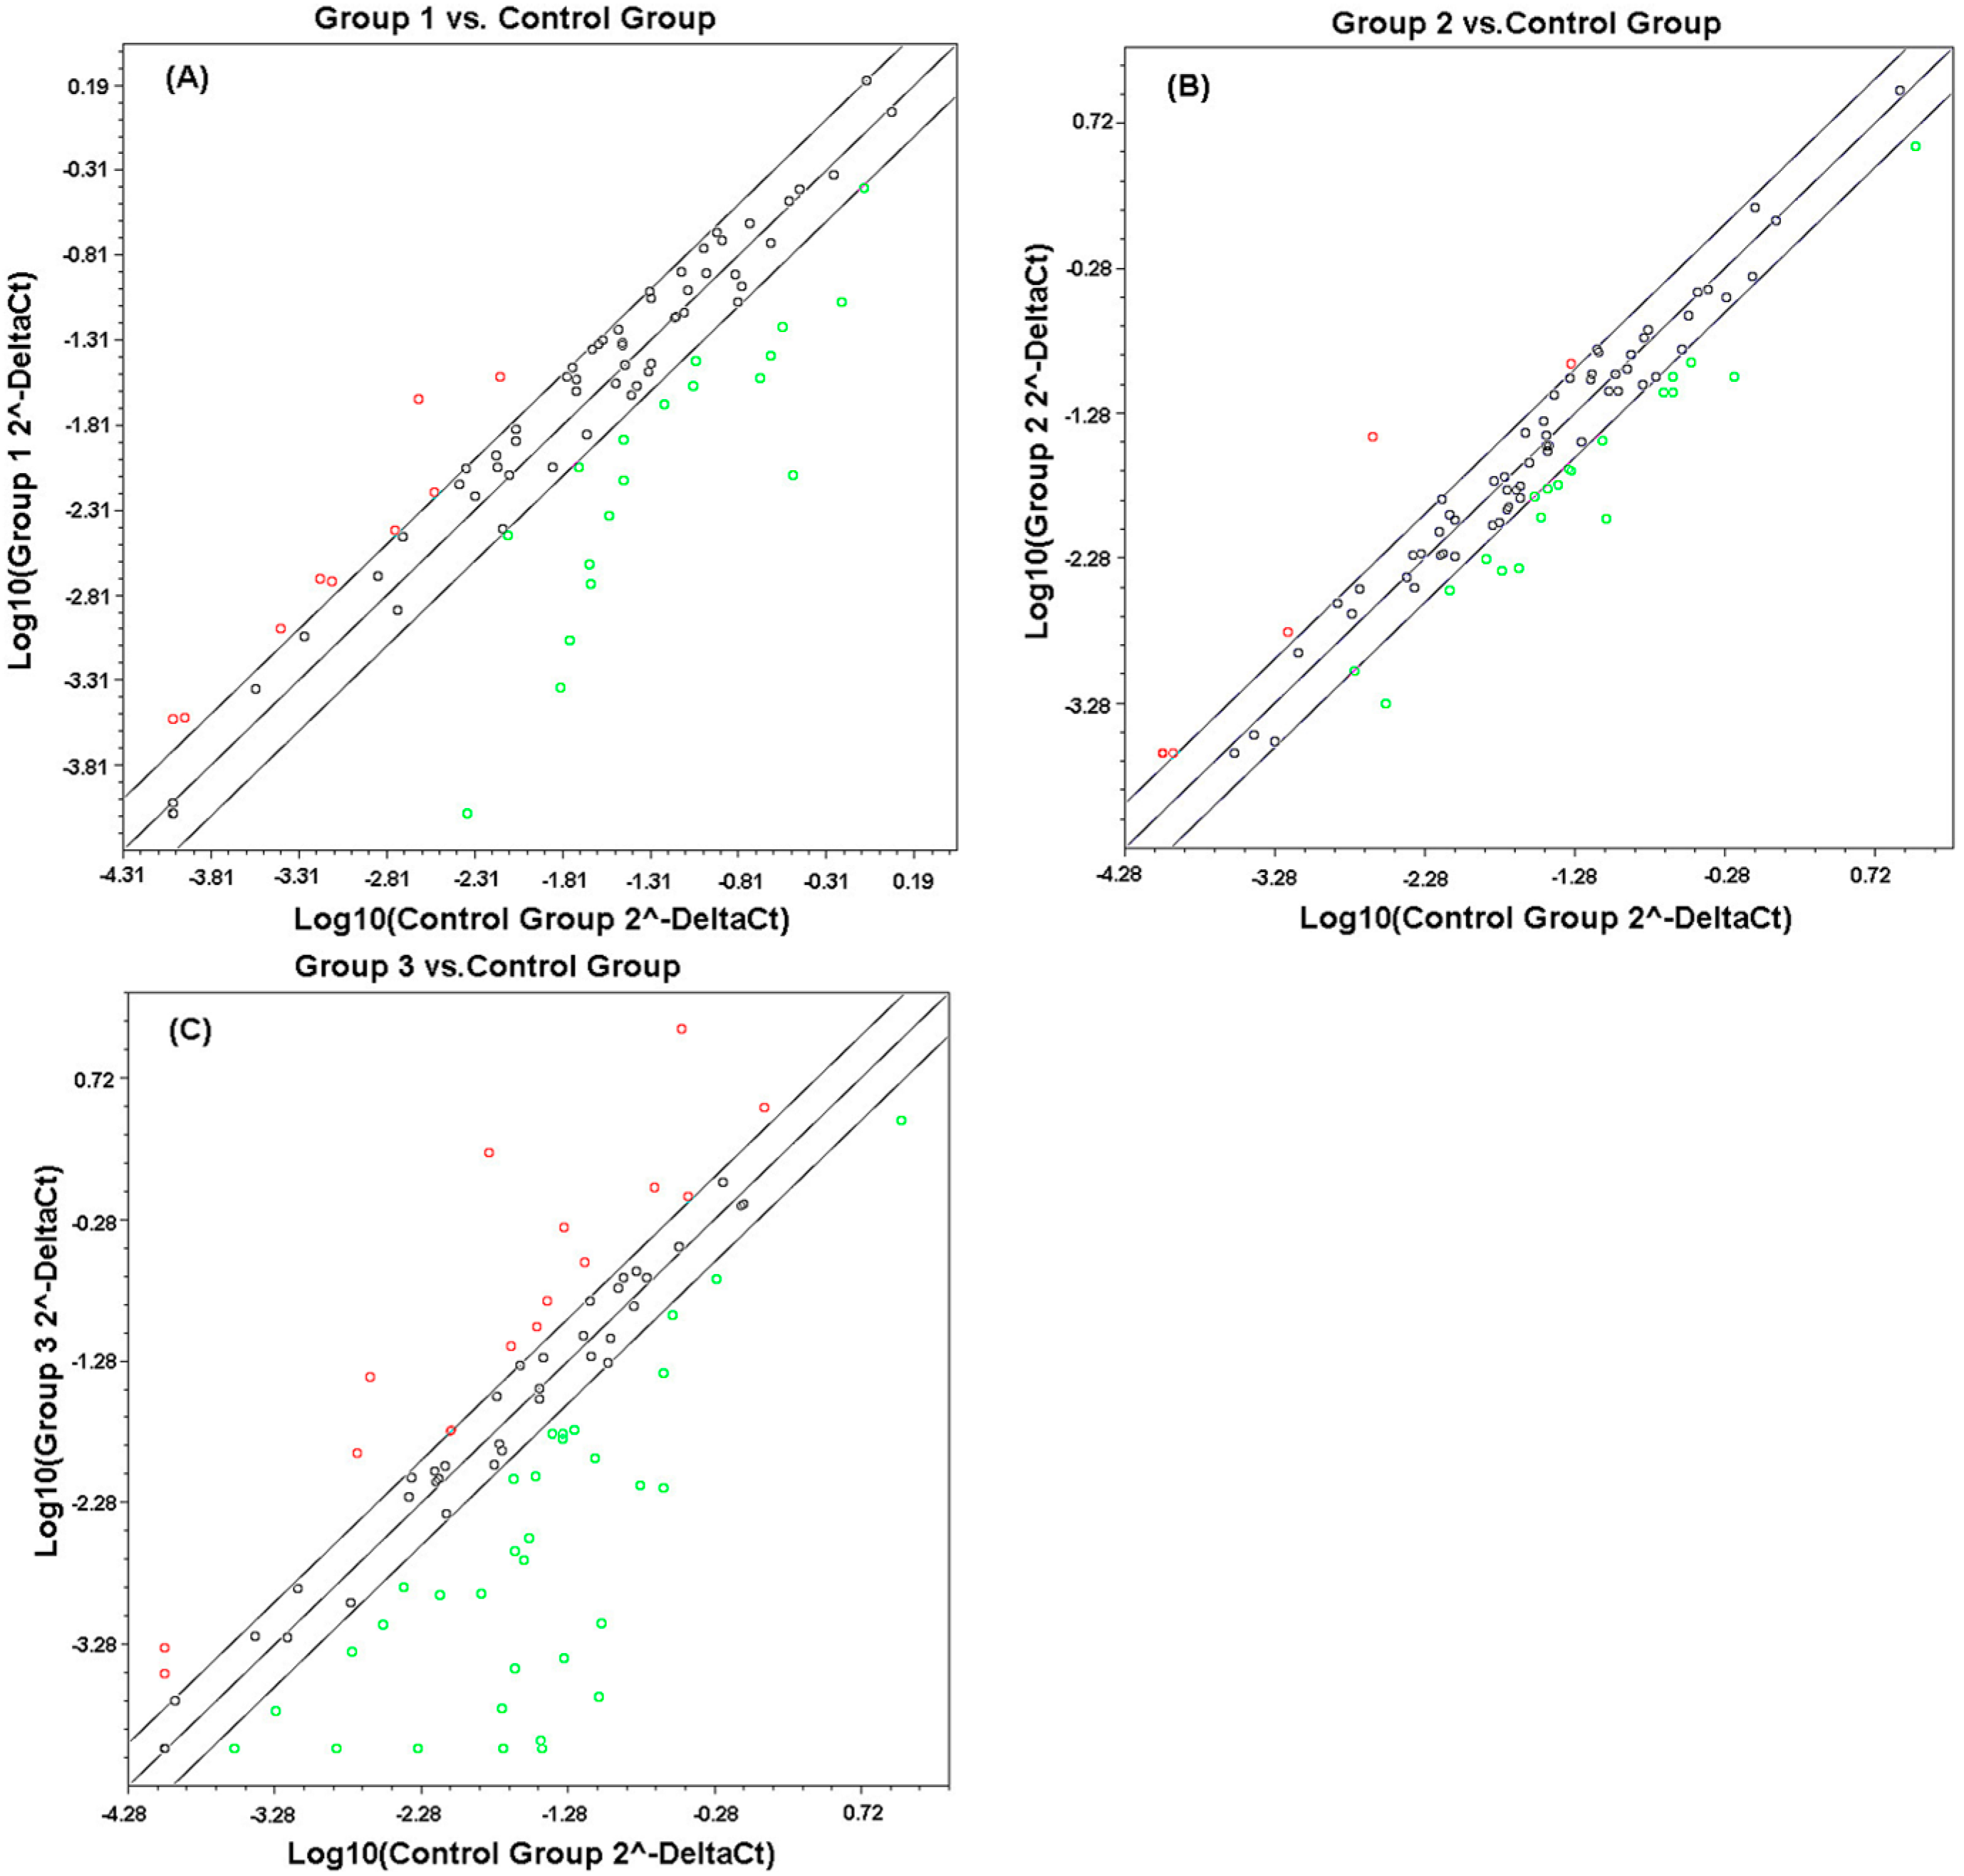
2.1. Comparison of Transcriptional Profiles of Human Peripheral Blood Cells after Exposure to Different X-ray Doses

X-ray-induced gene expression changes were examined in a homogeneous population of human peripheral blood cells obtained from two normal donors (a 34-year-old male and a 32-year-old female). Two independent qPCR array analyses were carried out for each radiation dose after the in vitro reverse transcription reaction of RNA extracted from human peripheral blood cells. These cells were harvested 24 h after 0.5, 3, and 10.0 Gy of X-ray exposure or sham irradiation. Genes modulated at least twofold in each individual qPCR array experiment were considered reliable radiation-responsive genes. Based on analysis criteria, the number of radiation-inducible genes ranged from 27–48 genes, i.e., ~28.1%–50.0% of the total genes in the qPCR array, in terms of the dose tested (Table 1). Up-regulated and down-regulated genes were almost equally distributed in the 0.5, 3 and 10 Gy sets. Figure 1 shows a scatter plot analysis representative of genes with altered expression. Clearly, a certain set of genes was induced by a specific dose or dose range. A total of 48 genes showed altered expression induced by 10 Gy. This number of X-ray-inducible genes was the largest among all investigated doses, thereby confirming that exposures to high doses more dramatically affected gene expression than low doses. The genes with altered expression at 0.5, 3, and 10 Gy are listed in Table 2.
Table 1. Numbers of genes with changed transcription levels in irradiated human peripheral blood cells.
Expression ChangesGene Number
0.5 Gy3 Gy10 Gy
Up-regulated9816
Down-regulated191932
Total282748
Figure 1. Scatter plot analysis representative of transcriptional profiles of human peripheral blood cells 24 h after exposure to different X-ray doses ((AC) 0.5, 3, and 10 Gy, respectively). This figure shows genes with increased (red color) or decreased (green color) expression after radiation compared with those of sham-irradiated cells; Genes with |fold regulation| < 2 were indicated in black.
Ijms 15 19516 g001
Global analysis of qPCR array data indicated that compared with the control, the mRNA levels of 62 genes (Table 2 and Figure 2) exhibited significant expression changes after exposure to 0.5, 3, or 10 Gy of X-ray radiation. Conversely, insignificant expression changes were observed in the expression of 22 genes, including BCL2, BIRC2, BIRC3, CASP8, CCL5, CFLAR, CHUK, CTSB, HSP90AB1, IKBKB, MAPK1, MAPK8, NAIP, NOD1, NFKB1, NLRP9, PYCARD, RELA, TAB1, TAB2, TRAF6, and XIAP at all doses (data not shown). At the transcriptional level, a considerable overlap was observed at 24 h in response to low-, medium-, and high-dose exposures (Figure 2). Among these 62 genes, 14 responded to the low and medium doses, 17 genes were significantly affected after both low and high doses, 20 genes exhibited significant expression differences at both medium and high doses, and 10 genes (including CCL2, MEFV, CXCL1, CXCL2, P2RX7, PTGS2, TNF, NLRX1, IFNB1, and TNFSF4) were common to all doses tested. For example, IFNB1 and TNFSF4 were up-regulated, but some other genes (including MEFV, CXCL2, P2RX7, PTGS2, and TNF) were all down-regulated at all doses. Moreover, TNFSF4 mRNA expression was up-regulated with increased irradiation dose, in contrast to PTGS2 mRNA expression. Compared with the control, one gene (NLRX1) was up-regulated in low dose but down-regulated in medium and high doses, but two genes (CCL2 and CXCL1) were down-regulated in low and medium doses but up-regulated in a high dose 24 h after X-ray radiation. Furthermore, some genes were up-regulated at low and medium doses but down-regulated at a high dose.
Table 2. Profiling of genes associated with X-ray-induced inflammatory reaction.
SymbolGenBankDescriptionFold Regulation
0.5 Gy3 Gy10 Gy
CCL2NM_002982Chemokine (C–C motif) ligand 2−39.5871−2.673937.1193
CXCL1NM_001511Chemokine (C–X–C motif) ligand 1 (melanoma growth stimulating activity, alpha)−7.0153−2.80834.2787
NLRX1NM_024618NLR family member X12.1804−5.4679−4.0013
MEFVNM_000243Mediterranean fever−6.3207−2.0551−9.6336
CXCL2NM_002089Chemokine (C–X–C motif) ligand 2−5.9388−2.5035−35.3923
P2RX7NM_002562Purinergic receptor P2X, ligand-gated ion channel, 7−9.4334−4.9114−2.8395
PTGS2NM_000963Prostaglandin-endoperoxide synthase 2 (prostaglandin G/H synthase and cyclooxygenase)−3.2288−8.6517−382.4951
TNFNM_000594Tumor necrosis factor−4.7188−2.1824−359.0338
IFNB1NM_002176Interferon, beta 1, fibroblast3.07832.55953.4564
TNFSF4NM_003326Tumor necrosis factor (ligand) superfamily, member 49.335415.266717.2687
IL1BNM_000576Interleukin 1, beta−7.3595−6.4265
IL6NM_000600Interleukin 6 (interferon, beta 2)−20.1839−3.9760
NLRP4NM_134444NLR family, pyrin domain containing 42.67472.1798
TNFSF11NM_003701Tumor necrosis factor (ligand) superfamily, member 112.99322.5231
CASP5NM_004347Caspase 5, apoptosis-related cysteine peptidase−12.5221 −63.2637
CCL7NM_006273Chemokine (C–C motif) ligand 7−33.7867 103.5741
IRF2NM_002199Interferon regulatory factor 2−2.8683 −3.4050
MAPK13NM_002754Mitogen-activated protein kinase 13−2.7257 −313.9804
NLRP1NM_033004NLR family, pyrin domain containing 1−2.3960 −119.3437
NLRP3NM_183395NLR family, pyrin domain containing 3−2.1744 −197.9183
PEA15NM_003768Phosphoprotein enriched in astrocytes 15−4.6696 −2.4521
CARD18NM_021571Caspase recruitment domain family, member 18 2.55955.3355
SUGT1NM_006704SGT1, suppressor of G2 allele of SKP1 ( S. cerevisiae) 2.31839.3633
CIITANM_000246Class II, major histocompatibility complex, transactivator −2.6392−11.2611
IKBKGNM_003639Inhibitor of kappa light polypeptide gene enhancer in B-cells, kinase gamma −2.2396−2.9962
IRAK1NM_001569Interleukin-1 receptor-associated kinase 1 −3.1312−3.8438
IRF1NM_002198Interferon regulatory factor 1 −3.2151−5.4590
MAPK3NM_002746Mitogen-activated protein kinase 3 −2.3435−119.1749
NFKBIBNM_002503Nuclear factor of kappa light polypeptide gene enhancer in B-cells inhibitor, beta −2.4474−2.5170
NLRC5NM_032206NLR family, CARD domain containing 5 −2.3274−7.4314
NOD1NM_006092Nucleotide-binding oligomerization domain containing 1 −2.0327−3.8188
CD40LGNM_000074CD40 ligand4.3937
IL12ANM_000882Interleukin 12A (natural killer cell stimulatory factor 1, cytotoxic lymphocyte maturation factor 1, p35)2.5043
MAPK12NM_002969Mitogen-activated protein kinase 122.5661
MOKNM_014226Renal tumor antigen2.1817
IL12BNM_002187Interleukin 12B (natural killer cell stimulatory factor 2, cytotoxic lymphocyte maturation factor 2, p40)−55.6021
IL18NM_001562Interleukin 18 (interferon-gamma-inducing factor)−2.2094
NFKBIANM_020529Nuclear factor of kappa light polypeptide gene enhancer in B-cells inhibitor, alpha−2.0706
IL33NM_033439Interleukin 33 2.5595
NLRP5NM_153447NLR family, pyrin domain containing 5 2.5595
BCL2L1NM_138578Bcl2-like 1 −2.4431
AIM2NM_004833Absent in melanoma 2 2.0252
HSP90AA1NM_001017963Heat shock protein 90 kDa alpha (cytosolic), class A member 1 2.2279
HSP90B1NM_003299Heat shock protein 90 kDa beta (Grp94), member 1 2.8132
IFNGNM_000619Interferon, gamma 6.1451
MAP3K7NM_003188Mitogen-activated protein kinase kinase kinase 7 2.8662
MYD88NM_002468Myeloid differentiation primary response gene (88) 3.8568
NLRC4NM_021209NLR family, CARD domain containing 4 3.6631
PANX1NM_015368Pannexin 1 2.0607
RIPK2NM_003821Receptor-interacting serine-threonine kinase 2 3.1423
CARD6NM_032587Caspase recruitment domain family, member 6 −5.9438
CASP1NM_033292Caspase 1, apoptosis-related cysteine peptidase (interleukin 1, beta, convertase) −23.2608
FADDNM_003824Fas (TNFRSF6)-associated via death domain −100.3419
MAPK11NM_002751Mitogen-activated protein kinase 11 −2.9619
MAPK9NM_002752Mitogen-activated protein kinase 9 −12.8590
NLRP12NM_033297NLR family, pyrin domain containing 12 −14.3709
NLRP6NM_138329NLR family, pyrin domain containing 6 −9.6825
PSTPIP1NM_003978Proline-serine-threonine phosphatase-interacting protein 1 −3.3141
PYDC1NM_152901PYD (pyrin domain) containing 1 −2.9089
TIRAPNM_001039661Toll-interleukin 1 receptor (TIR) domain containing adaptor protein −3.0328
TNFSF14NM_003807Tumor necrosis factor (ligand) superfamily, member 14 −51.3506
TXNIPNM_006472Thioredoxin-interacting protein −2.7110
Figure 2. Venn diagram showing the overlap of genes with significant expression changes 24 h after exposure to different X-ray doses.
Ijms 15 19516 g002
Among the 62 genes, 31 were altered only at a specific dose. Among genes that responded only to a low dose, 4 (CD40LG, IL12A, MAPK12, and MOK) were up-regulated and 3 (IL12B, IL18, and NFKBIA) were down-regulated; these were induced only after a medium dose radiation. There were only 3 genes, including the up-regulation of 2 genes (IL33 and NLRP5), and the down-regulation of 1 gene (BCL2L1) that exhibited only significant expression changes following exposure to the highest dose; only 42.9% (9 genes, including AIM2, HSP90AA1, HSP90B1, IFNG, MAP3K7, MYD88, NLRC4, PANX1, and RIPK2) were up-regulated, whereas 57.1% (12 genes, including CARD6, CASP1, FADD, MAPK11, MAPK9, NLRP12, NLRP6, PSTPIP1, PYDC1, TIRAP, TNFSF14, and TXNIP) were down-regulated.
We also assessed the scale of variation of all genes tested on the qPCR array at low, medium, and high doses. Apart from genes with significant differential expression, fold changes of the majority of the tested genes were between 1.5 and 2 (Figure 3). We observed few genes showing significant alteration in expression at all doses at the twofold threshold. However, when the threshold was reduced to 1.8-fold, some genes including BIRC2, CTSB, MAPK1, NLRP9, PYCARD, and TAB2 were also found to have significant differential expression. Moreover, PEA15, NLRP4, and PSTPIP1 were affected by all doses tested. Fold changes of 2.0 [21,22,23] or 1.5 [24,25] are common cutoff values in microarray experiments. Thus, when the threshold was reduced 1.5-fold, BCL2, BIRC3, CFLAR, NFKB1, and TAB1 were considered as having significant differential expression. Seventeen genes (including BIRC2, CASP5, CCL7, CHUK, CIITA, IFNG, IL12A, IL1B, IL6, IRF2, MAPK11, MAPK8, NFKBIB, NLRC4, NLRP3, PANX1, and SUGT1) with significantly changed expression were common to all irradiation doses. Moreover, 4 genes (IFNG, IL12A, MAPK8 and SUGT1) were found to be persistently up-regulated, 4 genes (CASP5, CIITA, NFKBIB, and NLRP3) were persistently down-regulated, and the remaining genes were up-regulated or down-regulated after a single dose of 0.5, 3, or 10 Gy of irradiation.
Figure 3. Distribution of fold regulations of all genes tested after a low-, medium-, or high-dose exposure.
Ijms 15 19516 g003

2.2. Comparison of qPCR Array with Other Studies

Using high-throughput gene chips or cDNA microarrays, thousands of scholars have identified a large number of genes. These genes play important roles in signal transduction, cell cycle regulation, cytoskeleton organization and cell motility, DNA repair, and apoptosis in response to ionizing radiation [26,27,28,29,30]. However, only a small part of these genes affect the inflammation process. In the present work, we used qPCR array to screen out 62 genes with significant differential expression (|fold regulation| > 2) associated with inflammatory reaction after X-ray irradiation. Including BCL2L1, CARD6, CASP1, CASP5, CCL2, CCL7, CD40LG, CXCL1, CXCL2, FADD, HSP90AA1, HSP90B1, IFNB1, IFNG, IKBKG, IL12A, IL12B, IL18, IL1B, IL6, IRAK1, IRF1, MAP3K7, MAPK12, MAPK3, MYD88, NFKBIA, NLRP12, NLRP3, PTGS2, SUGT1, TNF, TNFSF11, TNFSF14, and TNFSF4, 35 were associated with ionizing radiation response, as previously reported in different types of cells, tissues, and organisms [31,32,33,34,35,36,37,38,39,40,41,42,43,44,45,46,47,48,49,50,51,52,53,54,55,56]. Among these genes, 27 (including AIM2, CARD18, CIITA, IL33, IRF2, MAPK11, MAPK13, MAPK9, MEFV, NFKBIB, NLRC4, NLRC5, NLRP1, NLRP4, NLRP5, NLRP6, NLRX1, NOD2, P2RX7, PANX1, PEA15, PSTPIP1, PYDC1, MOK, RIPK2, TIRAP, and TXNIP) have not previously been shown to be responsive to ionizing radiation damage at the mRNA level (|fold regulation| > 2). Ten genes responded to all doses (0.5, 3, and 10 Gy), and only NLRX1, MEFV, and P2RX7 were novel. Among 84 genes, 22 did not show any significant change in expression (the primers of these 22 genes were included in RT2 Profiler PCR Arrays in 96-well plates). However, previous studies have shown that some of these genes, namely, BCL2, BIRC2, BIRC3, CASP8, CCL5, CFLAR, CHUK, HSP90AB1, IKBKB, MAPK8, NAIP, NOD1, NFKB1, PYCARD, RELA, TRAF6, and XIAP, exhibited significant expression changes at the mRNA level after irradiation [31,32,33,37,45,49,50,51,52,57,58,59,60,61]. Variations in radiation type, dose rate, tissue type, and cell types used in the different studies may account for the differences in results. Moreover, fold regulations of BCL2, BIRC2, BIRC3, CASP8, CCL5, CFLAR, CHUK, CTSB, MAPK1, MAPK8, NFKB1, NLRP9, PYCARD, TAB1, TAB2, and TRAF6 were more than 1.5 or less than −1.5 after exposure. If the cutoff values were reduced 1.5-fold, the above genes can also be considered as having significantly differential expression, but only CTSB, MAPK1, NLRP9, TAB1, and TAB2 were novel. However, fold regulations of HSP90AB1, IKBKB, NAIP, NOD1, RELA, and XIAP were less than 1.5 or more than −1.5 after exposure; thus, they still cannot be considered to have significant differential expression even when the cutoff values were reduced 1.5-fold. However, these genes have been previously shown to be responsive to ionizing radiation damage at the mRNA level [31,32,37,50,51,52].
We subsequently tested the ability of the 62-gene signature to predict the exposure doses of individual samples under blinded conditions. Expression information for the 62 genes was used to build a Nearest Centroid Classifier [62,63] with leave-one-out cross-validation to predict samples as belonging to unexposed, 0.5, 3, or 10 Gy categories. The dose and time dependence of inflammation-related genes (except TNFSF4), which were closely associated with ionizing radiation response after irradiation remained unclear. Pogosova-Agadjanyan et al. [64] reported that TNFSF4 expression in CD3+ lymphocytes, mononuclear cells (MNCs), and white blood cell fraction (MNC+ granulocytes) exhibited significant linear dose-dependent expression changes 24 h after 2, 6, and 12 Gy of radiation (γ-rays; 7.6 Gy/min). Results of the qPCR arrays suggested that fold changes of TNFSF4 mRNA-altered expression were 9.3354, 15.2667, and 17.2687 after 0.5, 3, and 10 Gy of irradiation (X-ray; 100 cGy/min), respectively. This means that the expression changes of TNFSF4 mRNA were up-regulated with increased irradiation dose. We also found that expression changes of TNFSF4 mRNA exhibited a dose-dependent response within a wide range of doses (0, 1, 3, 5, 8, 10, and 12 Gy) that was independent of post-irradiation incubation time. Moreover, expression was not affected by age and gender in 51 healthy donors [65]. Thus, TNFSF4 is a possible candidate gene of ionizing radiation that can be used to assess radiation exposure and toxicity. As for others, especially those common to all the irradiation doses or the medium and high dose, we can further study the dose-dependent or time-dependent response. If some genes exhibit a dose-dependent response, we can account them into a model which will be developed to estimate in vitro radiation exposures using a stepwise regression procedure (SAS PROC REG) [64]. Ideally, candidate genes selected for building biodosimeter models exhibit certain dose-dependent expression changes unassociated with age, gender, time, cell type, and/or other potential inter-individual confounders after irradiation. Radiation dosimetry assays using such target genes could be implemented and interpreted across a wide variety of human populations with potentially infinite exposure scenarios [64]. Therefore, further study on the dependence of these genes on age, gender, cell type, or other potential inter-individual confounders is necessary.

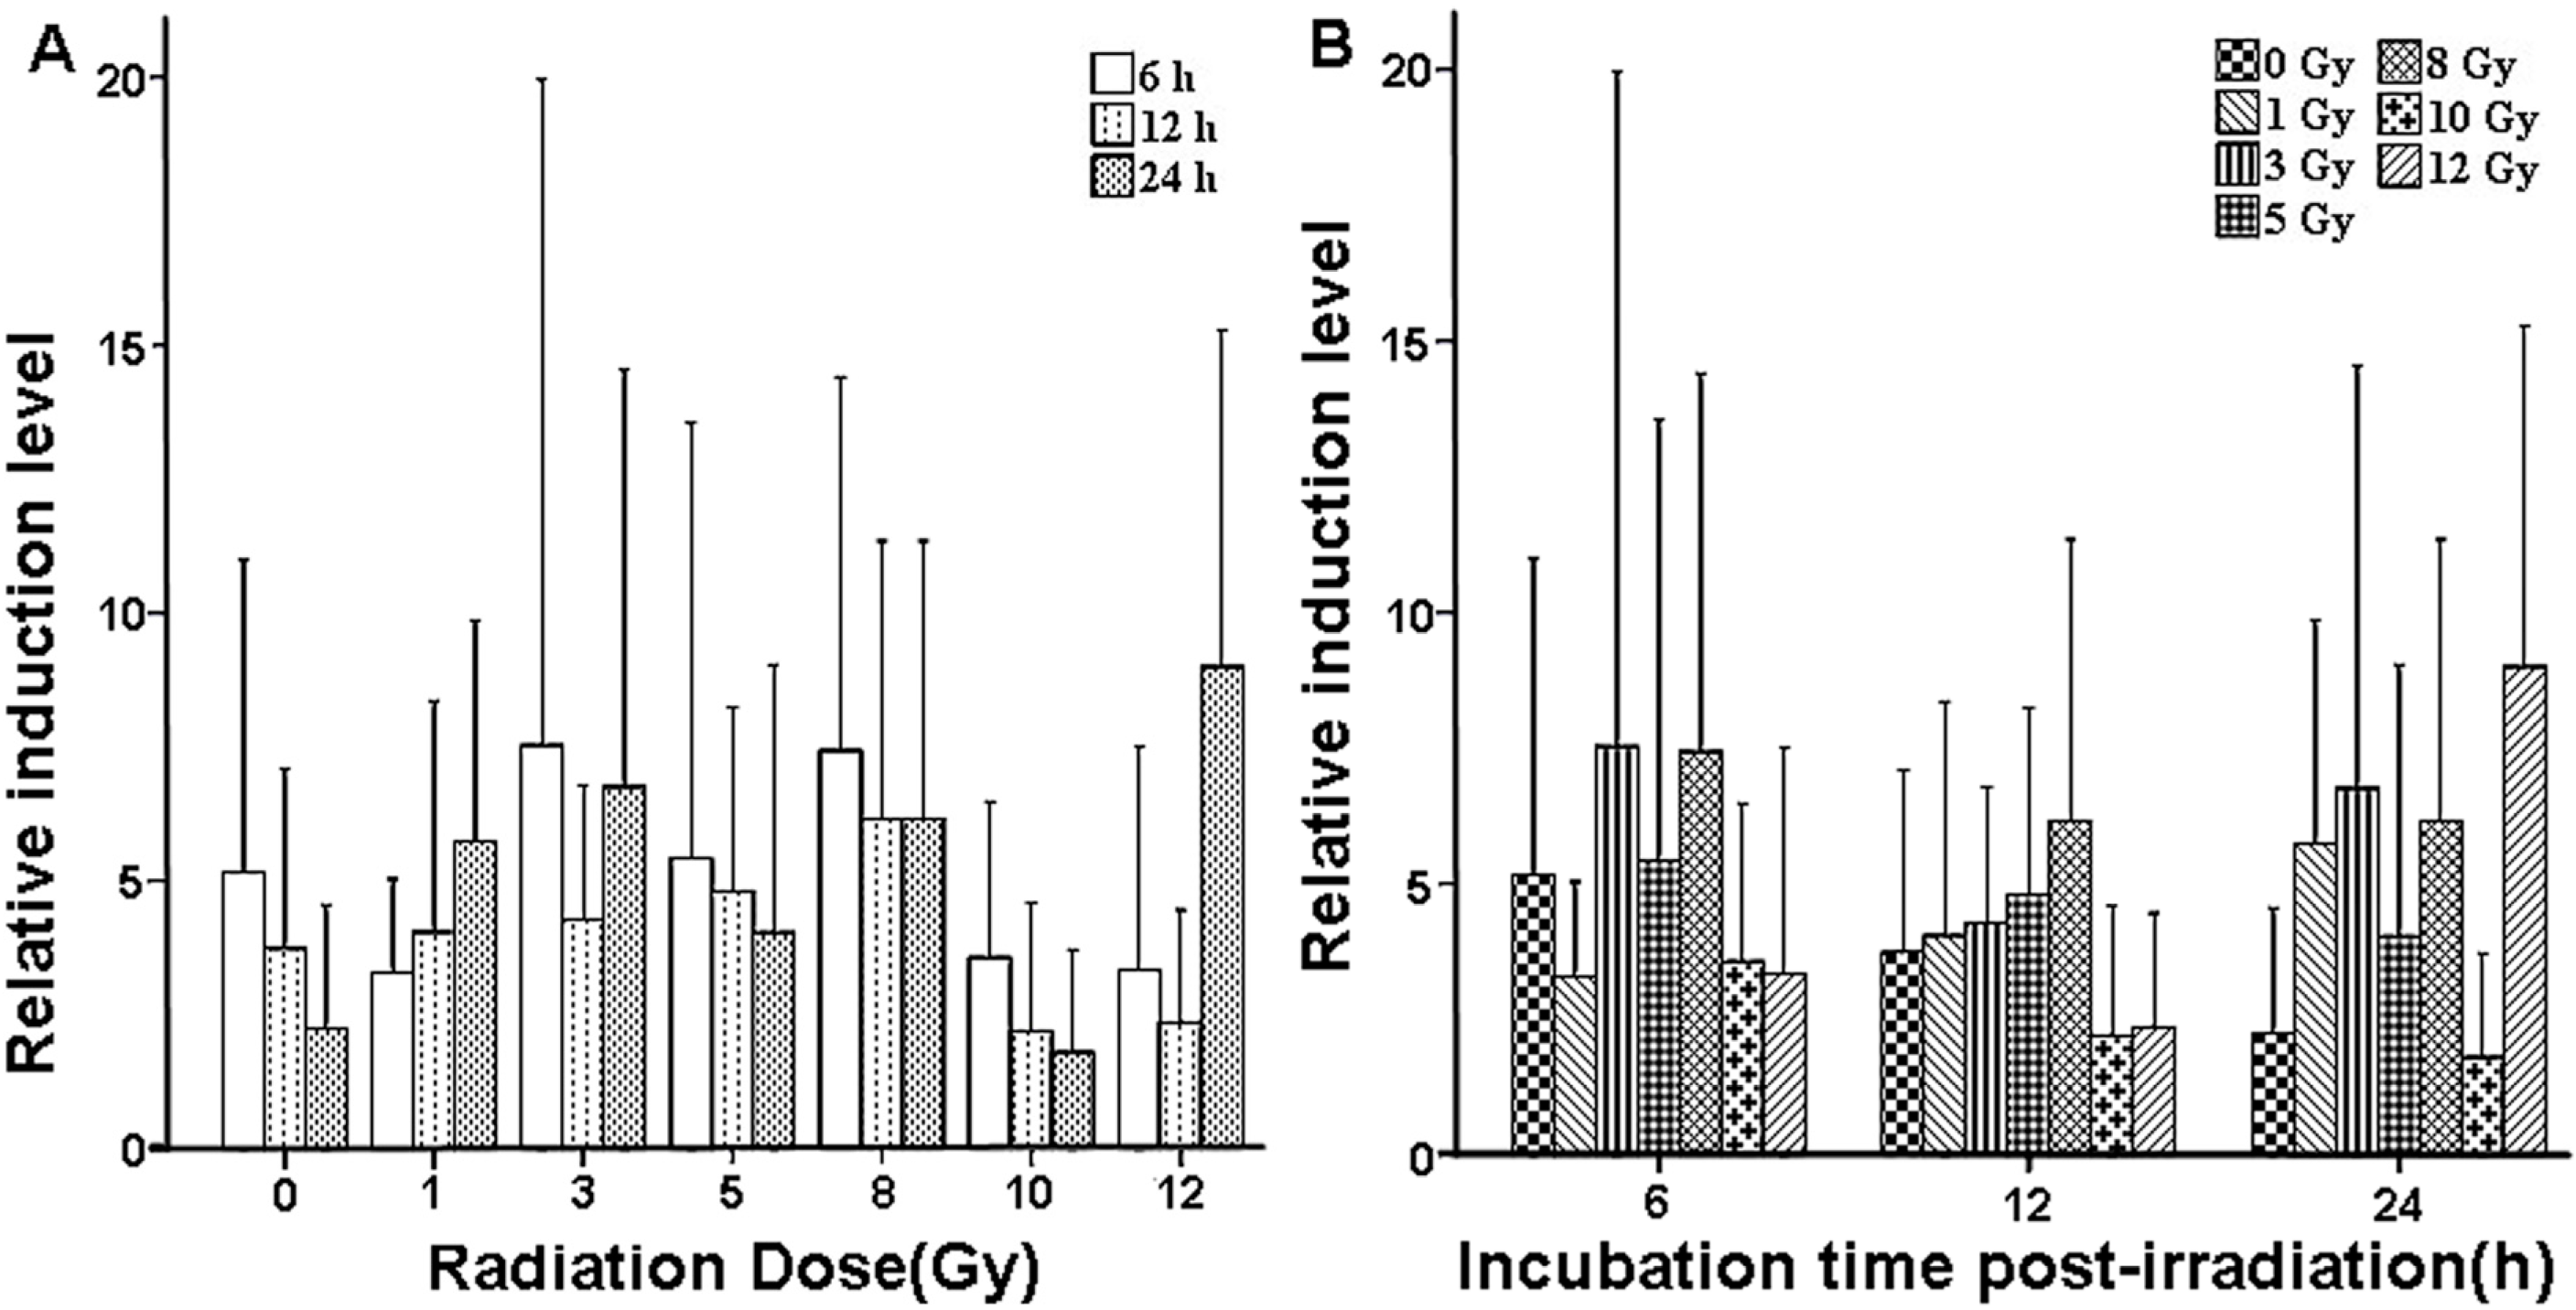
2.3. Validation of X-ray-Induced Expression Changes of CCL2 in Human Peripheral Blood

The expression changes of CCL2, which was observed to be down-regulated at low and medium doses but up-regulated at a high dose 24 h after X-ray radiation in qPCR array, were validated by qRT-PCR. These changes were then examined in a homogeneous population of human peripheral blood cells obtained from seven healthy volunteer donors (age range = 23–33; four males and three females). The qRT-PCR assay results are shown in Table 3 and Figure 4. No significant statistical difference was found among the different doses (F = 0.920, p = 0.495; Figure 4A). The differences among incubation time post-irradiation were also not statistically significant (F = 0.190, p = 0.783; Figure 4B). Thus, CCL2 had radiation-induced expression levels that were not highly dependent on the X-ray dose exposure or incubation time post-irradiation. However, the expression levels of CCL2 mRNA exhibited a certain trend of up-regulation within a wide range of doses 24 h after irradiation.
Table 3. X-ray-induced expression changes of CCL2 mRNA in human peripheral blood.
Dose (Gy)Relative Induction Level Relative Induction
6 h12 h24 h
05.1547 ± 5.82803.7394 ± 3.34932.2400 ± 2.3159
13.1912 ± 1.74624.0470 ± 4.30985.7423 ± 4.1118
37.5279 ± 12.42024.2638 ± 2.51476.7529 ± 7.7754
55.4198 ± 8.11944.8103 ± 3.43794.0393 ± 4.9922
87.4343 ± 6.96596.1453 ± 5.19106.1574 ± 5.1804
103.5730 ± 2.90492.2096 ± 2.38991.8030 ± 1.9142
123.3331 ± 4.16772.3643 ± 2.08858.9944 ± 6.2734
Figure 4. Expression of CCL2 in human peripheral blood after X-ray irradiation. (A) Dose-dependent expression change; and (B) time-dependent expression change. Error bars represent standard deviation (n = 7 donors).
Ijms 15 19516 g004
CCL2 (chemokine (C–C motif) ligand 2), also known as HC11, MCAF, MCP1, MCP-1, SCYA2, GDCF-2, SMC–CF, or HSMCR30, is an important member of the C–C subfamily of chemokines. These chemokines are produced by some tumor cells and macrophages and characterized by having two adjacent cysteine residues. CCL2 plays important roles in attracting MNCs to inflammatory sites and in regulating macrophage functions. The expression of monocyte chemotactic protein-1/CCL2 may reportedly be an independent prognostic marker for gastric cancer [66] and a link between hepatic inflammation, fibrosis and, angiogenesis [67]. Four-month-old Fisher 344-Brown Norway (F344 × BN) male rats received whole brain irradiation with a single dose of 10 Gy γ-rays (137Cs; 4.23 Gy/min). A significant and marked up-regulation of mRNA and protein expression of monocyte chemoattractant protein-1 (MCP-1) was observed in hippocampal and cortical regions isolated from irradiated brain 4, 8, and 24 h after irradiation [68]. A single dose of 8 Gy to the brain of 14-day-old postnatal mice had caused up-regulation of CCL2 mRNA expression level 6 h after irradiation [69]. After exposing Male Wistar rats to single dose-irradiation (25 Gy; 2.4 Gy/min), CC–Chemokine (MCP-1/CCL2 and MCP-3/CCL7) gene expression had been significantly induced in total RNA from irradiated livers 3–6 h after irradiation [34]. In [52], 23-day-old C57BL/6 mice (male and female) have been exposed to 2, 10 Gy, or fractionated ionizing radiation (2 Gy per day for 5 days (2 Gy × 5)) (γ-rays; 0.81 Gy/min). Results show that CCL2 mRNA expression is significantly (more than twofold) up-regulated in non-targeted heart after 2 or 10 Gy but not after 2 Gy × 5. In [20], the thoraces of 8-week-old female mice of C57BL/6 (fibrosis sensitive) strain have been irradiated with a single dose of 12.5 Gy at a dose rate of about 3 Gy/min using a 137Cs γ-ray source. The expression of CCL2 and CCL7 mRNA are found to be elevated in irradiated mice compared with age-matched controls 26 weeks after irradiation. In some other studies, it was found that CCL2 mRNA was up-regulated in tumor cell lines (SCC-4, SCF-7, IOMM Lee, SF-3061, or A549) receiving X-ray or γ-ray irradiation [50,51,70,71]. All these previous results indicate that the expression level of CCL2 significantly increases regardless of in vitro or in vivo exposure. In the present study, qRT-PCR results 24 h after irradiation (except at 10 Gy dose) agreed with the aforementioned previous results. Differences in irradiation source, dose rate, time and manner of irradiation, donor characteristic, culture condition, cell, tissue, or organ may account for the discrepancies in the results of the present and previous studies.
qPCR array analysis showed that fold changes of altered expression of CCL2 mRNA were −39.5871, −2.6739, and 37.1193, 24 h after 0.5, 3, and 10 Gy of irradiation (X-rays; dose rate = 100 cGy/min), respectively. In other words, CCL2 was up-regulated after high-dose irradiation (10 Gy). This finding was consistent with other previous studies but different from the present qRT-PCR results. Analysis of qPCR array indicated that CCL2 was down-regulated at low and medium doses (0.5 and 3 Gy), which disagreed with qRT-PCR results possibly because of differences in housekeeping gene, primer design, donor characteristic, or volume of added medium.
Though CCL2 was not the most significant among these genes identified in this study, we wondered whether CCL2 exhibits significant linear dose-dependent expression changes within the wider dosage range and can be a potential candidate gene for biological dosimeters. Thus, we simultaneously examined expression changes of CCL2 and TNFSF4 [65] at different times after varied irradiation doses. In addition to TNFSF4 and CCL2, we next also need to test other radiation-inducible genes affected by all doses tested in qPCR array assay, especially PTGS2. Further study is needed for both dose- and time-dependent responses, as well as their distribution in normal populations.

3. Materials and Methods

3.1. Acquisition of Samples from Healthy Donors and Ethics Statement

Peripheral blood samples were collected from healthy volunteer donors (n = 2 for qPCR array analysis; n = 7 for qRT-PCR assay) at the Henan Institute of Occupational Medicine (HIOM). The scope and risk of the study were explained to each subject before written informed consents were obtained. The Medical Ethics Committee of HIOM (Zhengzhou, China) approved all experiments in this study (2012-05, 16 July 2012). All subjects had no history of chronic disease, substance abuse, toxic chemical exposure, radiation exposure, or viral infection during the months preceding the study.

3.2. In Vitro Irradiation of qPCR Array Analysis Samples and RNA Extraction

Whole blood samples from each of two healthy donors (one male and one female) were irradiated with X-ray at room temperature using MEVATRON medical electron linear accelerator (The First Affiliated Hospital of Zhengzhou University, Zhengzhou, China) at an average rate of 100 cGy/min with doses of 0.5, 3 and 10 Gy. The uniform exposure field was 40 cm × 40 cm. After irradiation, the cells were maintained in a 37 °C constant-temperature incubator and cultured in 20 mL of RPMI-1640 medium (HyClone, Logan, UT, USA) containing 10% heat-inactivated fetal bovine serum (SunBao Biotech, Shanghai, China) and 160 U/mL gentamicin. The cells were then harvested at 24 h to prepare RNA extracts. RNA was extracted using BQIAamp RNA Blood Mini Kit (Qiagen, Hilden, Germany) according to the manufacturer’s recommendations and assessed for the quality and concentration of each sample with NanoVueTM (GE Healthcare, Princeton, NJ, USA). Spectrophotometrical measurements showed that all samples had (i) A260:A230 ratio above 1.7; (ii) A260:A280 ratio within 1.8–2.0; and (iii) concentration determined by A260 more than 40 μg/mL.

3.3. Inflammation-Related Gene Expression Measurement Using qPCR Array

First, 500 ng of total RNA was reverse transcribed into cDNA using RT2 First Strand Kit (Qiagen) following the manufacturer’s protocol. Second, 500 ng of cDNA equivalent was used for each profiling plate mixed with RT2 SYBR Green Mastermix (Qiagen) on an ABI 7500 RT-PCR System (Applied Biosystems, Foster City, CA, USA) following the manufacturer’s instructions. Data were evaluated using Sequence Detection Software 1.3.1 (Applied Biosystems) combined with Excel® (Microsoft, Unterschleissheim, Germany) for statistical evaluation. RT2 Profiler PCR Arrays (Qiagen) in 96-well plates used in the study contained primer assays for 84 inflammation-related genes and 5 housekeeping genes (ACTB, B2M, GAPDH, HPRT1 and RPLP0). One well contained a genomic DNA control, 3 wells contained reverse-transcription controls, and 3 wells contained positive PCR controls. We started with a highly selective qPCR profiler rather than a global gene array because the selected genes in qPCR array had a well-characterized profile governing inflammatory signal transduction and transcriptional targets. Thus, data interpretation, simplification of data acquisition, data analysis, and gene function determination can be facilitated. qPCR profiling also allows real-time detection and quantification of gene expression. ΔΔCt values were calculated by normalizing the gene expression levels to those of 5 housekeeping genes and then comparing with controls. The relative expression level of each gene was expressed as fold regulation. When comparing each gene’s signal intensity between irradiated and sham-irradiated groups, we set a cutoff of ≥two-fold for gene induction and ≤two-fold for gene repression.

3.4. In Vitro Irradiation of qRT-PCR Assay Samples and Subsequent Cell Isolation

Whole blood samples from seven healthy volunteer donors were irradiated at 0 (sham), 1, 3, 5, 8, 10, and 12 Gy as described above. After irradiation, the cells were cultured in 12 mL of RPMI-1640 medium (HyClone, Logan, UT, USA) as described above and then harvested at 6, 12, and 24 h. White blood cells were separated as previously described [72].

3.5. Chemokine (C–C Motif) Ligand 2 (CCL2) Expression Measurement Using qRT-PCR

RNA was extracted from white blood cells using Trizol reagent (Invitrogen, Carlsbad, CA, USA) per the manufacturer’s recommendations and assessed for quality and concentration as described above. Spectrophotometrical measurements showed that all samples had (i) A260:A280 ratio within 1.8–2.0 and (ii) concentration determined by A260 more than 57.1 μg/mL. For all qRT-PCR studies, 1000 ng of total RNA was reverse transcribed with random primer using reverse transcription M-MMLV (Takara, Dalian, China) according to the manufacturer’s guidelines. Each reverse transcription product was diluted to 40 μL with sterilized double-distilled water. Then, 50 ng of cDNA equivalent was then assayed on an ABI 7500 RT-PCR system (Applied Biosystems) mixed with the components of SYBR®Premix Ex TaqTM (Takara, Dalian, China) according to the manufacturer’s instructions. The forward (GAPDH: 5'-GGAGAAGGCTGGGGCTCAT-3'; CCL2: 5'-CTCATAGCAGCCACCTTCATTC-3') and reverse (GAPDH: 5'-TGGGTGGCAGTGATGGCA-3'; CCL2: 5'-GAGTGTTCAAGTCTTCGGAGTTTG-3') primers were PCR primer sequences for qRT-PCR designed according to MITOMAP Human Cambridge Sequence data [73] and then synthesized by Gene Core Bio Technologies Co., Ltd., Shanghai, China. Fluorescence signals were normalized by the internal control dye (ROX II). ΔΔCt values were calculated by normalizing the gene expression level to the endogenous control glyceraldehyde 3-phosphate dehydrogenase 1 (GAPDH). All samples were run in triplicates with appropriate blank controls. Data are presented as the mean ± SD and analyzed using IBM SPSS software Version 21.0 (SPSS, Chicago, IL, USA). p values <0.05 were considered statistically significant. All reported p values were two-sided. Repeated measurement ANOVA was used to determine the statistical significance of irradiated blood samples.

4. Conclusions

We identified 62 significant differentially expressed genes related to inflammation following X-ray irradiation using qPCR array, such as IFNB1, TNFSF4, CCL2, and CCL7. We found that the qPCR array technique was a powerful tool for screening radiation-responsive genes and can be used to explore the molecular mechanism of inflammation as influenced by genes that were differentially expressed significantly under ionizing radiation. We also examined dose- and time-dependent responses of CCL2 after X-ray irradiation. The results can help in the development of early, rapid, and high-throughput biological dosimeters.

Acknowledgments

This work was supported by grants from the building project of the National Key Clinical Special Department of China (Grant No. 2011-17) and the Medical Science and Technology Foundation of Henan Province (Grant Nos. 201003146 and 201303202).

Author Contributions

Ping Wang conceived the idea of this research and was in charge of all experiments. Fei Guo performed the research, including data collection, testing, and analysis. Lin Han was responsible for blood donation selection and informed consent collection. Xi’ai Wang, Jie Li, and Yan Guo participated in sample collection. Yumin LÜ critically supervised the entire research and revised the manuscript. All authors have read and approved the final manuscript.

Conflicts of Interest

The authors declare no conflict of interest.

References

  1. Amundson, S.A.; Bittner, M.; Meltzer, P.; Trent, J.; Fornace, A.J. Biological indicators for the identification of ionizing radiation exposure in humans. Expert Rev. Mol. Diagn. 2001, 1, 211–219. [Google Scholar] [CrossRef]
  2. Blakely, W.F.; Salter, C.A.; Prasanna, P.G. Early-response biological dosimetry-recommended countermeasure enhancements for mass-casualty radiological incidents and terrorism. Health Phys. 2005, 89, 494–504. [Google Scholar] [CrossRef] [PubMed]
  3. Pellmar, T.C.; Rockwell, S. Priority list of research areas for radiological nuclear threat countermeasures. Radiat. Res. 2005, 163, 115–123. [Google Scholar] [PubMed]
  4. Rea, M.E.; Gougelet, R.M.; Nicolalde, R.J.; Geiling, J.A.; Swartz, H.M. Proposed triage categories for large-scale radiation incidents using high-accuracy biodosimetry methods. Health Phys. 2010, 98, 136–144. [Google Scholar] [CrossRef] [PubMed]
  5. Amundson, S.A.; Chen, D.J. Inverse dose-rate effect for mutation induction by γ-rays in human lymphoblasts. Int. J. Radiat. Biol. 1996, 69, 555–563. [Google Scholar] [CrossRef] [PubMed]
  6. Vilenchik, M.M.; Knudson, A.G. Inverse radiation dose-rate effects on somatic and germ-line mutations and DNA damage rates. Proc. Natl. Acad. Sci. USA 2000, 97, 5381–5386. [Google Scholar] [CrossRef] [PubMed]
  7. Kumar, P.R.; Mohankumar, M.N.; Hamza, V.Z.; Jeevanram, R.K. Dose-rate effect on the induction of HPRT mutants in human G0 lymphocytes exposed in vitro to gamma radiation. Radiat. Res. 2006, 165, 43–50. [Google Scholar] [CrossRef] [PubMed]
  8. Jiang, Q.; Wang, Y.; Li, T.; Shi, K.; Li, Z.; Ma, Y.; Li, F.; Luo, H.; Yang, Y.; Xu, C. Heat shock protein 90-mediated inactivation of nuclear factor-κB switches autophagy to apoptosis through becn1 transcriptional inhibition in selenite-induced NB4 cells. Mol. Biol. Cell 2011, 22, 1167–1180. [Google Scholar] [CrossRef]
  9. Wu, D.; Lee, Y.C.; Liu, H.C.; Yuan, R.Y.; Chiou, H.Y.; Hung, C.H.; Hu, C.J. Identification of TLR downstream pathways in stroke patients. Clin. Biochem. 2013, 46, 1058–1064. [Google Scholar] [CrossRef] [PubMed]
  10. Azab, S.S.; Salama, S.A.; Abdel-Naim, A.B.; Khalifa, A.E.; El-Demerdash, E.; Al-Hendy, A. 2-Methoxyestradiol and multidrug resistance: Can 2-methoxyestradiol chemosensitize resistant breast cancer cells? Breast Cancer Res. Treat. 2009, 113, 9–19. [Google Scholar]
  11. Fakhari, F.D.; Dittmer, D.P. Charting latency transcripts in Kaposi’s sarcoma-associated herpesvirus by whole-genome real-time quantitative PCR. J. Virol. 2002, 76, 6213–6223. [Google Scholar] [CrossRef]
  12. Dittmer, D.P. Transcription profile of Kaposi’s sarcoma-associated herpesvirus in primary Kaposi’s sarcoma lesions as determined by real-time PCR arrays. Cancer Res. 2003, 63, 2010–2015. [Google Scholar] [PubMed]
  13. Airoldi, I.; di Carlo, E.; Cocco, C.; Taverniti, G.; D’Antuono, T.; Ognio, E.; Watanabe, M.; Ribatti, D.; Pistoia, V. Endogenous IL-12 triggers an antiangiogenic program in melanoma cells. Proc. Natl. Acad. Sci. USA 2007, 104, 3996–4001. [Google Scholar] [CrossRef]
  14. Zhang, D.J.; Qu, J.; Xiong, M.; Qiao, Y.Y.; Wang, D.P.; Yu, J.Y.; Zhao, X.H. Effects of sea water immersion on the functional genes in vascular endothelial cells. Med. J. Chin. 2009, 34, 102–106. [Google Scholar]
  15. Gude, N.; Muraski, J.; Rubio, M.; Kajstura, J.; Schaefer, E.; Anversa, P.; Sussman, M.A. Akt promotes increased cardiomyocyte cycling and expansion of the cardiac progenitor cell population. Circ. Res. 2006, 99, 381–388. [Google Scholar] [CrossRef] [PubMed]
  16. Rangel-Moreno, J.; Hartson, L.; Navarro, C.; Gaxiola, M.; Selman, M.; Randall, T.D. Inducible bronchus-associated lymphoid tissue (iBALT) in patients with pulmonary complications of rheumatoid arthritis. J. Clin. Investig. 2006, 116, 3183–3194. [Google Scholar]
  17. Hansel, N.N.; Cheadle, C.; Diette, G.B.; Wright, J.; Thompson, K.M.; Barnes, K.C.; Georas, S.N. Analysis of CD4+ T-cell gene expression in allergic subjects using two different microarray platforms. Allergy 2008, 63, 366–369. [Google Scholar] [CrossRef]
  18. Rödel, F.; Frey, B.; Gaipl, U.; Keilholz, L.; Fournier, C.; Manda, K.; Schöllnberger, H.; Hildebrandt, G.; Rödel, C. Modulation of inflammatory immune reactions by low-dose ionizing radiation: Molecular mechanisms and clinical application. Curr. Med. Chem. 2012, 19, 1741–1750. [Google Scholar] [CrossRef] [PubMed]
  19. Amundson, S.A.; Do, K.T.; Shahab, S.; Bittner, M.; Meltzer, P.; Trent, J.; Fornace, A.J. Identification of potential mRNA biomarkers in peripheral blood lymphocytes for human exposure to ionizing radiation. Radiat. Res. 2000, 154, 342–346. [Google Scholar] [CrossRef] [PubMed]
  20. Johnston, C.J.; Williams, J.P.; Okunieff, P.; Finkelstein, J.N. Radiation-induced pulmonary fibrosis: Examination of chemokine and chemokine receptor families. Radiat. Res. 2002, 157, 256–265. [Google Scholar] [CrossRef]
  21. Bennett, L.; Palucka, A.K.; Arce, E.; Cantrell, V.; Borvak, J.; Banchereau, J.; Pascual, V. Interferon and granulopoiesis in systemic lupus erythematosus blood. J. Exp. Med. 2003, 197, 711–723. [Google Scholar] [CrossRef] [PubMed]
  22. Ponnampalam, A.P.; Weston, G.C.; Trajstman, A.C.; Susil, B.; Rogers, P.A. Molecular classification of human endometrial cycle stages by transcriptional profiling. Mol. Hum. Reprod. 2004, 10, 879–893. [Google Scholar] [CrossRef] [PubMed]
  23. Yin, H.Q.; Kim, M.; Kim, J.H.; Kong, G.; Kang, K.S.; Kim, H.L.; Yoon, B.I.; Lee, M.O.; Lee, B.H. Differential gene expression and lipid metabolism in fatty liver induced by acute ethanol treatment in mice. Toxicol. Appl. Pharmacol. 2007, 223, 225–233. [Google Scholar] [CrossRef] [PubMed]
  24. Pacini, S; Ruggiero, M; Sardi, I; Aterini, S; Gulisano, F; Gulisano, M. Exposure to global system for mobile communication (GSM) cellular phone radiofrequecy alters gene expression, proliferation, and morphology of human skin fibroblasts. Oncol. Res. 2002, 13, 19–24. [Google Scholar]
  25. Chilakapati, J.; Wallace, K.; Ren, H.; Aterini, S.; Gulisano, F.; Gulisano, M. Genome-wide analysis of BEAS-2B cells exposed to trivalent arsenicals and dimethylthioarsinic acid. Toxicology 2010, 268, 31–39. [Google Scholar] [CrossRef] [PubMed]
  26. Long, X.H.; Zhao, Z.; He, X.P.; Wang, H.P.; Xu, Q.Z.; An, J.; Bai, B.; Sui, J.L.; Zhou, P.K. Dose-dependent expression changes of early response genes to ionizing radiation in human lymphoblastoid cells. Int. J. Mol. Med. 2007, 19, 607–615. [Google Scholar] [PubMed]
  27. Lu, X.; Li, Y.W.; Feng, J.B.; Chen, D.Q.; Liu, Q.J. Differential gene expression profiling in lymphocyte line following exposure to different doses of 60Co γ-ray by gene chip. J. Radiat. Res. Radiat. Process. 2009, 27, 244–247. [Google Scholar]
  28. Wang, H.P.; Long, X.H.; Xu, Q.Z.; Bai, B.; Sui, J.L.; Zhou, P.K. Screening of radiation-induced genes in human lymphoblastoid cells with 20 cGy of γ-ray by gene chip. Radiat. Prot. 2006, 26, 151–156. [Google Scholar]
  29. Long, X.H.; Xu, Q.Z.; He, X.P.; An, J.; Sui, J.L.; Bai, B.; Zhou, P.K. Comparison of transcription profiles between 2 Gy and 10 Gy irradiated human lymphoblastoid cells. Chin. J. Radiol. Med. Prot. 2006, 26, 110–113. [Google Scholar]
  30. Li, K.; Liu, W.; Hou, D.J.; Qiao, J.W.; Ma, Y.; Jia, X.M.; Li, J.Q. Gene transcriptional profiles in human lymphoblastoid cells with low and high doses of irradiation. Chin. J. Radiol. Med. Prot. 2012, 32, 249–255. [Google Scholar]
  31. Kulkarni, R.; Thomas, R.A.; Tucker, J.D. Expression of DNA repair and apoptosis genes in mitochondrial mutant and normal cells following exposure to ionizing radiation. Environ. Mol. Mutagen. 2011, 52, 229–237. [Google Scholar] [CrossRef] [PubMed]
  32. Veeraraghavan, J.; Aravindan, S.; Natarajan, M.; Awasthi, V.; Herman, T.S.; Aravindan, N. Neem leaf extract induces radiosensitization in human neuroblastoma xenograft through modulation of apoptotic pathway. Anticancer Res. 2011, 31, 161–170. [Google Scholar] [PubMed]
  33. Hneino, M.; Blirando, K.; Buard, V.; Tarlet, G.; Benderitter, M.; Hoodless, P.; François, A.; Milliat, F. The TG-interacting factor TGIF1 regulates stress-induced proinflammatory phenotype of endothelial cells. J. Biol. Chem. 2012, 287, 38913–38921. [Google Scholar] [CrossRef]
  34. Malik, I.A.; Moriconi, F.; Sheikh, N.; Naz, N.; Khan, S.; Dudas, J.; Mansuroglu, T.; Hess, C.F.; Rave-Fränk, M.; Christiansen, H.; et al. Single-dose gamma-irradiation induces upregulation of chemokine gene expression and recruitment of granulocytes into the portal area but not into other regions of rat hepatic tissue. Am. J. Pathol. 2010, 176, 1801–1815. [Google Scholar] [CrossRef] [PubMed]
  35. Han, K.H.; Ryu, J.W.; Lim, K.E.; Lee, S.H.; Kim, Y.; Hwang, C.S.; Choi, J.Y.; Han, K.O. Vascular expression of the chemokine CX3CL1 promotes osteoclast recruitment and exacerbates bone resorption in an irradiated murine model. Bone 2014, 61, 91–101. [Google Scholar] [CrossRef]
  36. Kyrkanides, S.; Moore, A.H.; Olschowka, J.A.; Daeschner, J.C.; Williams, J.P.; Hansen, J.T.; Kerry O’Banion, M. Cyclooxygenase-2 modulates brain inflammation-related gene expression in central nervous system radiation injury. Brain Res. Mol. Brain Res. 2002, 104, 159–169. [Google Scholar] [CrossRef] [PubMed]
  37. Bucci, B.; Misiti, S.; Cannizzaro, A.; Marchese, R.; Raza, G.H.; Miceli, R.; Stigliano, A.; Amendola, D.; Monti, O.; Biancolella, M.; et al. Fractionated ionizing radiation exposure induces apoptosis through caspase-3 activation and reactive oxygen species generation. Anticancer Res. 2006, 26, 4549–4557. [Google Scholar]
  38. Chang, J.T.; Chan, S.H.; Lin, C.Y.; Lin, T.Y.; Wang, H.M.; Liao, C.T.; Wang, T.H.; Lee, L.Y.; Cheng, A.J. Differentially expressed genes in radioresistant nasopharyngeal cancer cells: GP96 and GDF15. Mol. Cancer Ther. 2007, 6, 2271–2279. [Google Scholar] [CrossRef]
  39. Zhang, B.; Wang, Y.; Pang, X.; Su, Y.; Ai, G.; Wang, T. ER stress induced by ionising radiation in IEC-6 cells. Int. J. Radiat. Biol. 2010, 86, 429–435. [Google Scholar] [CrossRef] [PubMed]
  40. Ivanov, V.N.; Ghandhi, S.A.; Zhou, H.; Huang, S.X.; Chai, Y.; Amundson, S.A.; Hei, T.K. Radiation response and regulation of apoptosis induced by a combination of TRAIL and CHX in cells lacking mitochondrial DNA: A role for NF-κB–STAT3-directed gene expression. Exp. Cell Res. 2011, 317, 1548–1566. [Google Scholar] [CrossRef] [PubMed]
  41. El-Saghire, H.; Vandevoorde, C.; Ost, P.; Monsieurs, P.; Michaux, A.; de Meerleer, G.; Baatout, S.; Thierens, H. Intensity modulated radiotherapy induces pro-inflammatory and pro-survival responses in prostate cancer patients. Int. J. Oncol. 2014, 44, 1073–1083. [Google Scholar] [Green Version]
  42. Hwang, S.Y.; Jung, J.S.; Kim, T.H.; Lim, S.J.; Oh, E.S.; Kim, J.Y.; Ji, K.A.; Joe, E.H.; Cho, K.H.; Han, I.O. Ionizing radiation induces astrocyte gliosis through microglia activation. Neurobiol. Dis. 2006, 21, 457–467. [Google Scholar] [CrossRef] [PubMed]
  43. Han, S.K.; Song, J.Y.; Yun, Y.S.; Yi, S.Y. Gamma irradiation-reduced IFN-γ expression, STAT1 signals, and cell-mediated immunity. J. Biochem. Mol. Biol. 2002, 35, 583–589. [Google Scholar] [CrossRef]
  44. Datta, K.; Hyduke, D.R.; Suman, S.; Moon, B.H.; Johnson, M.D.; Fornace, A.J. Exposure to ionizing radiation induced persistent gene expression changes in mouse mammary gland. Radiat. Oncol. 2012, 7, 205. [Google Scholar] [CrossRef] [PubMed]
  45. Fukuda, K.; Sakakura, C.; Miyagawa, K.; Kuriu, Y.; Kin, S.; Nakase, Y.; Hagiwara, A.; Mitsufuji, S.; Okazaki, Y.; Hayashizaki, Y.; et al. Differential gene expression profiles of radioresistant oesophageal cancer cell lines established by continuous fractionated irradiation. Br. J. Cancer 2004, 91, 1543–1550. [Google Scholar] [CrossRef] [PubMed]
  46. El-Saghire, H.; Michaux, A.; Thierens, H.; Baatout, S. Low doses of ionizing radiation induce immune-stimulatory responses in isolated human primary monocytes. Int. J. Mol. Med. 2013, 32, 1407–1414. [Google Scholar] [PubMed]
  47. Sawajiri, M.; Nomura, Y.; Banik, S.; Nishikiori, R.; Sonoda, Y.; Tanimoto, K. Irradiation effect on osteoclastogenesis stimulated by breast cancer cells. Health Phys. 2011, 101, 259–264. [Google Scholar] [CrossRef] [PubMed]
  48. Yang, B.; Tang, Q.; Post, J.; Zhou, H.; Huang, X.B.; Zhang, X.D.; Wang, Q.; Sun, Y.M.; Fan, F.Y. Effect of radiation on the Notch signaling pathway in osteoblasts. Int. J. Mol. Med. 2013, 31, 698–706. [Google Scholar] [PubMed]
  49. Sung, H.Y.; Wu, H.G.; Ahn, J.H.; Park, W.Y. Dcr3 inhibit p53-dependent apoptosis in γ-irradiated lung cancer cells. Int. J. Radiat. Biol. 2010, 86, 780–790. [Google Scholar] [CrossRef]
  50. Aravindan, N.; Thomas, C.R.; Aravindan, S.; Mohan, A.S.; Veeraraghavan, J.; Natarajan, M. Irreversible EGFR inhibitor EKB-569 targets low-LET γ-radiation-triggered rel orchestration and potentiates cell death in squamous cell carcinoma. PLoS One 2011, 6, e29705. [Google Scholar] [CrossRef] [PubMed]
  51. Aravindan, S.; Natarajan, M.; Herman, T.S.; Awasthi, V.; Aravindan, N. Molecular basis of “hypoxic” breast cancer cell radio-sensitization: Phytochemicals converge on radiation induced Rel signaling. Radiat. Oncol. 2013, 8, 46. [Google Scholar] [CrossRef] [PubMed]
  52. Aravindan, S.; Natarajan, M.; Ramraj, S.K.; Pandian, V.; Khan, F.H.; Herman, T.S.; Aravindan, N. Abscopal effect of low-LET γ-radiation mediated through Rel protein signal transduction in a mouse model of nontargeted radiation response. Cancer Gene Ther. 2014, 21, 54–59. [Google Scholar] [CrossRef] [PubMed]
  53. Fu, Y.; Wang, Y.; Du, L.; Pandian, V.; Khan, F.H.; Herman, T.S.; Aravindan, N. Resveratrol inhibits ionising irradiation-induced inflammation in MSCs by activating SIRT1 and limiting NLRP-3 inflammasome activation. Int. J. Mol. Sci. 2013, 14, 14105–14118. [Google Scholar] [CrossRef]
  54. Gridley, D.S.; Pecaut, M.; Rizvi, A.; Coutrakon, G.B.; Luo-Owen, X.; Makinde, A.Y.; Slater, J.M. Low-dose, low-dose-rate proton radiation modulates CD4+ T cell gene expression. Int. J. Radiat. Biol. 2009, 85, 250–261. [Google Scholar] [CrossRef]
  55. Lindgren, T.; Stigbrand, T.; Riklund, K.; Johansson, L.; Eriksson, D. Gene expression profiling in MOLT-4 cells during gamma-radiation-induced apoptosis. Tumour. Biol. 2012, 33, 689–700. [Google Scholar] [CrossRef] [PubMed]
  56. Gridley, D.S.; Slater, J.M.; Luo-Owen, X.; Rizvi, A.; Chapes, S.K.; Stodieck, L.S.; Ferguson, V.L.; Pecaut, M.J. Spaceflight effects on Tlymphocyte distribution, function and gene expression. J. Appl. Physiol. 2009, 106, 194–202. [Google Scholar] [CrossRef]
  57. Bo, H.; Ghazizadeh, M.; Shimizu, H.; Kurihara, Y.; Egawa, S.; Moriyama, Y.; Tajiri, T.; Kawanami, O. Effect of ionizing irradiation on human esophageal cancer cell lines by cDNA microarray gene expression analysis. J. Nippon Med. Sch. 2004, 71, 172–180. [Google Scholar] [CrossRef] [PubMed]
  58. Sanzari, J.K.; Wambi, C.; Lewis-Wambi, J.S.; Kennedy, A.R. Antioxidant dietary supplementation in mice exposed to proton radiation attenuates expression of programmed cell death-associated genes. Radiat. Res. 2011, 175, 650–656. [Google Scholar] [CrossRef] [PubMed]
  59. Veeraraghavan, J.; Natarajan, M.; Aravindan, S.; Herman, T.S.; Aravindan, N. Radiation-triggered tumor necrosis factor (TNF) α-NFκB cross-signaling favors survival advantage in human neuroblastoma cells. J. Biol. Chem. 2011, 286, 21588–21600. [Google Scholar] [CrossRef] [PubMed]
  60. Sugihara, T.; Murano, H.; Nakamura, M.; Ichinohe, K.; Tanaka, K. Activation of interferon-stimulated genes by γ-ray irradiation independently of the ataxia telangiectasia mutated-p53 pathway. Mol. Cancer Res. 2011, 9, 476–484. [Google Scholar] [CrossRef] [PubMed]
  61. Weston, V.J.; Austen, B.; Wei, W.; Marston, E.; Alvi, A.; Lawson, S.; Darbyshire, P.J.; Griffiths, M.; Hill, F.; Mann, J.R.; et al. Apoptotic resistance to ionizing radiation in pediatric B-precursor acute lymphoblastic leukemia frequently involves increased NF-κB survival pathway signaling. Blood 2004, 104, 1465–1473. [Google Scholar] [CrossRef] [PubMed]
  62. Paul, S.; Amundson, S.A. Development of gene expression signatures for practical radiation biodosimetry. Int. J. Radiat. Oncol. Biol. Phys. 2008, 71, 1236–1244. [Google Scholar] [CrossRef]
  63. Dressman, H.K.; Muramoto, G.G.; Chao, N.J.; Meadows, S.; Marshall, D.; Ginsburg, G.S.; Nevins, J.R.; Chute, J.P. Gene expression signatures that predict radiation exposure in mice and humans. PLoS Med. 2007, 4, e106. [Google Scholar] [CrossRef]
  64. Pogosova-Agadjanyan, E.L.; Fan, W.; Georges, G.E.; Schwartz, J.L.; Kepler, C.M.; Lee, H.; Suchanek, A.L.; Cronk, M.R.; Brumbaugh, A.; Engel, J.H.; et al. Identification of radiation-induced expression changes in nonimmortalized human T cells. Radiat. Res. 2011, 175, 172–184. [Google Scholar] [CrossRef] [PubMed]
  65. Li, S.E.; Guo, F.; Wang, P.; Han, L.; Wang, X.A.; Li, J.; Guo, Y.; LÜ, Y.M. X-Ray-induced expression changes of TNFSF4 gene in human peripheral blood. Biomed. Environ. Sci. 2014, 27, 729–732. [Google Scholar] [PubMed]
  66. Tao, L.L.; Shi, S.J.; Chen, L.B.; Huang, G.C. Expression of monocyte chemotactic protein-1/CCL2 in gastric cancer and its relationship with tumor hypoxia. World J. Gastroenterol. 2014, 20, 4421–4427. [Google Scholar] [CrossRef] [PubMed]
  67. Affò, S.; Sancho-Bru, P. CCL2: A link between hepatic inflammation, fibrosis and angiogenesis? Gut 2014. [Google Scholar] [CrossRef]
  68. Lee, W.H.; Sonntag, W.E.; Mitschelen, M.; Yan, H.; Lee, Y.W. Irradiation induces regionally specific alterations in proinflammatory environments in rat brain. Int. J. Radiat. Biol. 2010, 86, 132–144. [Google Scholar] [CrossRef] [PubMed]
  69. Kalm, M.; Roughton, K.; Blomgren, K. Lipopolysaccharide sensitized male and female juvenile brains to ionizing radiation. Cell Death Dis. 2013, 4, e962. [Google Scholar] [CrossRef]
  70. Nalla, A.K.; Gogineni, V. R.; Gupta, R.; Dinh, D.H.; Rao, J.S. Suppression of uPA and uPAR blocks radiation-induced MCP-1 mediated recruitment of endothelial cells in meningioma. Cell Signal. 2011, 23, 1299–1310. [Google Scholar] [CrossRef] [PubMed]
  71. Riquier, H.; Wera, A.C.; Heuskin, A.C.; Feron, O.; Lucas, S.; Michiels, C. Comparison of X-ray and α particle effects on a human cancer and endothelial cells: Survival curves and gene expression profiles. Radiother. Oncol. 2013, 106, 397–403. [Google Scholar] [CrossRef] [PubMed]
  72. Zhang, P.; Wang, P.; Han, L.; Wang, X.A.; Lv, Y.M. Changes of MN23-H1 gene expression in human peripheral blood cell after X-ray irradiation. Chin. J. Radiol. Med. Prot. 2010, 30, 161–164. [Google Scholar] [CrossRef]
  73. MITOMAP. Available online: http://www.mitomap.org (accessed on 23 October 2014).

