Genistein Induces Increase in Fluid pH, Na+ and HCO3− Concentration, SLC26A6 and SLC4A4 (NBCe1)-B Expression in the Uteri of Ovariectomized Rats

Abstract
:1. Introduction
2. Results and Discussion
2.1. Results
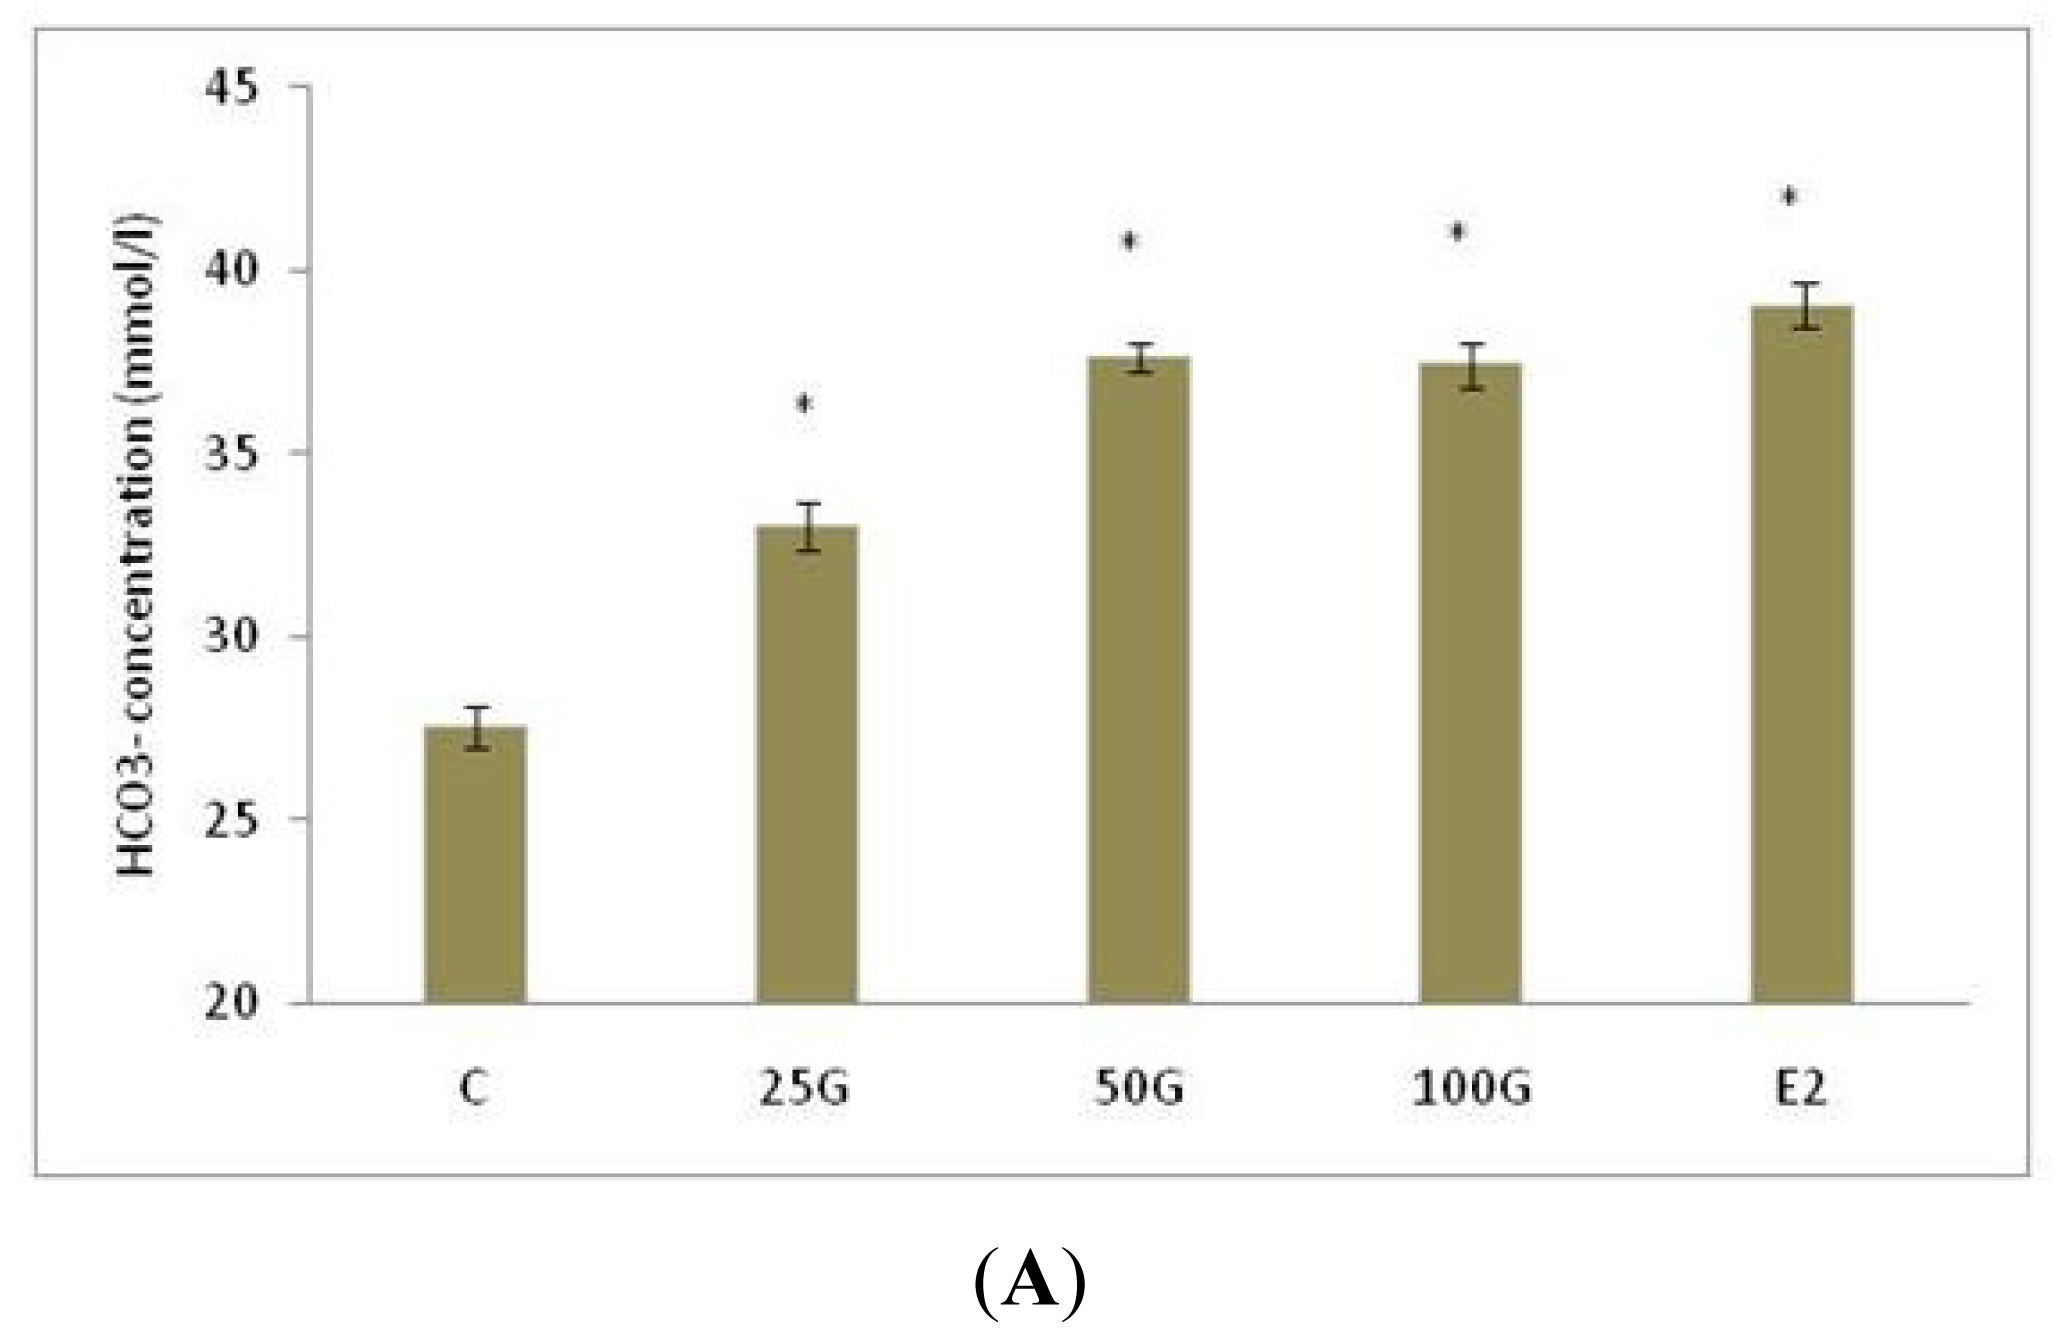
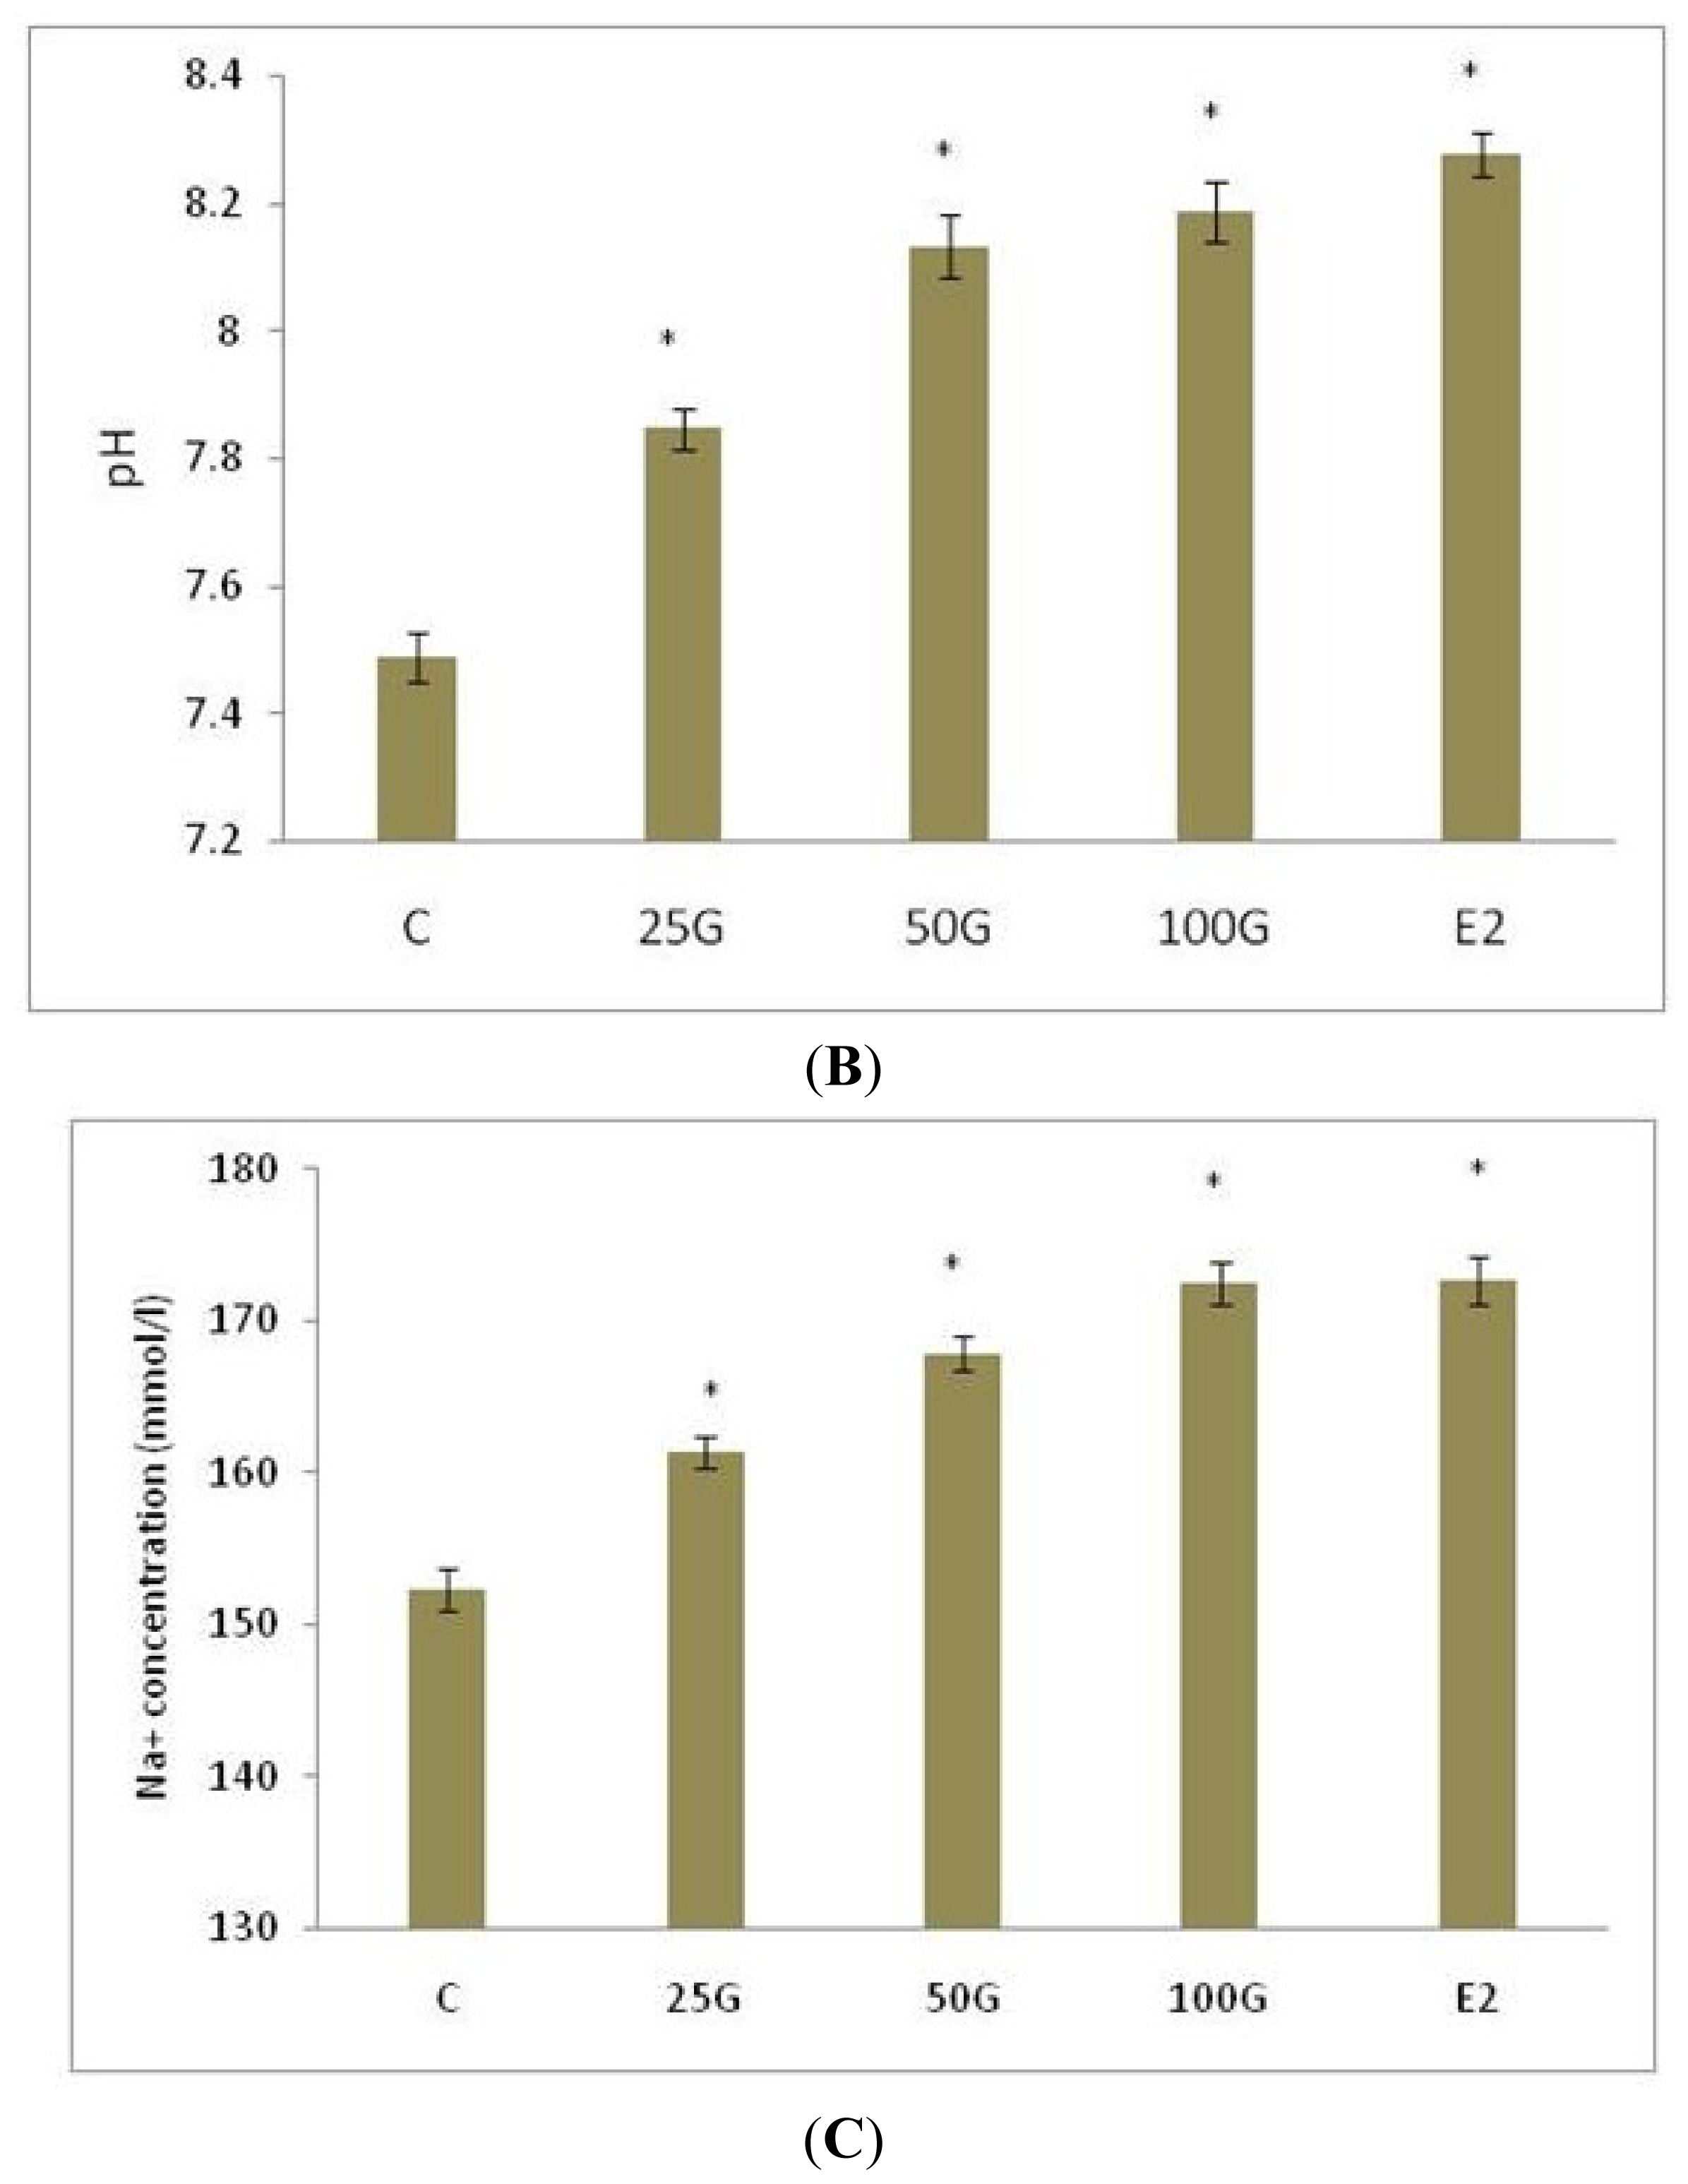
2.1.1. Uterine Fluid pH, Na+ and HCO3− Concentration Following Genistein Treatment
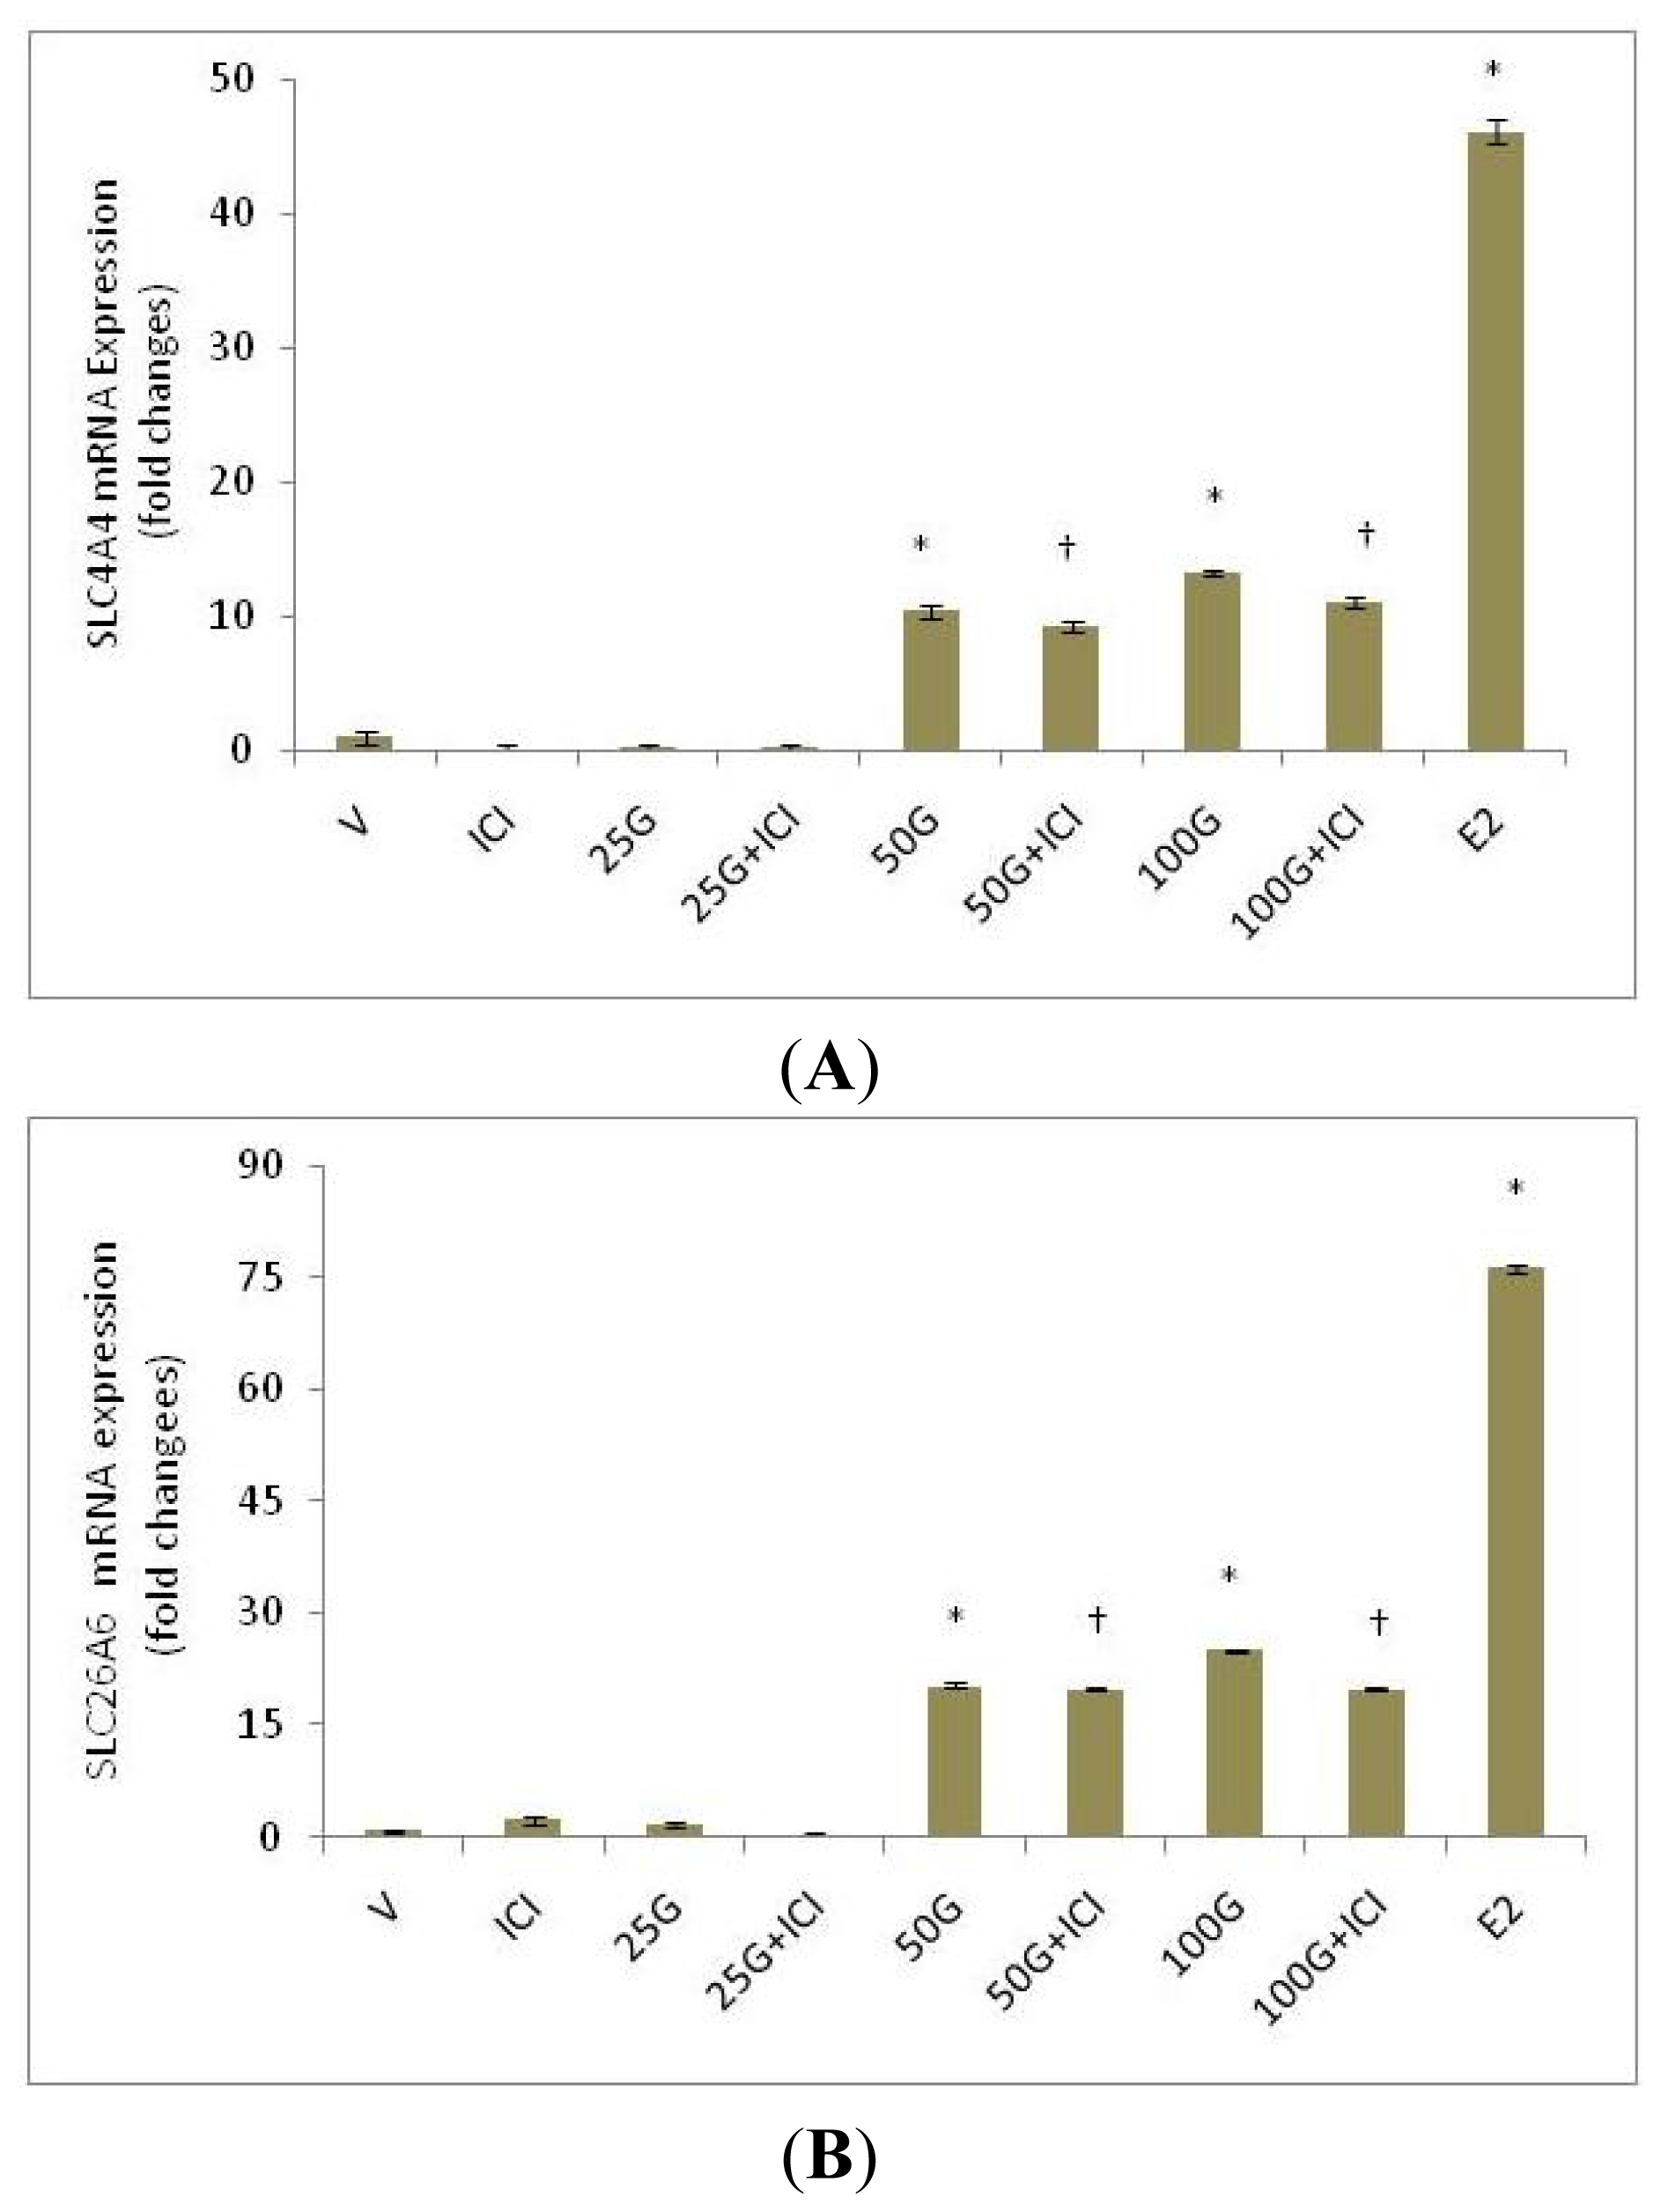
2.1.2. SLC26A6 and SLC4A4 mRNA Expression
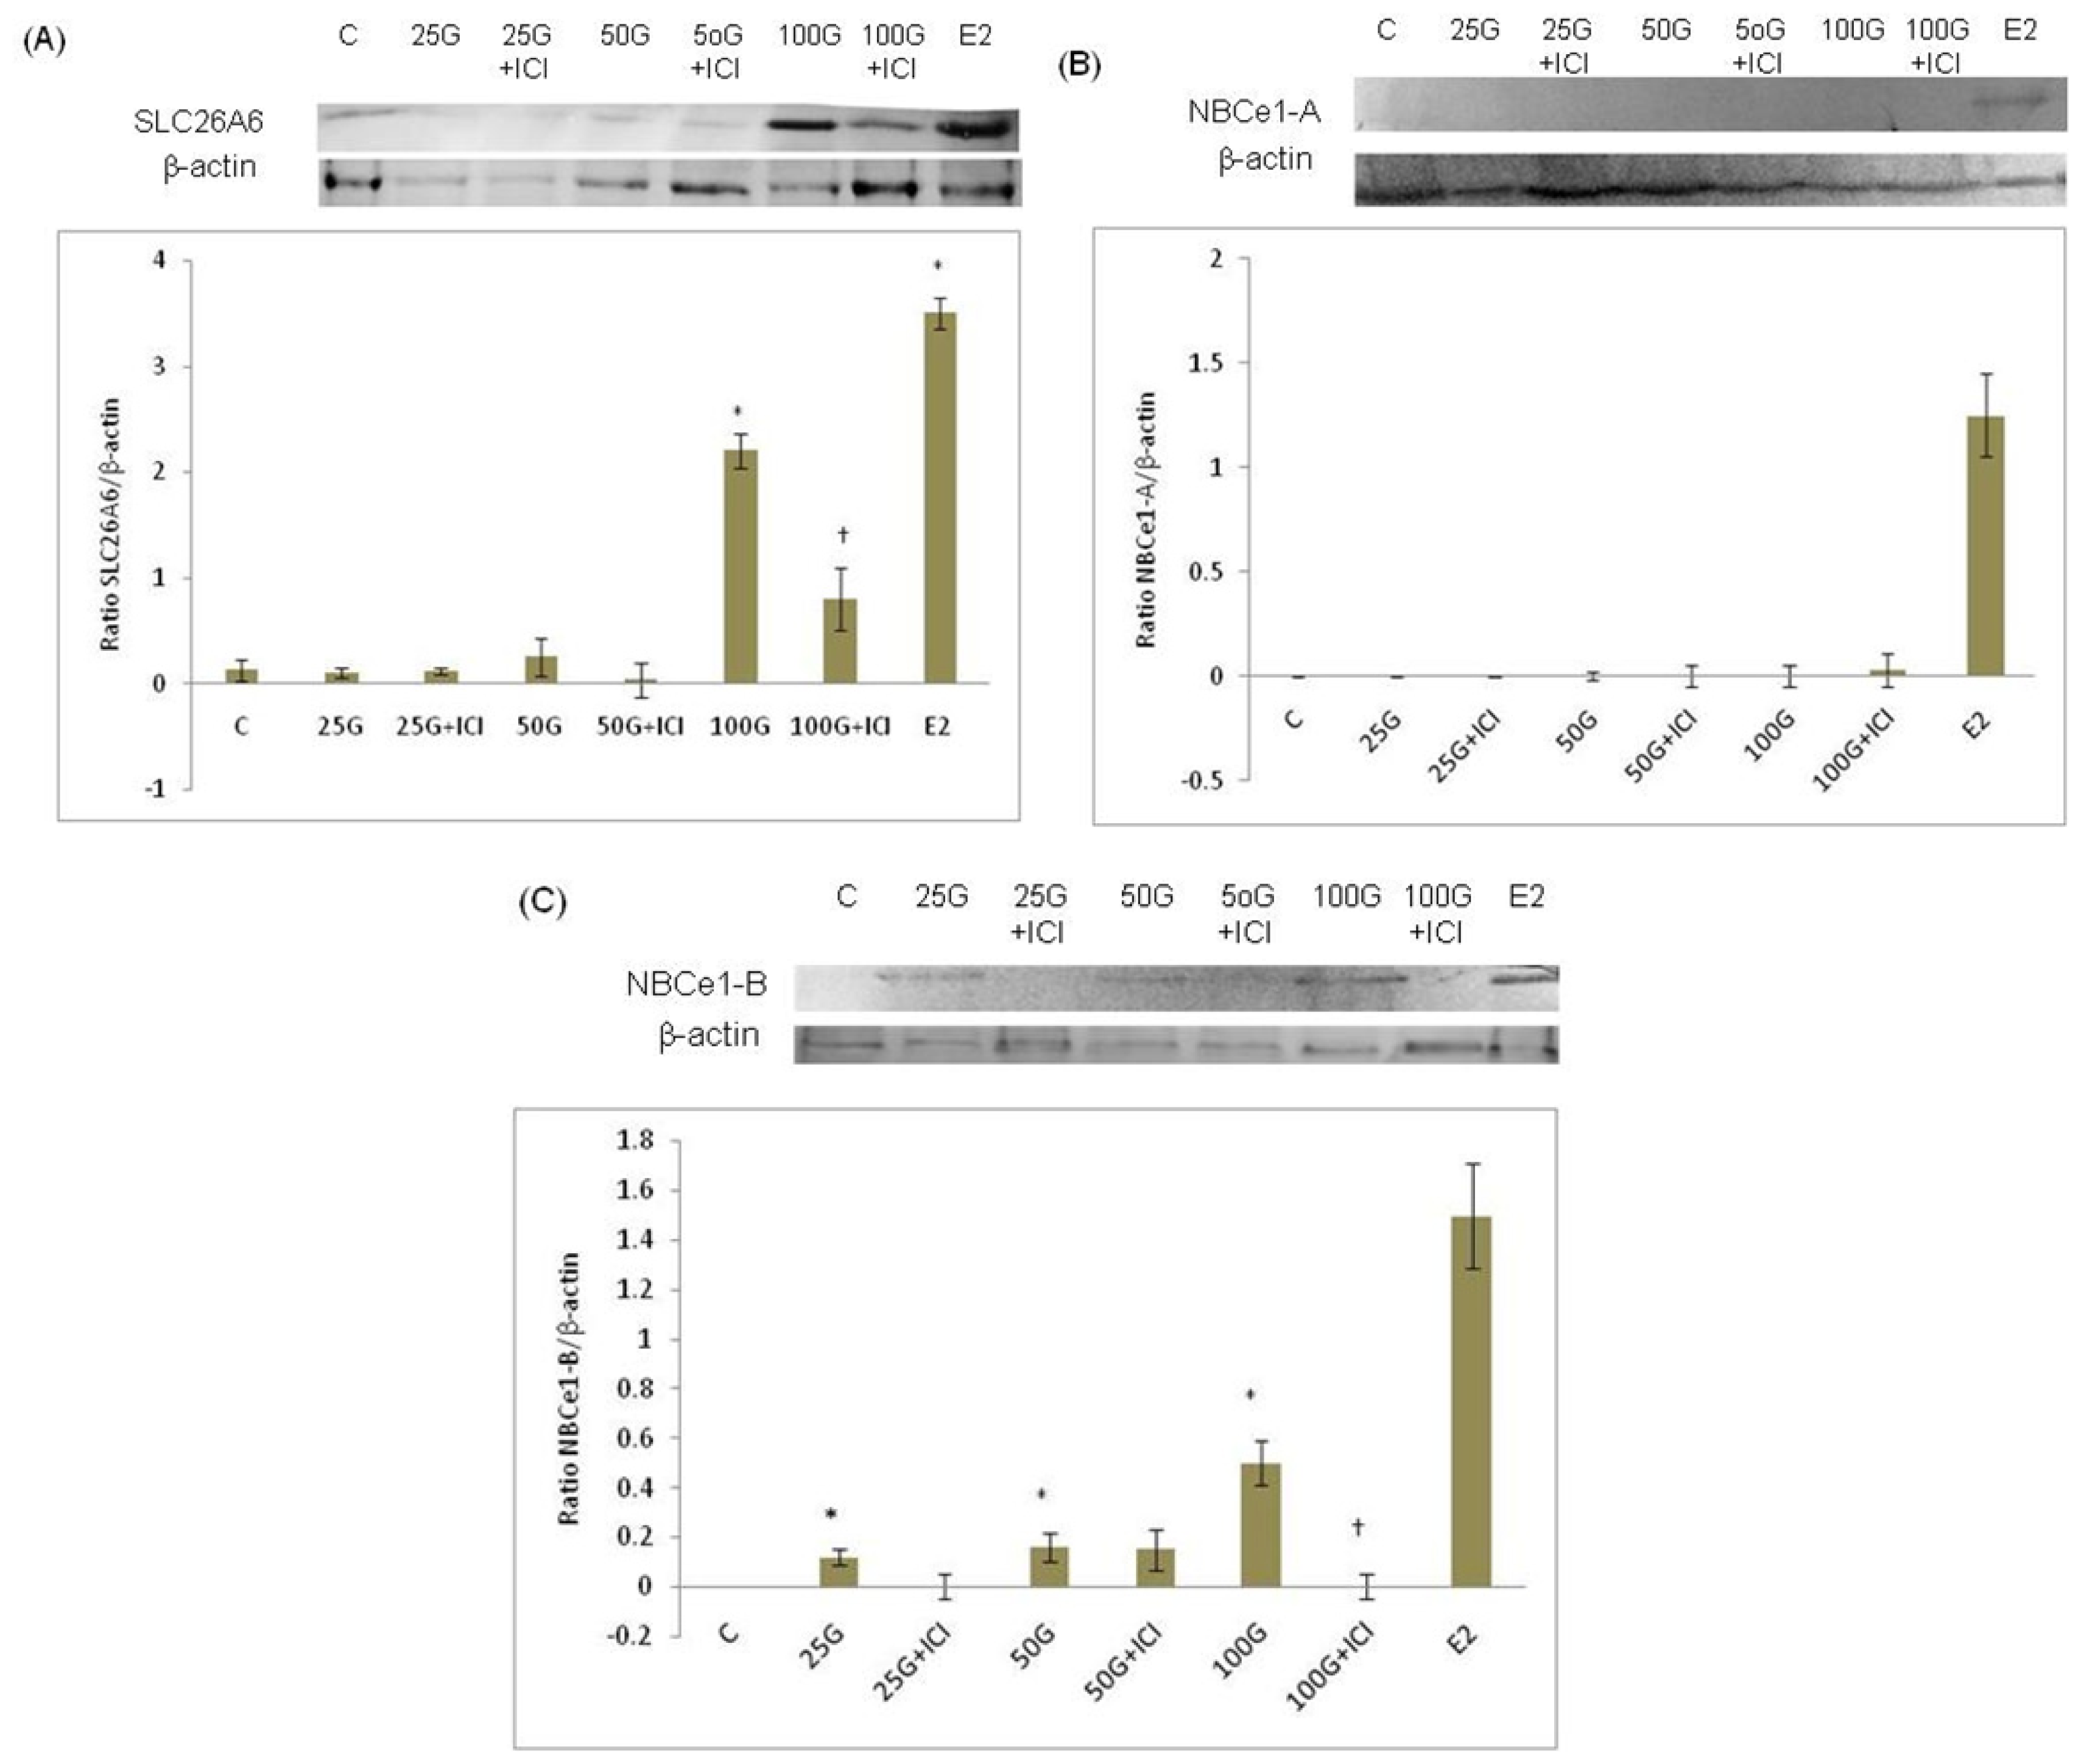
2.1.3. SLC26A6 and SLC4A4 (NBCe1-A and NBCe1-B) Protein Expression
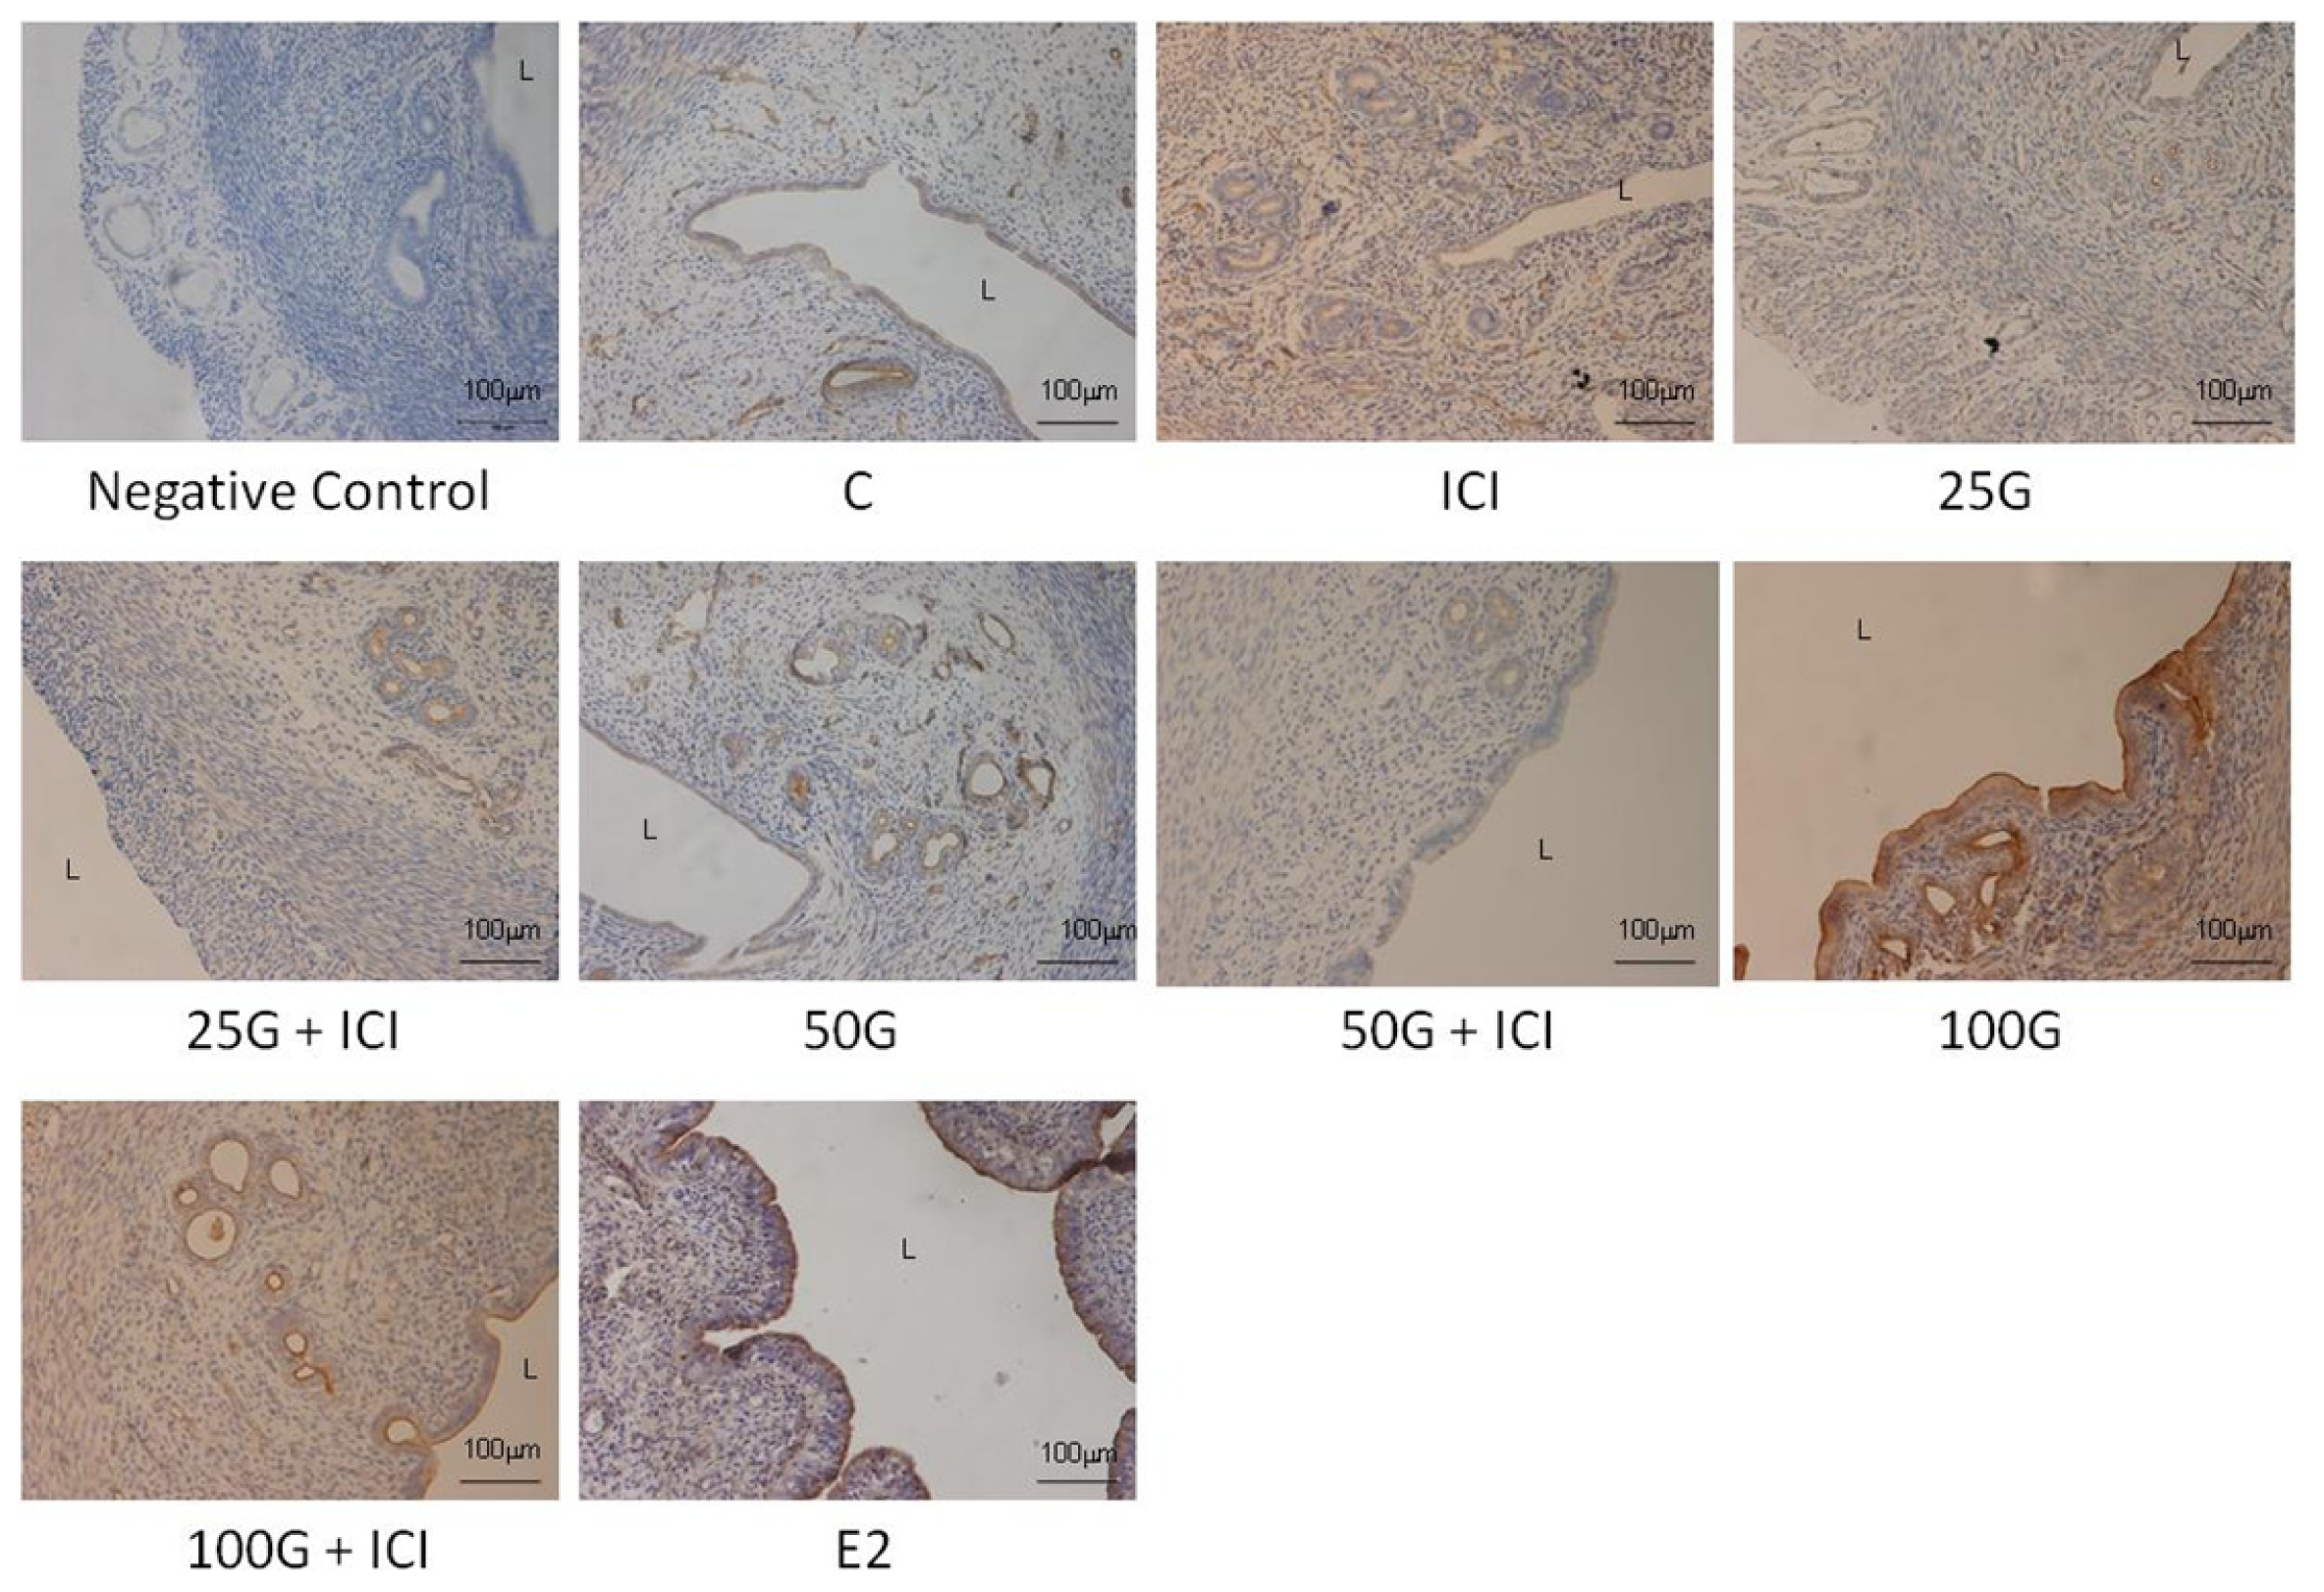
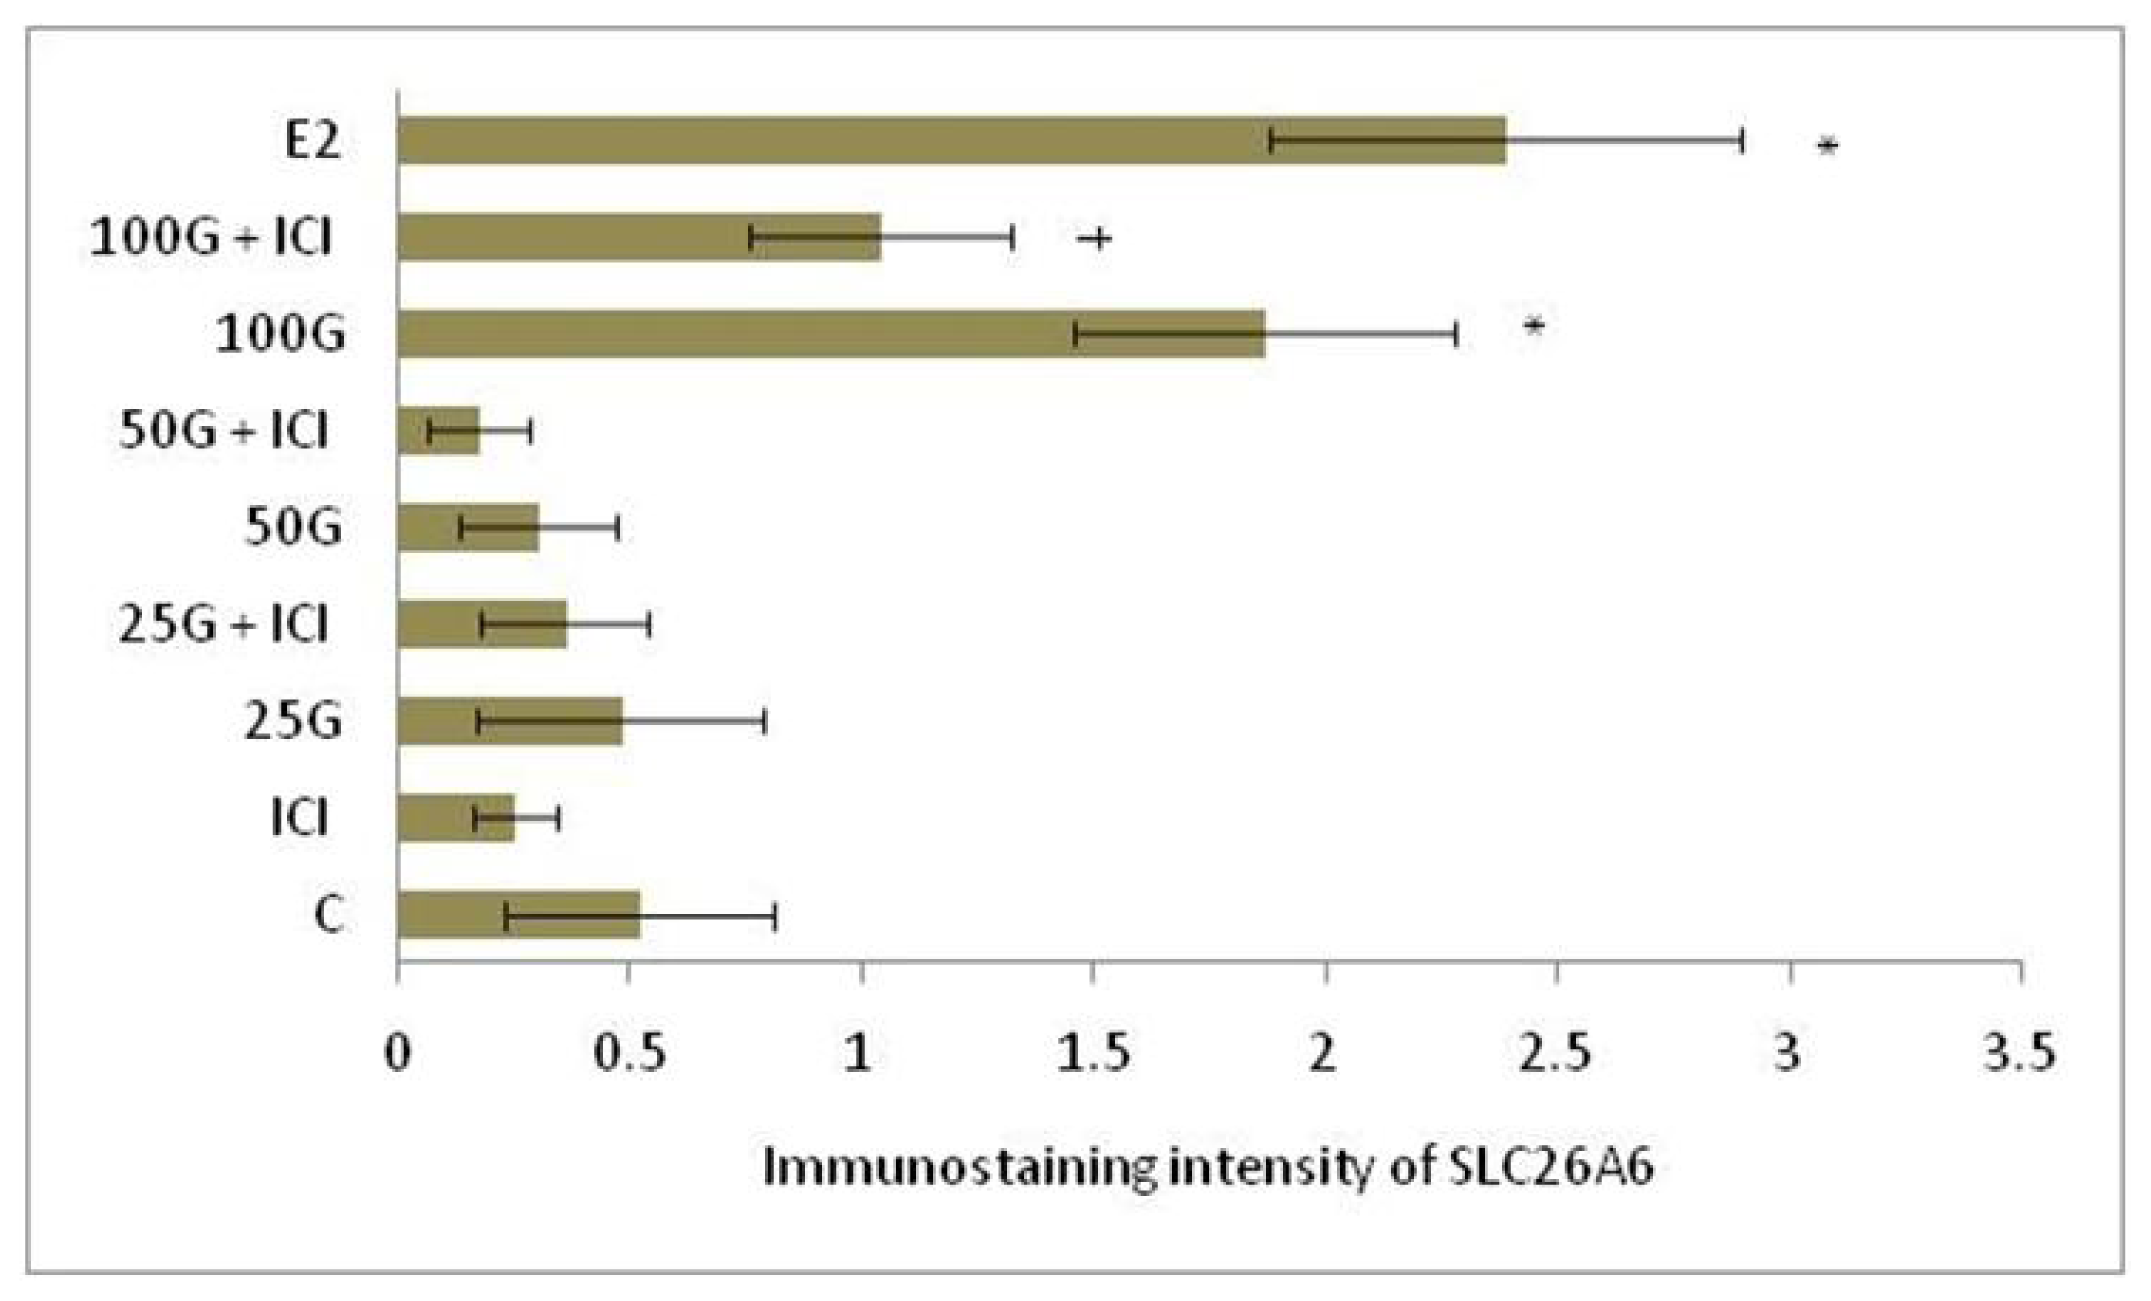
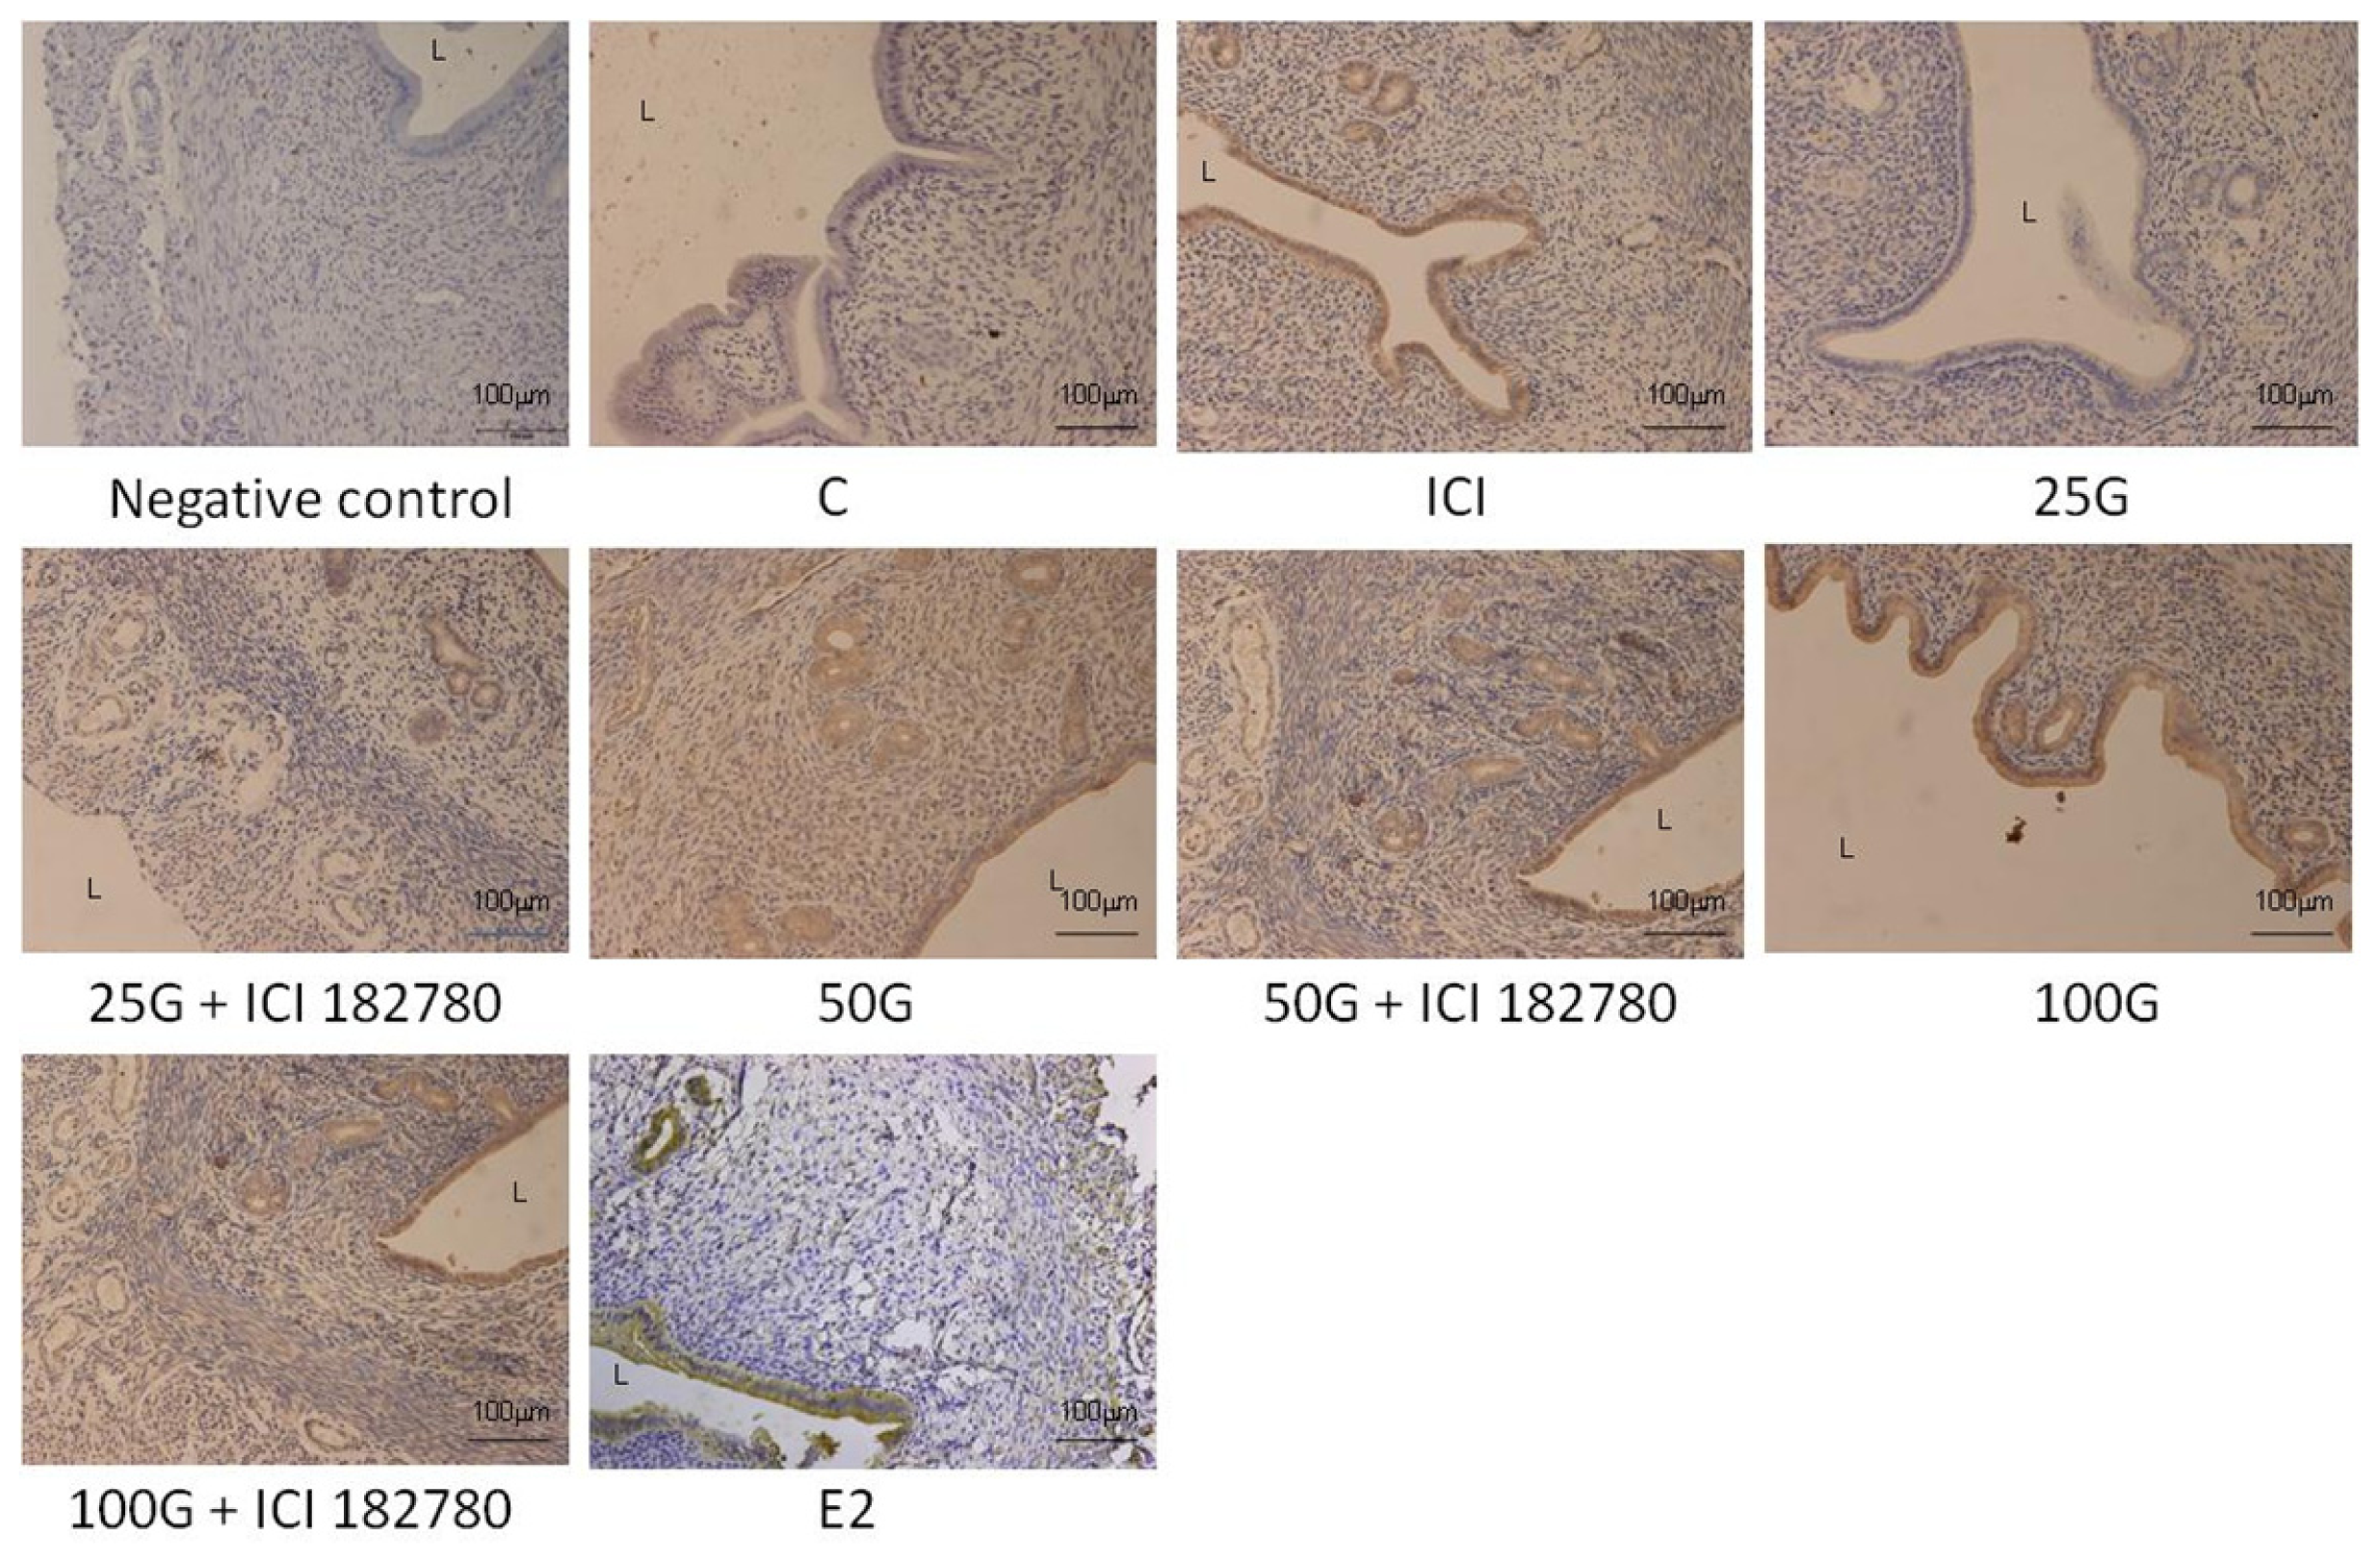
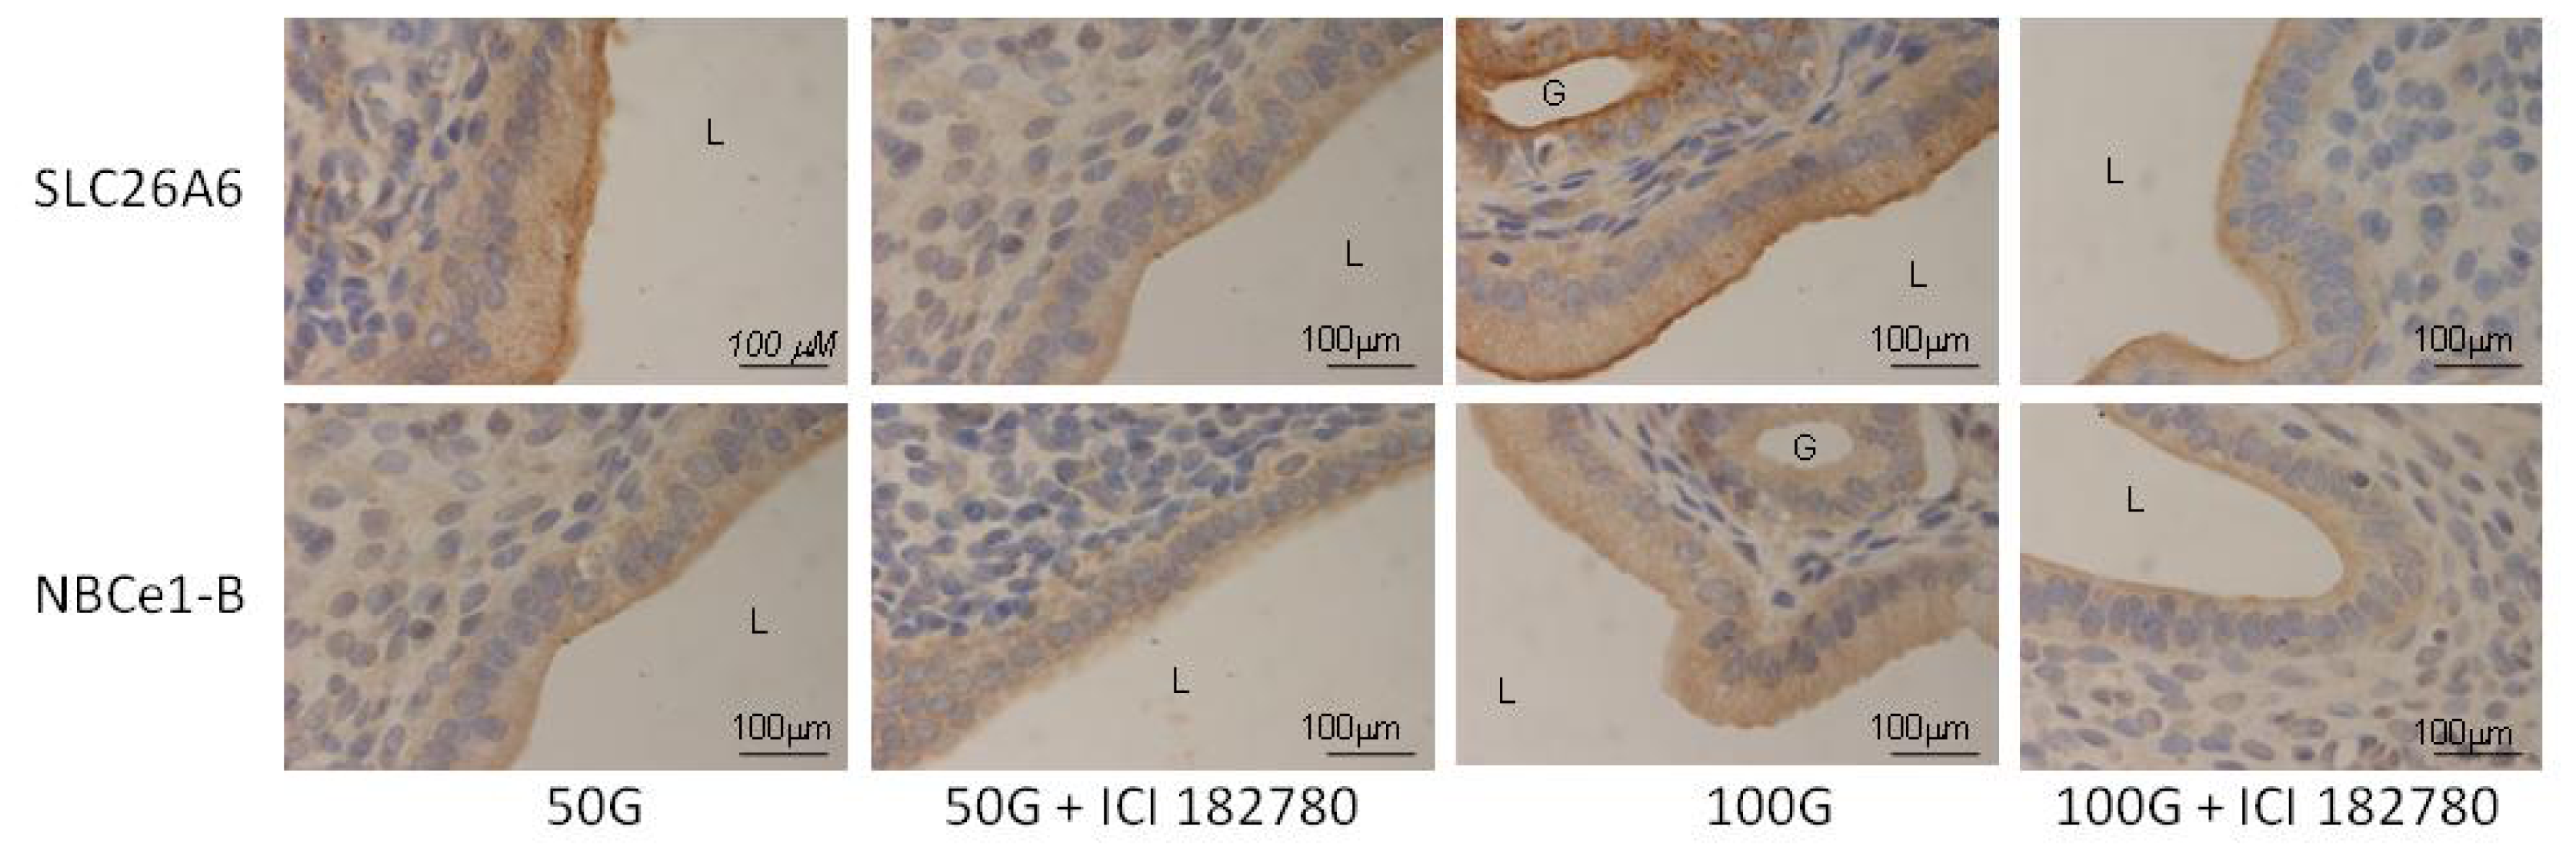
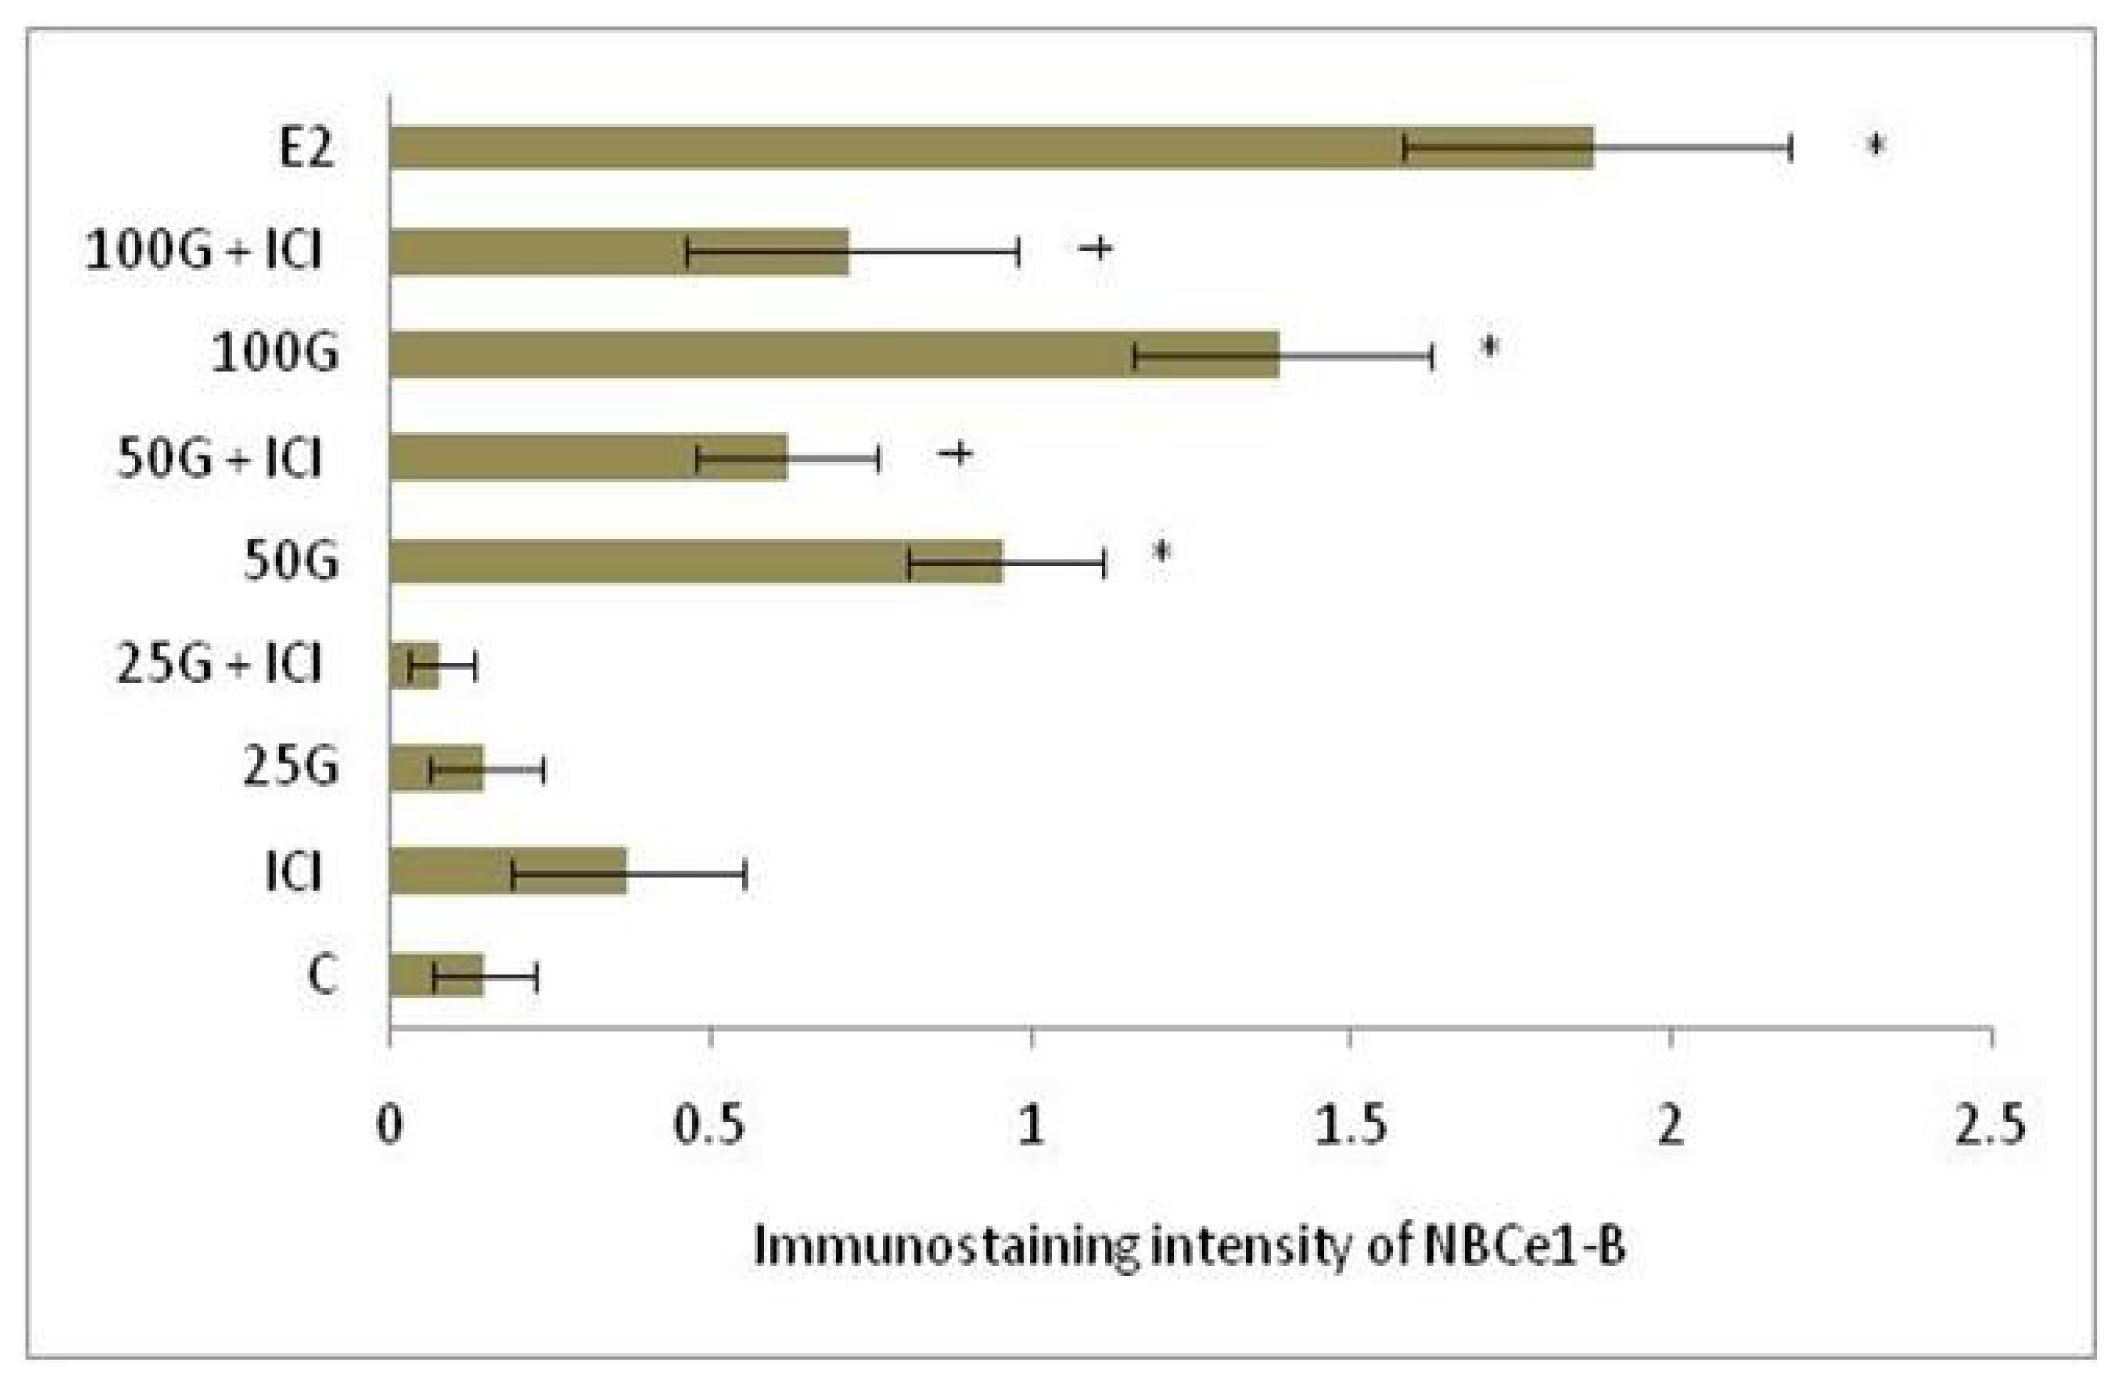
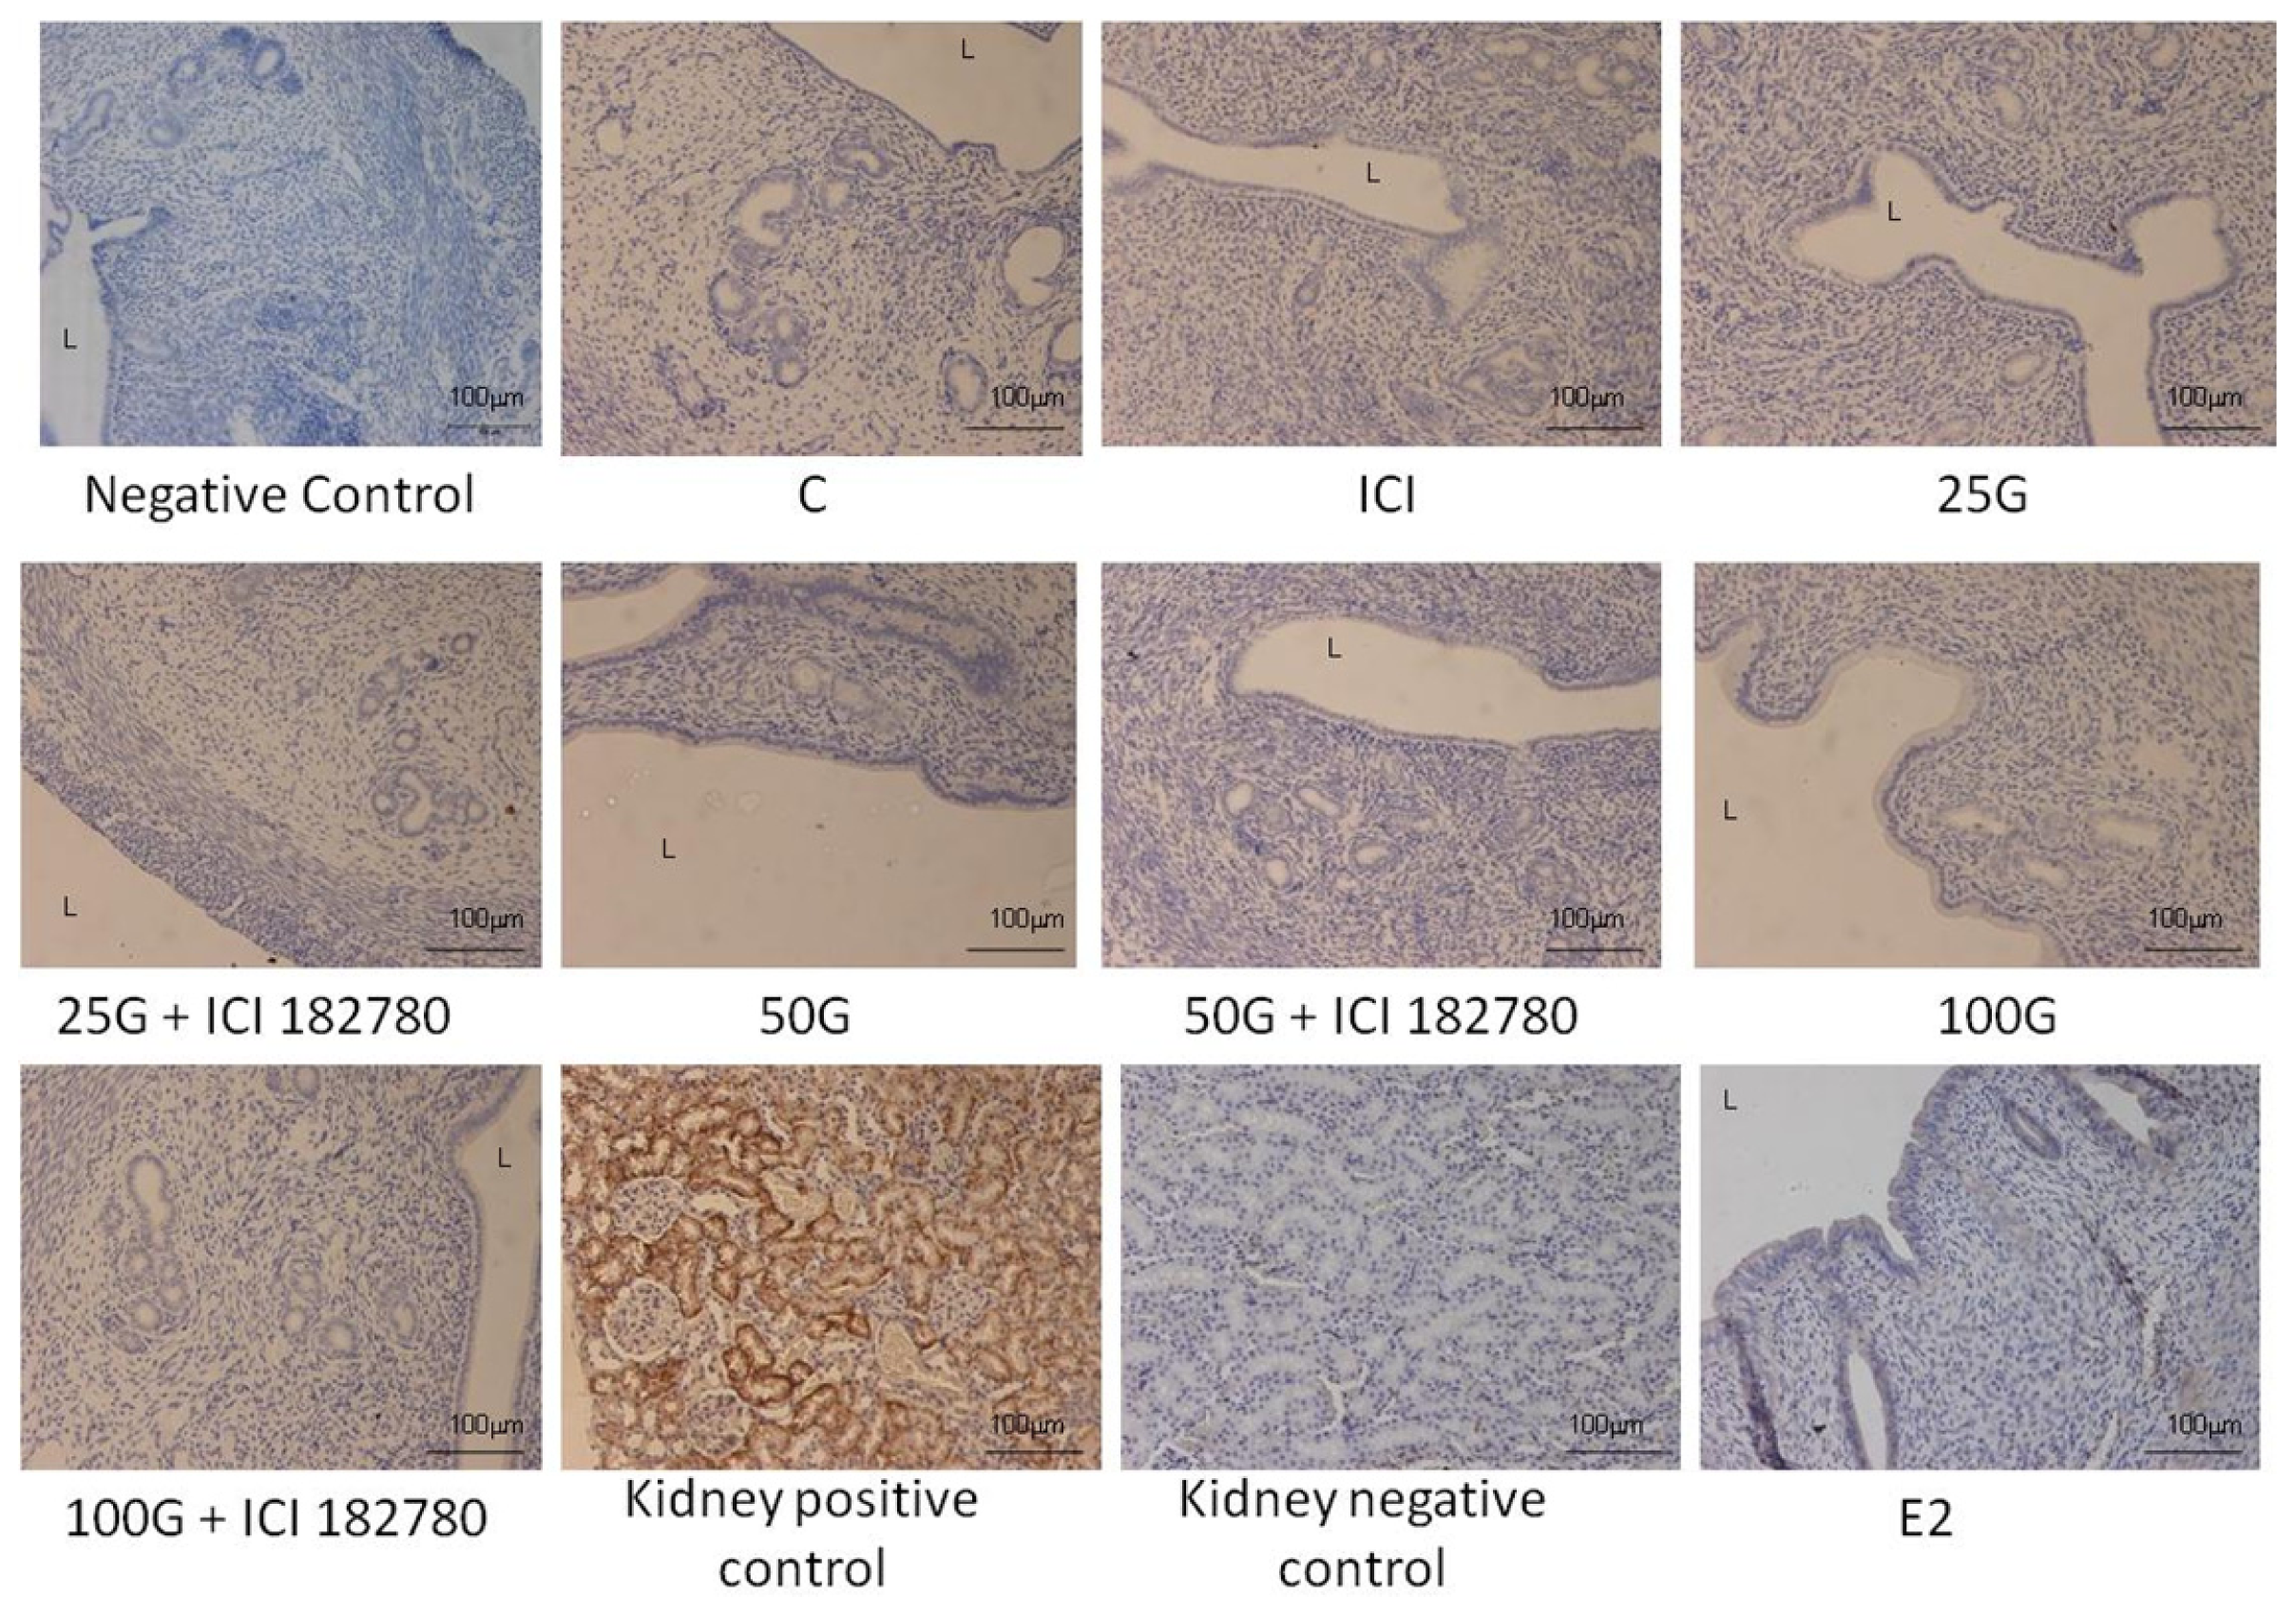
2.1.4. SLC26A6, NBCe1-A and NBCe1-B Protein Distribution
2.2. Discussion
3. Experimental Section
3.1. Animal Preparation and Hormone Treatment
3.2. In Vivo Uterine Perfusion, pH and Electrolytes Concentration Analyses
3.3. mRNA Quantification by Real Time PCR (qPCR)
3.4. SLC26A6, NBCe1-A and NBCe1-B Protein Expression Analysis by Western Blotting
3.5. Detection of SLC26A6, NBCe1-A and NBCe1-B Distribution by Immuno-Histochemistry (IHC)
3.6. Quantifying Staining Intensity by NIS-Element AR Program
3.7. Statistical Analysis
4. Conclusions
Acknowledgments
Conflicts of Interest
References
- Al-Nakkash, L.; Clarke, L.L.; Rottinghaus, G.E.; Chen, Y.J.; Cooper, K.; Rubin, L.J. Dietary genistein stimulates anion secretion across female murine intestine. J. Nutr 2006, 136, 2785–2790. [Google Scholar]
- Illek, B.; Yankaskas, J.R.; Machen, T.E. cAMP and genistein stimulate HCO3− conductance through CFTR in human airway epithelia. Am. J. Physiol 1997, 272, L752–L761. [Google Scholar]
- Tuo, B.; Wen, G.; Seidler, U. Differential activation of the HCO3− conductance through the cystic fibrosis transmembrane conductance regulator anion channel by genistein and forskolin in murine duodenum. Br. J. Pharmacol 2009, 158, 1313–1321. [Google Scholar]
- Chao, P.-C.; Hamilton, K.L. Genistein stimulates electrogenic Cl− secretion via phosphodiesterase modulation in the mouse jejunum. Am. J. Physiol. Cell Physiol 2009, 297, C688–C698. [Google Scholar]
- Leung, G.P.H.; Wong, P.Y.D. Activation of cystic fibrosis transmembrane conductance regulator in rat epididymal epithelium by genistein. Biol. Reprod 2000, 62, 143–149. [Google Scholar]
- Abdulnour-Nakhoul, S.; Nakhoul, H.N.; Kalliny, M.I.; Gyftopoulos, A.; Rabon, E.; Doetjes, R.; Brown, K.; Nakhoul, N.L. Ion transport mechanisms linked to bicarbonate secretion in the esophageal submucosal glands. Am. J. Physiol. Regul. Integr. Comp. Physiol 2011, 301, R83–R96. [Google Scholar]
- He, Q.; Chen, H.; Wong, C.H.; Tsang, L.L.; Chan, H.C. Regulatory mechanism underlying cyclic changes in mouse uterine bicarbonate secretion: Role of estrogen. Reproduction 2010, 140, 903–910. [Google Scholar]
- Gholami, K.; Muniandy, S.; Salleh, N. In vivo functional study on the involvement of CFTR, SLC26A6, NHE-1 and CA isoenzymes II and XII in uterine fluid pH, volume and electrolyte regulation in rats under different sex-steroid influence. Int. J. Med. Sci 2013, 5, 1121–1134. [Google Scholar]
- Vincourt, J.B.; Jullien, D.; Kossida, S.; Amalric, F.; Girard, J.P. Molecular cloning of SLC26A7, a novel member of the SLC26 sulfate/anion transporter family, from high endothelial venules and kidney. Genomics 2002, 79, 249–256. [Google Scholar]
- Lohi, H.; Kujala, M.; Kerkelä, E.; Saarialho-Kere, U.; Kestilä, M.; Kere, J. Mapping of five new putative anion transporter genes in human and characterization of SLC26A6, a candidate gene for pancreatic anion exchanger. Genomics 2000, 70, 102–112. [Google Scholar]
- Chernova, M.N.; Jiang, L.; Friedman, D.J.; Darman, R.B.; Lohi, H.; Kere, J.; Vandorpe, D.H.; Alper, S.L. Functional comparison of mouse slc26a6 anion exchanger with human SLC26A6 polypeptide variants: Differences in anion selectivity, regulation, and electrogenicity. J. Biol. Chem 2005, 280, 8564–8580. [Google Scholar]
- Xie, Q.; Welch, R.; Mercado, A.; Romero, M.F.; Mount, D.B. Molecular characterization of the murine Slc26a6 anion exchanger: Functional comparison with Slc26a1. Am. J. Physiol. Ren. Physiol 2002, 283, F826–F838. [Google Scholar]
- Petrovic, S.; Ma, L.; Wang, Z.; Soleimani, M. Identification of an apical exchanger in rat kidney proximal tubule. Am. J. Physiol. Cell Physiol 2003, 285, C608–C617. [Google Scholar]
- Säfsten, B. Duodenal bicarbonate secretion and mucosal protection. Neurohumoral influence and transport mechanisms. Acta Physiol. Scand. Suppl 1993, 613, 1–43. [Google Scholar]
- Ishiguro, H.; Yamamoto, A.; Nakakuki, M.; Yi, L.; Ishiguro, M.; Yamaguchi, M.; Kondo, S.; Mochimaru, Y. Physiology and pathophysiology of bicarbonate secretion by pancreatic duct epithelium. Nagoya J. Med. Sci 2012, 74, 1–18. [Google Scholar]
- Abuladze, N.; Lee, I.; Newman, D.; Hwang, J.; Boorer, K.; Pushkin, A.; Kurtz, I. Molecular cloning, chromosomal localization, tissue distribution, and functional expression of the human pancreatic sodium bicarbonate cotransporter. J. Biol. Chem 1998, 273, 17689–17695. [Google Scholar]
- Romero, M.F.; Chen, A.P.; Parker, M.D.; Boron, W.F. The SLC4 family of bicarbonate (HCO3−) transporters. Mol. Aspects Med 2013, 34, 159–182. [Google Scholar]
- Shahidullah, M.; To, C.H.; Pelis, R.M.; Delamere, N.A. Studies on bicarbonate transporters and carbonic anhydrase in porcine nonpigmented ciliary epithelium. Investig. Ophthalmol. Vis. Sci 2009, 50, 1791–1800. [Google Scholar]
- Oehlke, O.; Speer, J.M.; Roussa, E. Variants of the electrogenic sodium bicarbonate cotransporter 1 (NBCe1) in mouse hippocampal neurons are regulated by extracellular pH changes: Evidence for a Rab8a-dependent mechanism. Int. J. Biochem. Cell Biol 2013, 45, 1427–1438. [Google Scholar]
- Kurtz, I.; Zhu, Q. Structure, function, and regulation of the SLC4 NBCe1 transporter and its role in causing proximal renal tubular acidosis. Curr. Opin. Nephrol. Hypertens 2013, 22, 572–583. [Google Scholar]
- Yang, D.; Shcheynikov, N.; Zeng, W.; Ohana, E.; So, I.; Ando, H.; Mizutani, A.; Mikoshiba, K.; Muallem, S. IRBIT coordinates epithelial fluid and HCO3− secretion by stimulating the transporters pNBC1 and CFTR in the murine pancreatic duct. J. Clin. Investig 2009, 119, 193–202. [Google Scholar]
- Bucking, C.; Wood, C. Digestion of a single meal affects gene expression of ion and ammonia transporters and glutamine synthetase activity in the gastrointestinal tract of freshwater rainbow trout. J. Comp. Physiol. B 2012, 182, 341–350. [Google Scholar]
- Lee, S.-K.; Boron, W.F.; Parker, M.D. Relief of autoinhibition of the electrogenic Na-HCO3 cotransporter NBCe1-B: Role of IRBIT vs. amino-terminal truncation. Am. J. Physiol. Cell Physiol 2012, 302, C518–C526. [Google Scholar]
- Suzuki, M.; Seki, G.; Yamada, H.; Horita, S.; Fujita, T. Functional roles of electrogenic sodium bicarbonate cotransporter NBCe1 in ocular tissues. Open Ophthalmol. J 2012, 6, 36–41. [Google Scholar]
- Nguyen, T.T.; Bonanno, J.A. Bicarbonate, NBCe1, NHE, and carbonic anhydrase activity enhance lactate-H+ transport in bovine corneal endothelium. Investig. Ophthalmol. Vis. Sci 2011, 52, 8086–8093. [Google Scholar]
- Zin, S.R.M.; Omar, S.Z.; Khan, N.L.; Musameh, N.I.; Das, S.; Kassim, N.M. Effects of the phytoestrogen genistein on the development of the reproductive system of Sprague Dawley rats. Clinics 2013, 68, 253–262. [Google Scholar]
- Li, H.F.; Duan, Y.; Wang, L.D.; Tian, Z.F.; Qiu, X.Q.; Zhang, Y.F.; Zhang, H.; Yang, L.N. Effects of estrogen and phytoestrogens on endometrial leakage in ovariectomized rats and the related mechanisms. Sheng Li Xue Bao 2013, 25, 8–18. [Google Scholar]
- Tuo, B.; Wen, G.; Song, P.; Xu, J.; Liu, X.; Seidler, U.; Dong, H. Genistein stimulates duodenal HCO3− secretion through PI3K pathway in mice. Eur. J. Pharmacol 2011, 651, 159–167. [Google Scholar]
- Singh, A.K.; Liu, Y.; Riederer, B.; Engelhardt, R.; Thakur, B.K.; Soleimani, M.; Seidler, U.E. Molecular transport machinery involved in orchestrating luminal acid-induced duodenal bicarbonate secretion in vivo. J. Physiol. 2013, 591, 5377–5391. [Google Scholar]
- Stewart, A.K.; Yamamoto, A.; Nakakuki, M.; Kondo, T.; Alper, S.L.; Ishiguro, H. Functional coupling of apical Cl−/HCO3− exchange with CFTR in stimulated HCO3− secretion by guinea pig interlobular pancreatic duct. Am. J. Physiol. Gastrointest. Liver Physiol 2009, 296, G1307–G1317. [Google Scholar]
- Little, D.L. Reducing the effects of clover disease by strategic grazing of pastures. Aust. Vet. J 1996, 73, 192–193. [Google Scholar]
- Setchell, K.D.; Gosselin, S.J.; Welsh, M.B.; Johnston, J.O.; Balistreri, W.F.; Kramer, L.W.; Dresser, B.L.; Tarr, M.J. Dietary estrogens—A probable cause of infertility and liver disease in captive cheetahs. Gastroenterology 1987, 93, 225–233. [Google Scholar]
- Salleh, N.; Helmy, M.M.; Fadila, K.N.; Yeong, S.O. Isoflavone genistein induces fluid secretion and morphological changes in the uteri of post-pubertal rats. Int. J. Med. Sci 2013, 10, 665–675. [Google Scholar]
- Chan, H.C.; Chen, H.; Ruan, Y.; Sun, T. Physiology and pathophysiology of the epithelial barrier of the female reproductive tract: Role of ion channels. Adv. Exp. Med. Biol 2012, 763, 193–217. [Google Scholar]
- Vuento, M.H.; Pirhonen, J.P.; Mäkinen, J.I.; Tyrkkö, J.E.; Laippala, P.J.; Grönroos, M.; Salmi, T.A. Endometrial fluid accumulation in asymptomatic postmenopausal women. Ultrasound Obstet. Gynecol 1996, 8, 37–41. [Google Scholar]
- Salleh, N.; Baines, D.L.; Naftalin, R.J.; Milligan, S.R. The hormonal control of uterine luminal fluid secretion and absorption. J. Membr. Biol 2005, 206, 17–28. [Google Scholar]
- Hofmann-Lehmann, R.; Swenerton, R.K.; Liska, V.; Leutenegger, C.M.; Lutz, H.; McClure, H.M.; Ruprecht, R.M. Sensitive and robust one-tube real-time reverse transcriptase-polymerase chain reaction to quantify SIV RNA load: Comparison of one- vs. two-enzyme systems. AIDS Res. Hum. Retrovir 2000, 16, 1247–1257. [Google Scholar]
- Tsai, Y.-L.; Wang, H.-T.T.; Chang, H.-F.G.; Tsai, C.-F.; Lin, C.-K.; Teng, P.-H.; Su, C.; Jeng, C.-C.; Lee, P.-Y. Development of TaqMan probe-based insulated isothermal PCR (iiPCR) for sensitive and specific on-site pathogen detection. PLoS One 2012, 7, e45278. [Google Scholar]
- Leutenegger, C.; Higgins, J.; Matthews, T.B.; Tarantal, A.F.; Luciw, P.A.; Pedersen, N.C.; North, T.W. Real-time TaqMan PCR as a specific and more sensitive alternative to the branched-chain DNA assay for quantitation of simian immunodeficiency virus RNA. AIDS Res. Hum. Retrovir 2001, 17, 243–251. [Google Scholar]
- Hofmann-Lehmann, R.; Williams, A.L.; Swenerton, R.K.; Li, P.L.; Rasmussen, R.A.; Chenine, A.L.; McClure, H.M.; Ruprecht, R.M. Quantitation of simian cytokine and beta-chemokine mRNAs, using real-time reverse transcriptase-polymerase chain reaction: Variations in expression during chronic primate lentivirus infection. AIDS Res. Hum. Retrovir 2002, 18, 627–639. [Google Scholar]
- Lin, P.; Lan, X.; Chen, F.; Yang, Y.; Jin, Y.; Wang, A. Reference gene selection for real-time quantitative PCR analysis of the mouse uterus in the peri-implantation period. PLoS One 2013, 8, e62462. [Google Scholar]
- Pfaffl, M.W. A new mathematical model for relative quantification in real-time RT-PCR. Nucleic Acids Res 2001, 29, e45. [Google Scholar]
- Schmittgen, T.; Livak, K.J. Analyzing real-time PCR data by the comparative Ct method. Nat. Protoc 2008, 3, 1101–1108. [Google Scholar]
- Zhu, Q.; Liu, W.; Kao, L.; Azimov, R.; Newman, D.; Abuladze, N.; Kurtz, I. Topology of NBCe1 protein transmembrane segment 1 and structural effect of proximal renal tubular acidosis (pRTA) S427L mutation. J. Biol. Chem 2013, 288, 7894–7906. [Google Scholar]


© 2014 by the authors; licensee MDPI, Basel, Switzerland This article is an open access article distributed under the terms and conditions of the Creative Commons Attribution license (http://creativecommons.org/licenses/by/3.0/).
Share and Cite
Chinigarzadeh, A.; Kasim, N.F.; Muniandy, S.; Kassim, N.M.; Salleh, N. Genistein Induces Increase in Fluid pH, Na+ and HCO3− Concentration, SLC26A6 and SLC4A4 (NBCe1)-B Expression in the Uteri of Ovariectomized Rats. Int. J. Mol. Sci. 2014, 15, 958-976. https://doi.org/10.3390/ijms15010958
Chinigarzadeh A, Kasim NF, Muniandy S, Kassim NM, Salleh N. Genistein Induces Increase in Fluid pH, Na+ and HCO3− Concentration, SLC26A6 and SLC4A4 (NBCe1)-B Expression in the Uteri of Ovariectomized Rats. International Journal of Molecular Sciences. 2014; 15(1):958-976. https://doi.org/10.3390/ijms15010958
Chicago/Turabian StyleChinigarzadeh, Asma, Nor Fadila Kasim, Sekaran Muniandy, Normadiah M. Kassim, and Naguib Salleh. 2014. "Genistein Induces Increase in Fluid pH, Na+ and HCO3− Concentration, SLC26A6 and SLC4A4 (NBCe1)-B Expression in the Uteri of Ovariectomized Rats" International Journal of Molecular Sciences 15, no. 1: 958-976. https://doi.org/10.3390/ijms15010958
APA StyleChinigarzadeh, A., Kasim, N. F., Muniandy, S., Kassim, N. M., & Salleh, N. (2014). Genistein Induces Increase in Fluid pH, Na+ and HCO3− Concentration, SLC26A6 and SLC4A4 (NBCe1)-B Expression in the Uteri of Ovariectomized Rats. International Journal of Molecular Sciences, 15(1), 958-976. https://doi.org/10.3390/ijms15010958