Demagnetization Treatment of Remanent Composite Microspheres Studied by Alternating Current Susceptibility Measurements

Abstract
:
1. Introduction
2. Results
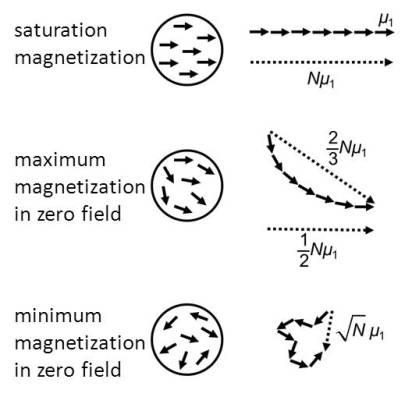
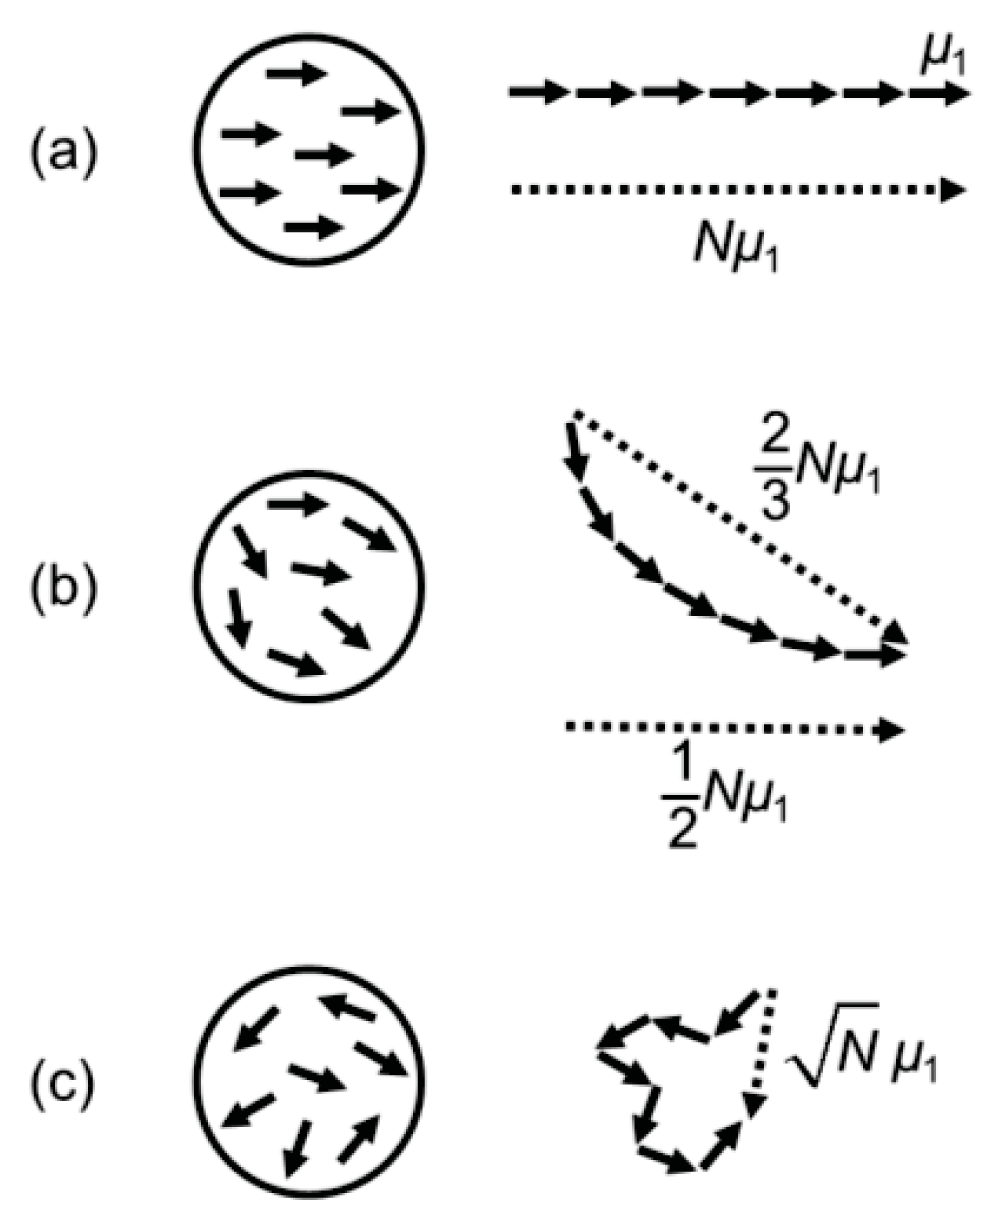
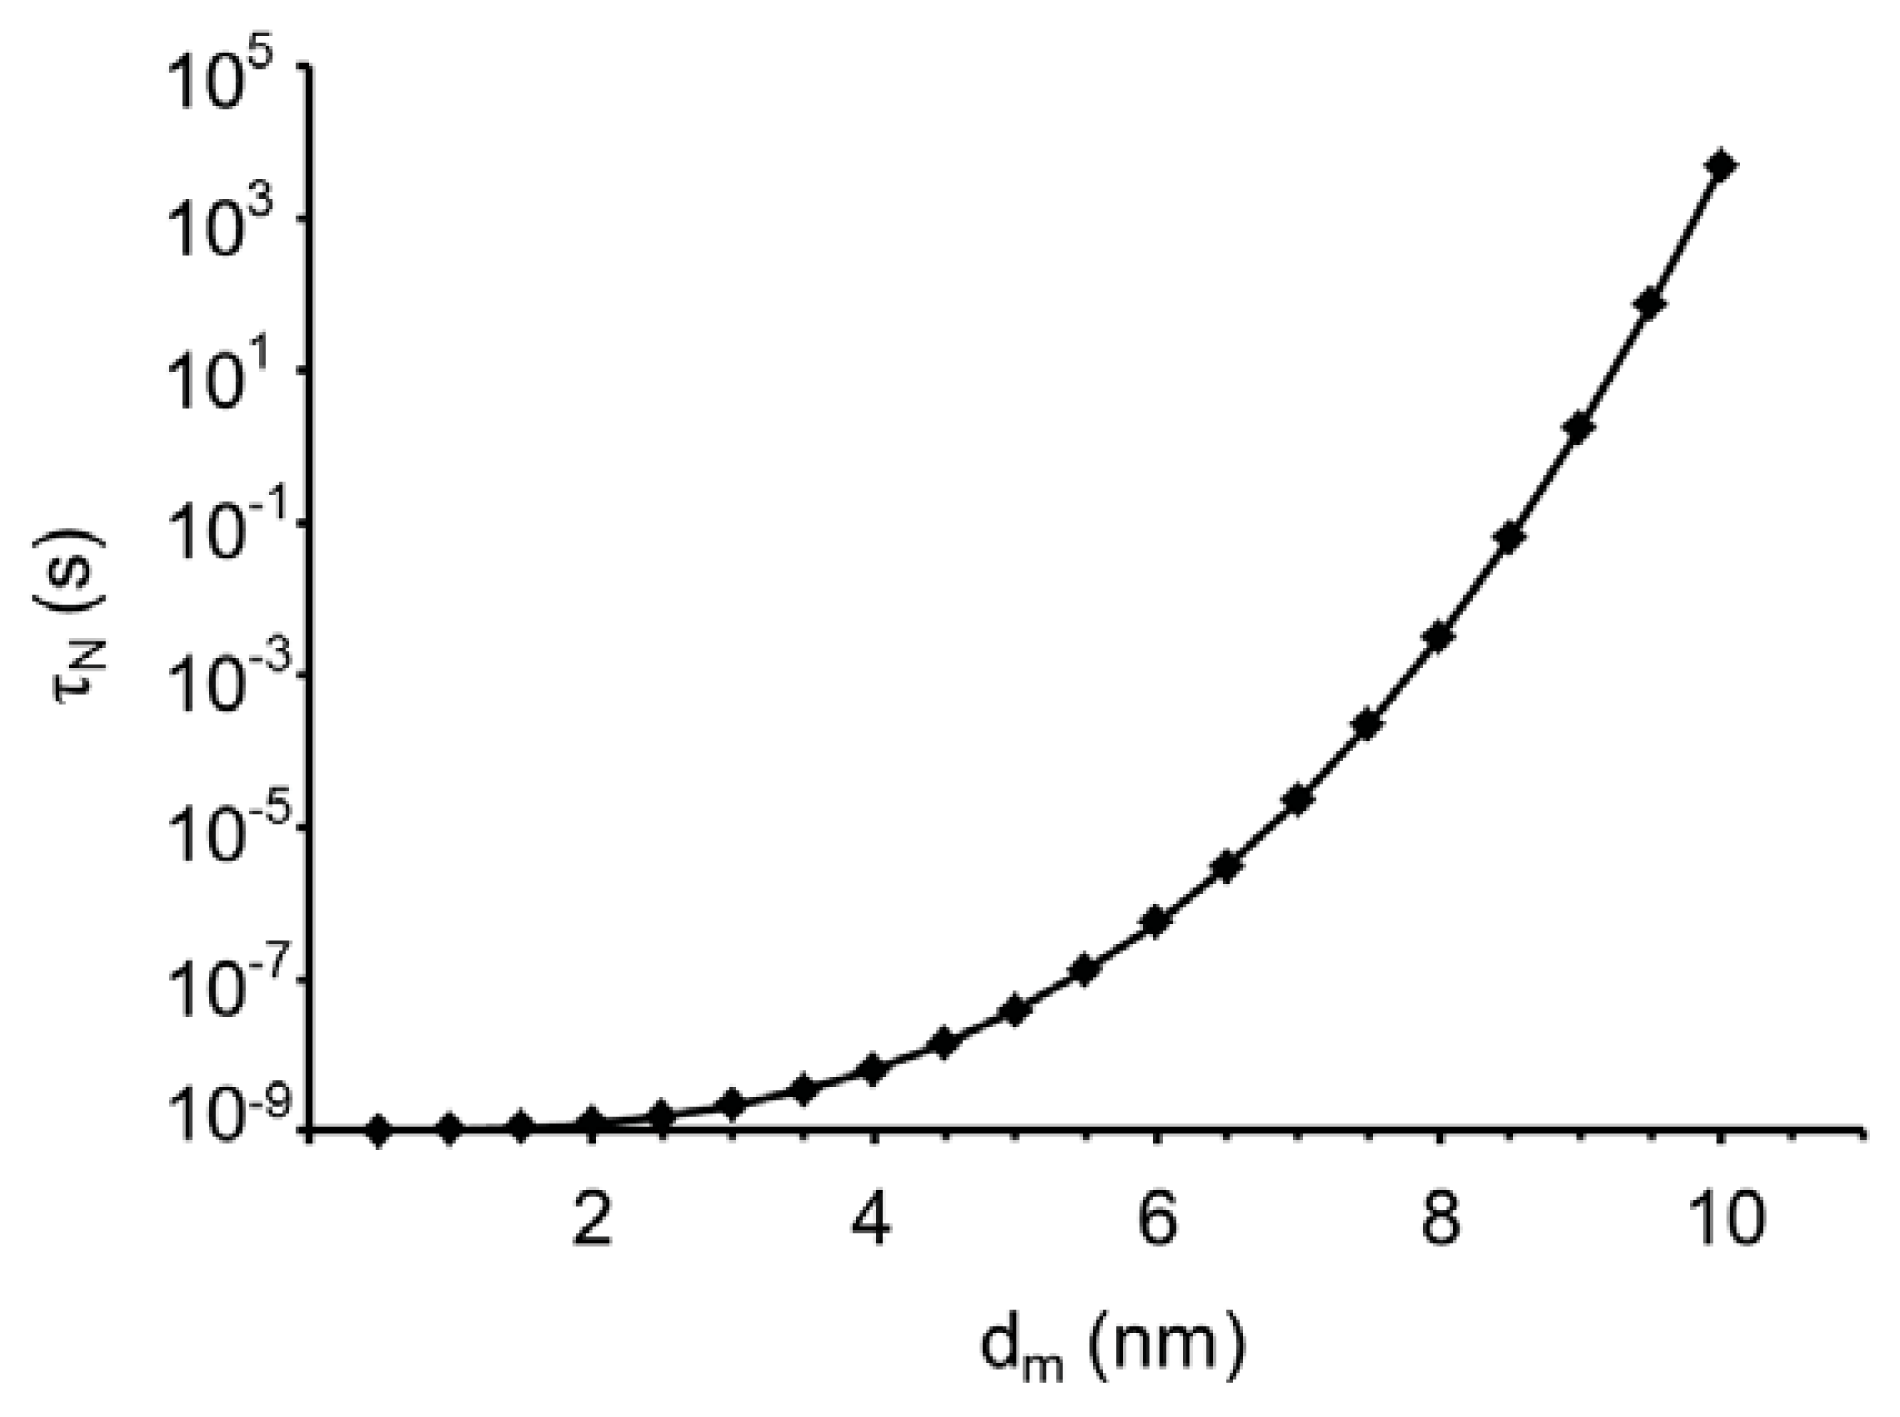
2.1. Theory
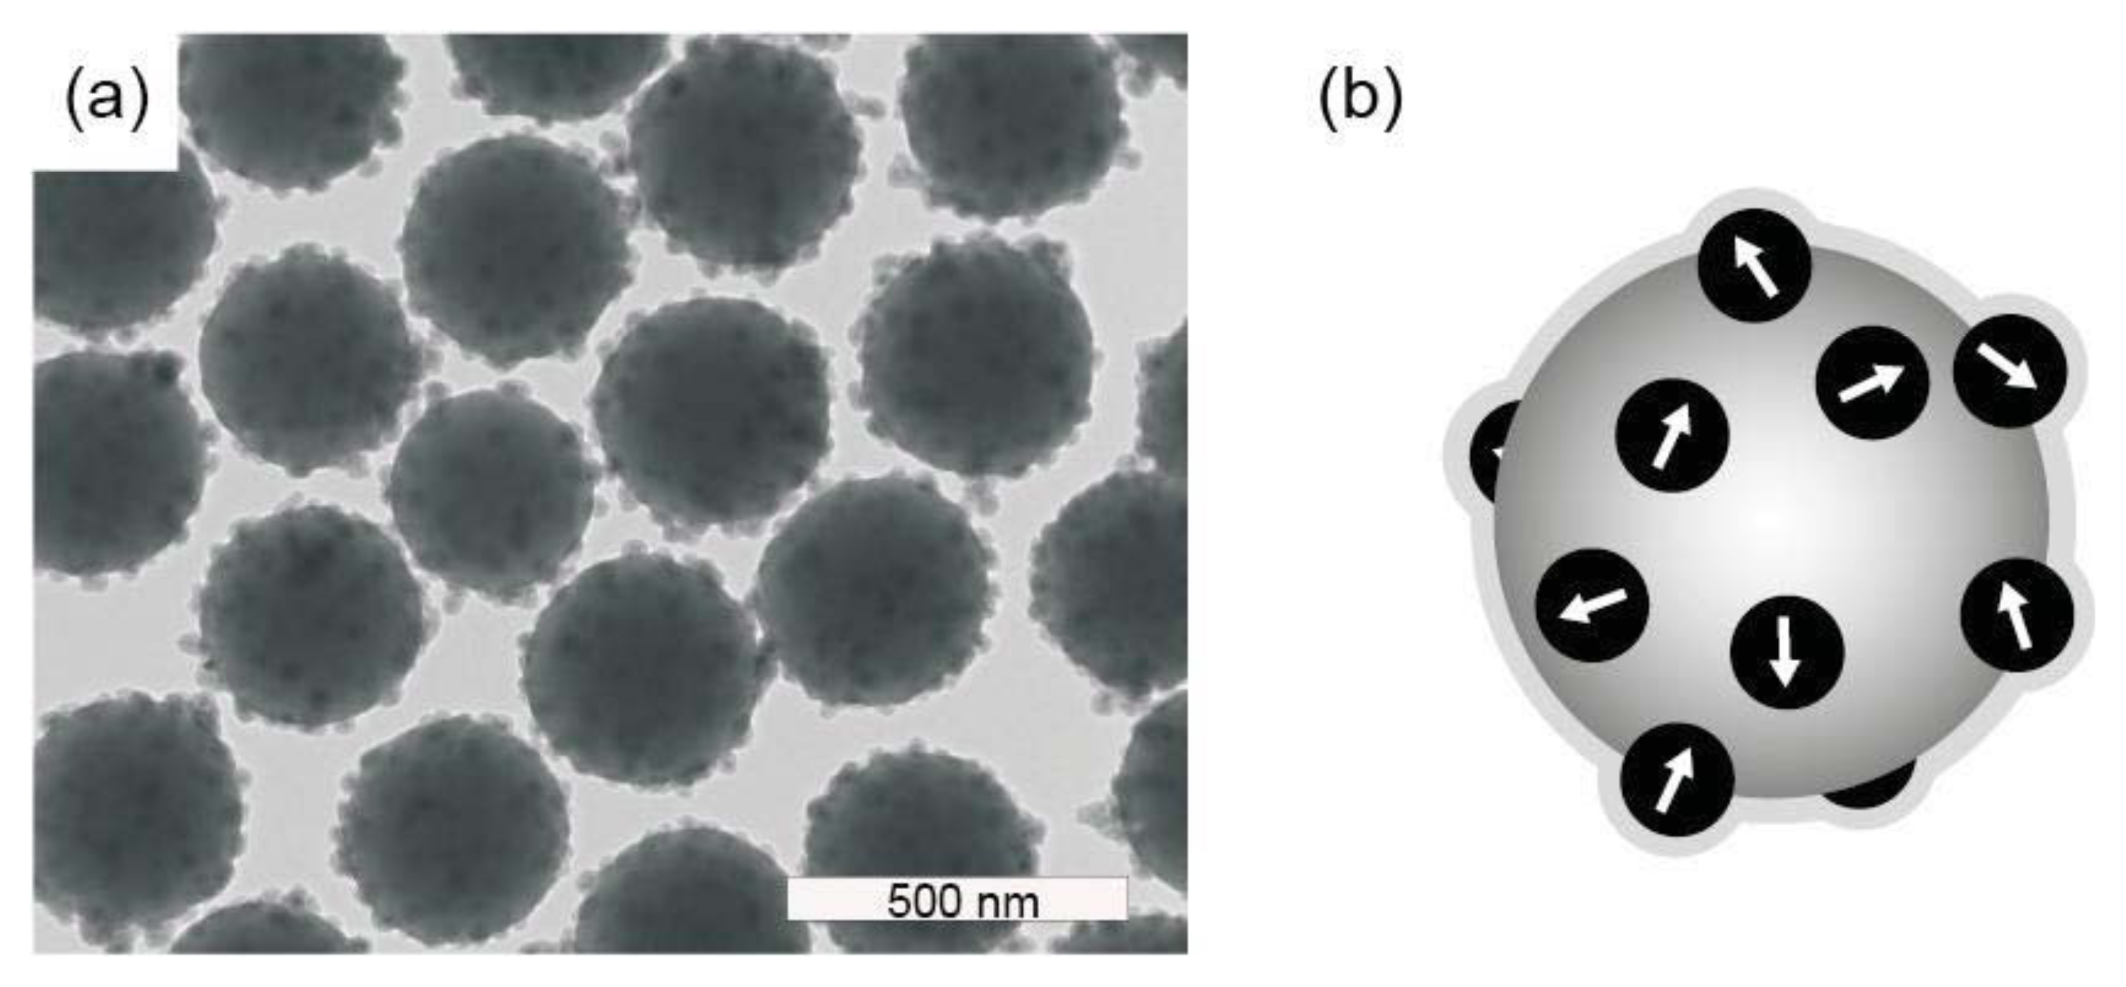
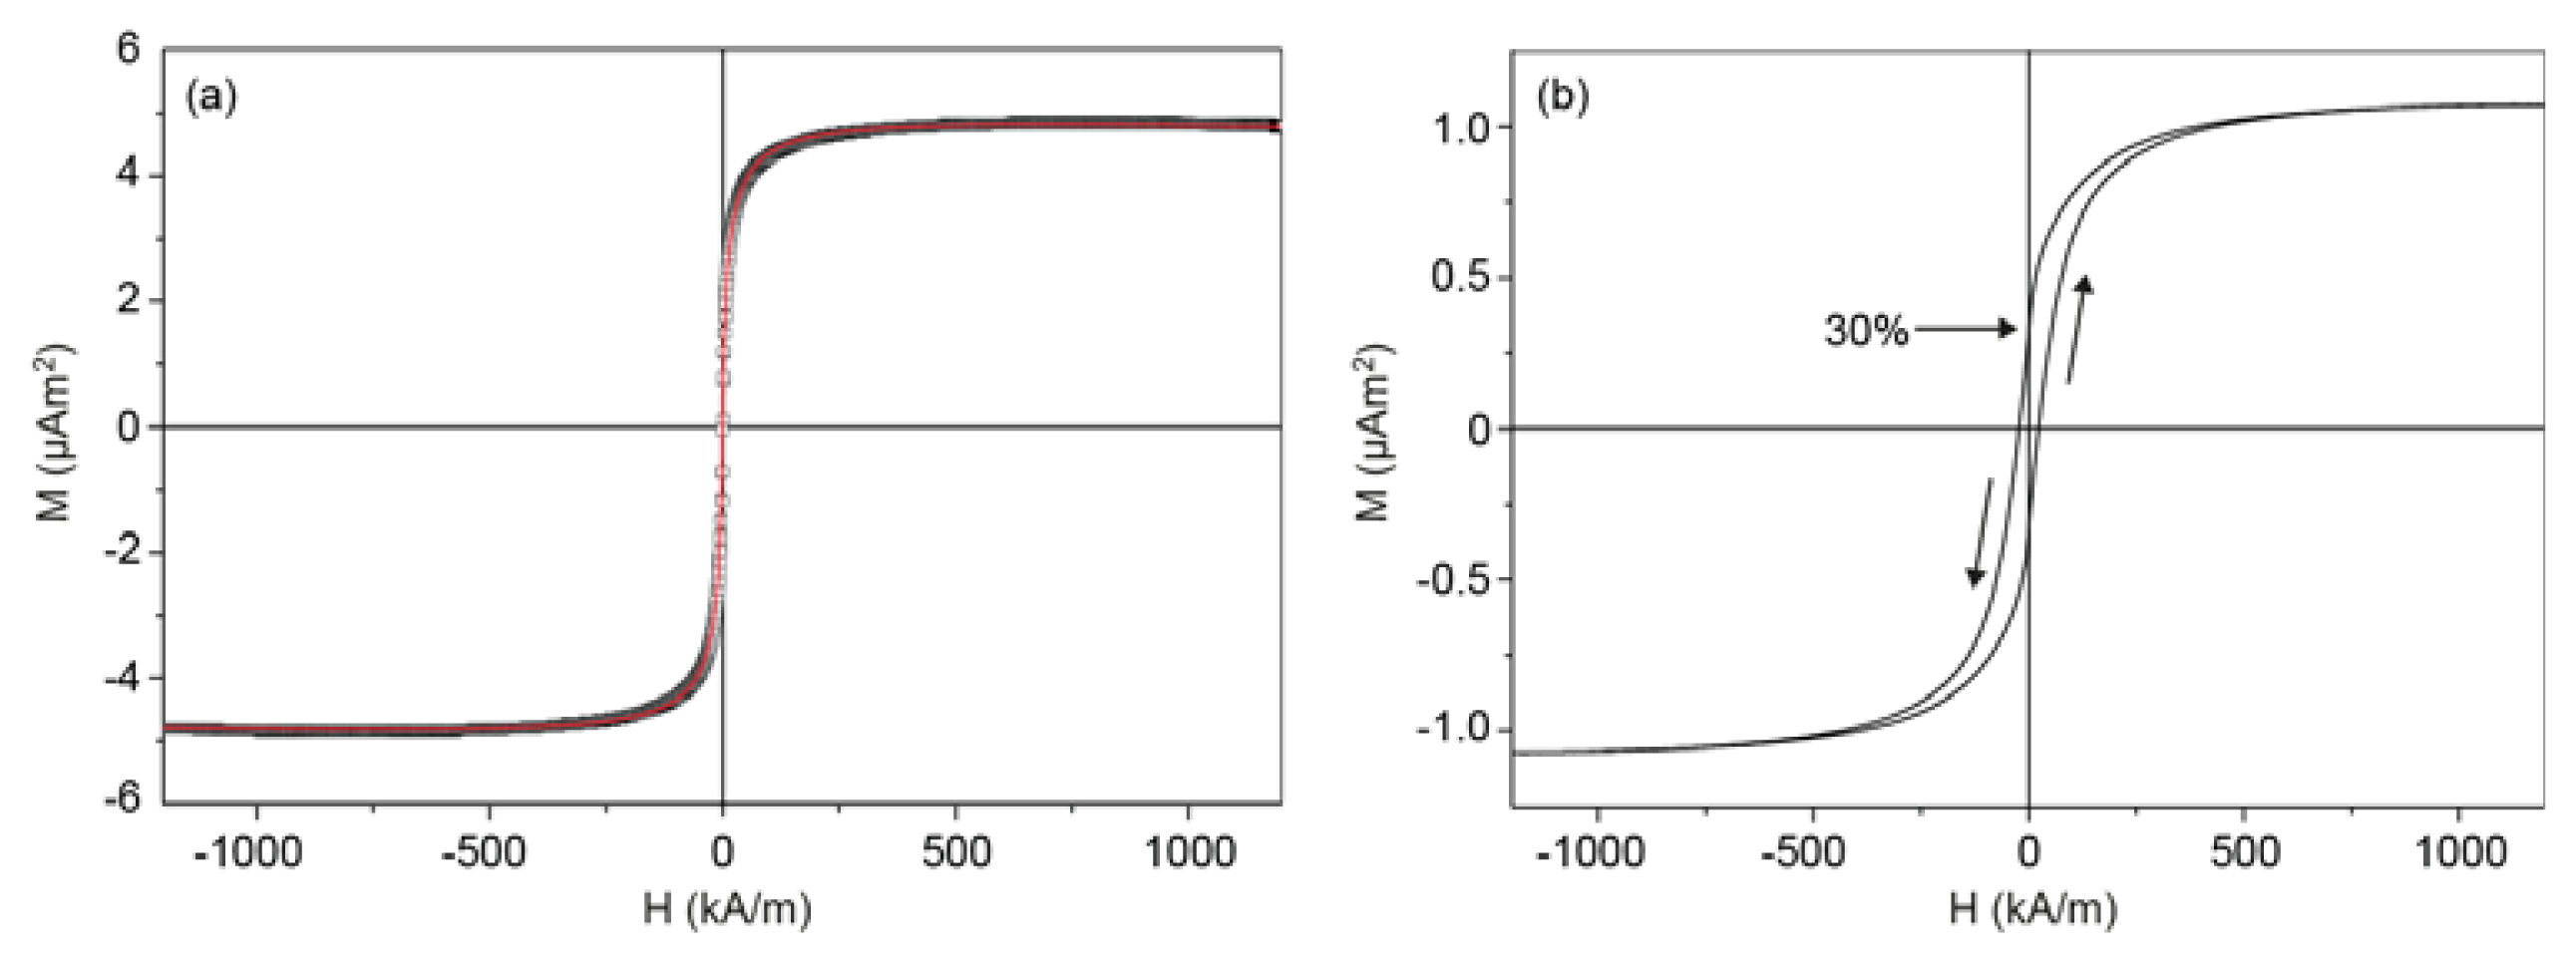
2.2. Magnetic Content of the Composite Microspheres and Remanence on the Macroscopic Scale
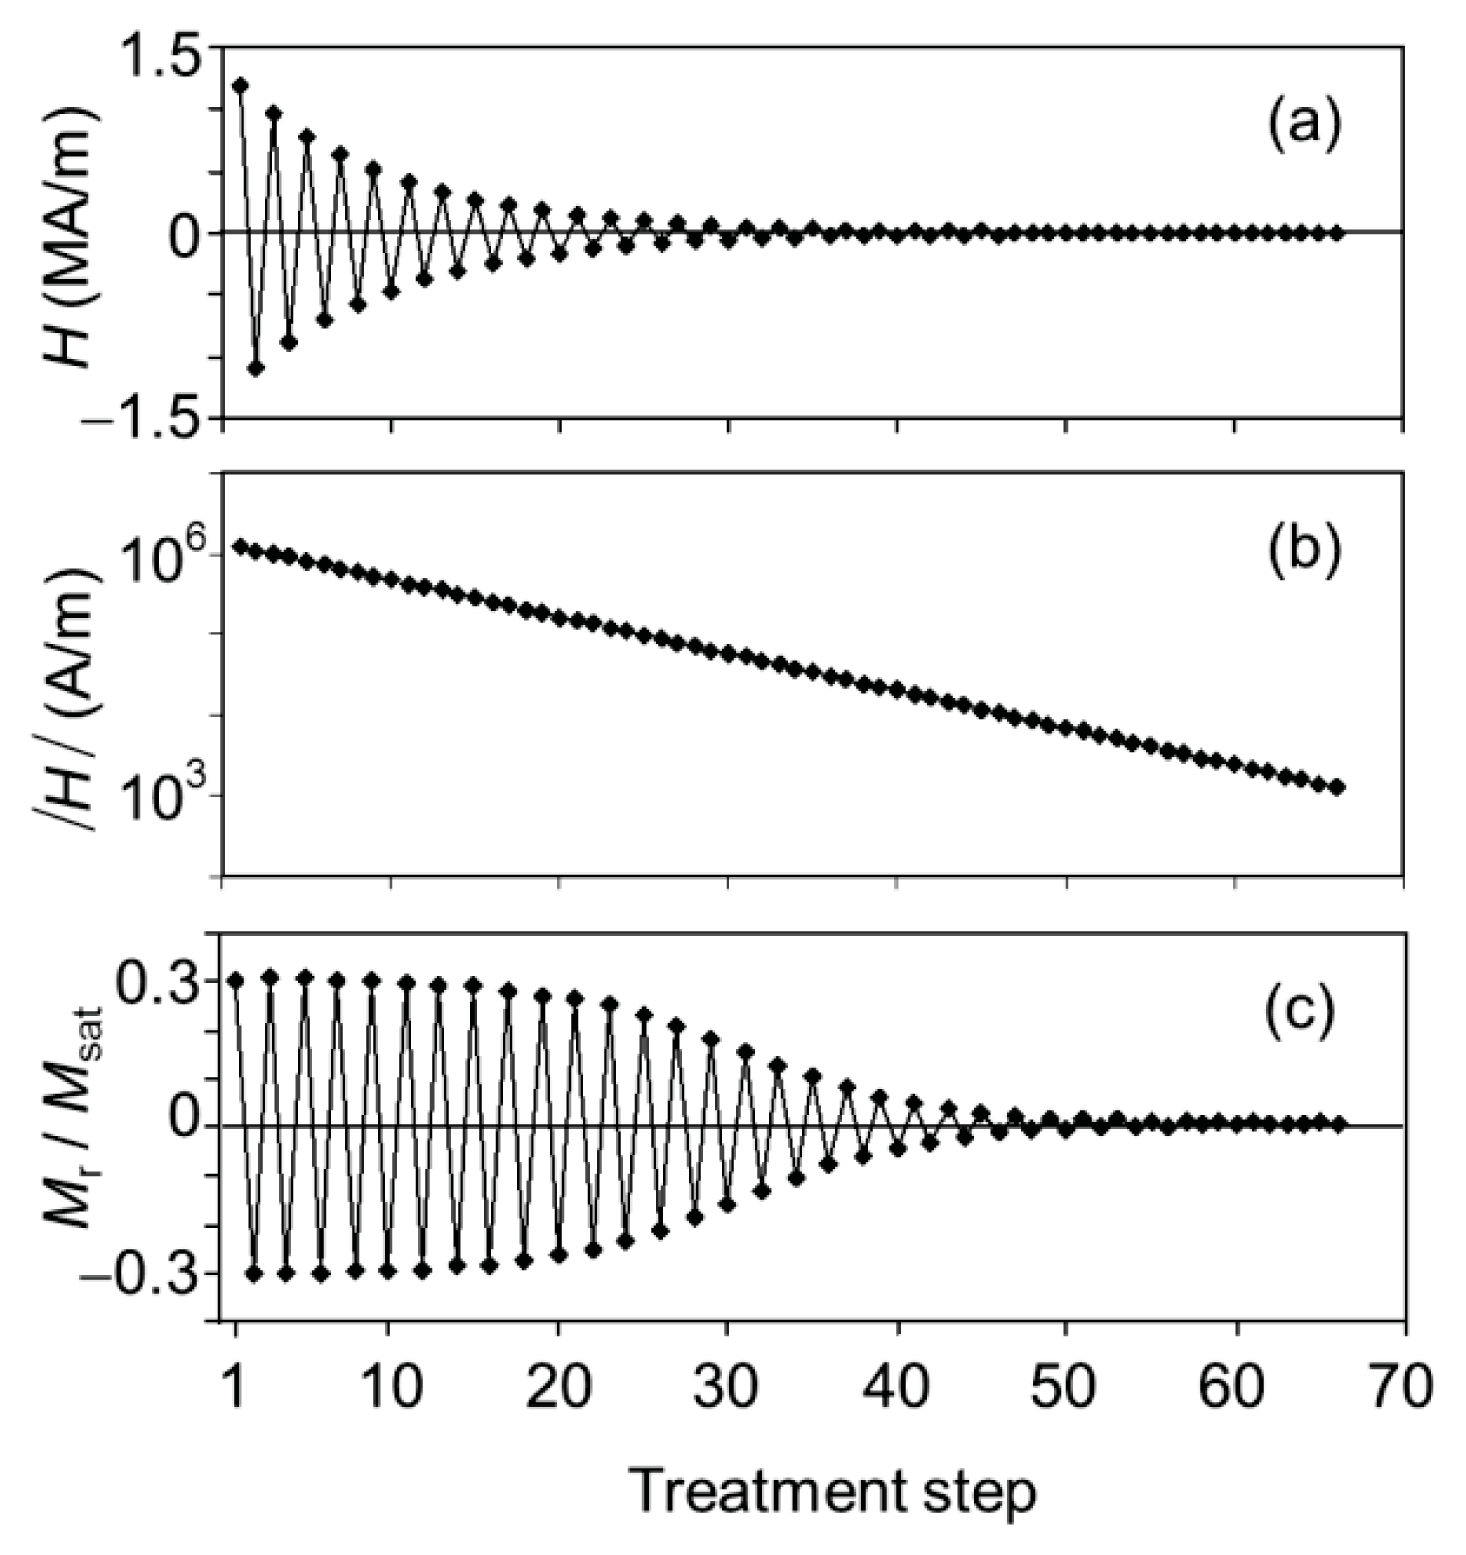
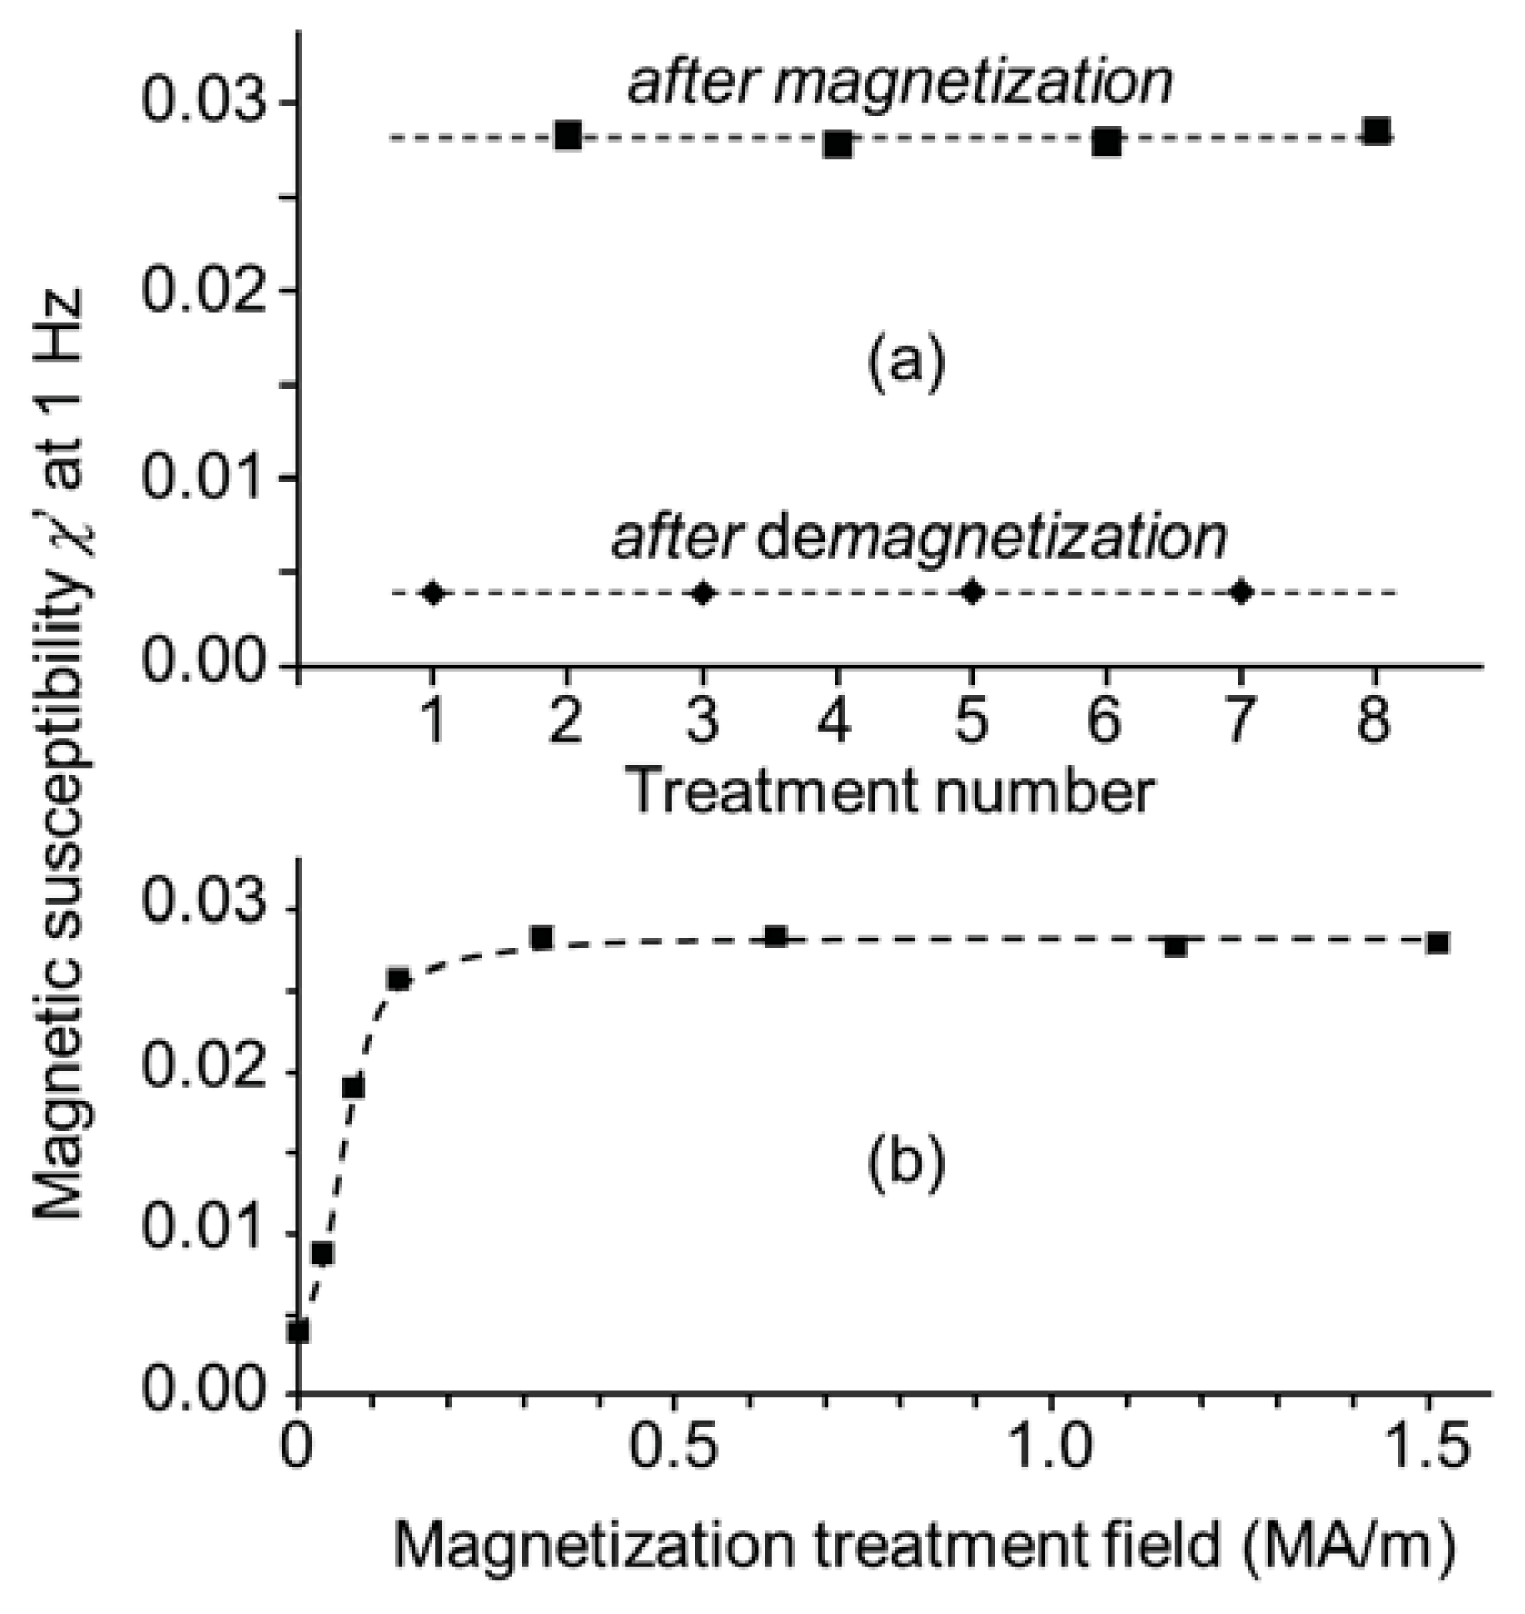
2.3. Demagnetization Treatment: Effect on the Macroscopic Scale
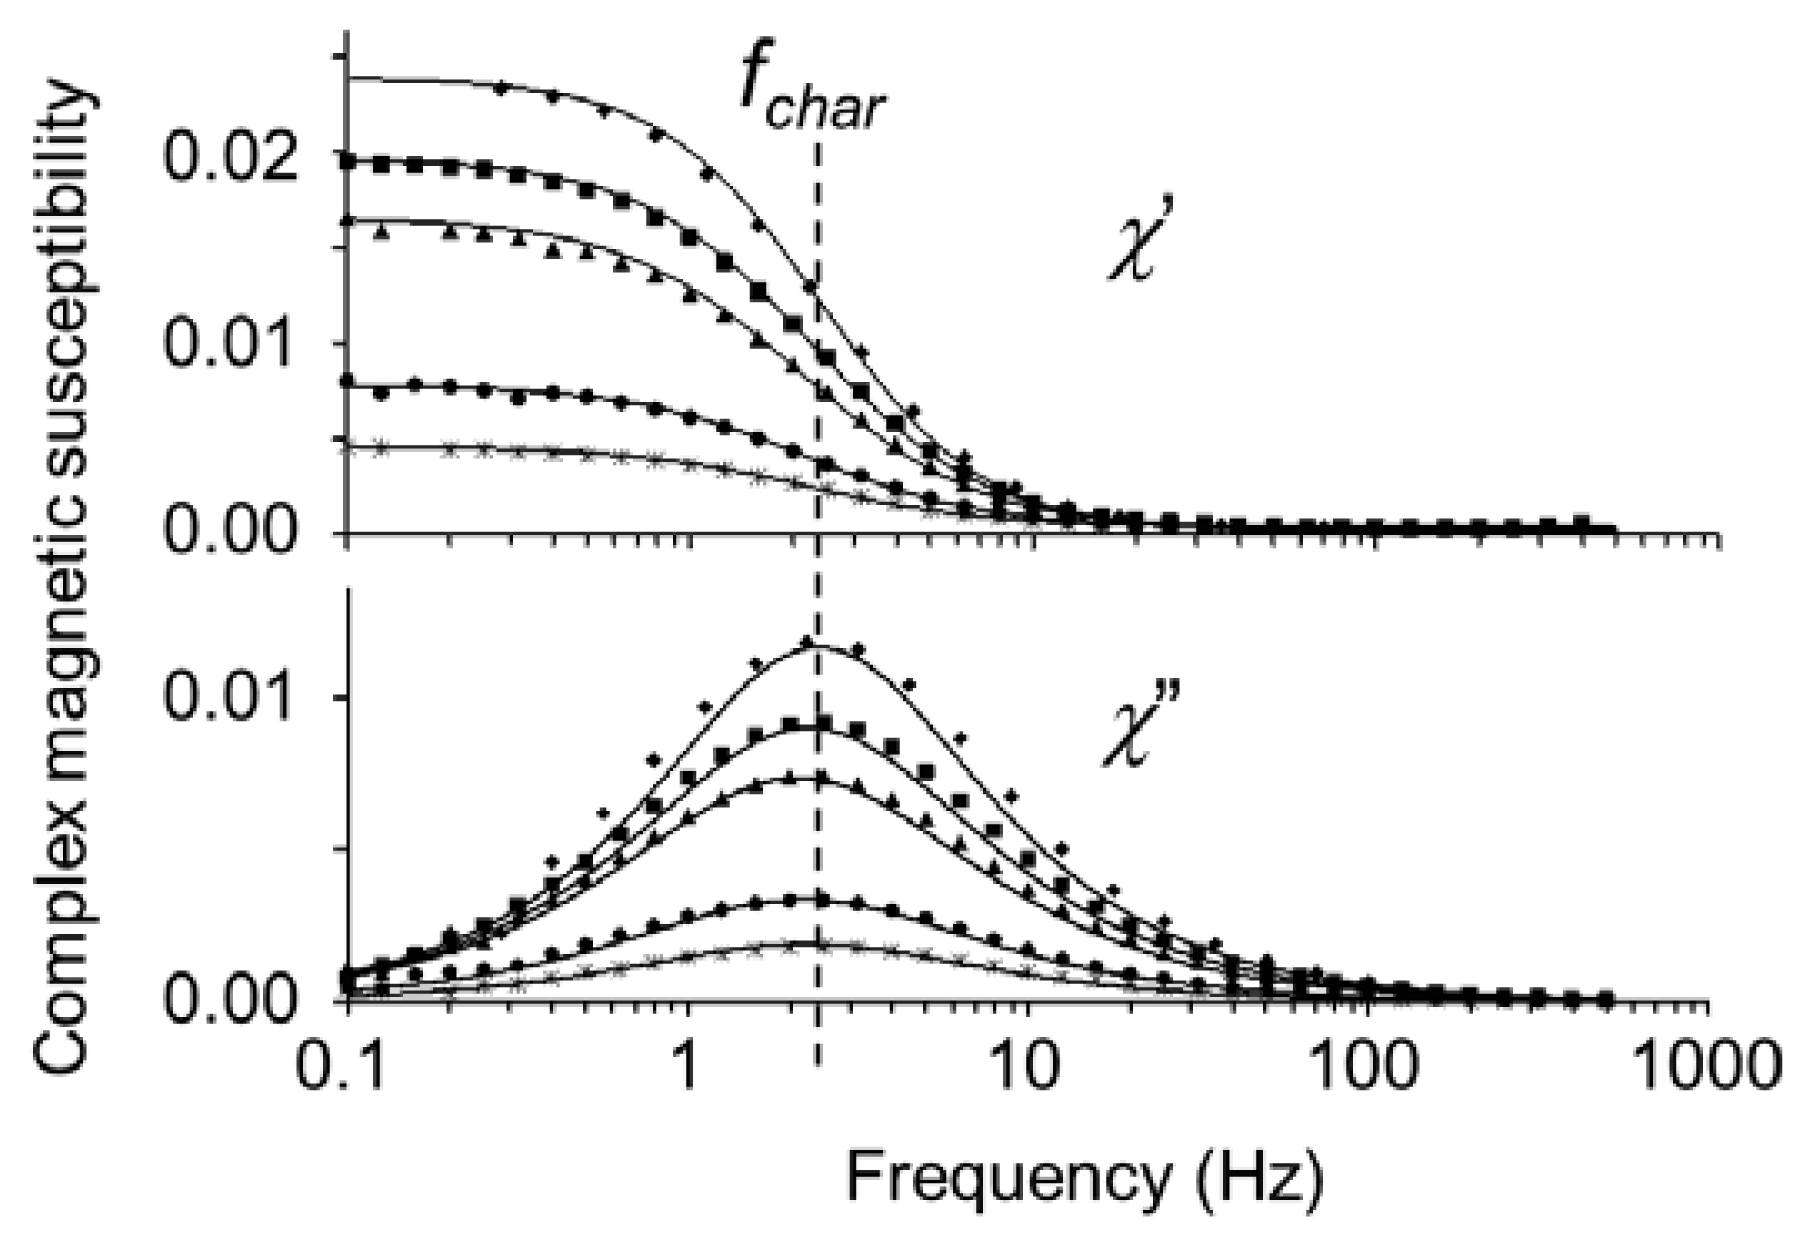
2.4. AC Susceptibility Measurements
3. General Discussion
4. Experimental Section
4.1. Magnetically Remanent Silica Microspheres
4.2. Demagnetization of Liquid Dispersions
4.3. Magnetic Measurements
5. Conclusions
Acknowledgments
Conflicts of Interest
References
- Pankhurst, Q.; Connolly, J.; Jones, S.; Dobson, J. Applications of magnetic nanoparticles in biomedicine. J. Phys. D 2003, 36, R167–R181. [Google Scholar]
- Jeong, U.; Teng, X.; Wang, Y.; Yang, H.; Xia, Y. Superparamagnetic colloids: Controlled synthesis and niche applications. Adv. Mater 2007, 19, 33–60. [Google Scholar]
- Cohen-Tannoudji, L.; Bertrand, E.; Baudry, J.; Robic, C.; Goubault, C.; Pellissier, M.; Johner, A.; Thalmann, F.; Lee, N.K.; Marques, C.M.; et al. Measuring the kinetics of biomolecular recognition with magnetic colloids. Phys. Rev. Lett 2008, 100. [Google Scholar] [CrossRef]
- Kotitz, R.; Weitschies, W.; Trahms, L.; Brewer, W.; Semmler, W. Determination of the binding reaction between avidin and biotin by relaxation measurements of magnetic nanoparticles. J. Magn. Magn. Mater 1999, 194, 62–68. [Google Scholar]
- Chung, S.; Hoffmann, A.; Bader, S.; Liu, C.; Kay, B.; Makowski, L.; Chen, L. Biological sensors based on Brownian relaxation of magnetic nanoparticles. Appl. Phys. Lett 2004, 85, 2971–2973. [Google Scholar]
- Astalan, A.; Ahrentorp, F.; Johansson, C.; Larsson, K.; Krozer, A. Biomolecular reactions studied using changes in Brownian rotation dynamics of magnetic particles. Biosens. Bioelectron 2004, 19, 945–951. [Google Scholar]
- Hong, C.Y.; Wu, C.C.; Chiu, Y.C.; Yang, S.Y.; Horng, H.E.; Yang, H.C. Magnetic susceptibility reduction method for magnetically labeled immunoassay. Appl. Phys. Lett 2006, 88. [Google Scholar] [CrossRef]
- Fornara, A.; Johansson, P.; Petersson, K.; Gustafsson, S.; Qin, J.; Olsson, E.; Ilver, D.; Krozer, A.; Muhammed, M.; Johansson, C. Tailored magnetic nanoparticles for direct and sensitive detection of biomolecules in biological samples. Nano Lett 2008, 8, 3423–3428. [Google Scholar]
- Calero-DdelC, V.L.; Santiago-Quinonez, D.I.; Rinaldi, C. Quantitative nanoscale viscosity measurements using magnetic nanoparticles and SQUID AC susceptibility measurements. Soft Matter 2011, 7, 4497–4503. [Google Scholar]
- Barrera, C.; Florian-Algarin, V.; Acevedo, A.; Rinaldi, C. Monitoring gelation using magnetic nanoparticles. Soft Matter 2010, 6, 3662–3668. [Google Scholar]
- Frickel, N.; Messing, R.; Schmidt, A.M. Magneto-mechanical coupling in CoFe2O4-linked PAAm ferrohydrogels. J. Mater. Chem 2011, 21, 8466–8474. [Google Scholar]
- Claesson, E.M.; Erne, B.H.; Bakelaar, I.A.; Kuipers, B.W.M.; Philipse, A.P. Measurement of the zero-field magnetic dipole moment of magnetizable colloidal silica spheres. J. Phys.-Condens. Matter 2007, 19. [Google Scholar] [CrossRef]
- Claesson, E.; Philipse, A. Monodisperse magnetizable composite silica spheres with tunable dipolar interactions. Langmuir 2005, 21, 9412–9419. [Google Scholar]
- Claesson, E.M.; Erne, B.H.; Philipse, A.P. Rotational dynamics of magnetic silica spheres studied by measuring the complex magnetic susceptibility. J. Phys.-Condens. Matter 2007, 19. [Google Scholar] [CrossRef]
- Chikazumi, S.; Charap, S.H. Physics of Magnetism, 1st ed.; John Wiley & Sons Inc: New York, NY, USA, 1964; p. 554. [Google Scholar]
- Luigjes, B.; Woudenberg, S.M.C.; de Groot, R.; Meeldijk, J.D.; Galvis, H.M.T.; de Jong, K.P.; Philipse, A.P.; Erne, B.H. Diverging geometric and magnetic size distributions of iron oxide nanocrystals. J. Phys. Chem. C 2011, 115, 14598–14605. [Google Scholar]
- Magnetic Fluids and Applications Handbook; Berkovski, B.; Bashtovoy, V. (Eds.) Begell House Inc.: New York, NY, USA, 1996.
- Butter, K.; Bomans, P.; Frederik, P.; Vroege, G.; Philipse, A. Direct observation of dipolar chains in iron ferrofluids by cryogenic electron microscopy. Nat. Mater 2003, 2, 88–91. [Google Scholar]
- Klokkenburg, M.; Dullens, R.; Kegel, W.; Erne, B.; Philipse, A. Quantitative real-space analysis of self-assembled structures of magnetic dipolar colloids. Phys. Rev. Lett 2006, 96. [Google Scholar] [CrossRef]
- Van Berkum, S.; Dee, J.T.; Philipse, A.P.; Erne, B.H. frequency-dependent magnetic susceptibility of magnetite and cobalt ferrite nanoparticles embedded in PAA hydrogel. Int. J. Mol. Sci 2013, 14, 10162–10177. [Google Scholar]
- Fortin, J.; Wilhelm, C.; Servais, J.; Menager, C.; Bacri, J.; Gazeau, F. Size-sorted anionic iron oxide nanomagnets as colloidal mediators for magnetic hyperthermia. J. Am. Chem. Soc 2007, 129, 2628–2635. [Google Scholar]
- Odenbach, S. Magnetoviscous Effects in Ferrofluids; Springer: Berlin, Germany; p. 2002.
- Brabers, V.A.M. Handbook of Magnetic Materials; Buschow, K.H.J., Ed.; North Holland: Amsterdam, The Netherlands, 1995; Volume 8, p. 212. [Google Scholar]
- Tung, L.; Kolesnichenko, V.; Caruntu, D.; Chou, N.; O’Connor, C.; Spinu, L. Magnetic properties of ultrafine cobalt ferrite particles. J. Appl. Phys 2003, 93, 7486–7488. [Google Scholar]
- Fannin, P. Wideband measurement and analysis techniques for the determination of the frequency-dependent, complex susceptibility of magnetic fluids. Adv. Chem. Phys 1998, 104, 181–292. [Google Scholar]
- Erne, B.H.; Butter, K.; Kuipers, B.W.M.; Vroege, G.J. Rotational diffusion in iron ferrofluids. Langmuir 2003, 19, 8218–8225. [Google Scholar]
- Fannin, P.; Cohen-Tannoudji, L.; Bertrand, E.; Giannitsis, A.; Mac Oireachtaigh, C.; Bibette, J. Investigation of the complex susceptibility of magnetic beads containing maghemite nanoparticles. J. Magn. Magn. Mater 2006, 303, 147–152. [Google Scholar]
- Chantrell, R.W.; Hoon, S.R.; Tanner, B.K. Time-dependent magnetization in fine-particle ferromagnetic systems. J. Magn. Magn. Mater 1983, 38, 133–141. [Google Scholar]
- Eberbeck, D.; Ahlers, H. Glass like behavior of magnetization in frozen ferrofluids. J. Magn. Magn. Mater 1999, 192, 148–158. [Google Scholar]
- Klokkenburg, M.; Vonk, C.; Claesson, E.M.; Meeldijk, J.D.; Erne, B.H.; Philipse, A.P. Direct imaging of zero-field dipolar structures in colloidal dispersions of synthetic magnetite. J. Am. Chem. Soc 2004, 126, 16706–16707. [Google Scholar]
- Smoukov, S.K.; Gangwal, S.; Marquez, M.; Velev, O.D. Reconfigurable responsive structures assembled from magnetic Janus particles. Soft Matter 2009, 5, 1285–1292. [Google Scholar]
- Tourinho, F.; Franck, R.; Massart, R. Aqueous ferrofluids based on manganese and cobalt ferrites. J. Mater. Sci 1990, 25, 3249–3254. [Google Scholar]
- Stöber, W.; Fink, A.; Bohn, E. Controlled growth of monodisperse silica spheres in micron size range. J. Colloid Interface Sci 1968, 26, 62–69. [Google Scholar]
- Kuipers, B.W.M.; Bakelaar, I.A.; Klokkenburg, M.; Erne, B.H. Complex magnetic susceptibility setup for spectroscopy in the extremely low-frequency range. Rev. Sci. Instrum 2008, 79. [Google Scholar] [CrossRef]


© 2013 by the authors; licensee MDPI, Basel, Switzerland This article is an open access article distributed under the terms and conditions of the Creative Commons Attribution license (http://creativecommons.org/licenses/by/3.0/).
Share and Cite
Van Berkum, S.; Erné, B.H. Demagnetization Treatment of Remanent Composite Microspheres Studied by Alternating Current Susceptibility Measurements. Int. J. Mol. Sci. 2013, 14, 18093-18109. https://doi.org/10.3390/ijms140918093
Van Berkum S, Erné BH. Demagnetization Treatment of Remanent Composite Microspheres Studied by Alternating Current Susceptibility Measurements. International Journal of Molecular Sciences. 2013; 14(9):18093-18109. https://doi.org/10.3390/ijms140918093
Chicago/Turabian StyleVan Berkum, Susanne, and Ben H. Erné. 2013. "Demagnetization Treatment of Remanent Composite Microspheres Studied by Alternating Current Susceptibility Measurements" International Journal of Molecular Sciences 14, no. 9: 18093-18109. https://doi.org/10.3390/ijms140918093
APA StyleVan Berkum, S., & Erné, B. H. (2013). Demagnetization Treatment of Remanent Composite Microspheres Studied by Alternating Current Susceptibility Measurements. International Journal of Molecular Sciences, 14(9), 18093-18109. https://doi.org/10.3390/ijms140918093