Absolute Quantification of Selected Proteins in the Human Osteoarthritic Secretome


Abstract
:
1. Introduction
2. Results
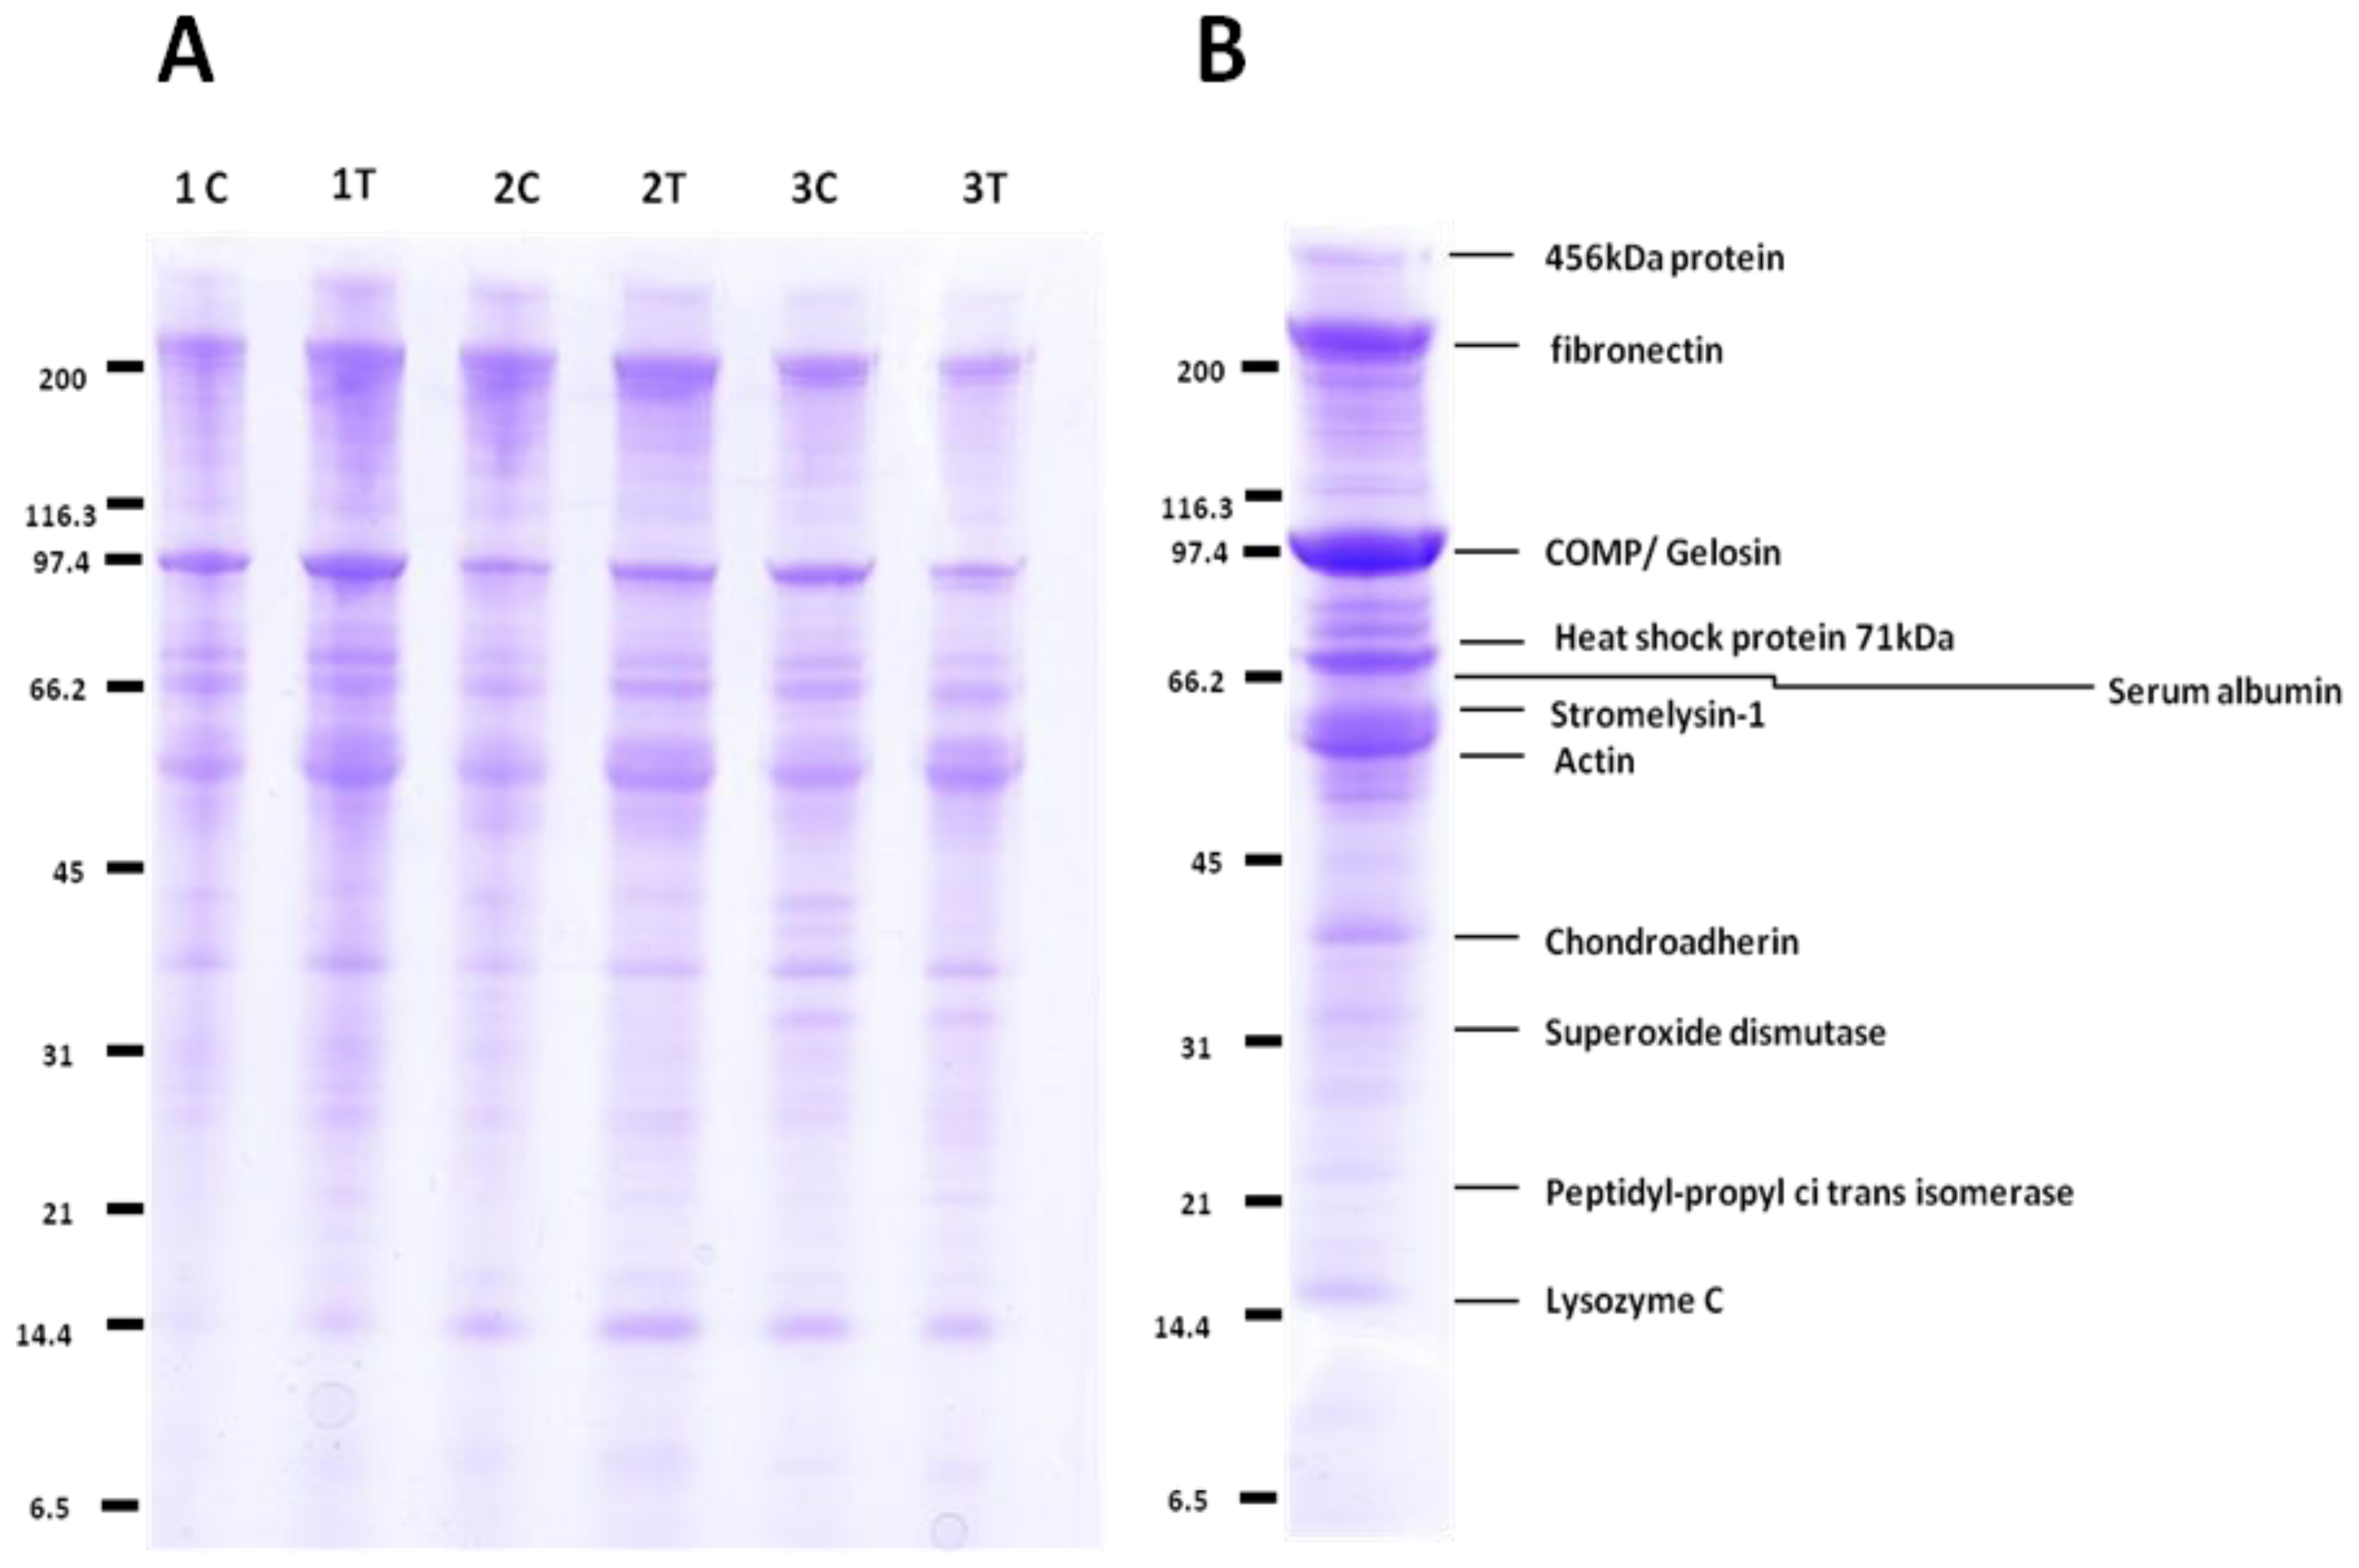
2.1. Comparative Analysis by Mass Spectrometry
2.2. Label-Free Protein Profiling of the OA Secretome
2.3. QconCAT Protein Design, Expression and Validation
2.4. Peptide Choice and Detectability
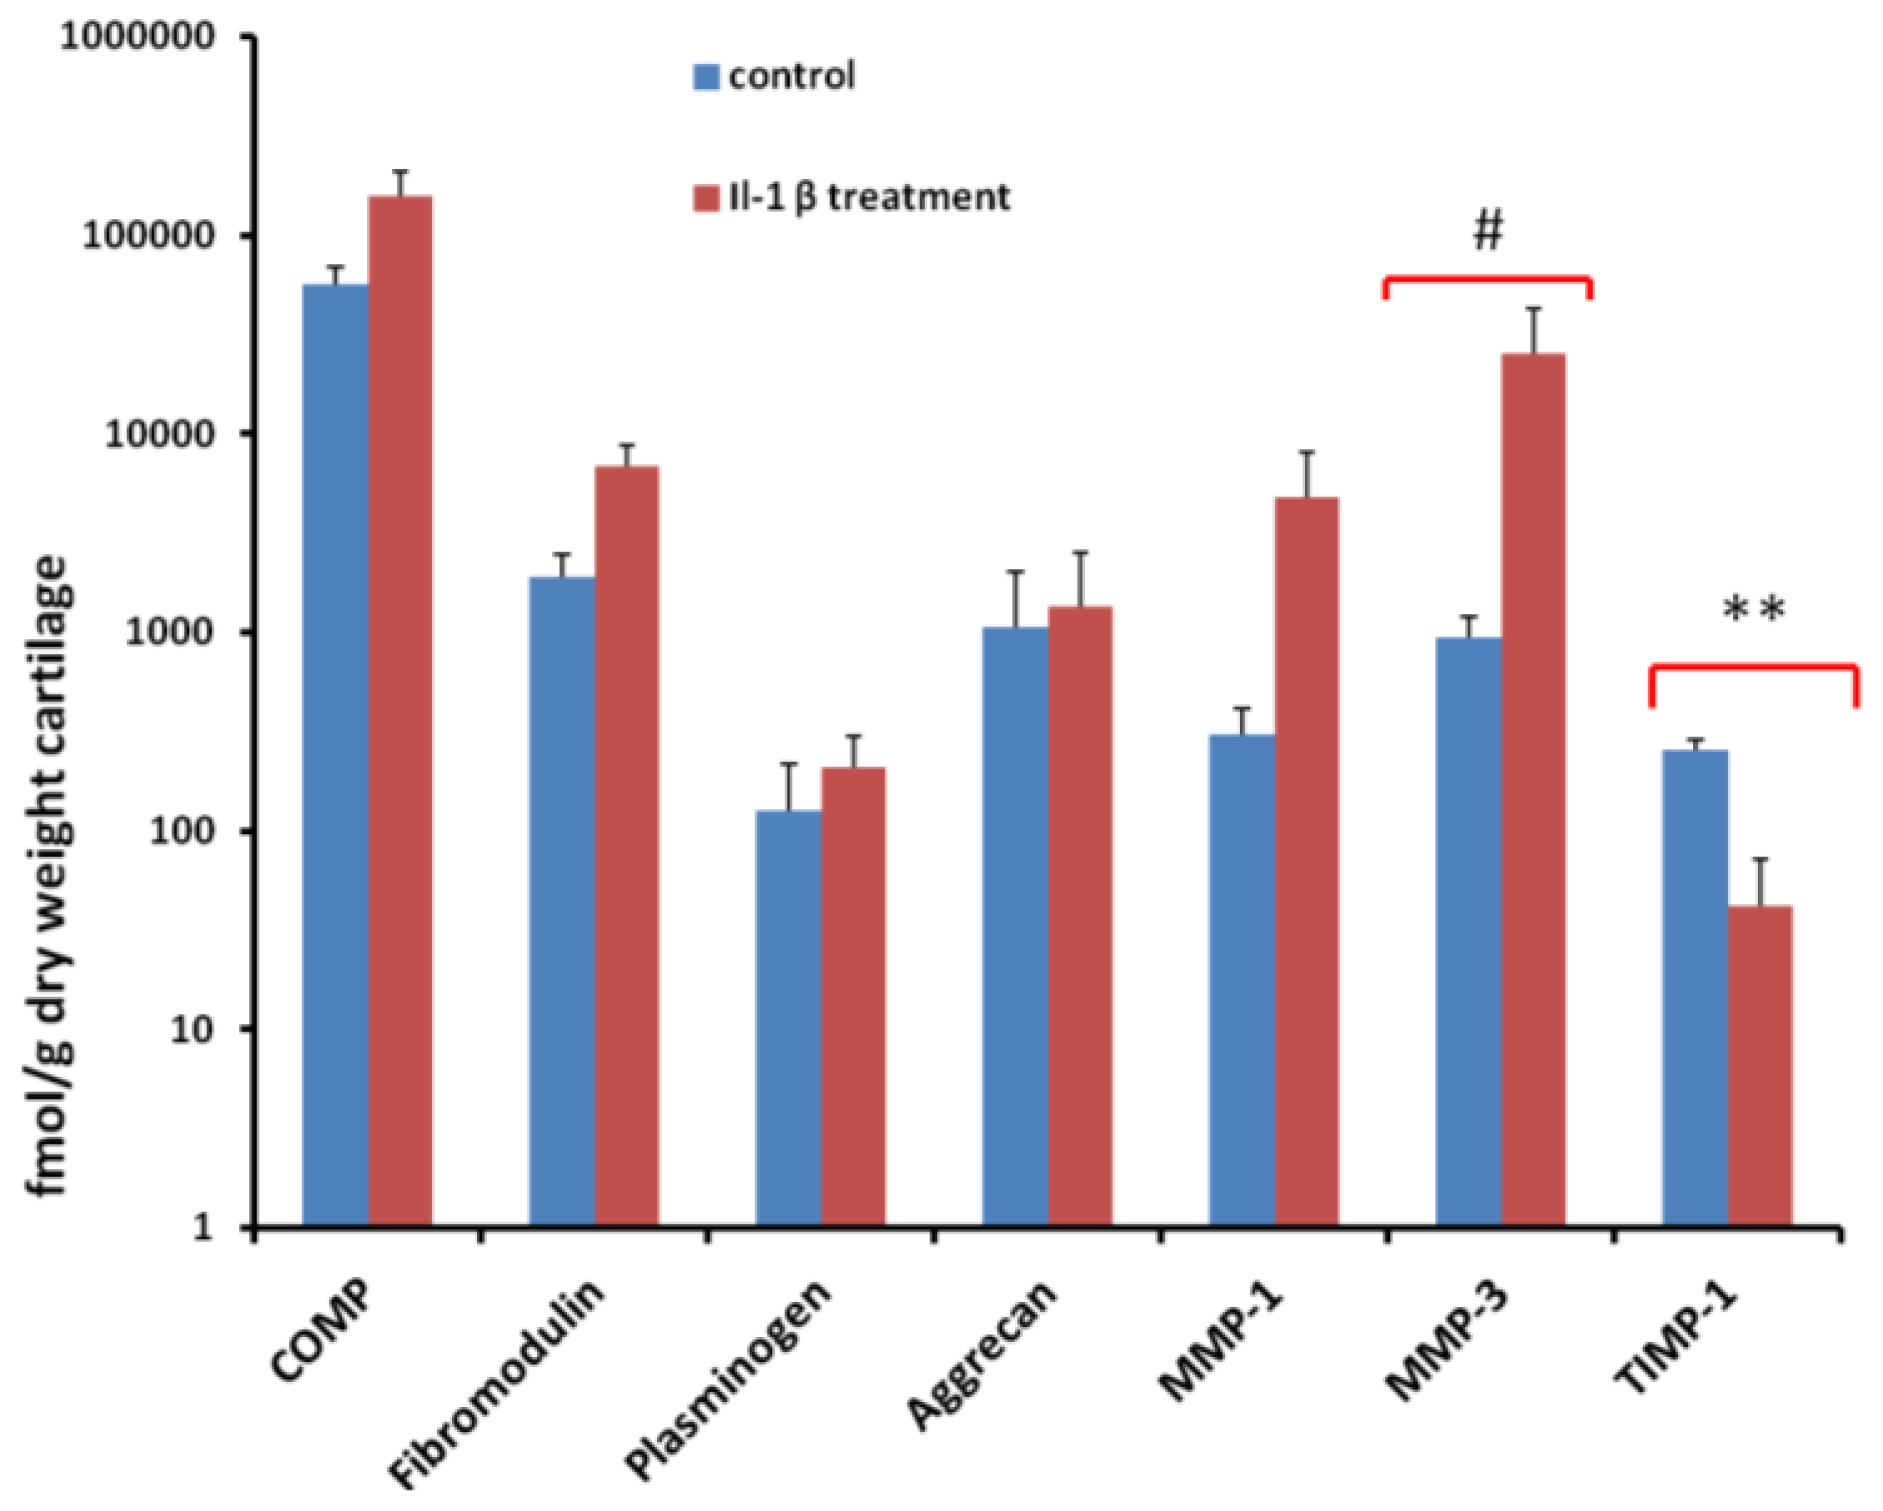
2.5. Quantification of Proteins Using SRM
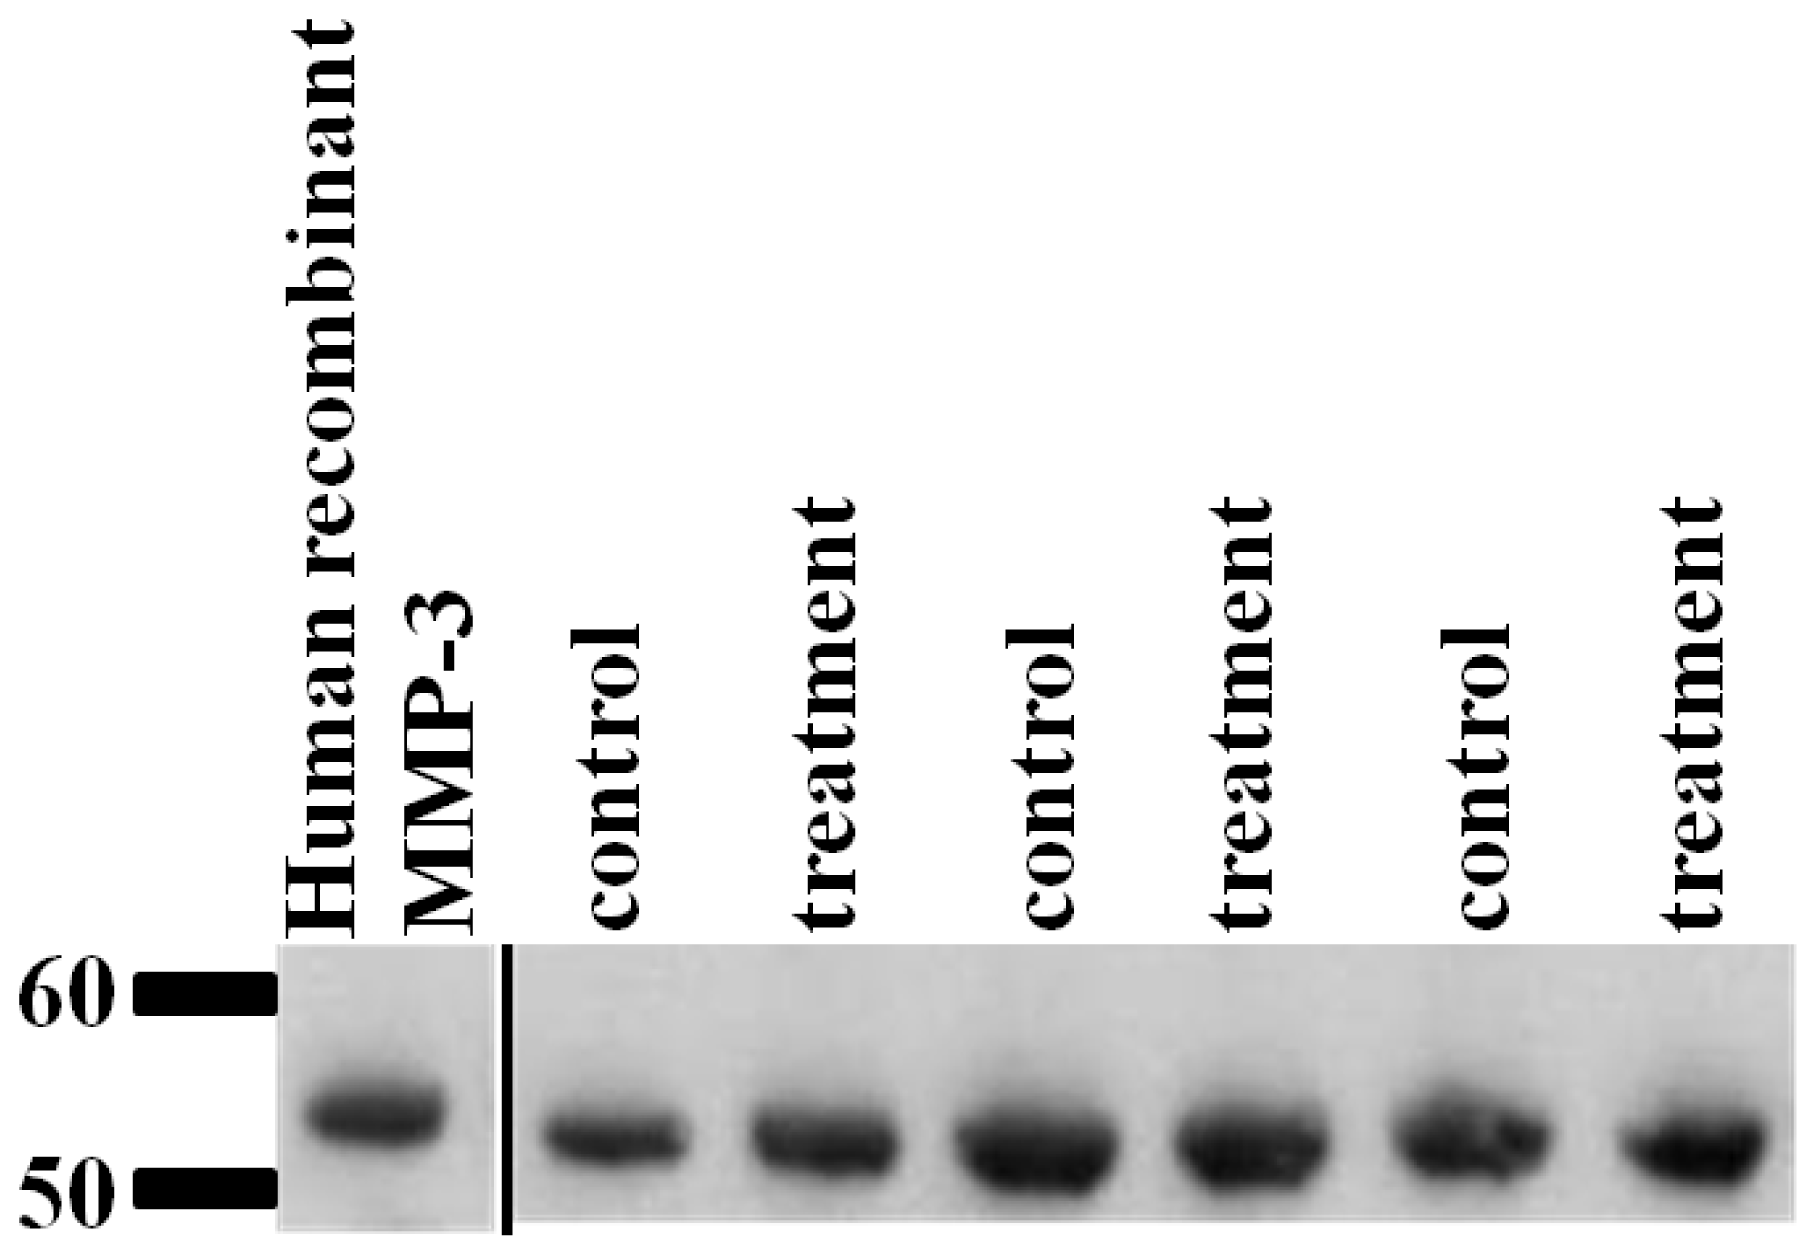
2.6. Validation of SRM Results for MMP-3 Using Immunoblotting
3. Discussion
4. Experimental Section
4.1. Peptide Selection, Preparation and Purification of QconCAT
4.2. Characterisation of QconCAT
4.3. Cartilage Isolation and Explant Culture
4.4. 1-D SDS PAGE Separation and In-Gel Trypsin Digestion
4.5. Protein Identification of In-Gel Digests by Linear Ion Trap Quadruple (LTQ) Velos Mass Spectrometry
4.6. In-Solution Tryptic Digestion and Mass Spectrometry Using Linear Ion-Trap Orbitrap Mass Spectrometer (LTQ-Orbitrap Velos)
4.7. Peptide Identification
4.8. Selected Reaction Monitoring Optimization
4.9. Protein Digestion and Quantification
4.10. Label-Free Peptide Quantification
4.11. Gene Ontology
4.12. Western Blot Analysis Validation
4.13. Statistical Analysis
5. Conclusions


| Highest Mean Condition | Accession | Description | Max Fold Change | ANOVA (p) |
|---|---|---|---|---|
| Treatment | P09341 | Growth-regulated alpha protein | 58.99 | 0.01 |
| P08254 | Stromelysin-1 | 5.70 | 0.02 | |
| Q61PR1 | LYR motif-containing protein 5 | 3.89 | 0.03 | |
| P01876 | Ig alpha-1 chain C region | 3.06 | 0.00 | |
| Control | P36222 | Chitinase-3-like protein 1 | 9.64 | 0.04 |
| P08571 | Monocyte differentiation antigen CD14 | 4.53 | 0.01 | |
| Q14UF6 | Decay-accelerating factor splicing variant 1 | 4.11 | 0.02 | |
| Q5H9A7 | TIMP metalloproteinase inhibitor 1 | 3.09 | 0.03 | |
| P01034 | Cystatin-C | 2.40 | 0.05 | |
| Protein | Q-peptide amino acid sequence | Peptide classification |
|---|---|---|
| Aggrecan | EVVLLVATEGR | A |
| Cartilage oligomeric matrix protein | DTDLDGFPDEK | A |
| Cartilage oligomeric matrix protein | SSTGPGEQLR | A |
| Fibromodulin | IPPVNTNLENLYLQGNR | A |
| Matrix metalloproteinase-1 | SQNPVQPIGPQTPK | A |
| Matrix metalloproteinase-3 | IVNYTPDLPK | A |
| Metalloproteinase inhibitor 1 | GFQALGDAADIR | A |
| Plasminogen | EAQLPVIENK | A |
| ADAMTS1 | DAEHYDTAILFTR | B |
| ADAMTS1 | GPEVTSNAALTLR | B |
| ADAMTS4 | FVETLVVADDK | B |
| ADAMTS4 | NPVSLVVTR | B |
| ADAMTS5 | LPLAAVGPAATPAQDK | B |
| ADAMTS5 | GLVQNIDQLYSGGGK | B |
| Aggrecan | LEGEVFFATR | B |
| Cathepsin D | LVDQNIFSFYLSR | B |
| Cathepsin D | YSQAVPAVTEGPIPEVLK | B |
| Cathepsin K | SNDTLYIPEWEGR | B |
| Link protein | GGSDSDASLVITDLTLEDYGR | B |
| Metalloproteinase inhibitor 1 | FVGTPEVNQTTLYQR | B |
| Metalloproteinase inhibitor 3 | WDQLTLSQR | B |
| Metalloproteinase inhibitor 4 | GHLPLR | B |
| Cathepsin K | VGPVSVAIDASLTSFQFYSK | C |
| Fibromodulin | LYLDHNNLTR | C |
| Link Protein | FYYLIHPTK | C |
| Matrix metalloproteinase-1 | DGFFYFFHGTR | C |
| Matrix metalloproteinase-13 | LHPQQVDAELFLTK | C |
| Metalloproteinase inhibitor 3 | YQYLLTGR | C |
| Metalloproteinase inhibitor 4 | LEANSQK | C |
| Plasminogen | HSIFTPETNPR | C |
| Peptide order | Protein | Protein Accession | Q-peptide amino acid sequence |
|---|---|---|---|
| 1 | MMP16 | ENSP00000286611 | GIPESPQGAFVHK |
| 2 | MMP16 | ENSP00000286611 | EGHSPPDDVDIVIK |
| 3 | CathepsinD | ENSP00000236671 | LVDQNIFSFYLSR |
| 4 | COMP | ENSP00000222271 | DTDLDGFPDEK |
| 5 | Col11a2 | ENSP00000372565 | LGVPGLPGYPGR |
| 6 | Fibromodulin | ENSP00000347041 | IPPVNTNLEN LYLQGNR |
| 7 | MMP3 | ENSP00000299855 | IVNYTPDLPK |
| 8 | ADAMTS1 | ENSP00000284984 | DAEHYDTAILFTR |
| 9 | ADAMTS4 | ENSP00000356975 | FVETLVVADDK |
| 10 | CathepsinD | ENSP00000236671 | YSQAVPAVTEGPIPEVLK |
| 11 | Link protein | ENSP00000274341 | GGSDSDASLVITDLTLEDYGR |
| 12 | MMP3 | ENSP00000299855 | YLENYYDLK |
| 13 | ADAMTS5 | ENSP00000284987 | GLVQNIDQLYSGGGK |
| 14 | TIMP3 | ENSP00000266085 | WDQLTLSQR |
| 15 | TIMP4 | ENSP00000287814 | GHLPLR |
| 16 | CathepsinK | ENSP00000271651 | SNDTLYIPEWEGR |
| 17 | Link Protein | ENSP00000274341 | FYYLIHPTK |
| 18 | COMP | ENSP00000222271 | SSTGPGEQLR |
| 19 | Plasminogen | ENSP00000308938 | HSIFTPETNPR |
| 20 | MMP13 | ENSP00000260302 | LHPQQVDAELFLTK |
| 21 | MMP13 | ENSP00000260302 | SYYHPTNLAGILK |
| 22 | Plasminogen | ENSP00000308938 | EAQLPVIENK |
| 23 | Col9a1 | ENSP00000349790 | VVGSATLQVAYK |
| 24 | TIMP4 | ENSP00000287814 | LEANSQK |
| 25 | MMP1 | ENSP00000322788 | DGFFYFFHGTR |
| 26 | ADAMTS1 | ENSP00000284984 | GPEVTSNAALTLR |
| 27 | ADAMTS4 | ENSP00000356975 | NPVSLVVTR |
| 28 | Aggrecan | ENSP00000268134 | LEGEVFFATR |
| 29 | Fibromodulin | ENSP00000347041 | LYLDHNNLTR |
| 30 | TIMP1 | ENSP00000218388 | GFQALGDAADIR |
| 31 | TIMP1 | ENSP00000218388 | FVGTPEVNQTTLYQR |
| 32 | TIMP3 | ENSP00000266085 | YQYLLTGR |
| 33 | Col11a2 | ENSP00000372565 | VARPAQLSAPTR |
| 34 | ADAMTS5 | ENSP00000284987 | LPLAAVGPAATPAQDK |
| 35 | Aggrecan | ENSP00000268134 | EVVLLVATEGR |
| 36 | CathepsinK | ENSP00000271651 | VGPVSVAIDASLTSFQFYSK |
| 37 | Col2a1 | ENSP00000338213 | GAQGPPGATGFPGAAGR |
| 38 | Col2a1 | ENSP00000338213 | GPPGPQGAR |
| 39 | Col9a1 | ENSP00000349790 | GVQGEQGATGLPGVQGPPGR |
| 40 | MMP1 | ENSP00000322788 | SQNPVQPIGPQTPK |
Acknowledgments
Conflicts of Interest
References
- Mow, V.C.; Ratcliffe, A.; Poole, A.R. Cartilage and diarthrodial joints as paradigms for hierarchical materials and structures. Biomaterials 1992, 13, 67–97. [Google Scholar]
- Archer, C.W.; Francis-West, P. The chondrocyte. Int. J. Biochem. Cell Biol 2003, 35, 401–404. [Google Scholar]
- Poole, A.R.; Kojima, T.; Yasuda, T.; Mwale, F.; Kobayashi, M.; Laverty, S. Composition and structure of articular cartilage: A template for tissue repair. Clin. Orthop. Relat. Res 2001, 391, S26–S33. [Google Scholar]
- Wilson, R.; Whitelock, J.M.; Bateman, J.F. Proteomics makes progress in cartilage and arthritis research. In Matrix Biol; 2009; Volume 28, pp. 121–128. [Google Scholar]
- Iliopoulos, D.; Gkretsi, V.; Tsezou, A. Proteomics of osteoarthritic chondrocytes and cartilage. Expert Rev. Proteomics 2010, 7, 749–760. [Google Scholar]
- Irving, S.G.; Zipfel, P.F.; Balke, J.; McBride, O.W.; Morton, C.C.; Burd, P.R.; Siebenlist, U.; Kelly, K. Two inflammatory mediator cytokine genes are closely linked and variably amplified on chromosome 17q. Nucleic Acids Res 1990, 18, 3261–3270. [Google Scholar]
- Liu, Y.H.; Zhang, H.Y.; Zang, H.M.; Cheng, J.C.; Li, Y.M. Effects of kangfengshi granules on expressions of osteoprotegerin, RANKL and M-CSF in bone tissues of rats with collagen-induced arthritis. Zhong Xi Yi Jie He Xue Bao 2006, 4, 307–310. [Google Scholar]
- Stevens, A.L.; Wishnok, J.S.; Chai, D.H.; Grodzinsky, A.J.; Tannenbaum, S.R. A sodium dodecyl sulfate-polyacrylamide gel electrophoresis-liquid chromatography tandem mass spectrometry analysis of bovine cartilage tissue response to mechanical compression injury and the inflammatory cytokines tumor necrosis factor alpha and interleukin-1beta. Arthritis Rheum 2008, 58, 489–500. [Google Scholar]
- Catterall, J.B.; Rowan, A.D.; Sarsfield, S.; Saklatvala, J.; Wait, R.; Cawston, T.E. Development of a novel 2D proteomics approach for the identification of proteins secreted by primary chondrocytes after stimulation by IL-1 and oncostatin M. Rheumatology 2006, 45, 1101–1109. [Google Scholar]
- Ruiz-Romero, C.; Blanco, F.J. Proteomics role in the search for improved diagnosis, prognosis and treatment of osteoarthritis. Osteoarthr. Cartilage 2010, 18, 500–509. [Google Scholar]
- Wang, F.X.; Ma, Y.P.; Yang, C.L.; Zhao, P.M.; Yao, Y.; Jian, G.L.; Luo, Y.M.; Xia, G.X. Proteomic analysis of the sea-island cotton roots infected by wilt pathogen Verticillium dahliae. Proteomics 2011, 11, 4296–4309. [Google Scholar]
- Yan, J.; Liu, L.; Li, X.; Wang, F.; Zhu, T.; Yuan, P.; Zhang, Q. A potential use of collagen-hyaluronan-chondroitin sulfate tri-copolymer scaffold for cartilage tissue engineering. Zhongguo Xiu Fu Chong Jian Wai Ke Za Zhi 2006, 20, 130–133. [Google Scholar]
- Fosang, A.J.; Rogerson, F.M.; East, C.J.; Stanton, H. ADAMTS-5: The story so far. Eur. Cells Mater 2008, 15, 11–26. [Google Scholar]
- Arner, E.C.; Hughes, C.E.; Decicco, C.P.; Caterson, B.; Tortorella, M.D. Cytokine-induced cartilage proteoglycan degradation is mediated by aggrecanase. Osteoarthr. Cartilage 1998, 6, 214–228. [Google Scholar]
- Goldring, S.R.; Goldring, M.B. The role of cytokines in cartilage matrix degeneration in osteoarthritis. Clin. Orthop. Relat. Res 2004, 427, S27–S36. [Google Scholar]
- Song, R.H.; Tortorella, M.D.; Malfait, A.M.; Alston, J.T.; Yang, Z.; Arner, E.C.; Griggs, D.W. Aggrecan degradation in human articular cartilage explants is mediated by both ADAMTS-4 and ADAMTS-5. Arthritis Rheum 2007, 56, 575–585. [Google Scholar]
- Jiang, T.; Zhan, Y.; Sun, M.; Liu, S.; Zang, S.; Ma, Y.; Xin, Y. The novel responses of ethambutol against Mycobacterium smegmatis mc(2)155 Revealed by proteomics analysis. Curr. Microbiol 2011, 62, 341–345. [Google Scholar]
- Ismaiel, S.; Atkins, R.M.; Pearse, M.F.; Dieppe, P.A.; Elson, C.J. Susceptibility of normal and arthritic human articular cartilage to degradative stimuli. Br. J. Rheumatol 1992, 31, 369–373. [Google Scholar]
- De Ceuninck, F.; Marcheteau, E.; Berger, S.; Caliez, A.; Dumont, V.; Raes, M.; Anract, P.; Leclerc, G.; Boutin, J.A.; Ferry, G. Assessment of some tools for the characterization of the human osteoarthritic cartilage proteome. J. Biomol. Tech 2005, 16, 256–265. [Google Scholar]
- Haglund, L.; Bernier, S.M.; Onnerfjord, P.; Recklies, A.D. Proteomic analysis of the LPS-induced stress response in rat chondrocytes reveals induction of innate immune response components in articular cartilage. Matrix Biol 2008, 27, 107–118. [Google Scholar]
- Hermansson, M.; Sawaji, Y.; Bolton, M.; Alexander, S.; Wallace, A.; Begum, S.; Wait, R.; Saklatvala, J. Proteomic analysis of articular cartilage shows increased type II collagen synthesis in osteoarthritis and expression of inhibin betaA (activin A), a regulatory molecule for chondrocytes. J. Biol. Chem 2004, 279, 43514–43521. [Google Scholar]
- Polacek, M.; Bruun, J.A.; Johansen, O.; Martinez, I. Differences in the secretome of cartilage explants and cultured chondrocytes unveiled by SILAC technology. J. Orthop. Res 2010, 28, 1040–1049. [Google Scholar]
- Sun, L.; Tao, D.; Han, B.; Ma, J.; Zhu, G.; Liang, Z.; Shan, Y.; Zhang, L.; Zhang, Y. Ionic liquid 1-butyl-3-methyl imidazolium tetrafluoroborate for shotgun membrane proteomics. Anal. Bioanal Chem 2011, 399, 3387–3397. [Google Scholar]
- Gillespie, C.M.; Merkel, A.L.; Martin, A.A. Effects of insulin-like growth factor-I and LR3IGF-I on regional blood flow in normal rats. J. Endocrinol 1997, 155, 351–358. [Google Scholar]
- Gerber, S.A.; Rush, J.; Stemman, O.; Kirschner, M.W.; Gygi, S.P. Absolute quantification of proteins and phosphoproteins from cell lysates by tandem MS. Proc. Natl. Acad. Sci. USA 2003, 100, 6940–6945. [Google Scholar]
- Beynon, R.J.; Doherty, M.K.; Pratt, J.M.; Gaskell, S.J. Multiplexed absolute quantification in proteomics using artificial QCAT proteins of concatenated signature peptides. Nat. Methods 2005, 2, 587–589. [Google Scholar]
- Rivers, J.; Simpson, D.M.; Robertson, D.H.; Gaskell, S.J.; Beynon, R.J. Absolute multiplexed quantitative analysis of protein expression during muscle development using QconCAT. Mol. Cell. Proteomics 2007, 6, 1416–1427. [Google Scholar]
- Pratt, J.M.; Simpson, D.M.; Doherty, M.K.; Rivers, J.; Gaskell, S.J.; Beynon, R.J. Multiplexed absolute quantification for proteomics using concatenated signature peptides encoded by QconCAT genes. Nat. Protoc 2006, 1, 1029–1043. [Google Scholar]
- Skioldebrand, E.; Heinegard, D.; Eloranta, M.L.; Nilsson, G.; Dudhia, J.; Sandgren, B.; Ekman, S. Enhanced concentration of COMP (cartilage oligomeric matrix protein) in osteochondral fractures from racing Thoroughbreds. J. Orthop. Res 2005, 23, 156–163. [Google Scholar]
- Garvican, E.R.; Vaughan-Thomas, A.; Redmond, C.; Clegg, P.D. MT3-MMP (MMP-16) is downregulated by in vitro cytokine stimulation of cartilage, but unaltered in naturally occurring equine osteoarthritis and osteochondrosis. Connect. Tissue Res 2008, 49, 62–67. [Google Scholar]
- Simpson, D.M.; Beynon, R.J. QconCATs: Design and expression of concatenated protein standards for multiplexed protein quantification. Anal. Bioanal. Chem 2012, 404, 977–989. [Google Scholar]
- Carroll, K.M.; Simpson, D.M.; Eyers, C.E.; Knight, C.G.; Brownridge, P.; Dunn, W.B.; Winder, C.L.; Lanthaler, K.; Pir, P.; Malys, N.; et al. Absolute quantification of the glycolytic pathway in yeast: Deployment of a complete QconCAT approach. Mol. Cell. Proteomics 2011, 10. [Google Scholar] [CrossRef]
- Castro-Borges, W.; Simpson, D.M.; Dowle, A.; Curwen, R.S.; Thomas-Oates, J.; Beynon, R.J.; Wilson, R.A. Abundance of tegument surface proteins in the human blood fluke Schistosoma mansoni determined by QconCAT proteomics. J. Proteomics 2011, 74, 1519–1533. [Google Scholar]
- Bislev, S.L.; Kusebauch, U.; Codrea, M.C.; Beynon, R.J.; Harman, V.M.; Rontved, C.M.; Aebersold, R.; Moritz, R.L.; Bendixen, E. Quantotypic properties of QconCAT peptides targeting bovine host response to Streptococcus uberis. J. Proteome Res 2012, 11, 1832–1843. [Google Scholar]
- Ding, C.; Li, Y.; Kim, B.J.; Malovannaya, A.; Jung, S.Y.; Wang, Y.; Qin, J. Quantitative analysis of cohesin complex stoichiometry and SMC3 modification-dependent protein interactions. J. Proteome Res 2011, 10, 3652–3659. [Google Scholar]
- Bulstra, S.K.; Buurman, W.A.; Walenkamp, G.H.; van der Linden, A.J. Metabolic characteristics of in vitro cultured human chondrocytes in relation to the histopathologic grade of osteoarthritis. Clin. Orthop. Relat. Res 1989, 242, 294–302. [Google Scholar]
- Mankin, H.J.; Lippiello, L. Biochemical and metabolic abnormalities in articular cartilage from osteo-arthritic human hips. J. Bone Joint Surg. Am 1970, 52, 424–434. [Google Scholar]
- Brownridge, P.; Holman, S.W.; Gaskell, S.J.; Grant, C.M.; Harman, V.M.; Hubbard, S.J.; Lanthaler, K.; Lawless, C.; O’Cualain, R.; Sims, P.; et al. Global absolute quantification of a proteome: Challenges in the deployment of a QconCAT strategy. Proteomics 2011, 11, 2957–2970. [Google Scholar]
- MacLean, B.; Tomazela, D.M.; Shulman, N.; Chambers, M.; Finney, G.L.; Frewen, B.; Kern, R.; Tabb, D.L.; Liebler, D.C.; MacCoss, M.J. Skyline: An open source document editor for creating and analyzing targeted proteomics experiments. Bioinformatics 2010, 26, 966–968. [Google Scholar]
- Polacek, M.; Bruun, J.A.; Johansen, O.; Martinez, I. Differences in the secretome of cartilage explants and cultured chondrocytes unveiled by SILAC technology. J. Orthop. Res 2010, 28, 1040–1049. [Google Scholar]
- Clutterbuck, A.L.; Smith, J.R.; Allaway, D.; Harris, P.; Liddell, S.; Mobasheri, A. High throughput proteomic analysis of the secretome in an explant model of articular cartilage inflammation. J. Proteomics 2011, 74, 704–715. [Google Scholar]
- MacDonald, M.H.; Stover, S.M.; Willits, N.H.; Benton, H.P. Regulation of matrix metabolism in equine cartilage explant cultures by interleukin 1. Am. J. Vet. Res 1992, 53, 2278–2285. [Google Scholar]
- Goldring, M.B.; Otero, M.; Plumb, D.A.; Dragomir, C.; Favero, M.; El Hachem, K.; Hashimoto, K.; Roach, H.I.; Olivotto, E.; Borzi, R.M.; et al. Roles of inflammatory and anabolic cytokines in cartilage metabolism: Signals and multiple effectors converge upon MMP-13 regulation in osteoarthritis. Eur. Cell. Mater 2011, 21, 202–220. [Google Scholar]
- Forsyth, C.B.; Pulai, J.; Loeser, R.F. Fibronectin fragments and blocking antibodies to alpha2beta1 and alpha5beta1 integrins stimulate mitogen-activated protein kinase signaling and increase collagenase 3 (matrix metalloproteinase 13) production by human articular chondrocytes. Arthritis Rheum 2002, 46, 2368–2376. [Google Scholar]
- Peffers, M.P. Proteomic and Transcriptomic Signatures in Cartilage Ageing and Disease. Ph.D. Thesis, University of Liverpool, Liverpool, UK, 2013. [Google Scholar]
- Huang da, W.; Sherman, B.T.; Lempicki, R.A. Systematic and integrative analysis of large gene lists using DAVID bioinformatics resources. Nat. Protoc 2009, 4, 44–57. [Google Scholar]
- Buckland, J. Osteoarthritis: Complement-mediated inflammation in OA progression. Nat. Rev. Rheumatol 2012, 8. [Google Scholar] [CrossRef]
- Ding, L.; Guo, D.; Homandberg, G.A. Fibronectin fragments mediate matrix metalloproteinase upregulation and cartilage damage through proline rich tyrosine kinase 2, c-src, NF-kappa B and protein kinase Cdelta. Osteoarthr. Cartilage 2009, 17, 1385–1392. [Google Scholar]
- Fernandes, J.C.; Martel-Pelletier, J.; Pelletier, J.P. The role of cytokines in osteoarthritis pathophysiology. Biorheology 2002, 39, 237–246. [Google Scholar]
- Davies, M.E.; Horner, A.; Loveland, B.E.; McKenzie, I.F. Upregulation of complement regulators MCP (CD46), DAF (CD55) and protectin (CD59) in arthritic joint disease. Scand. J. Rheumatol 1994, 23, 316–321. [Google Scholar]
- Geyer, M.; Grassel, S.; Straub, R.H.; Schett, G.; Dinser, R.; Grifka, J.; Gay, S.; Neumann, E.; Muller-Ladner, U. Differential transcriptome analysis of intraarticular lesional vs. intact cartilage reveals new candidate genes in osteoarthritis pathophysiology. Osteoarthr. Cartilage 2009, 17, 328–335. [Google Scholar]
- Hossain, M.; Kaleta, D.T.; Robinson, E.W.; Liu, T.; Zhao, R.; Page, J.S.; Kelly, R.T.; Moore, R.J.; Tang, K.; Camp, D.G., II; et al. Enhanced sensitivity for selected reaction monitoring mass spectrometry-based targeted proteomics using a dual stage electrodynamic ion funnel interface. Mol. Cell. Proteomics 2011, 10. [Google Scholar] [CrossRef]
- Tetlow, L.C.; Adlam, D.J.; Woolley, D.E. Matrix metalloproteinase and proinflammatory cytokine production by chondrocytes of human osteoarthritic cartilage: assoCiations with degenerative changes. Arthritis Rheum 2001, 44, 585–594. [Google Scholar]
- Goldring, M.B. Immortalization of human articular chondrocytes for generation of stable, differentiated cell lines. Methods Mol. Med 2004, 100, 23–36. [Google Scholar]
- Aigner, T.; Fundel, K.; Saas, J.; Gebhard, P.M.; Haag, J.; Weiss, T.; Zien, A.; Obermayr, F.; Zimmer, R.; Bartnik, E. Large-scale gene expression profiling reveals major pathogenetic pathways of cartilage degeneration in osteoarthritis. Arthritis Rheum 2006, 54, 3533–3544. [Google Scholar]
- Burrage, P.S.; Mix, K.S.; Brinckerhoff, C.E. Matrix metalloproteinases: Role in arthritis. Front. Biosci 2006, 11, 529–543. [Google Scholar]
- Wilson, R.; Belluoccio, D.; Little, C.B.; Fosang, A.J.; Bateman, J.F. Proteomic characterization of mouse cartilage degradation in vitro. Arthritis Rheum. 2008, 58, 3120–3131. [Google Scholar]
- Halasz, K.; Kassner, A.; Morgelin, M.; Heinegard, D. COMP acts as a catalyst in collagen fibrillogenesis. J. Biol. Chem 2007, 282, 31166–31173. [Google Scholar]
- Chen, F.H.; Thomas, A.O.; Hecht, J.T.; Goldring, M.B.; Lawler, J. Cartilage oligomeric matrix protein/thrombospondin 5 supports chondrocyte attachment through interaction with integrins. J. Biol. Chem 2005, 280, 32655–32661. [Google Scholar]
- Zhang, G.; Sun, A.; Li, W.; Liu, T.; Su, Z. Mass spectrometric analysis of enzymatic digestion of denatured collagen for identification of collagen type. J. Chromatogr. A 2006, 1114, 274–277. [Google Scholar]
- Hoch, J.M.; Mattacola, C.G.; Medina McKeon, J.M.; Howard, J.S.; Lattermann, C. Serum cartilage oligomeric matrix protein (sCOMP) is elevated in patients with knee osteoarthritis: A systematic review and meta-analysis. Osteoarthr. Cartilage 2011, 19, 1396–1404. [Google Scholar]
- Saxne, T.; Heinegard, D. Cartilage oligomeric matrix protein: a novel marker of cartilage turnover detectable in synovial fluid and blood. Br. J. Rheumatol 1992, 31, 583–591. [Google Scholar]
- Heathfield, T.F.; Onnerfjord, P.; Dahlberg, L.; Heinegard, D. Cleavage of fibromodulin in cartilage explants involves removal of the N-terminal tyrosine sulfate-rich region by proteolysis at a site that is sensitive to matrix metalloproteinase-13. J. Biol. Chem 2004, 279, 6286–6295. [Google Scholar]
- Geng, Y.; McQuillan, D.; Roughley, P.J. SLRP interaction can protect collagen fibrils from cleavage by collagenases. Matrix Biol 2006, 25, 484–491. [Google Scholar]
- Monfort, J.; Tardif, G.; Reboul, P.; Mineau, F.; Roughley, P.; Pelletier, J.P.; Martel-Pelletier, J. Degradation of small leucine-rich repeat proteoglycans by matrix metalloprotease-13: Identification of a new biglycan cleavage site. Arthritis Res. Ther 2006, 8, R26. [Google Scholar]
- Sofat, N. Analysing the role of endogenous matrix molecules in the development of osteoarthritis. Int. J. Exp. Pathol 2009, 90, 463–479. [Google Scholar]
- Oleksyszyn, J.; Augustine, A.J. Plasminogen modulation of IL-1-stimulated degradation in bovine and human articular cartilage explants. The role of the endogenous inhibitors: PAI-1, alpha 2-antiplasmin, alpha 1-PI, alpha 2-macroglobulin and TIMP. Inflammation Res 1996, 45, 464–472. [Google Scholar]
- Collier, S.; Ghosh, P. The role of plasminogen in interleukin-1 mediated cartilage degradation. J. Rheumatol 1988, 15, 1129–37. [Google Scholar]
- Lange, V.; Picotti, P.; Domon, B.; Aebersold, R. Selected reaction monitoring for quantitative proteomics: A tutorial. Mol. Syst. Biol 2008, 4, 222. [Google Scholar]
- English, J.L.; Kassiri, Z.; Koskivirta, I.; Atkinson, S.J.; di Grappa, M.; Soloway, P.D.; Nagase, H.; Vuorio, E.; Murphy, G.; Khokha, R. Individual timp deficiencies differentially impact pro-MMP-2 activation. J. Biol. Chem 2006, 281, 10337–10346. [Google Scholar]
- Gomez, D.E.; Alonso, D.F.; Yoshiji, H.; Thorgeirsson, U.P. Tissue inhibitors of metalloproteinases: Structure, regulation and biological functions. Eur. J. Cell Biol 1997, 74, 111–122. [Google Scholar]
- Grad, S.; Lee, C.R.; Alini, M. Biology: Mechanisms of Cartilage Breakdown and Repair. In Basic Science, Clinical Repair and Reconstruction of Articular Cartilage Defects Basic Science, Current Status and Prospects; Zanasi, S., Brittberg, M., Marcacci, M., Eds.; Timeo Editore: Rastignano, Bologna, Italy, 2006; pp. 69–85. [Google Scholar]
- Kane, D.; Jensen, L.E.; Grehan, S.; Whitehead, A.S.; Bresnihan, B.; Fitzgerald, O. Quantitation of metalloproteinase gene expression in rheumatoid and psoriatic arthritis synovial tissue distal and proximal to the cartilage-pannus junction. J. Rheumatol 2004, 31, 1274–1280. [Google Scholar]
- Martel-Pelletier, J.; McCollum, R.; Fujimoto, N.; Obata, K.; Cloutier, J.M.; Pelletier, J.P. Excess of metalloproteases over tissue inhibitor of metalloprotease may contribute to cartilage degradation in osteoarthritis and rheumatoid arthritis. Lab. Invest 1994, 70, 807–815. [Google Scholar]
- Sadowski, T.; Steinmeyer, J. Effects of non-steroidal antiinflammatory drugs and dexamethasone on the activity and expression of matrix metalloproteinase-1, matrix metalloproteinase-3 and tissue inhibitor of metalloproteinases-1 by bovine articular chondrocytes. Osteoarthr. Cartilage 2001, 9, 407–415. [Google Scholar]
- McLean, L.; Hurst, J.L.; Gaskell, C.J.; Lewis, J.C.; Beynon, R.J. Characterization of cauxin in the urine of domestic and big cats. J. Chem. Ecol 2007, 33, 1997–2009. [Google Scholar]
© 2013 by the authors; licensee MDPI, Basel, Switzerland This article is an open access article distributed under the terms and conditions of the Creative Commons Attribution license (http://creativecommons.org/licenses/by/3.0/).
Share and Cite
Peffers, M.J.; Beynon, R.J.; Clegg, P.D. Absolute Quantification of Selected Proteins in the Human Osteoarthritic Secretome. Int. J. Mol. Sci. 2013, 14, 20658-20681. https://doi.org/10.3390/ijms141020658
Peffers MJ, Beynon RJ, Clegg PD. Absolute Quantification of Selected Proteins in the Human Osteoarthritic Secretome. International Journal of Molecular Sciences. 2013; 14(10):20658-20681. https://doi.org/10.3390/ijms141020658
Chicago/Turabian StylePeffers, Mandy J., Robert J. Beynon, and Peter D. Clegg. 2013. "Absolute Quantification of Selected Proteins in the Human Osteoarthritic Secretome" International Journal of Molecular Sciences 14, no. 10: 20658-20681. https://doi.org/10.3390/ijms141020658
APA StylePeffers, M. J., Beynon, R. J., & Clegg, P. D. (2013). Absolute Quantification of Selected Proteins in the Human Osteoarthritic Secretome. International Journal of Molecular Sciences, 14(10), 20658-20681. https://doi.org/10.3390/ijms141020658