miR-338-3p Is Down-Regulated by Hepatitis B Virus X and Inhibits Cell Proliferation by Targeting the 3′-UTR Region of CyclinD1

Abstract
:1. Introduction
2. Results
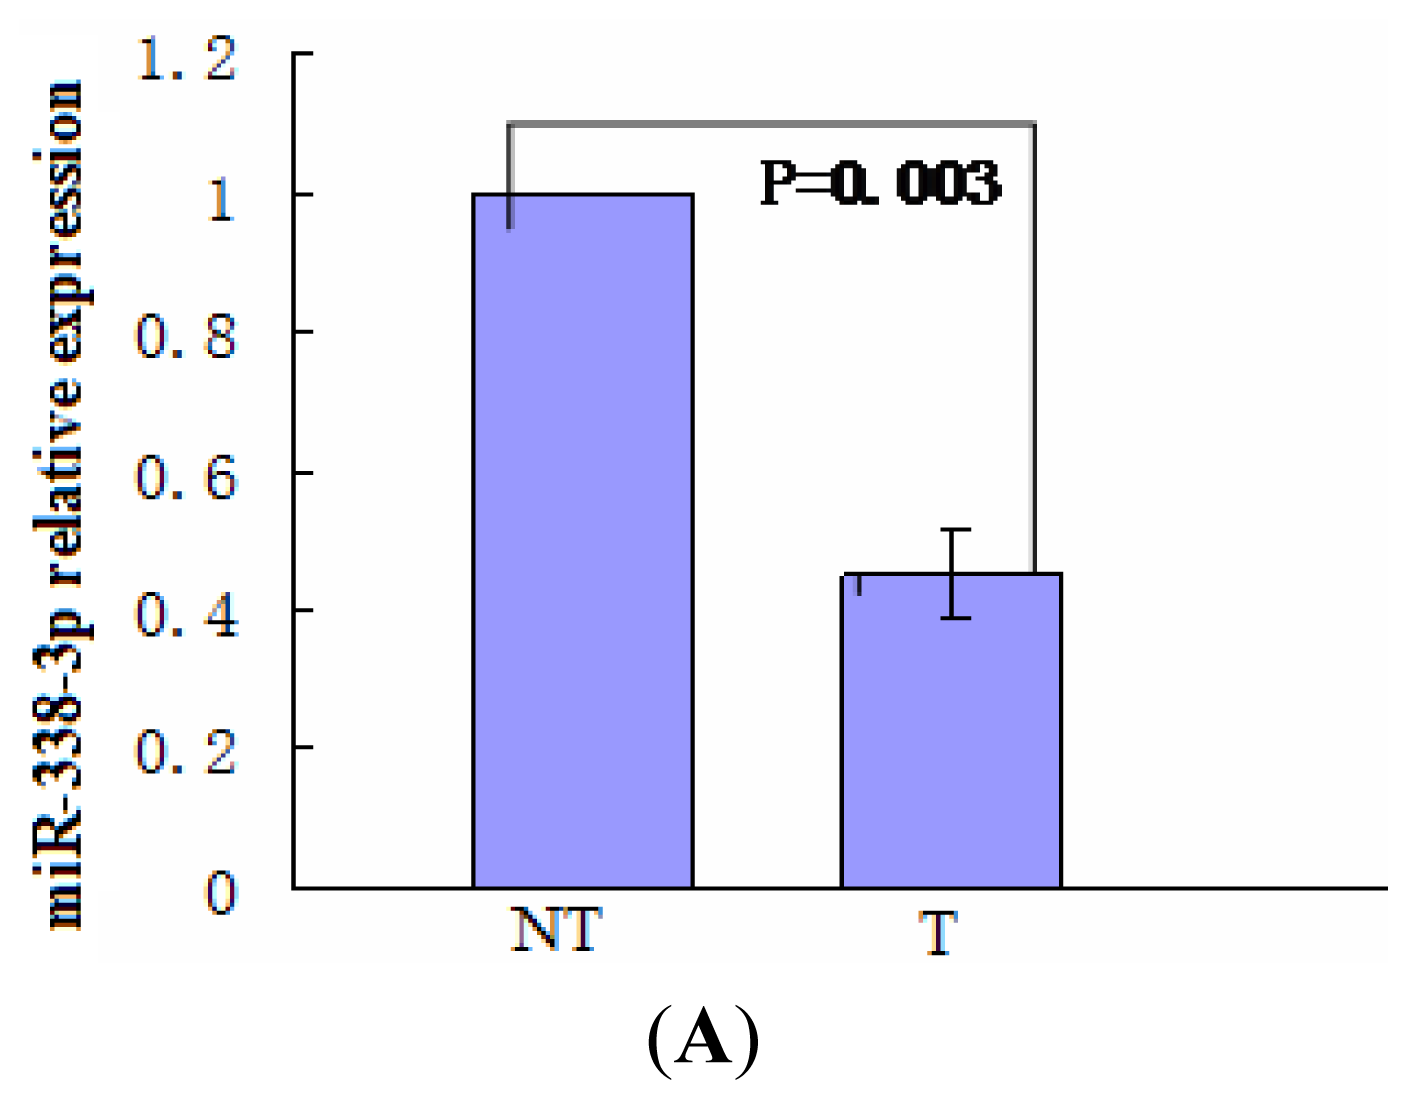
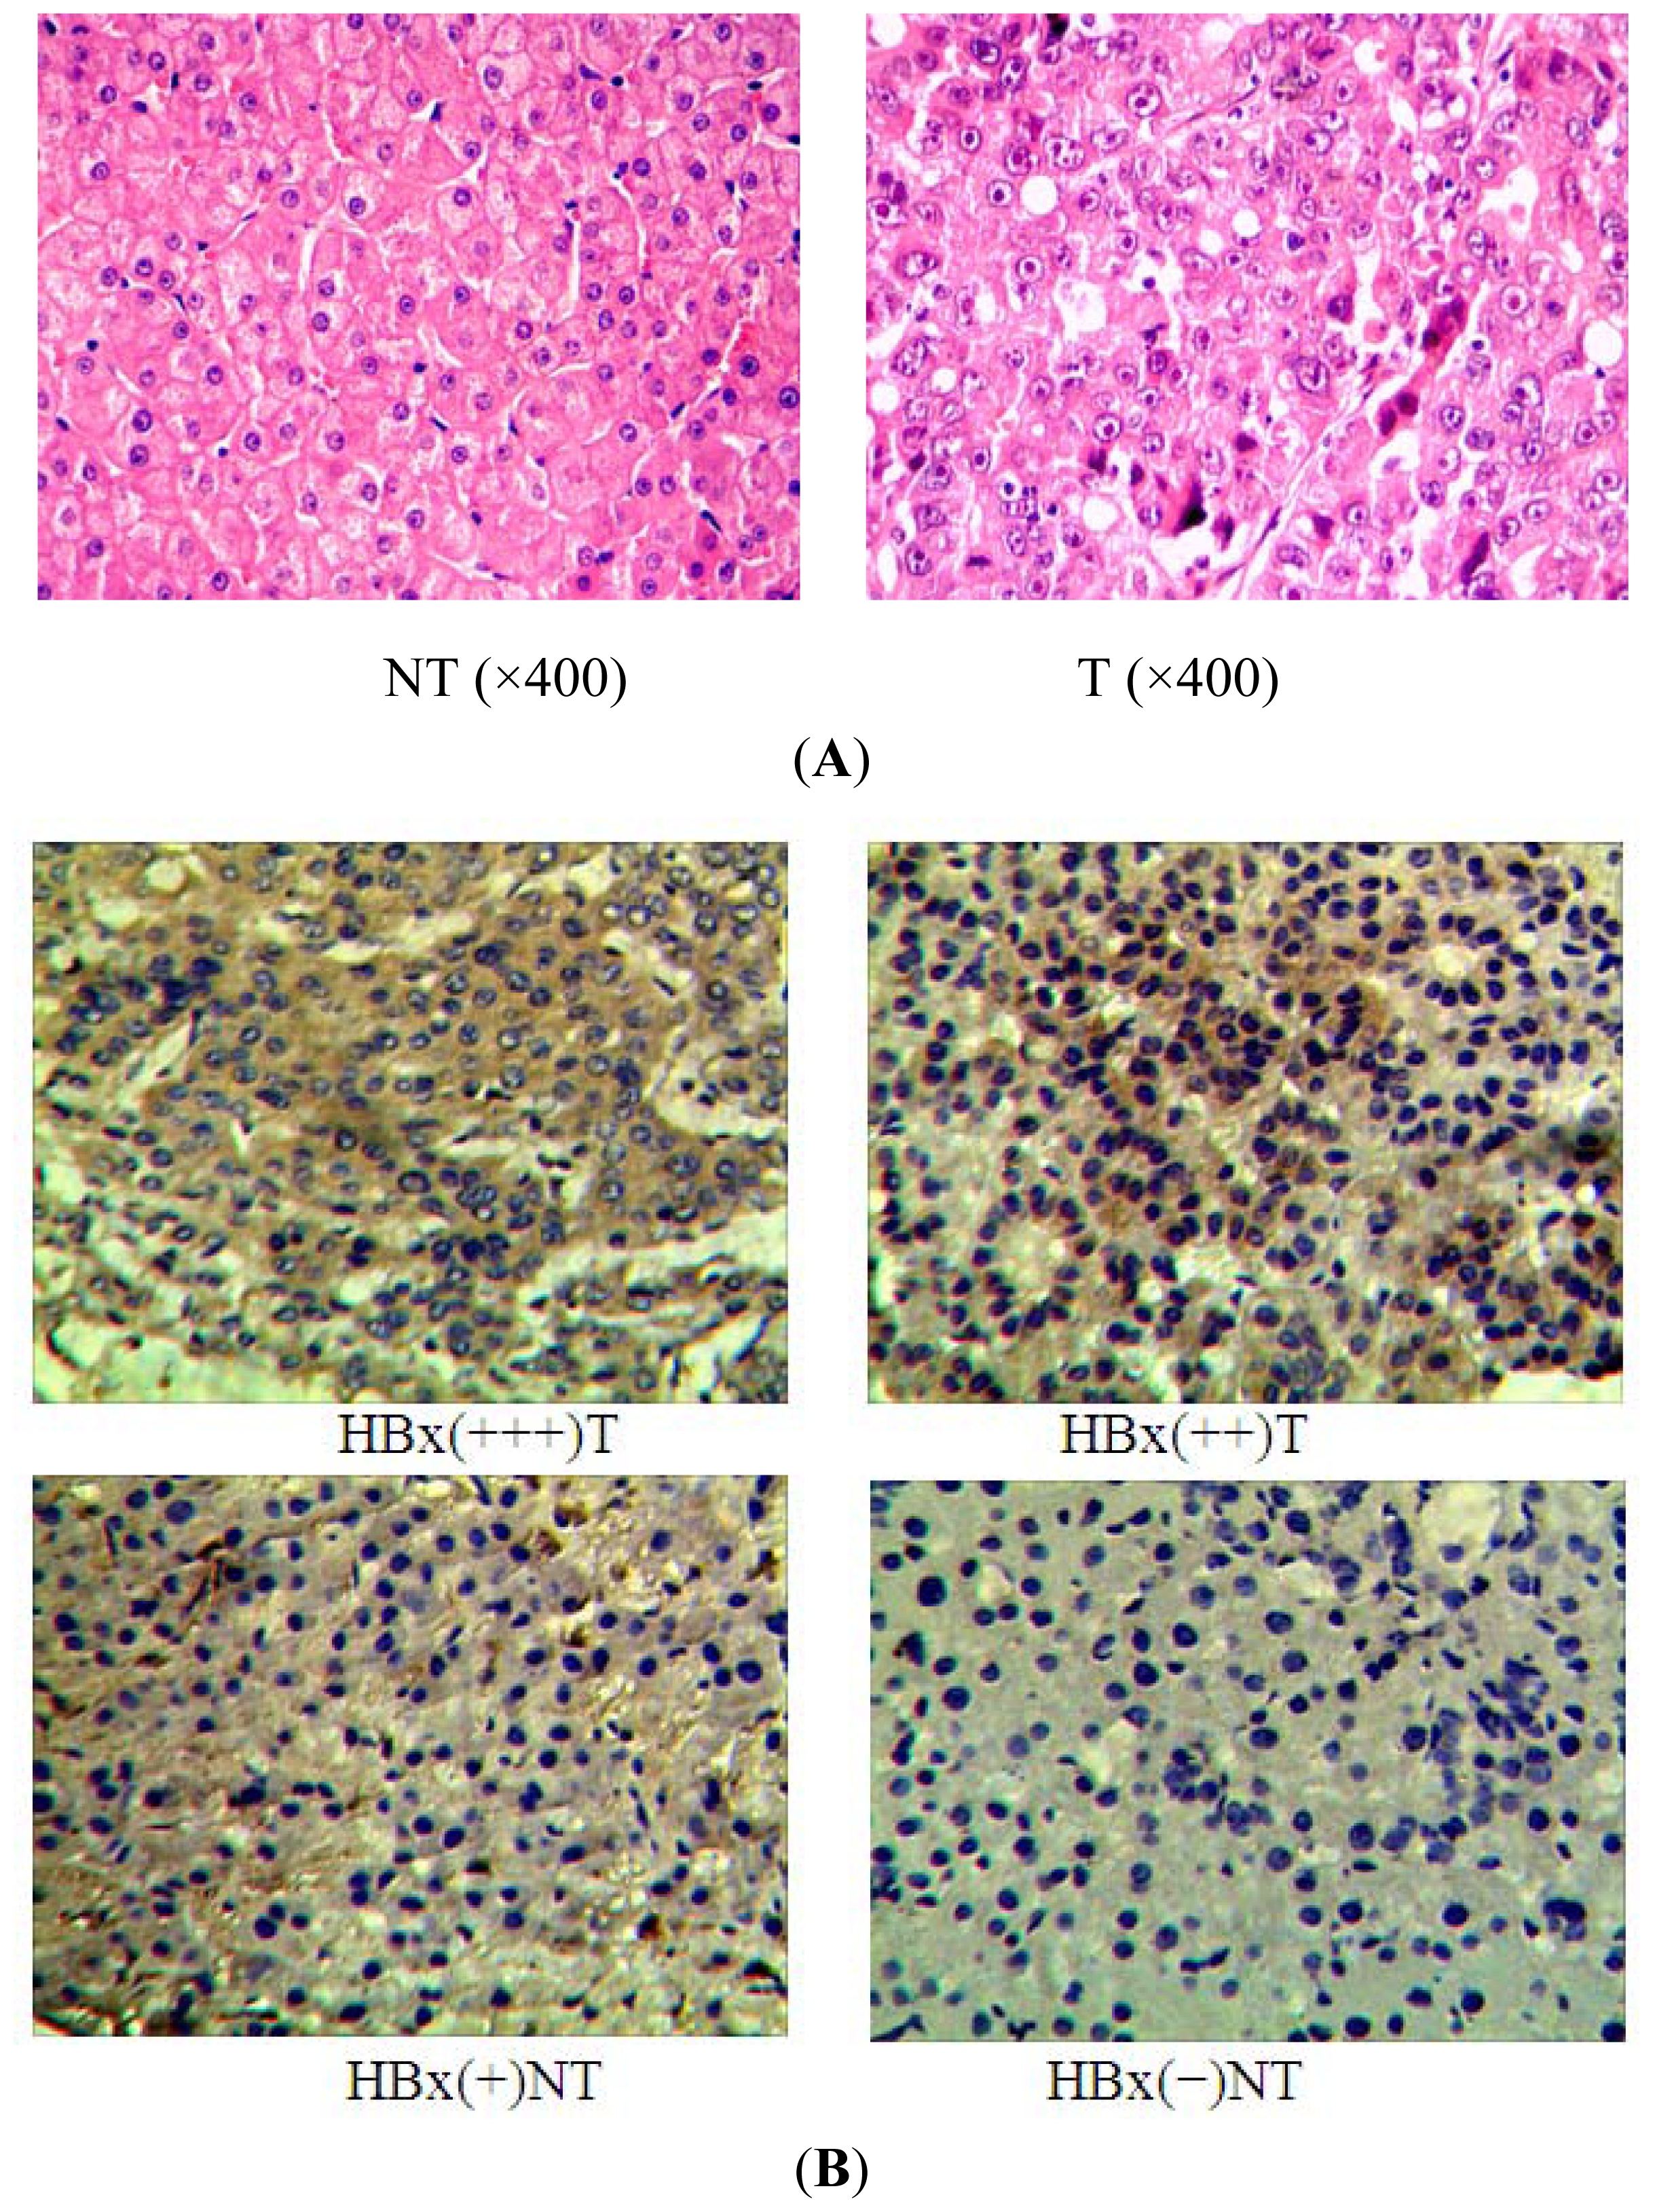
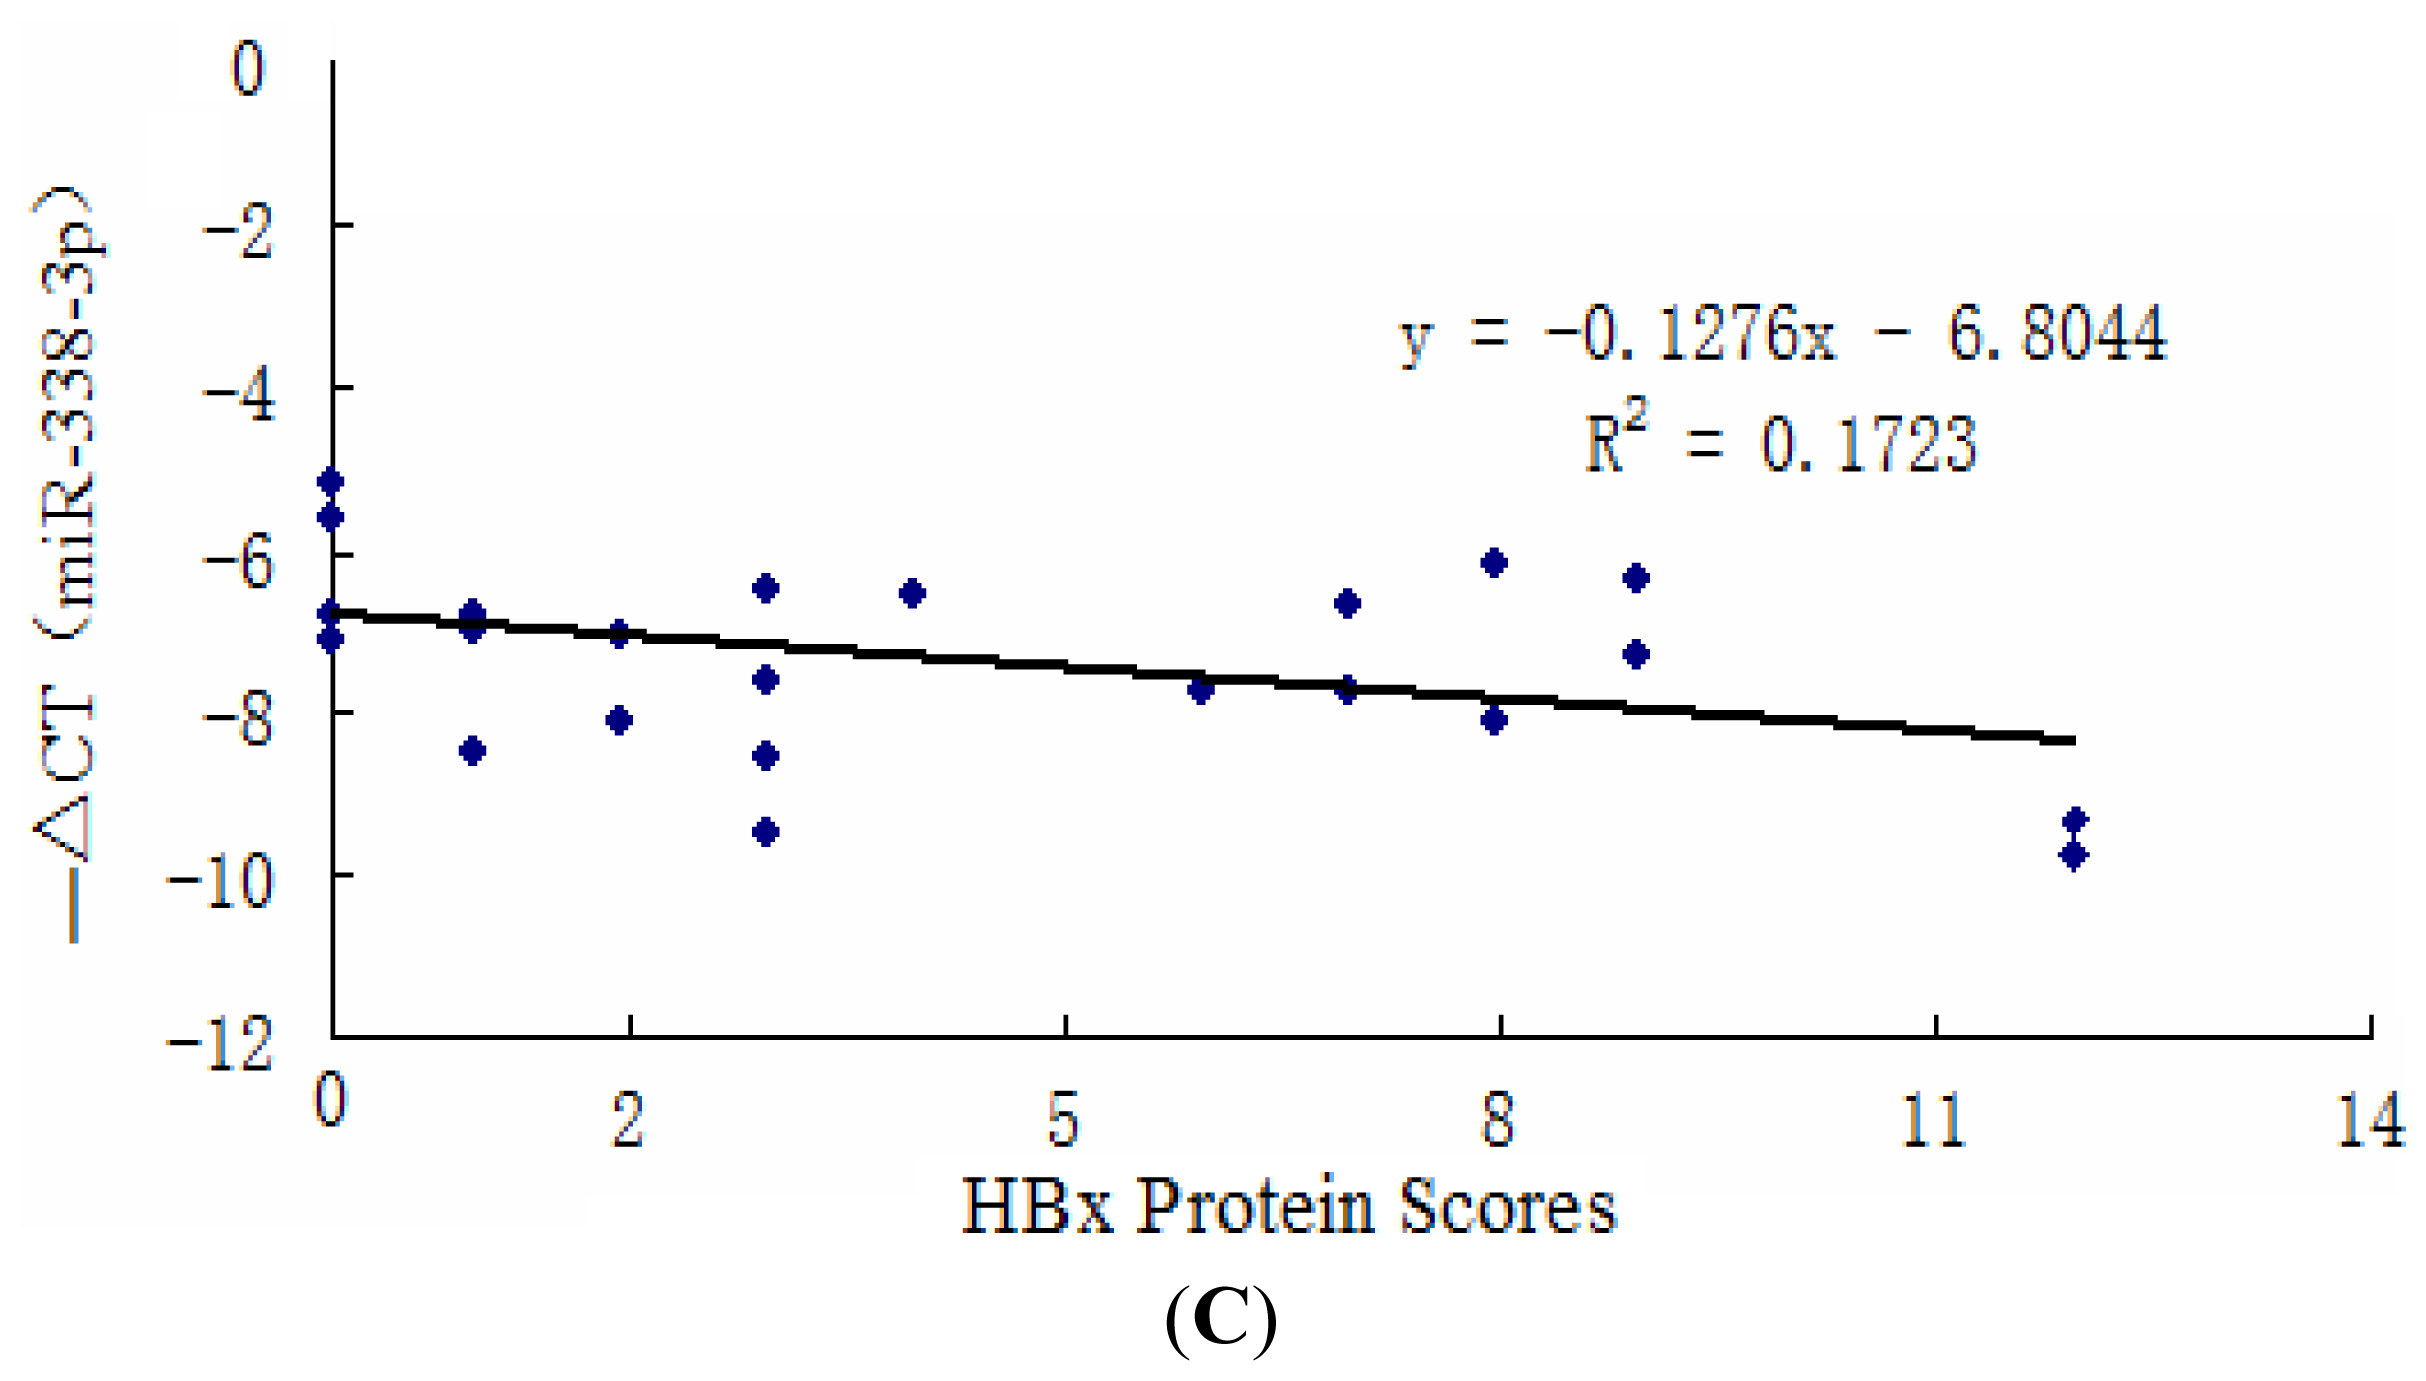
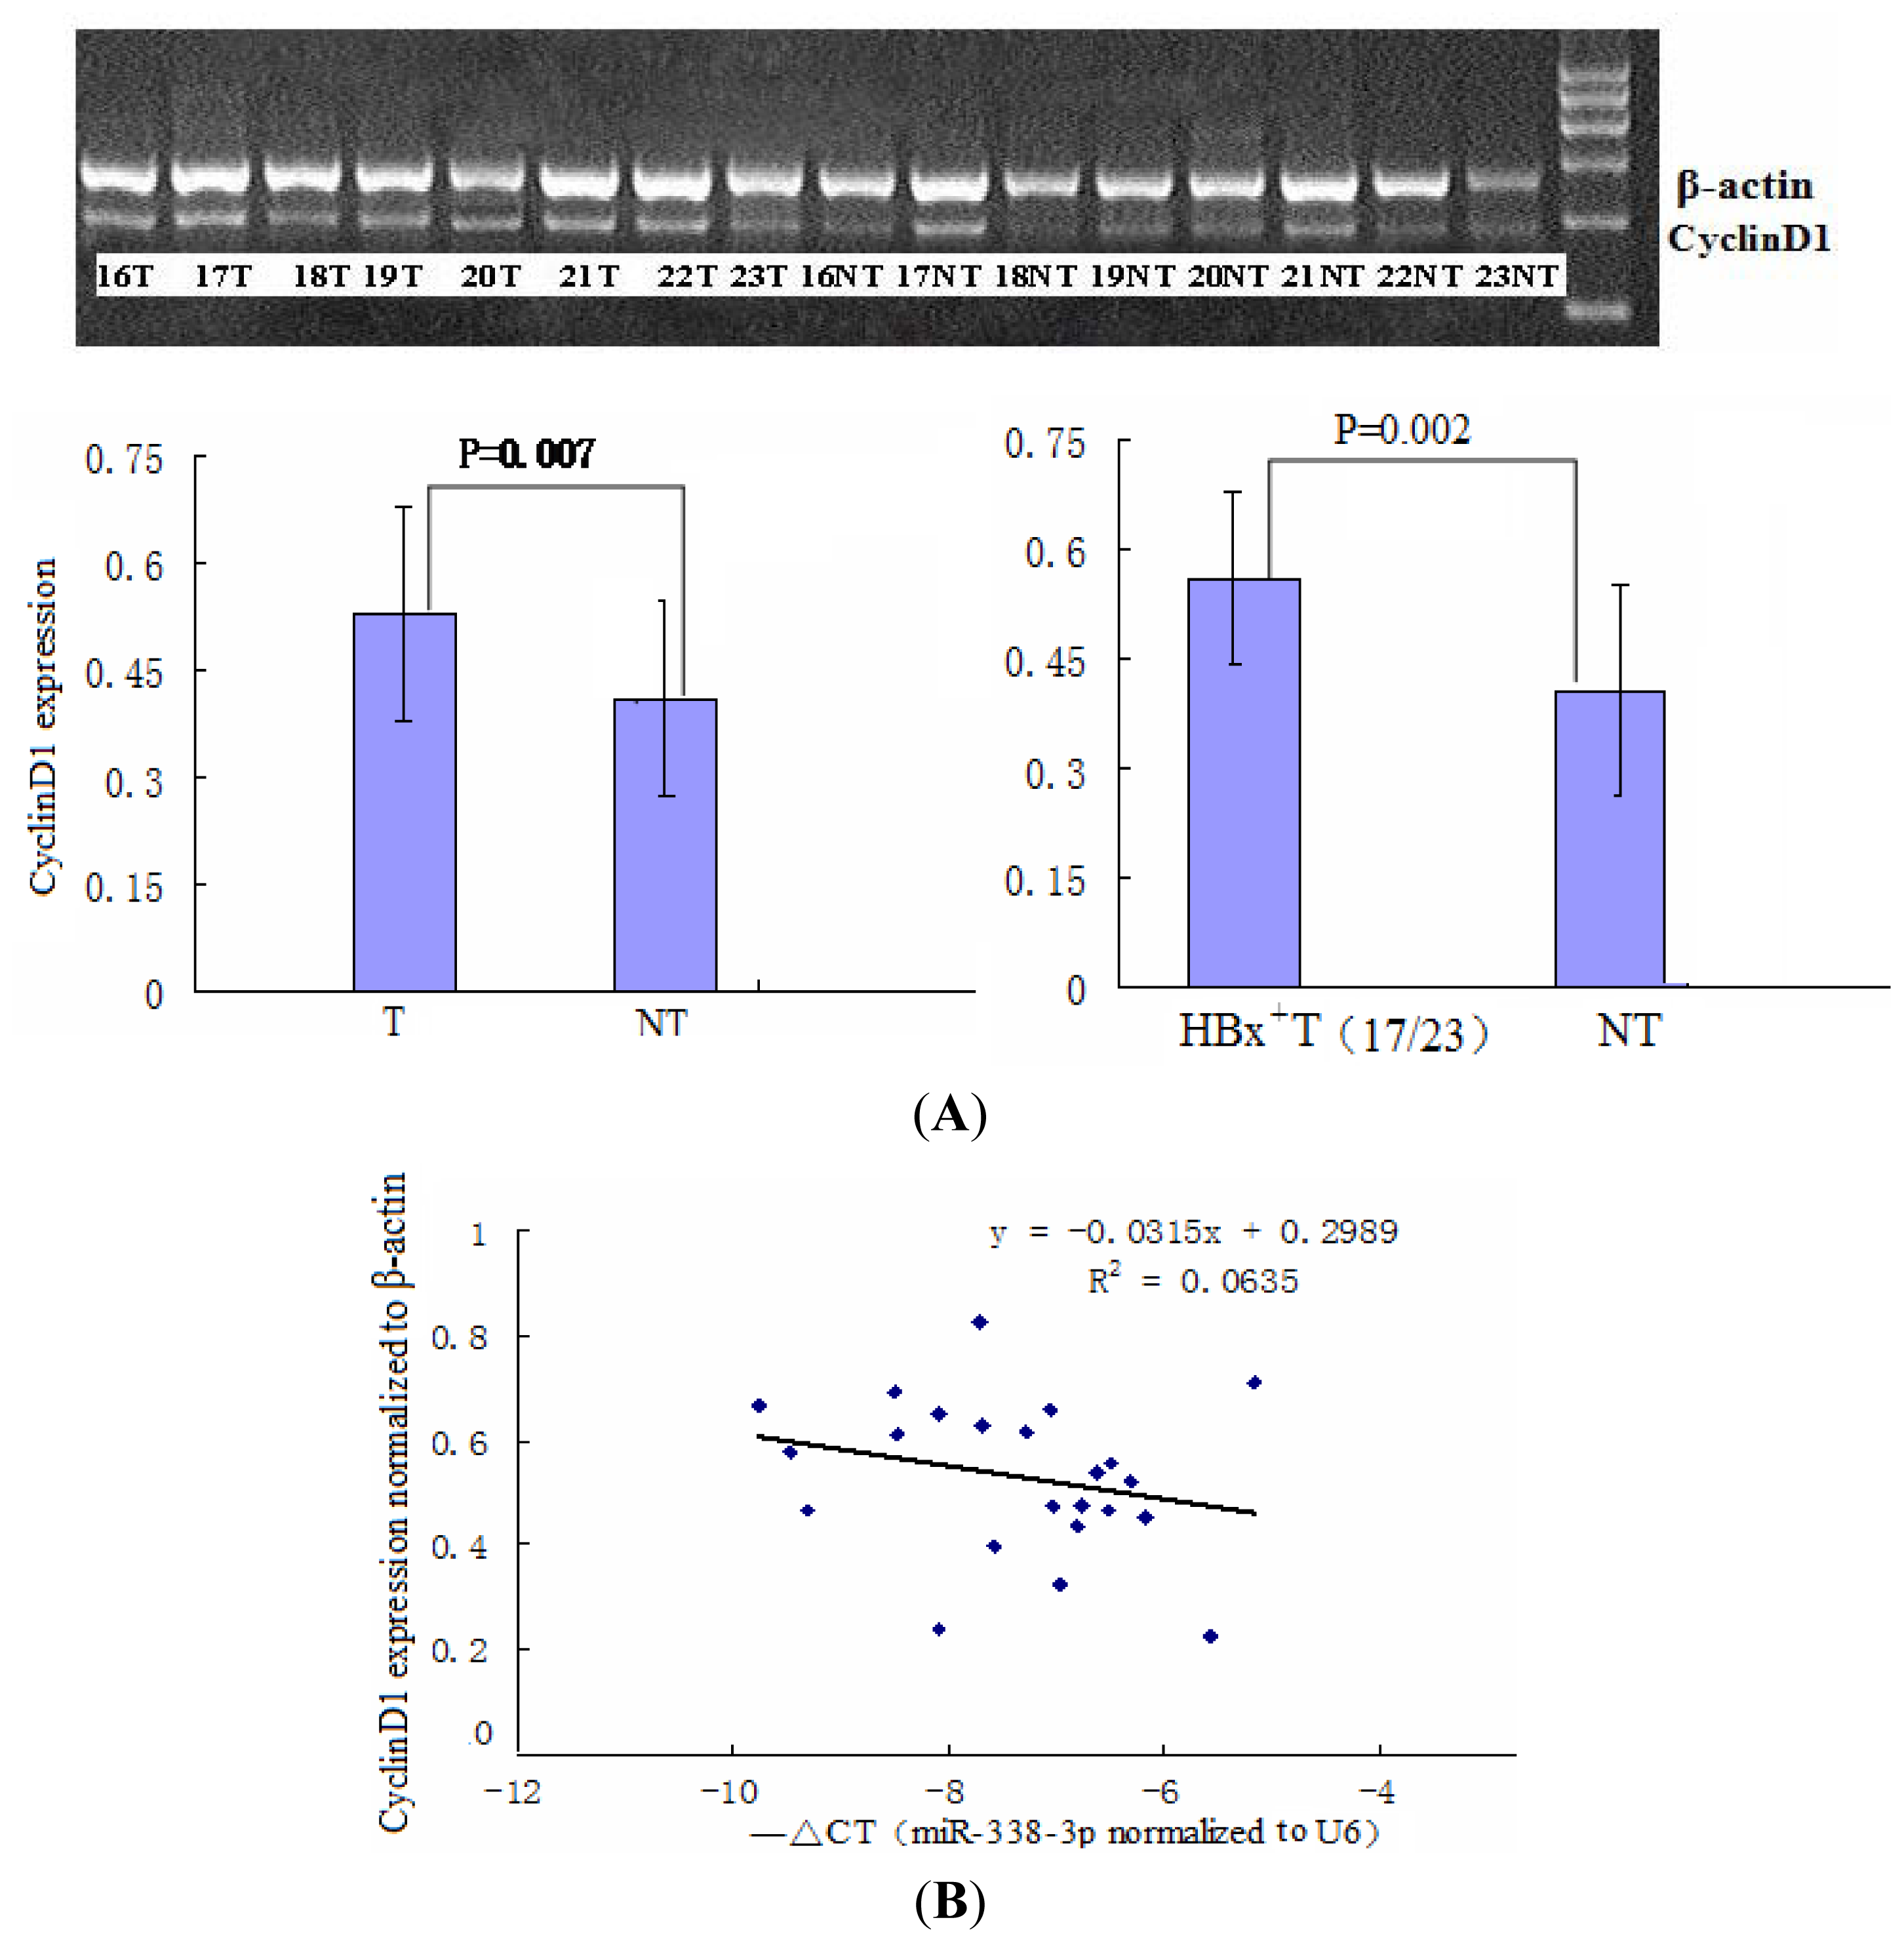
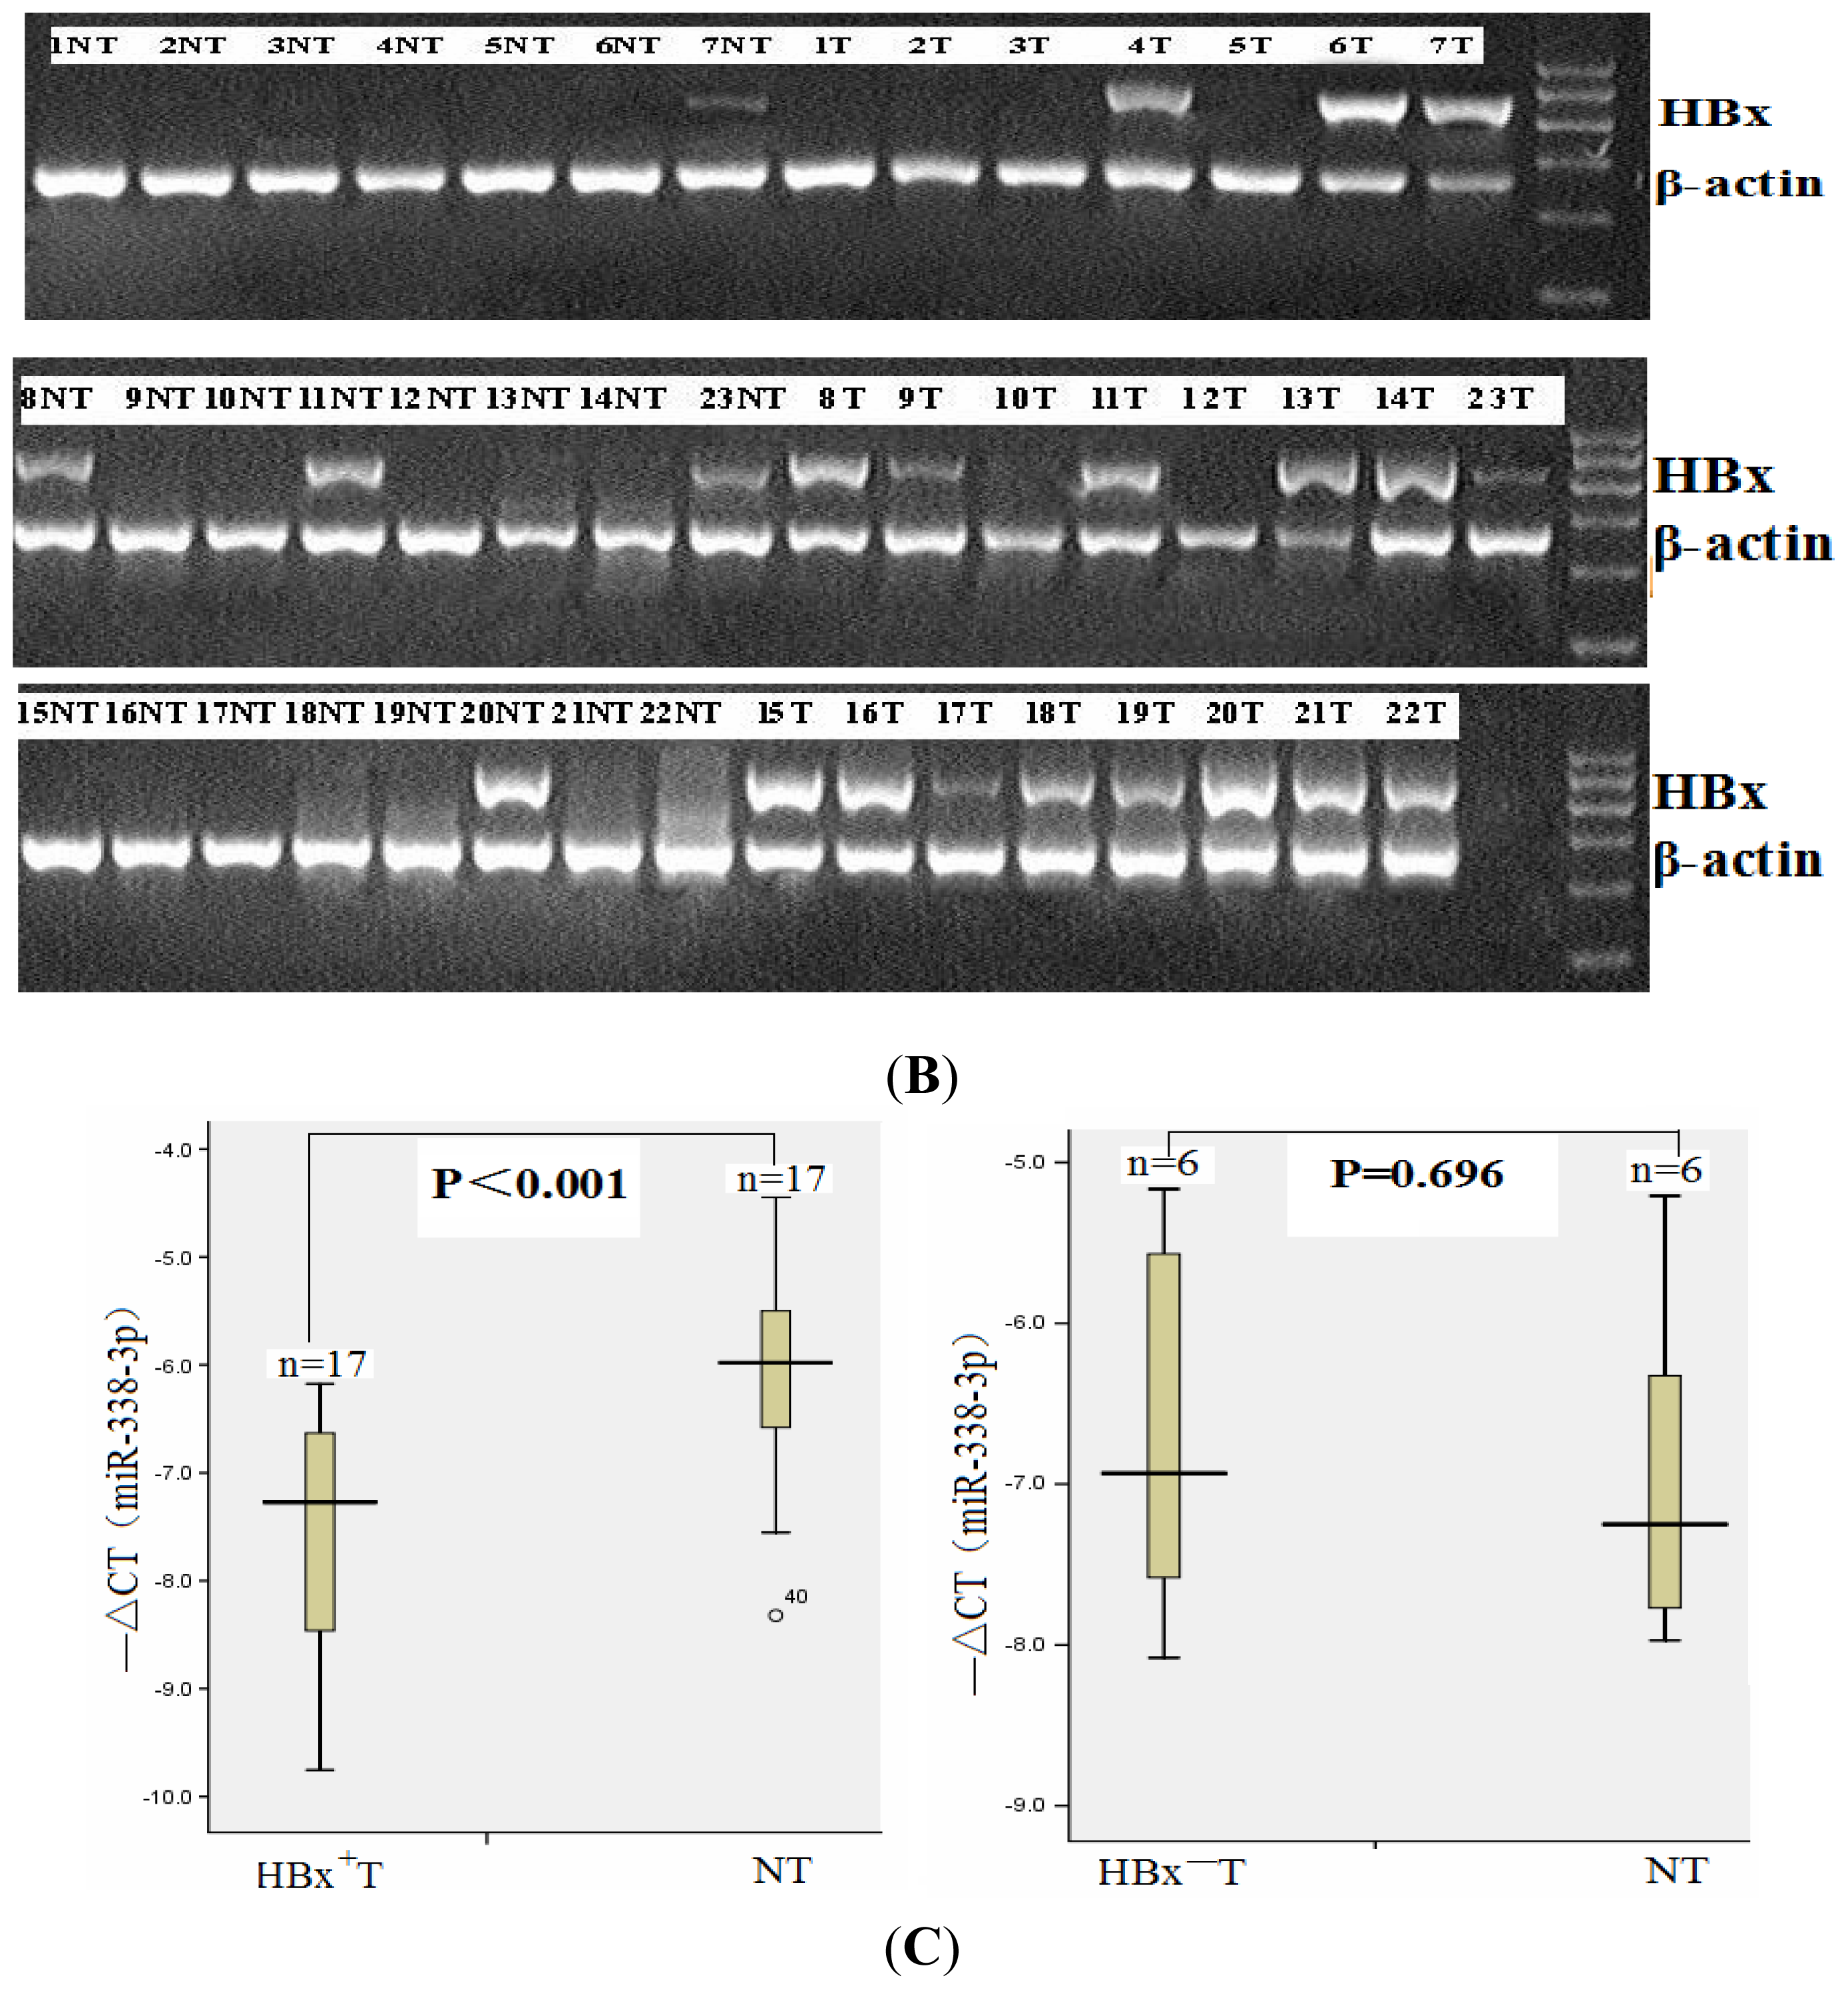
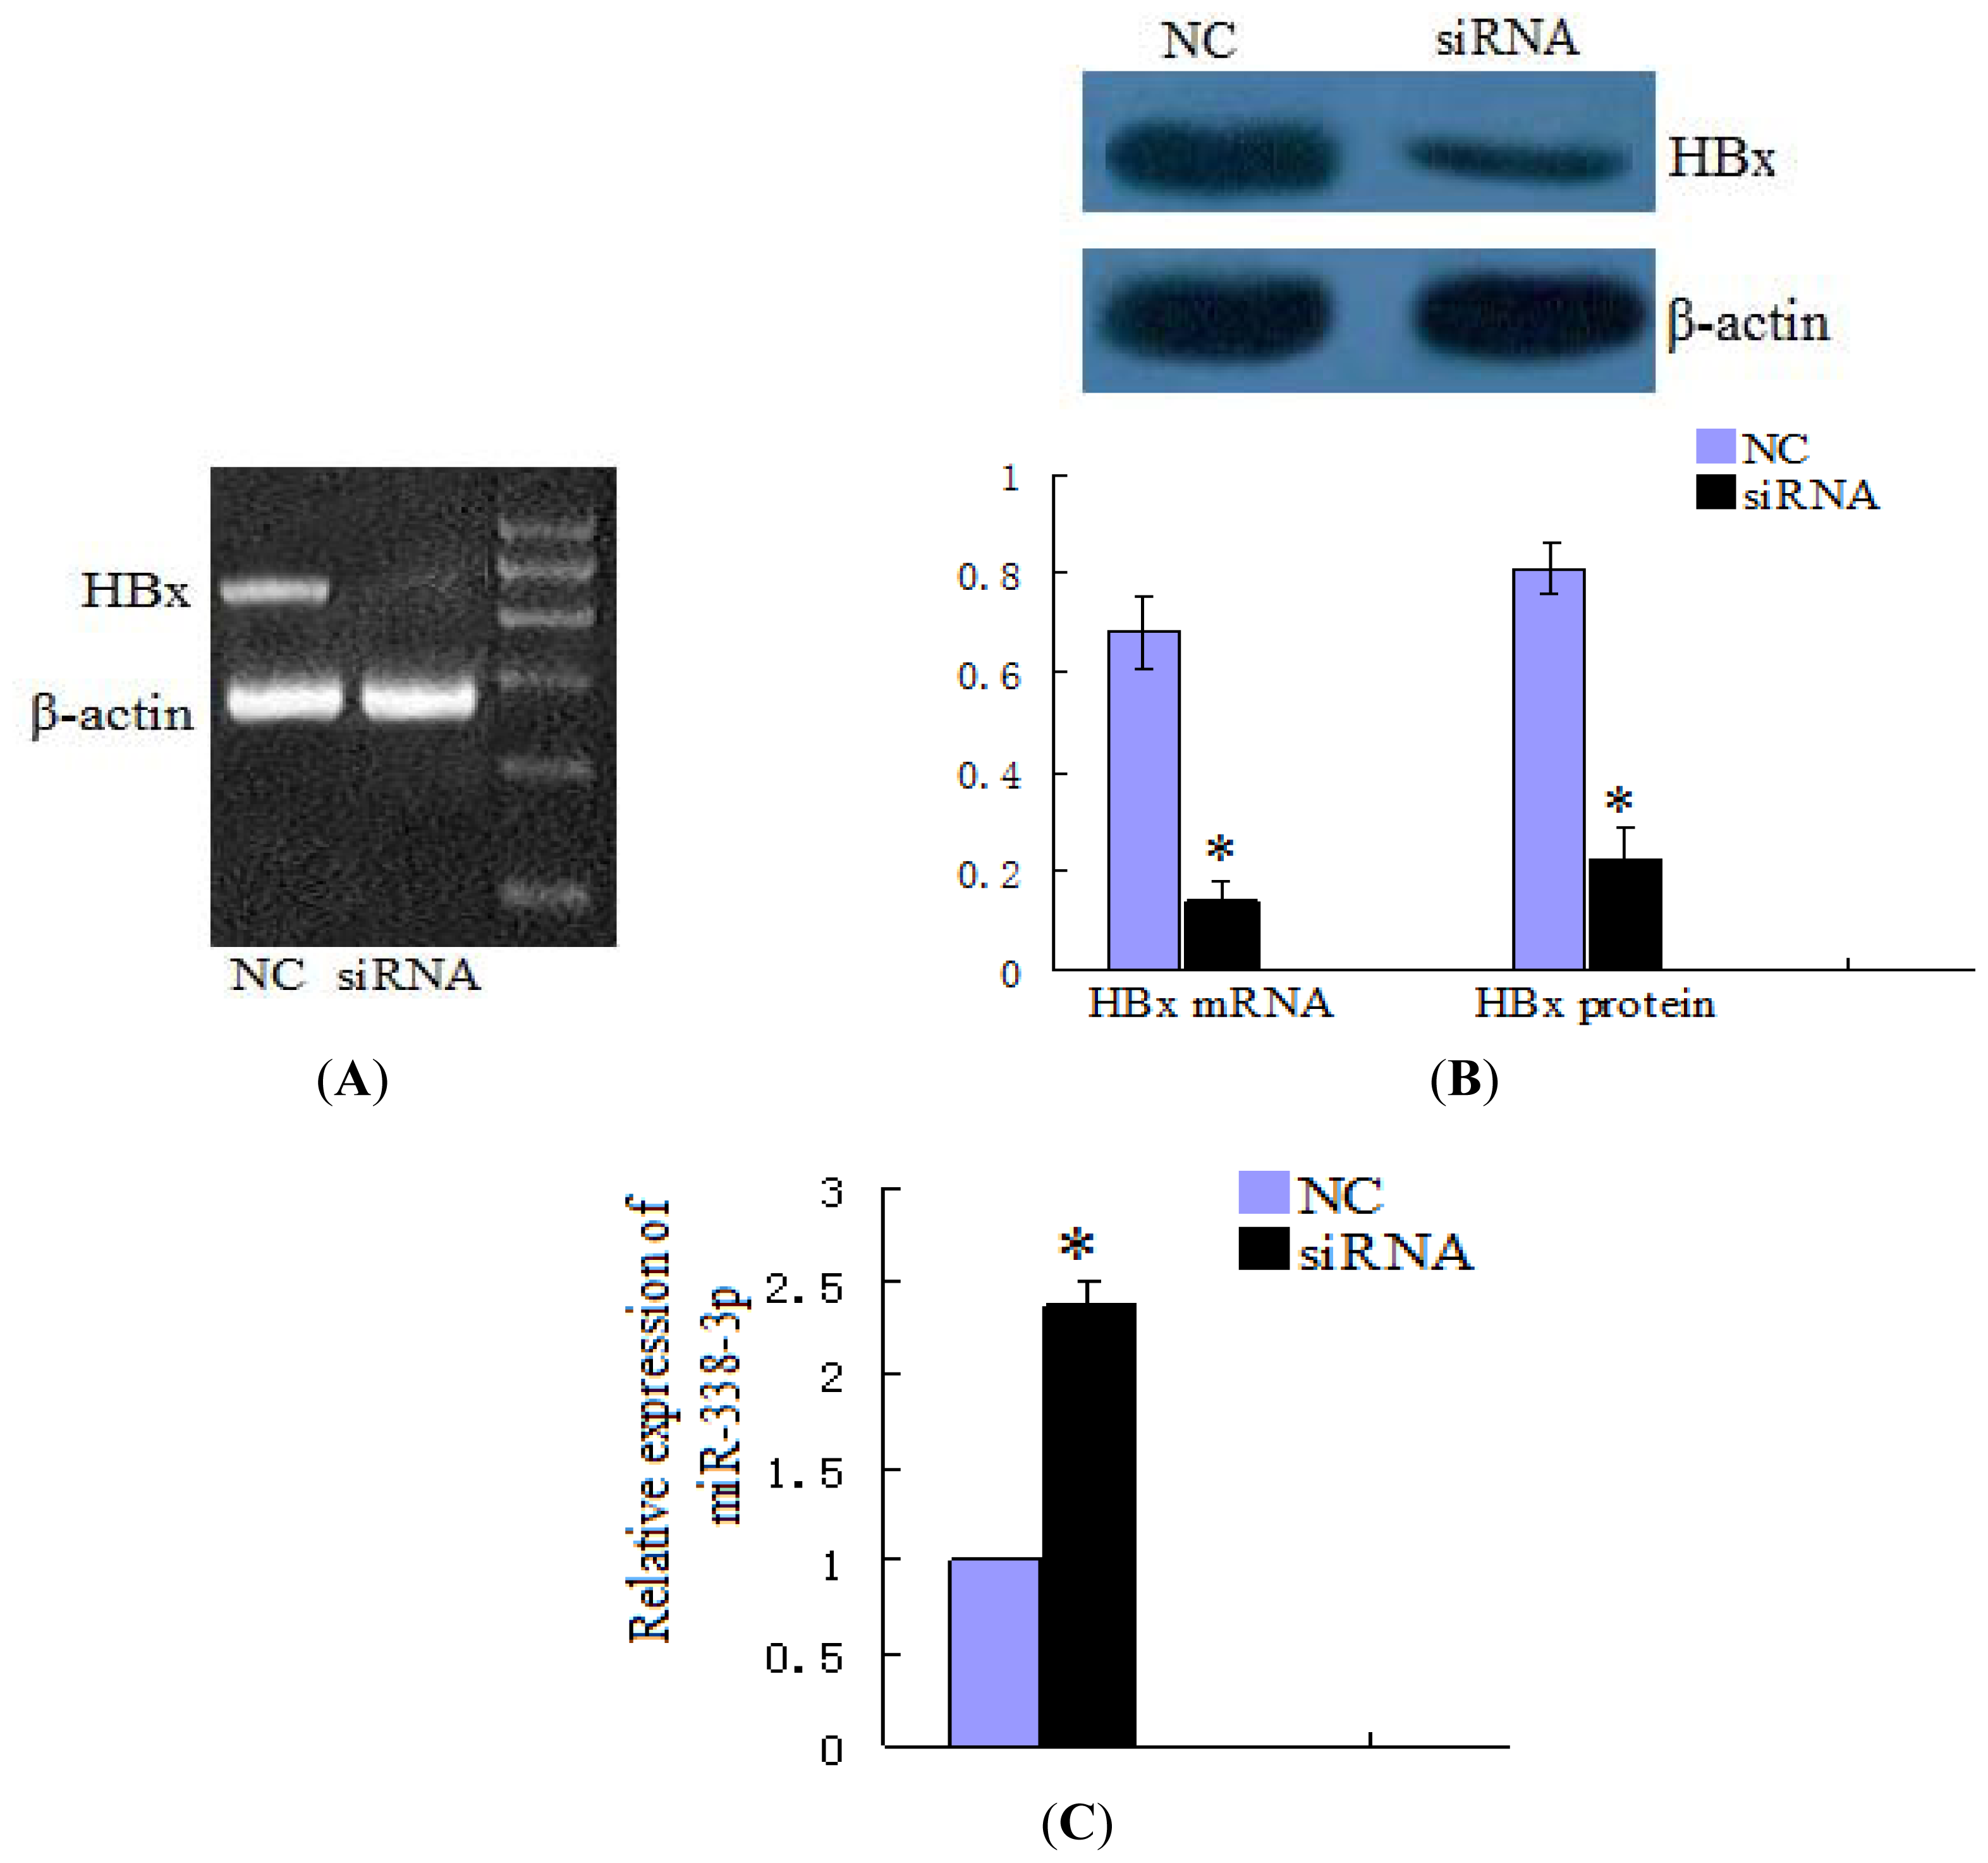
2.1. miR-338-3p Is Significantly Reduced in HBx-Positive Tumor Tissues and Inversely Correlates with HBx Expression
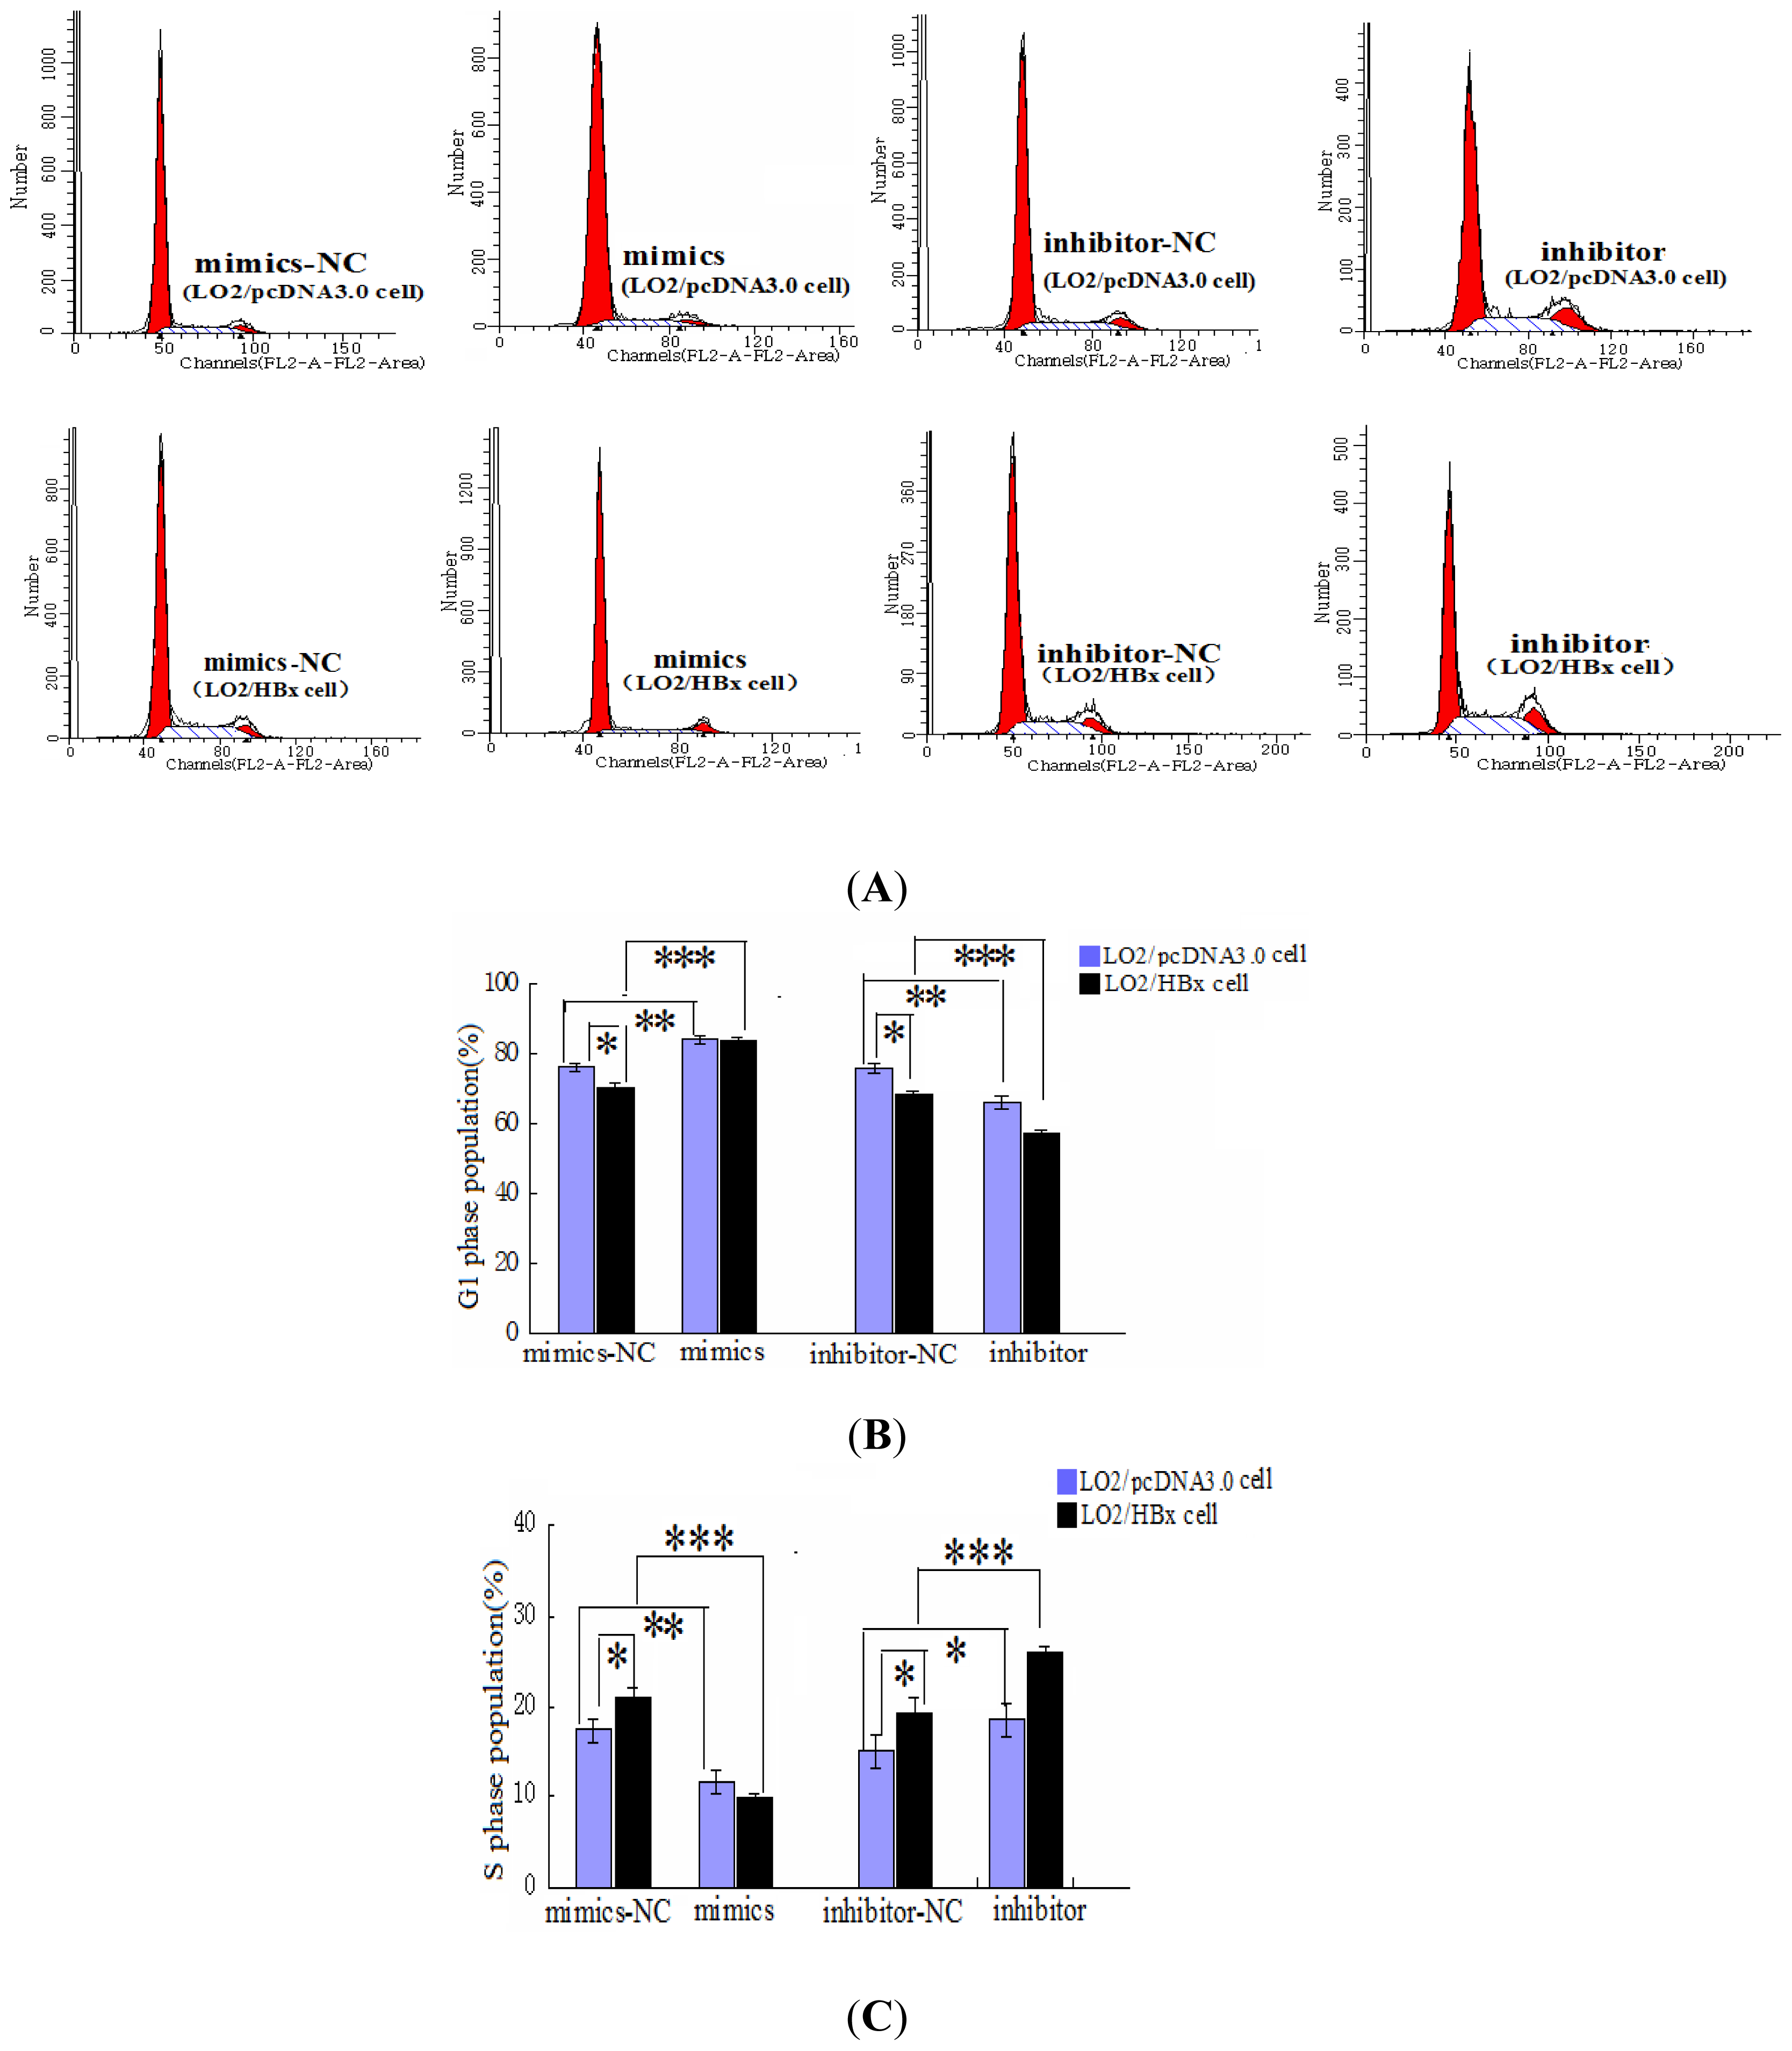
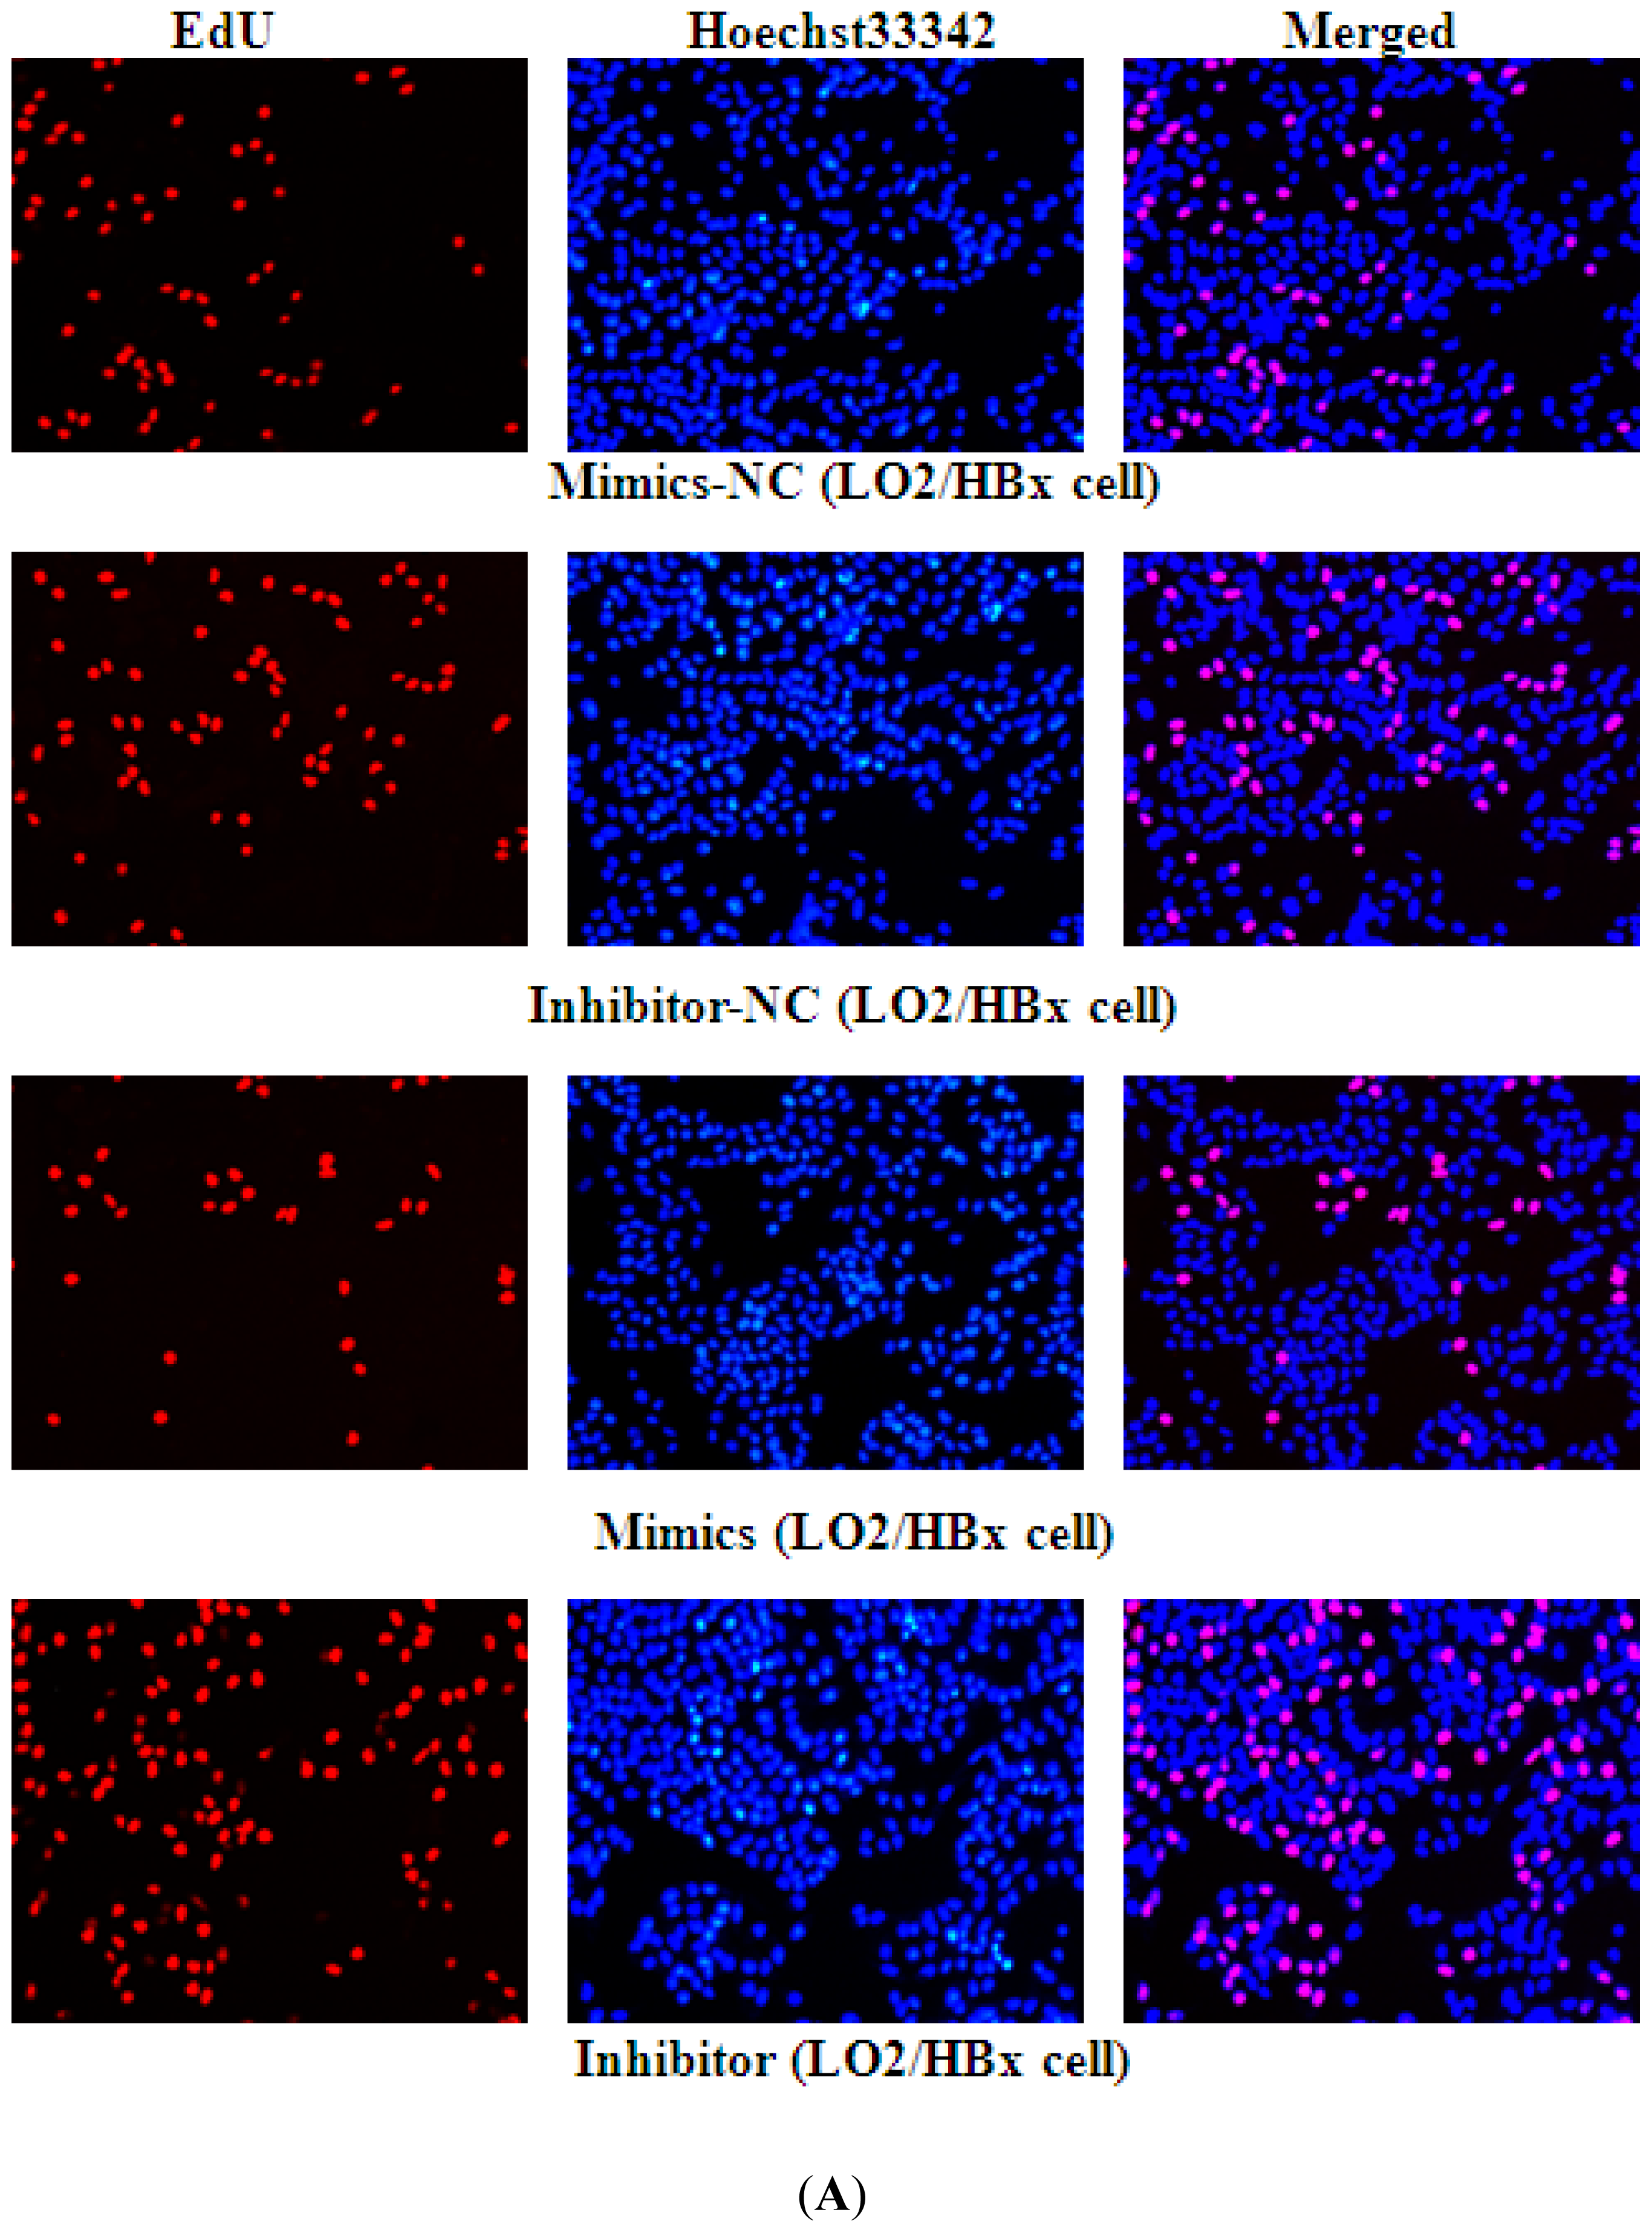
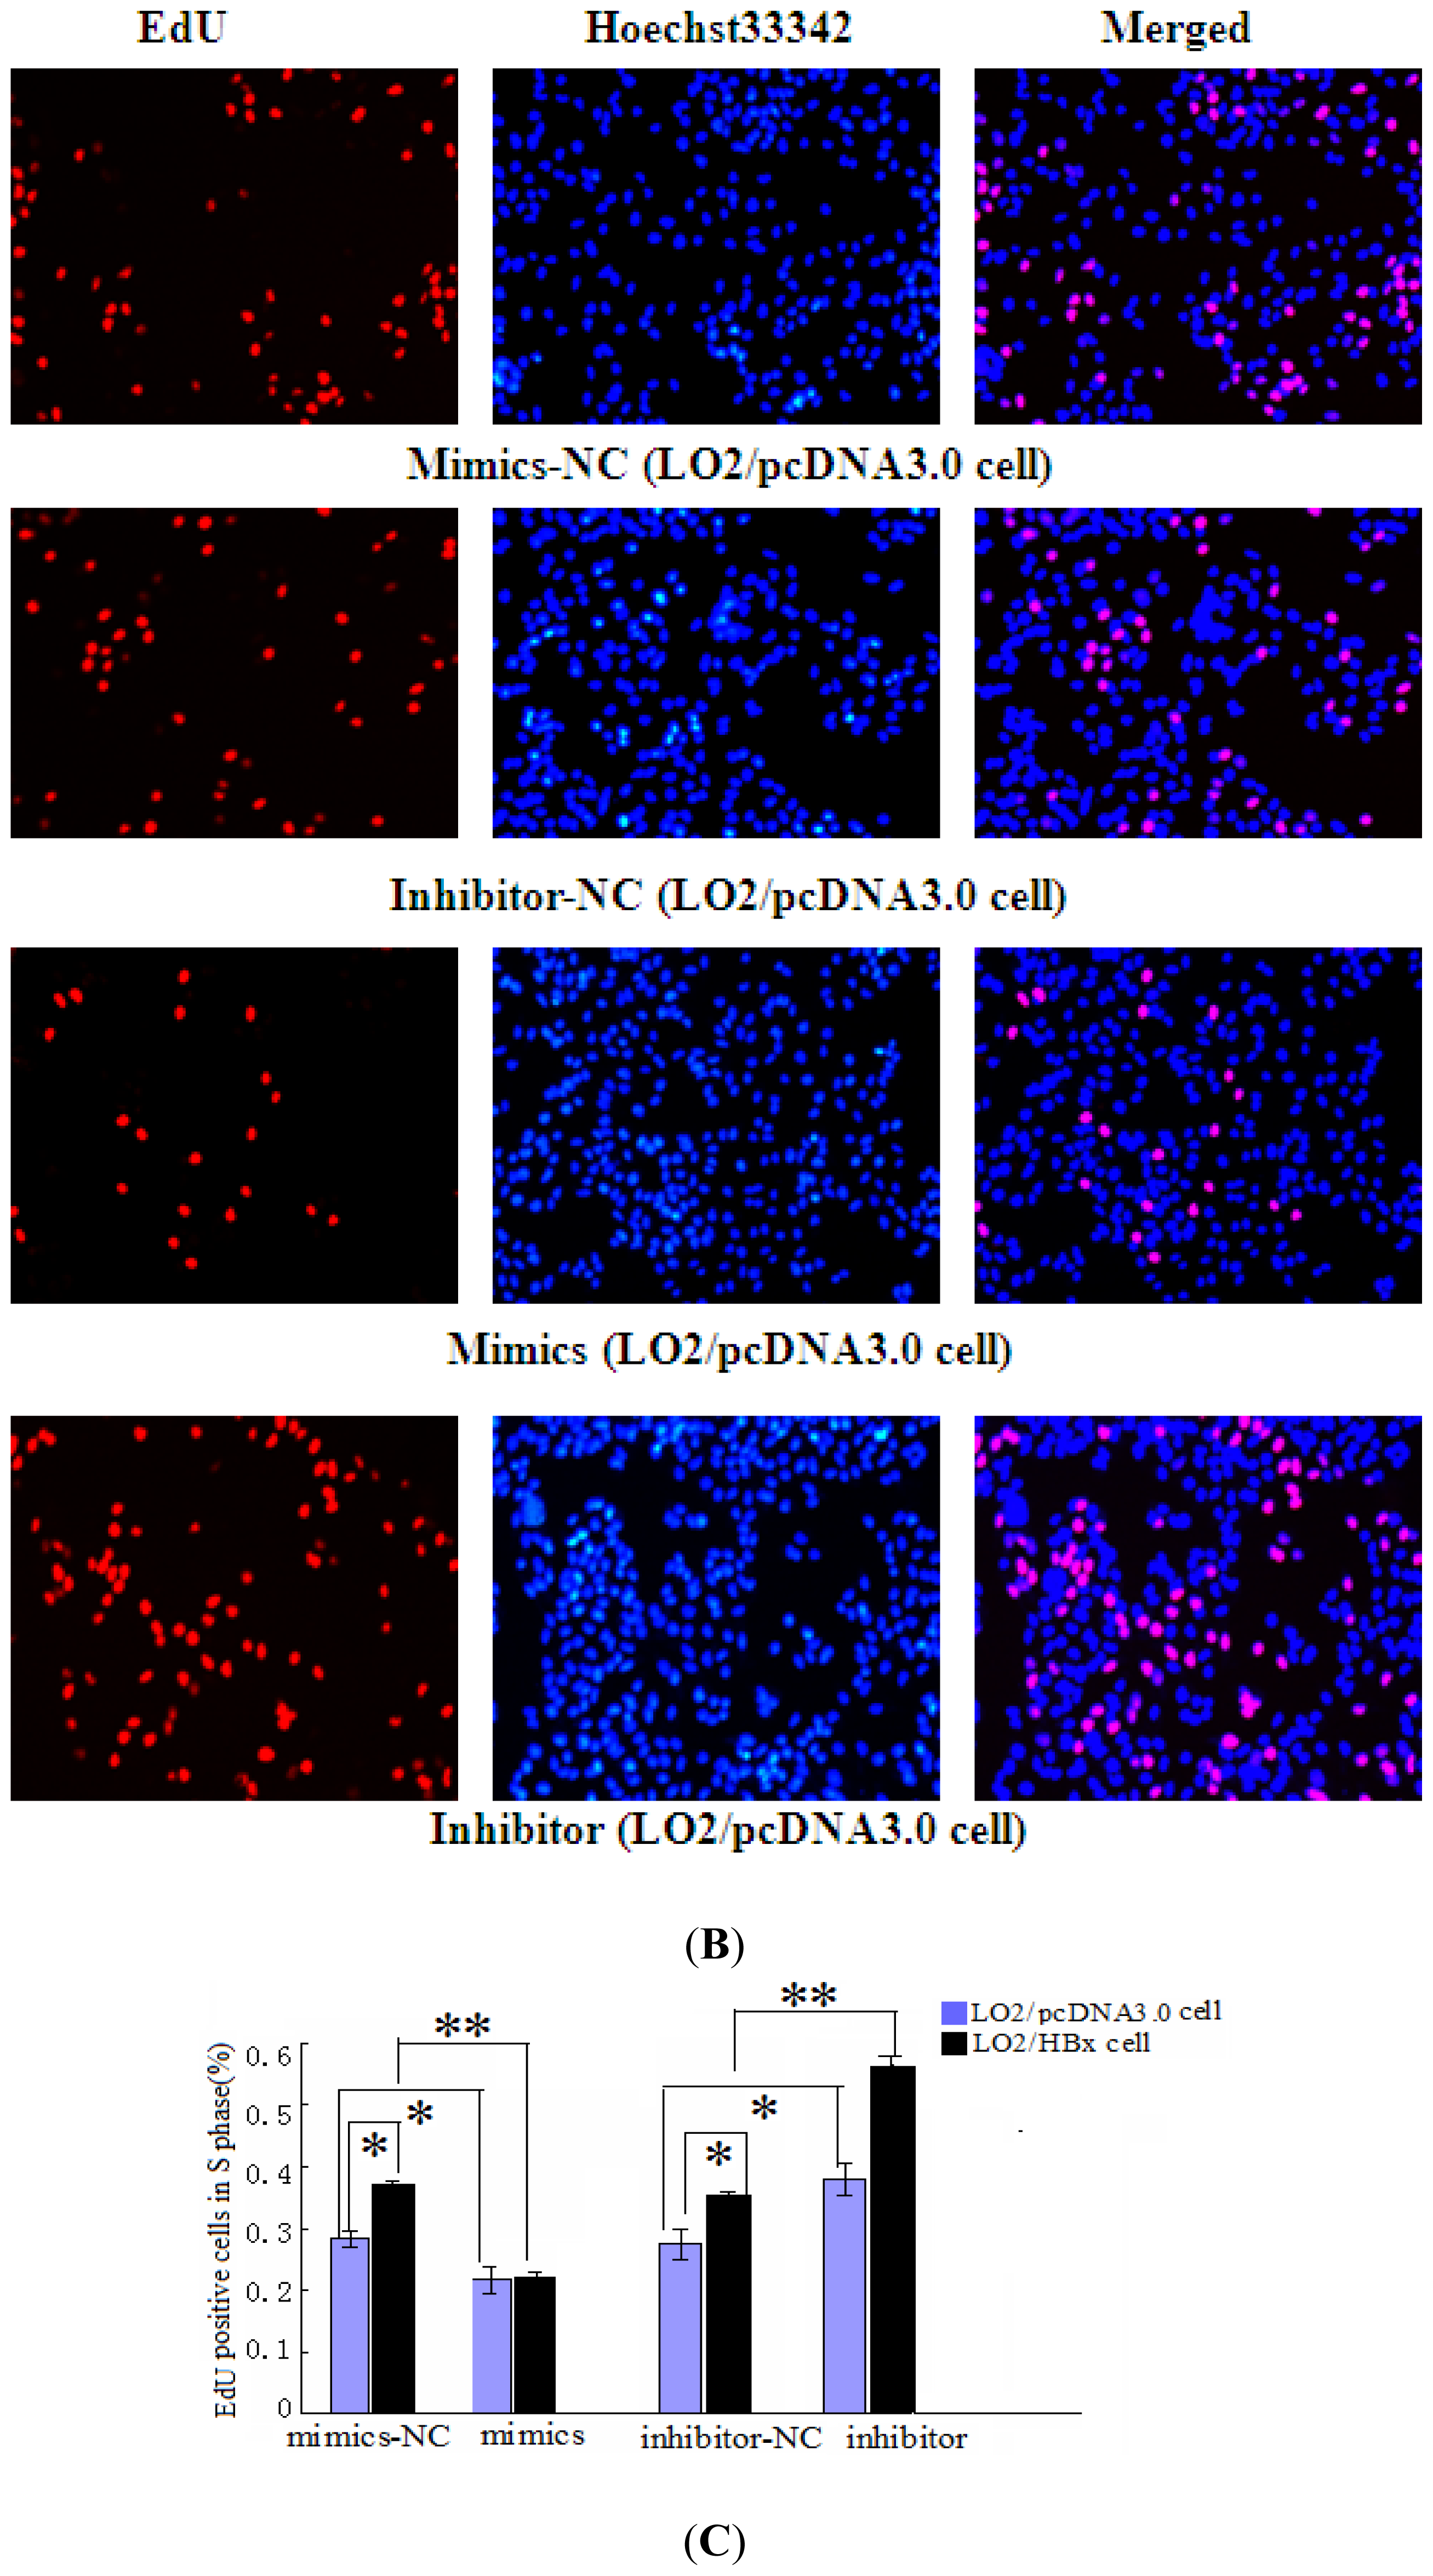
2.2. miR-338-3p Inhibits Cell Proliferation
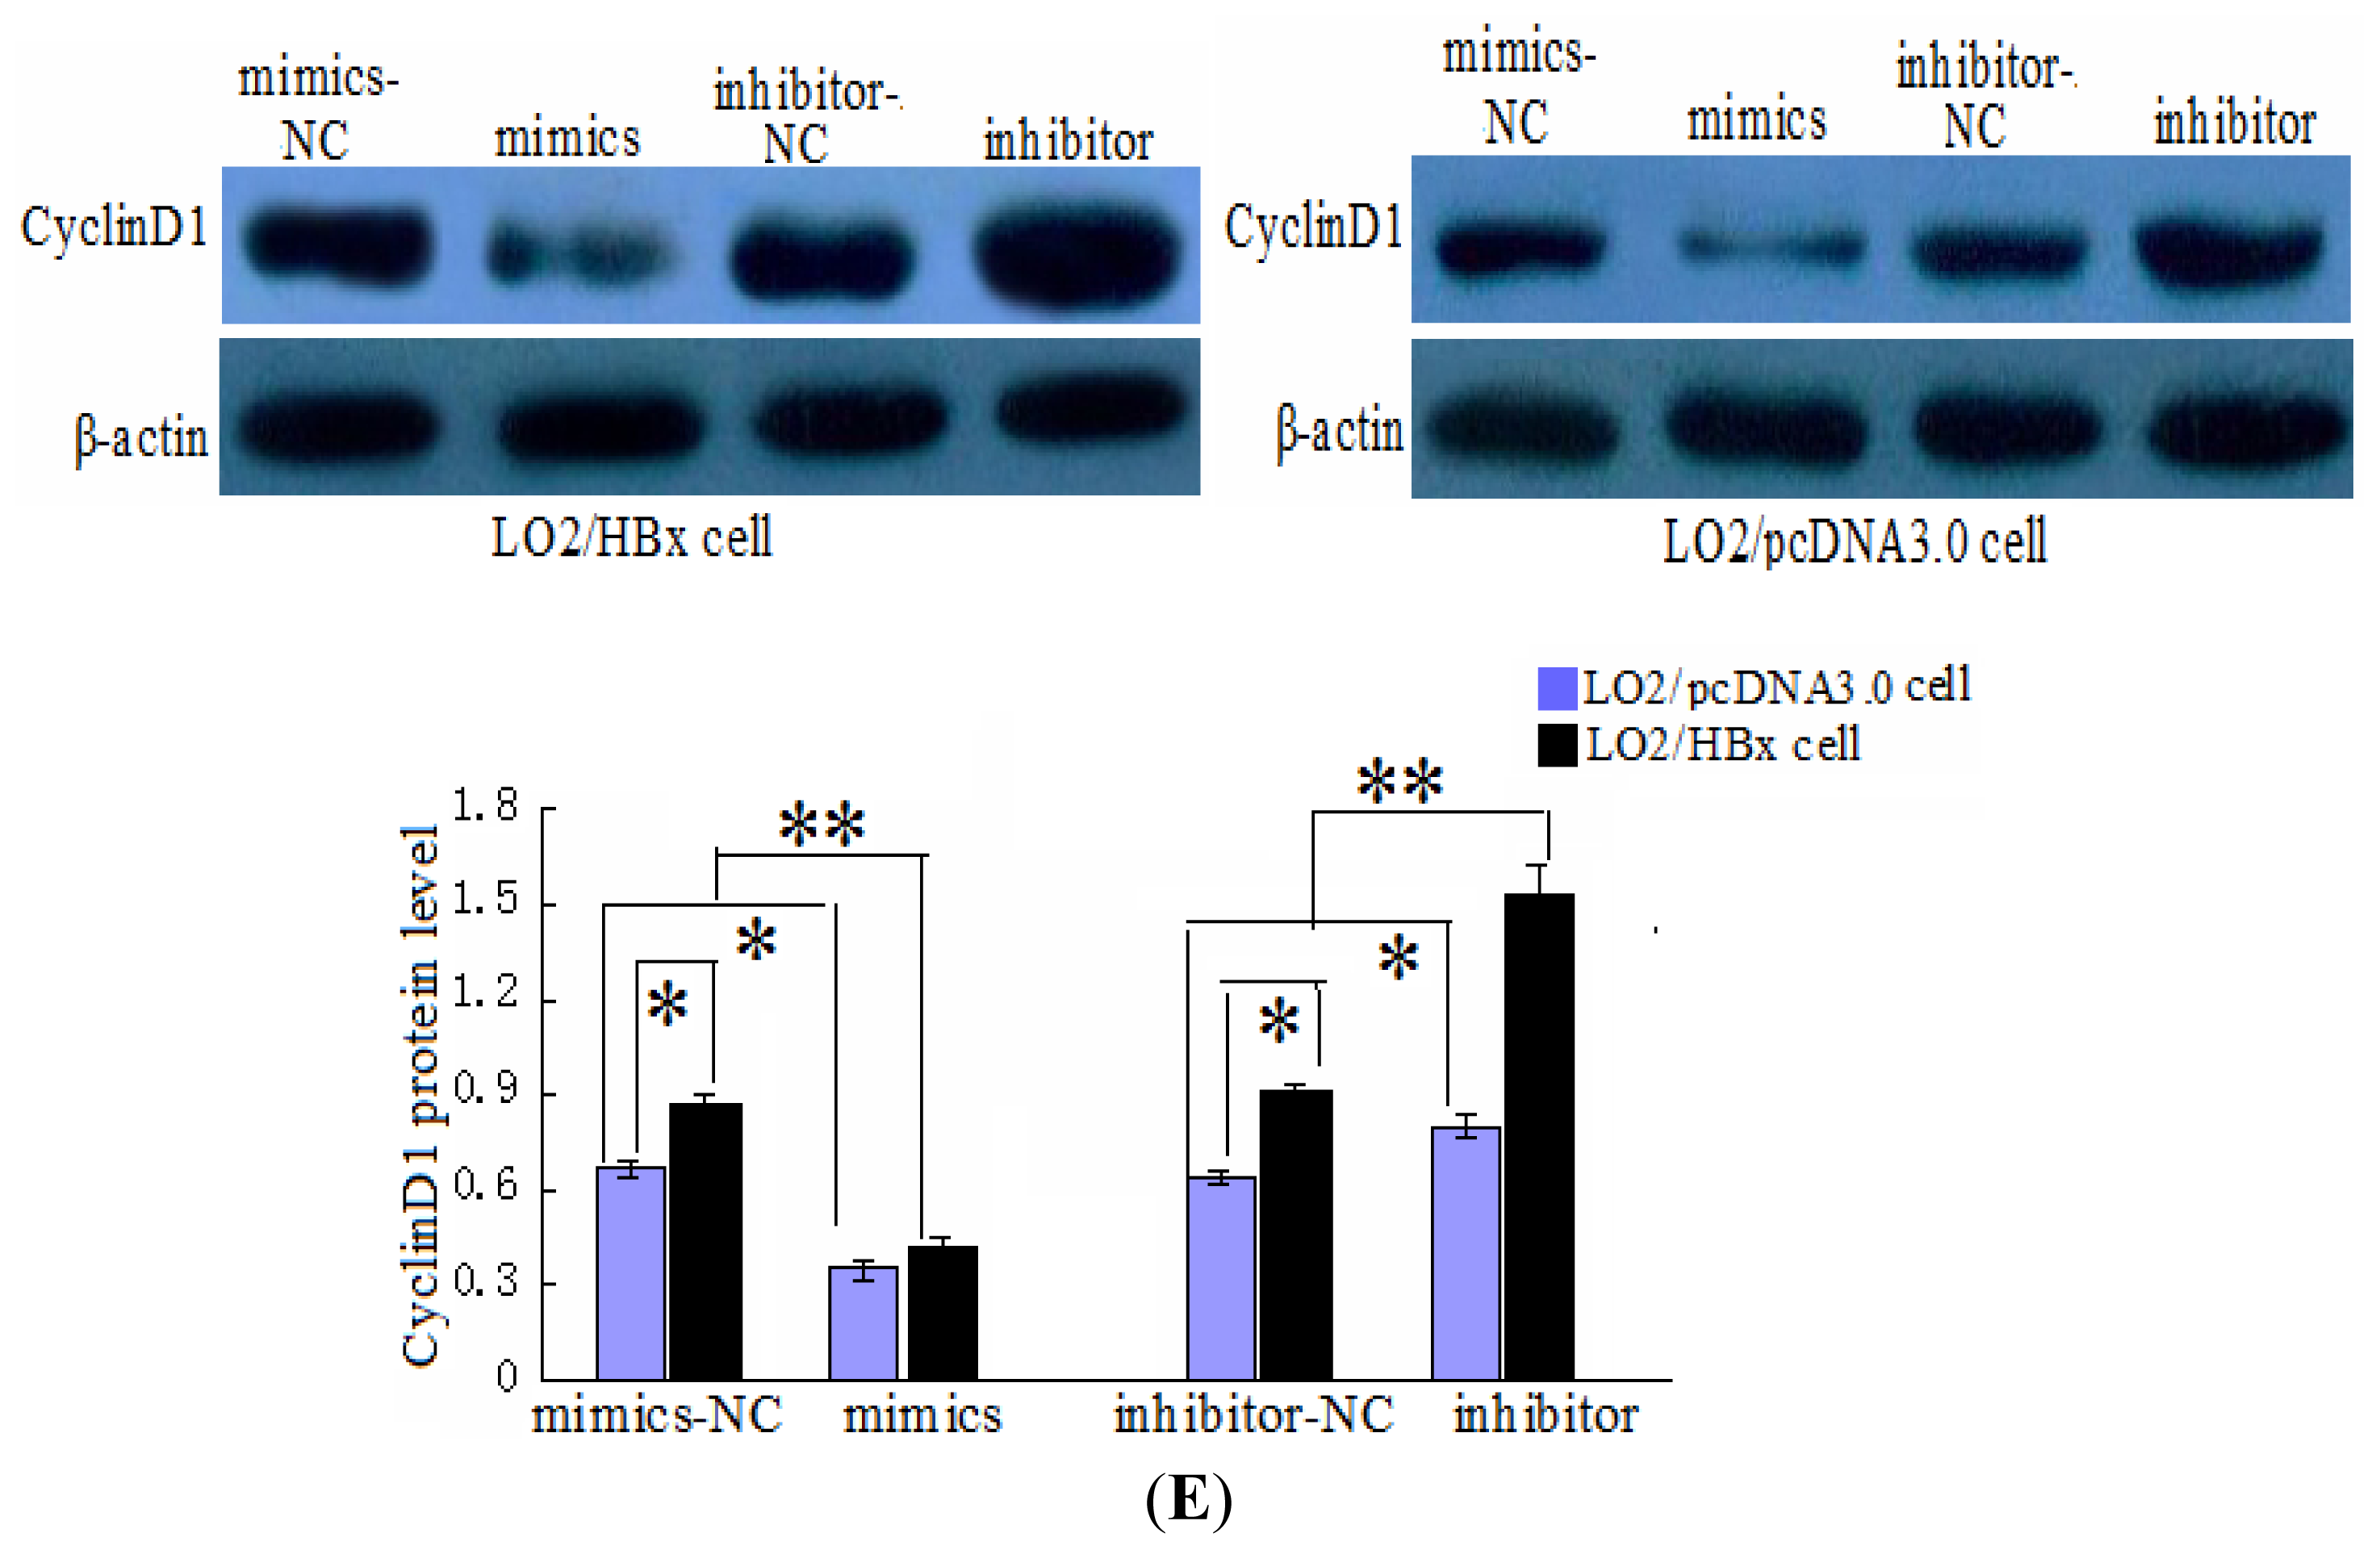
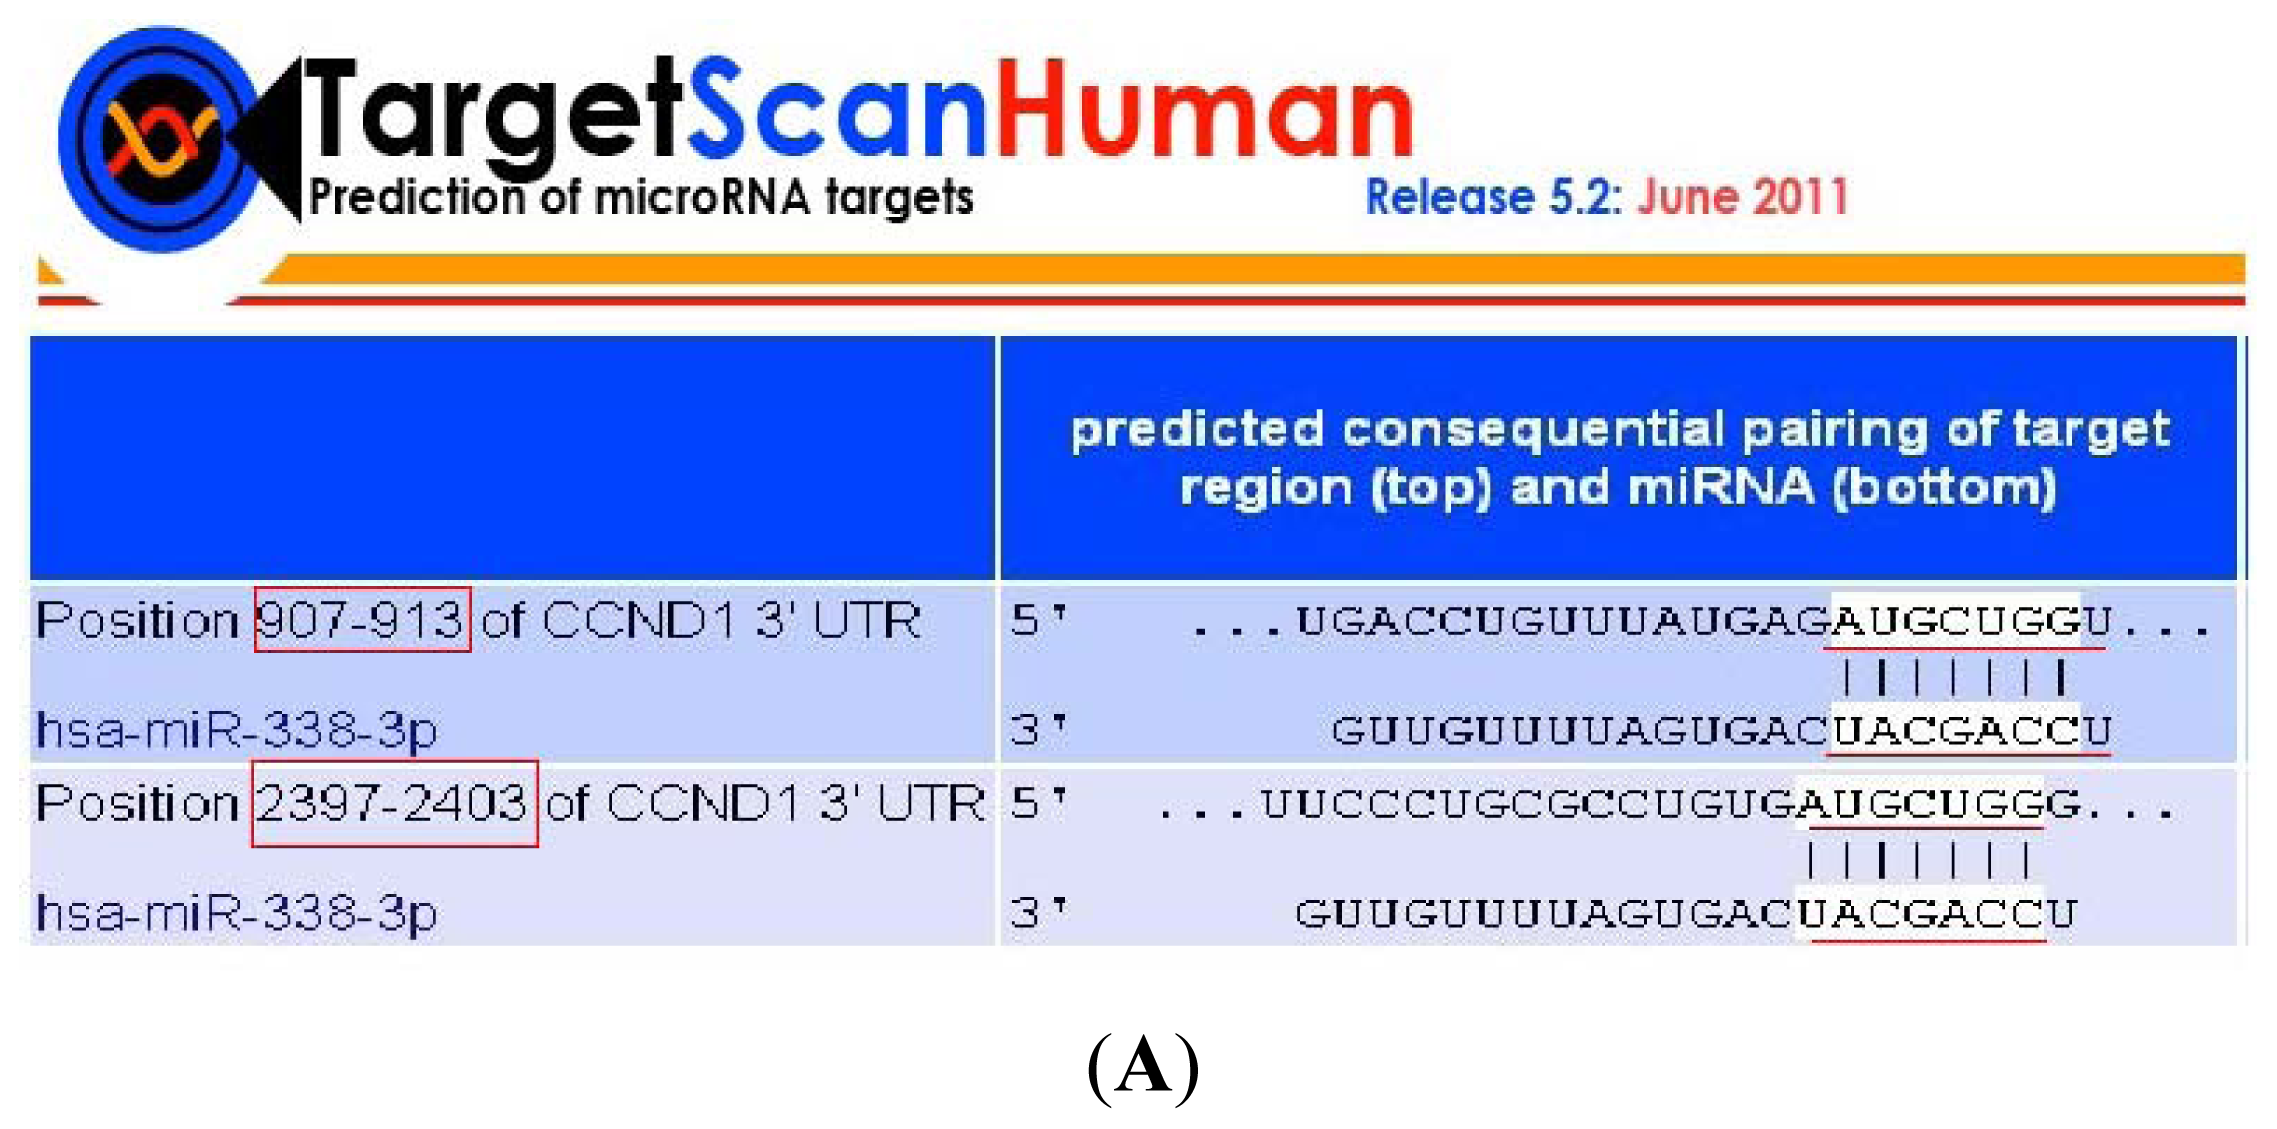
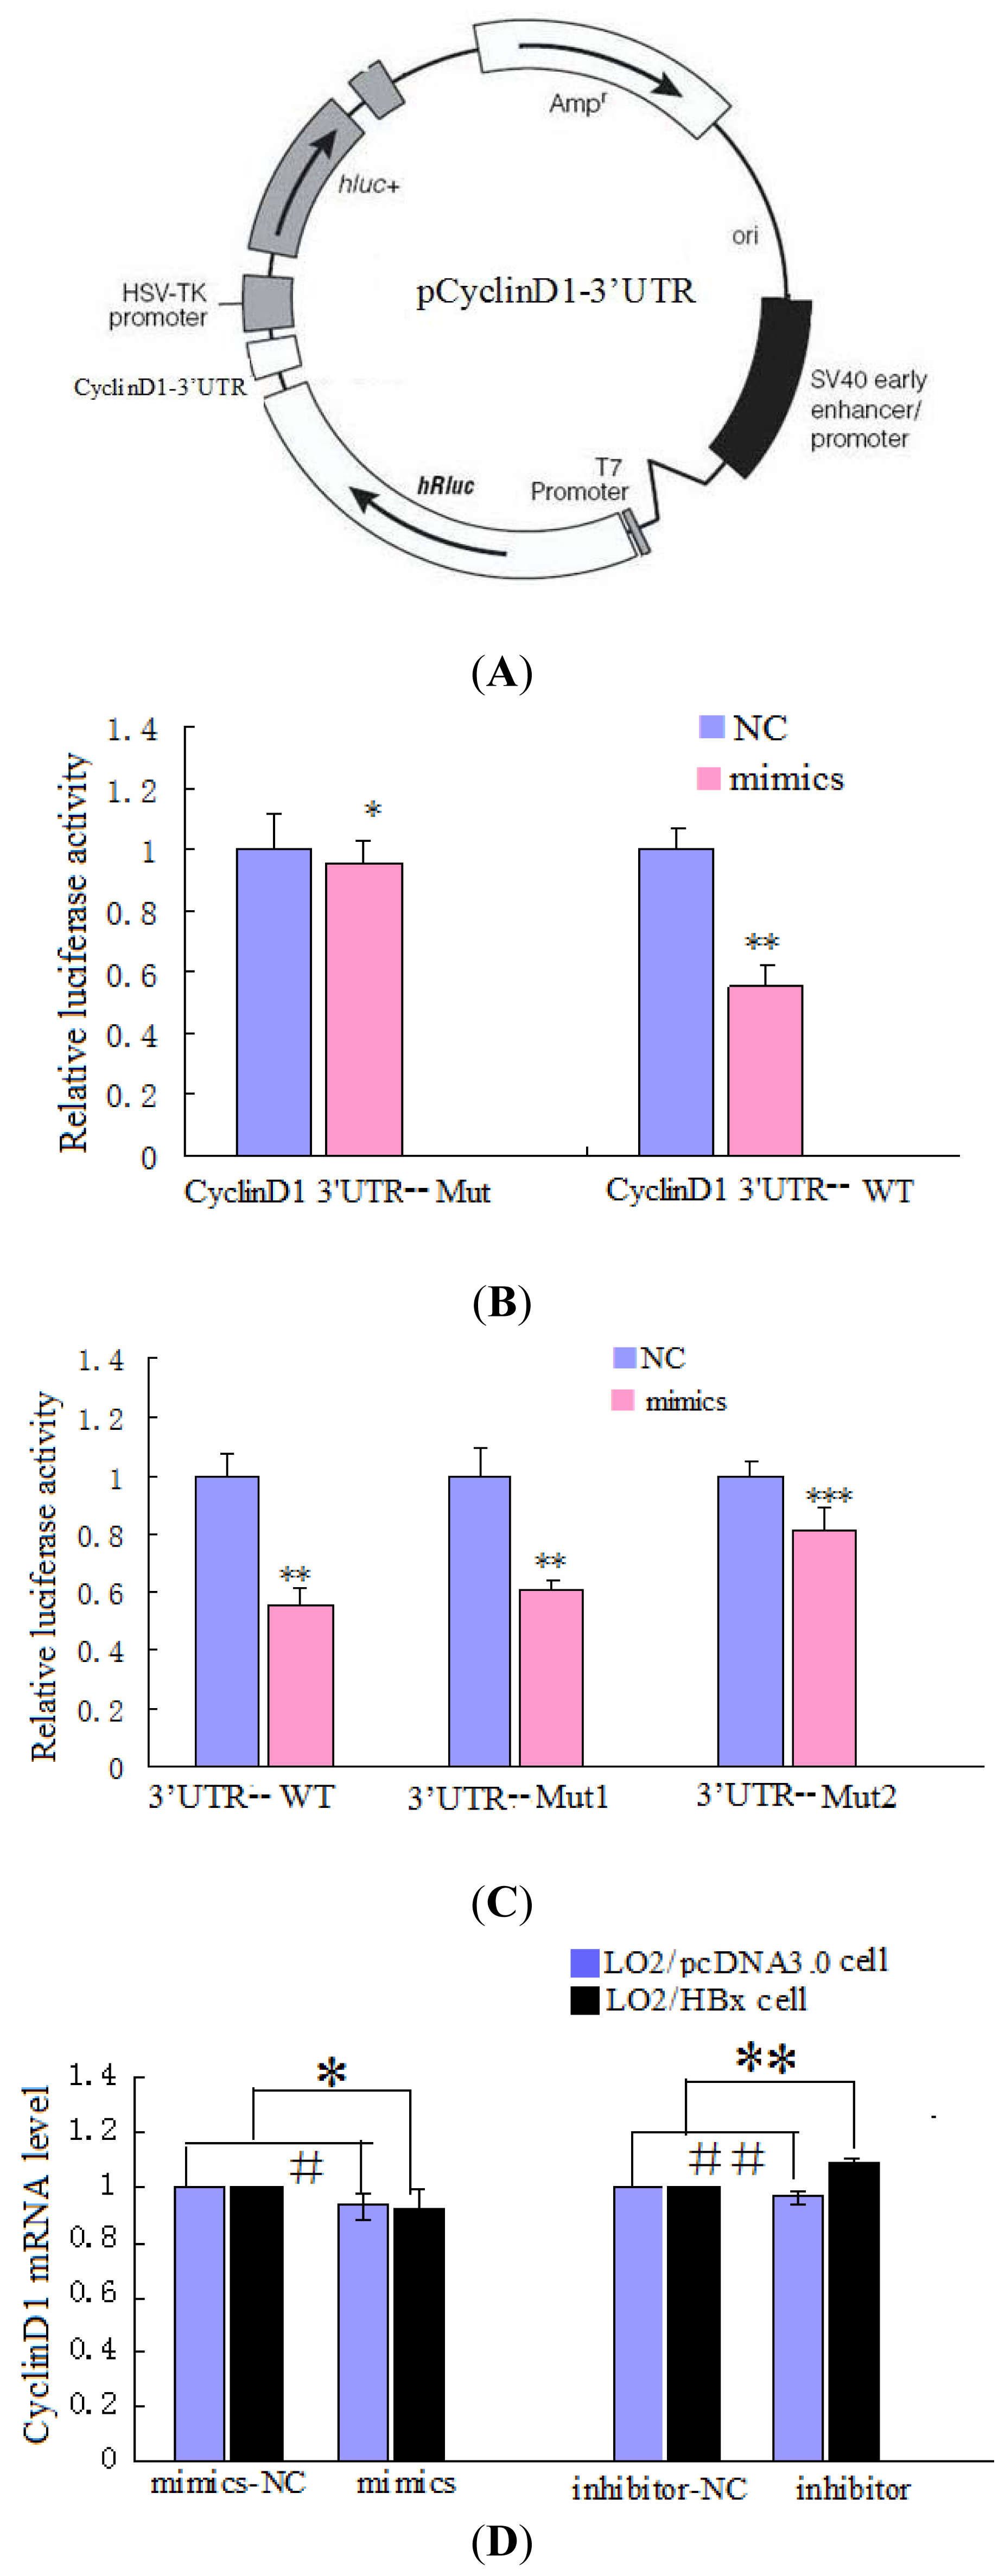
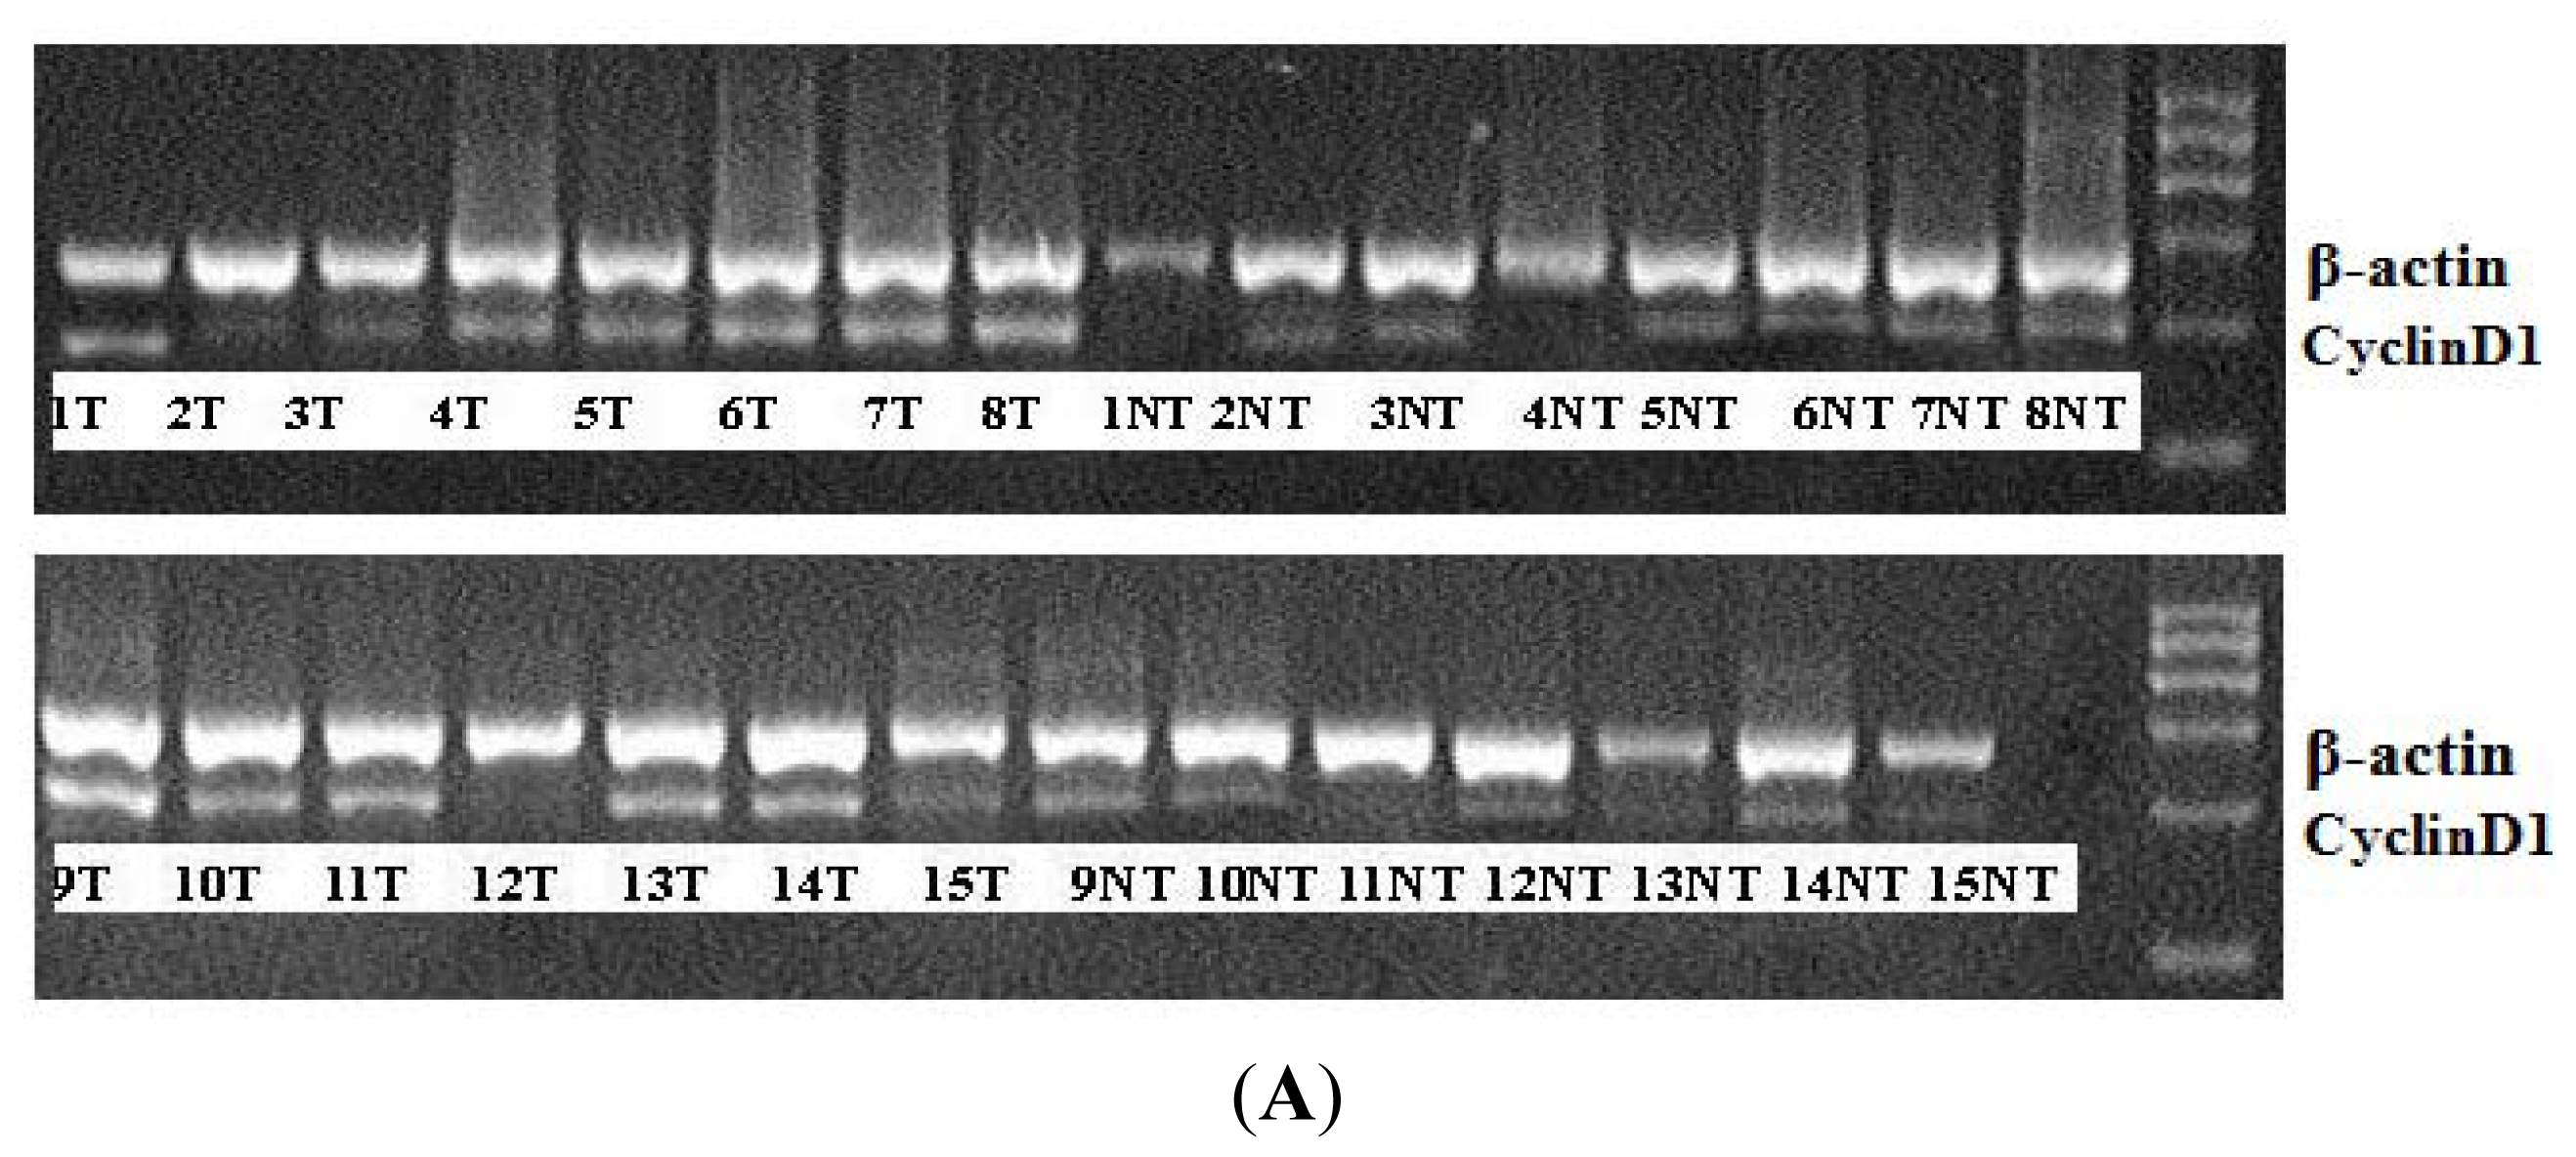
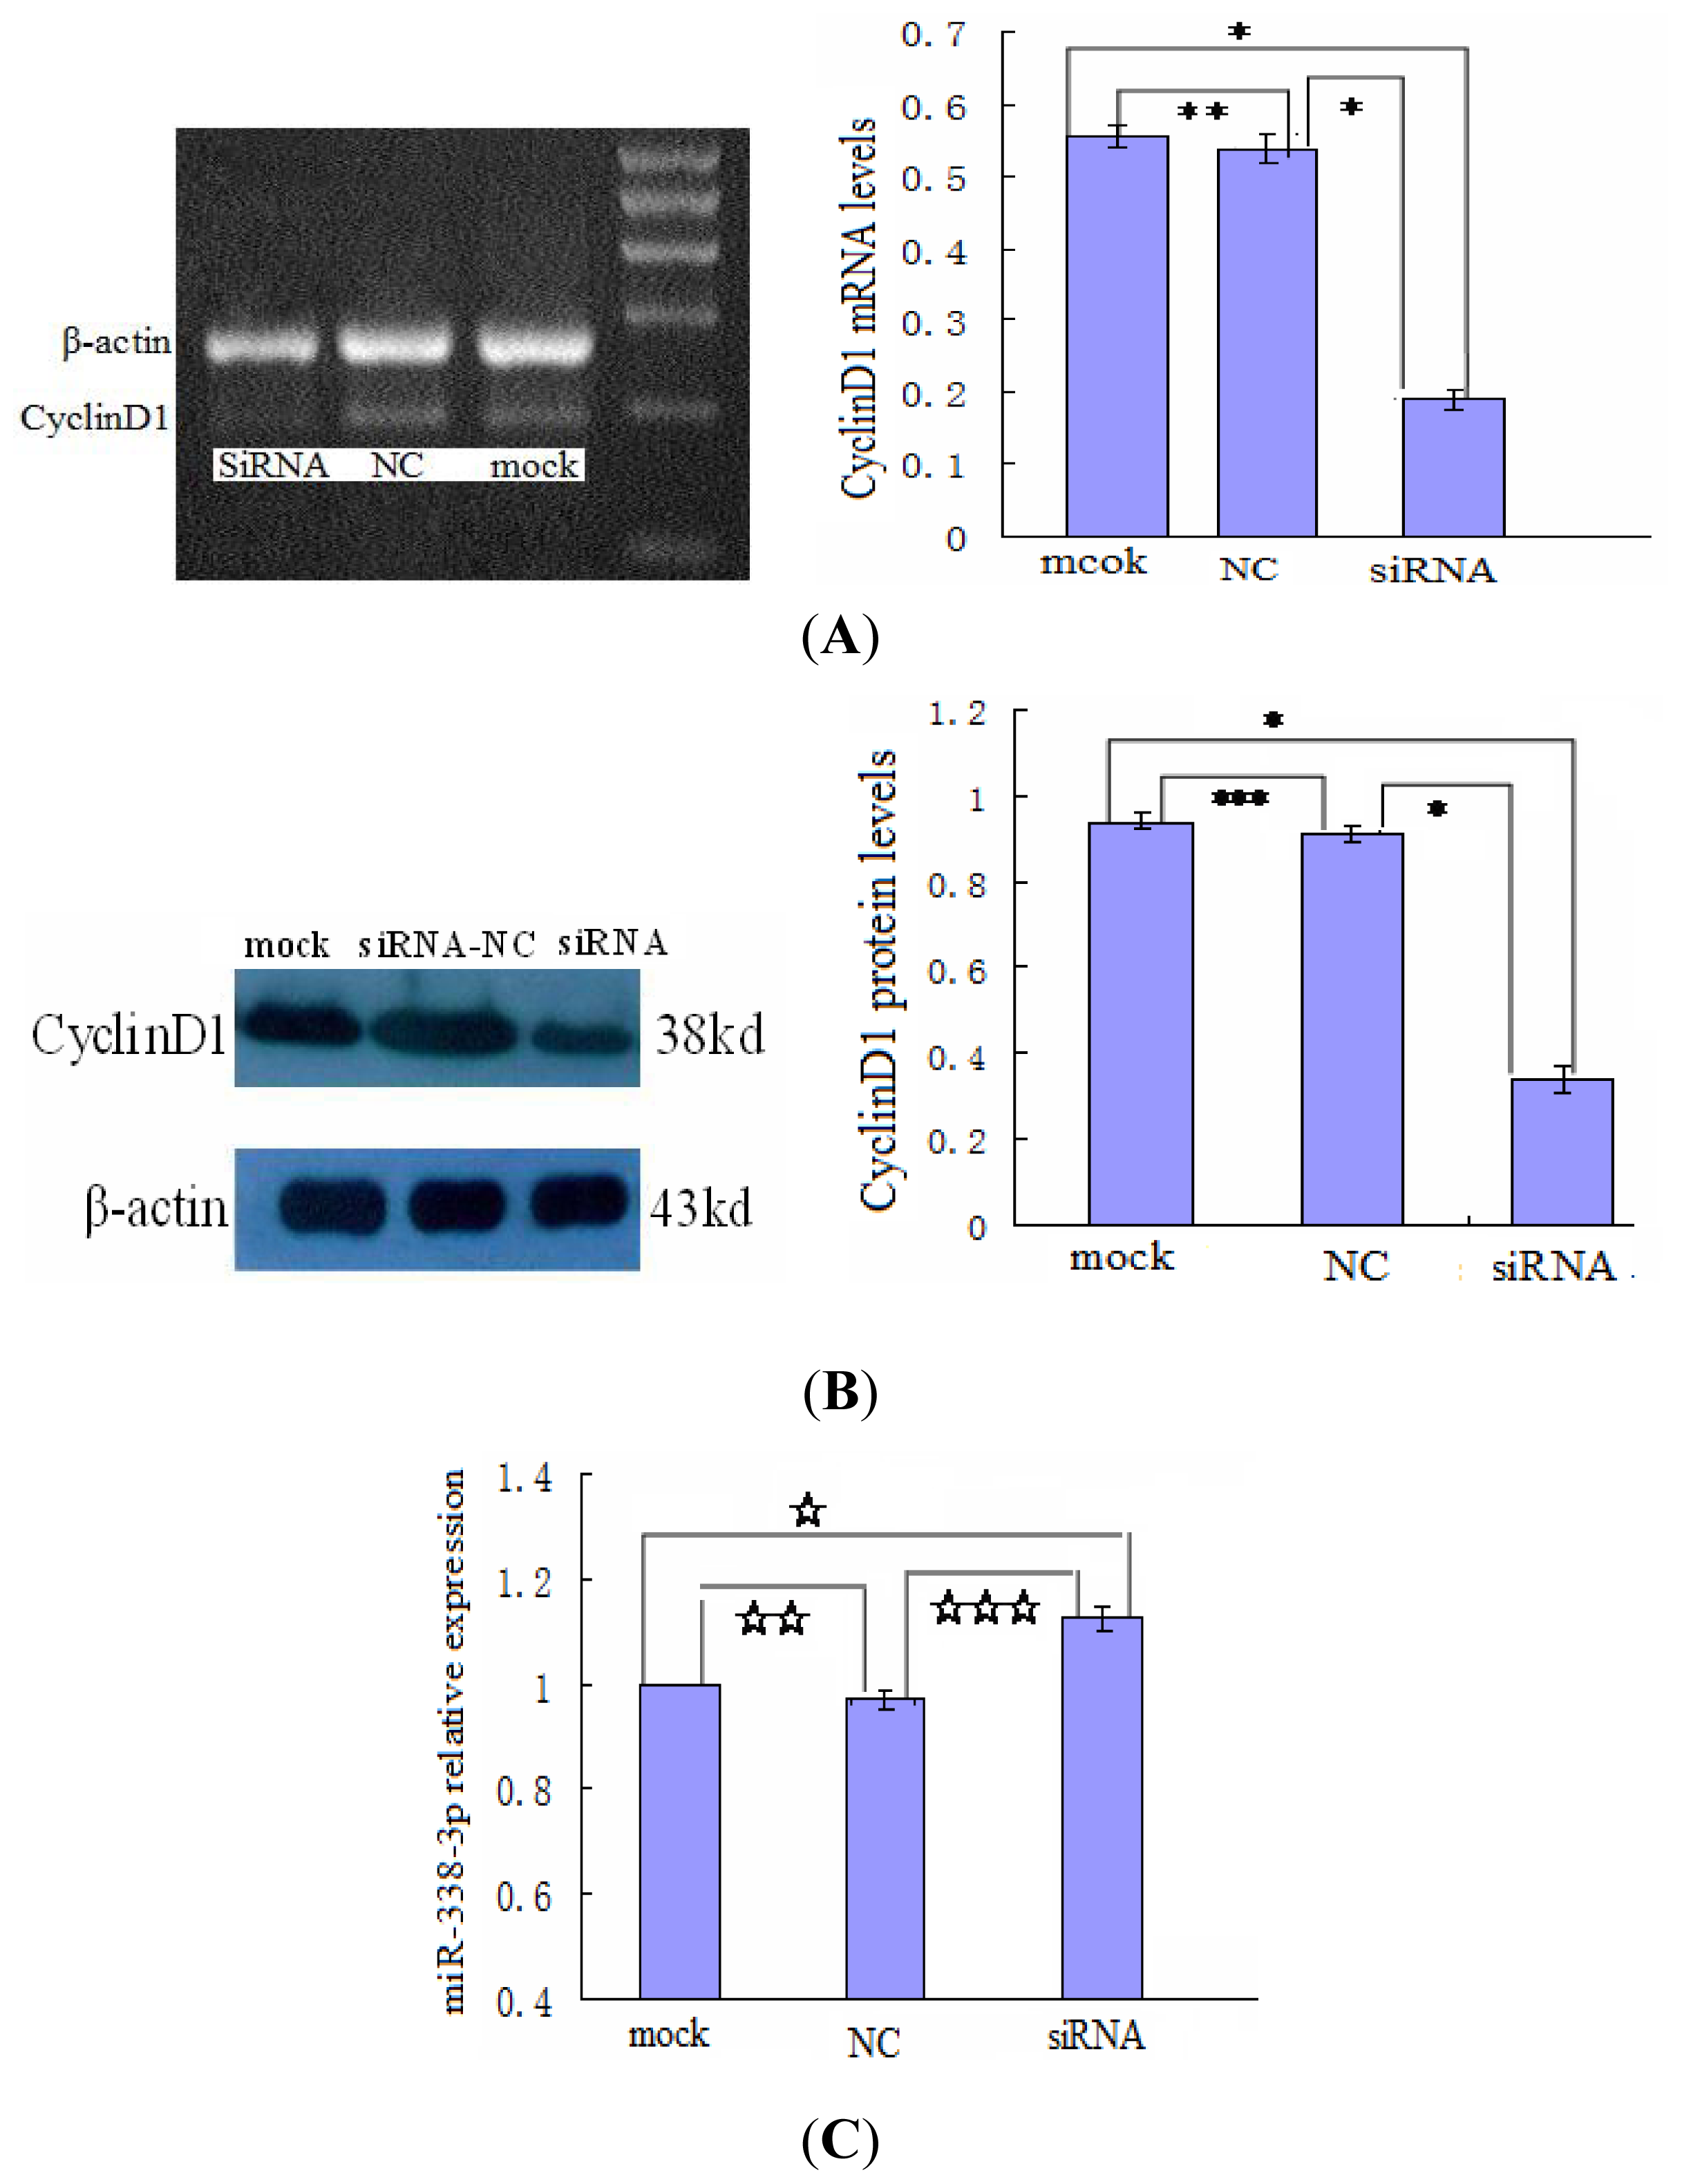
2.3. CyclinD1 Is a Direct Target of miR-338-3p, and Position 2397–2403 nt Is the Major Target Site
2.5. Changes in CyclinD1 Expression Do Not Affect miR-338-3p Expression in LO2/HBx Cells
3. Discussion
4. Experimental Section
4.1. Patient Samples
4.2. Immunohistochemistry
4.3. Cell Culture and the Establishment of Stably Transfected Cell Lines
4.4. Cell Transfection
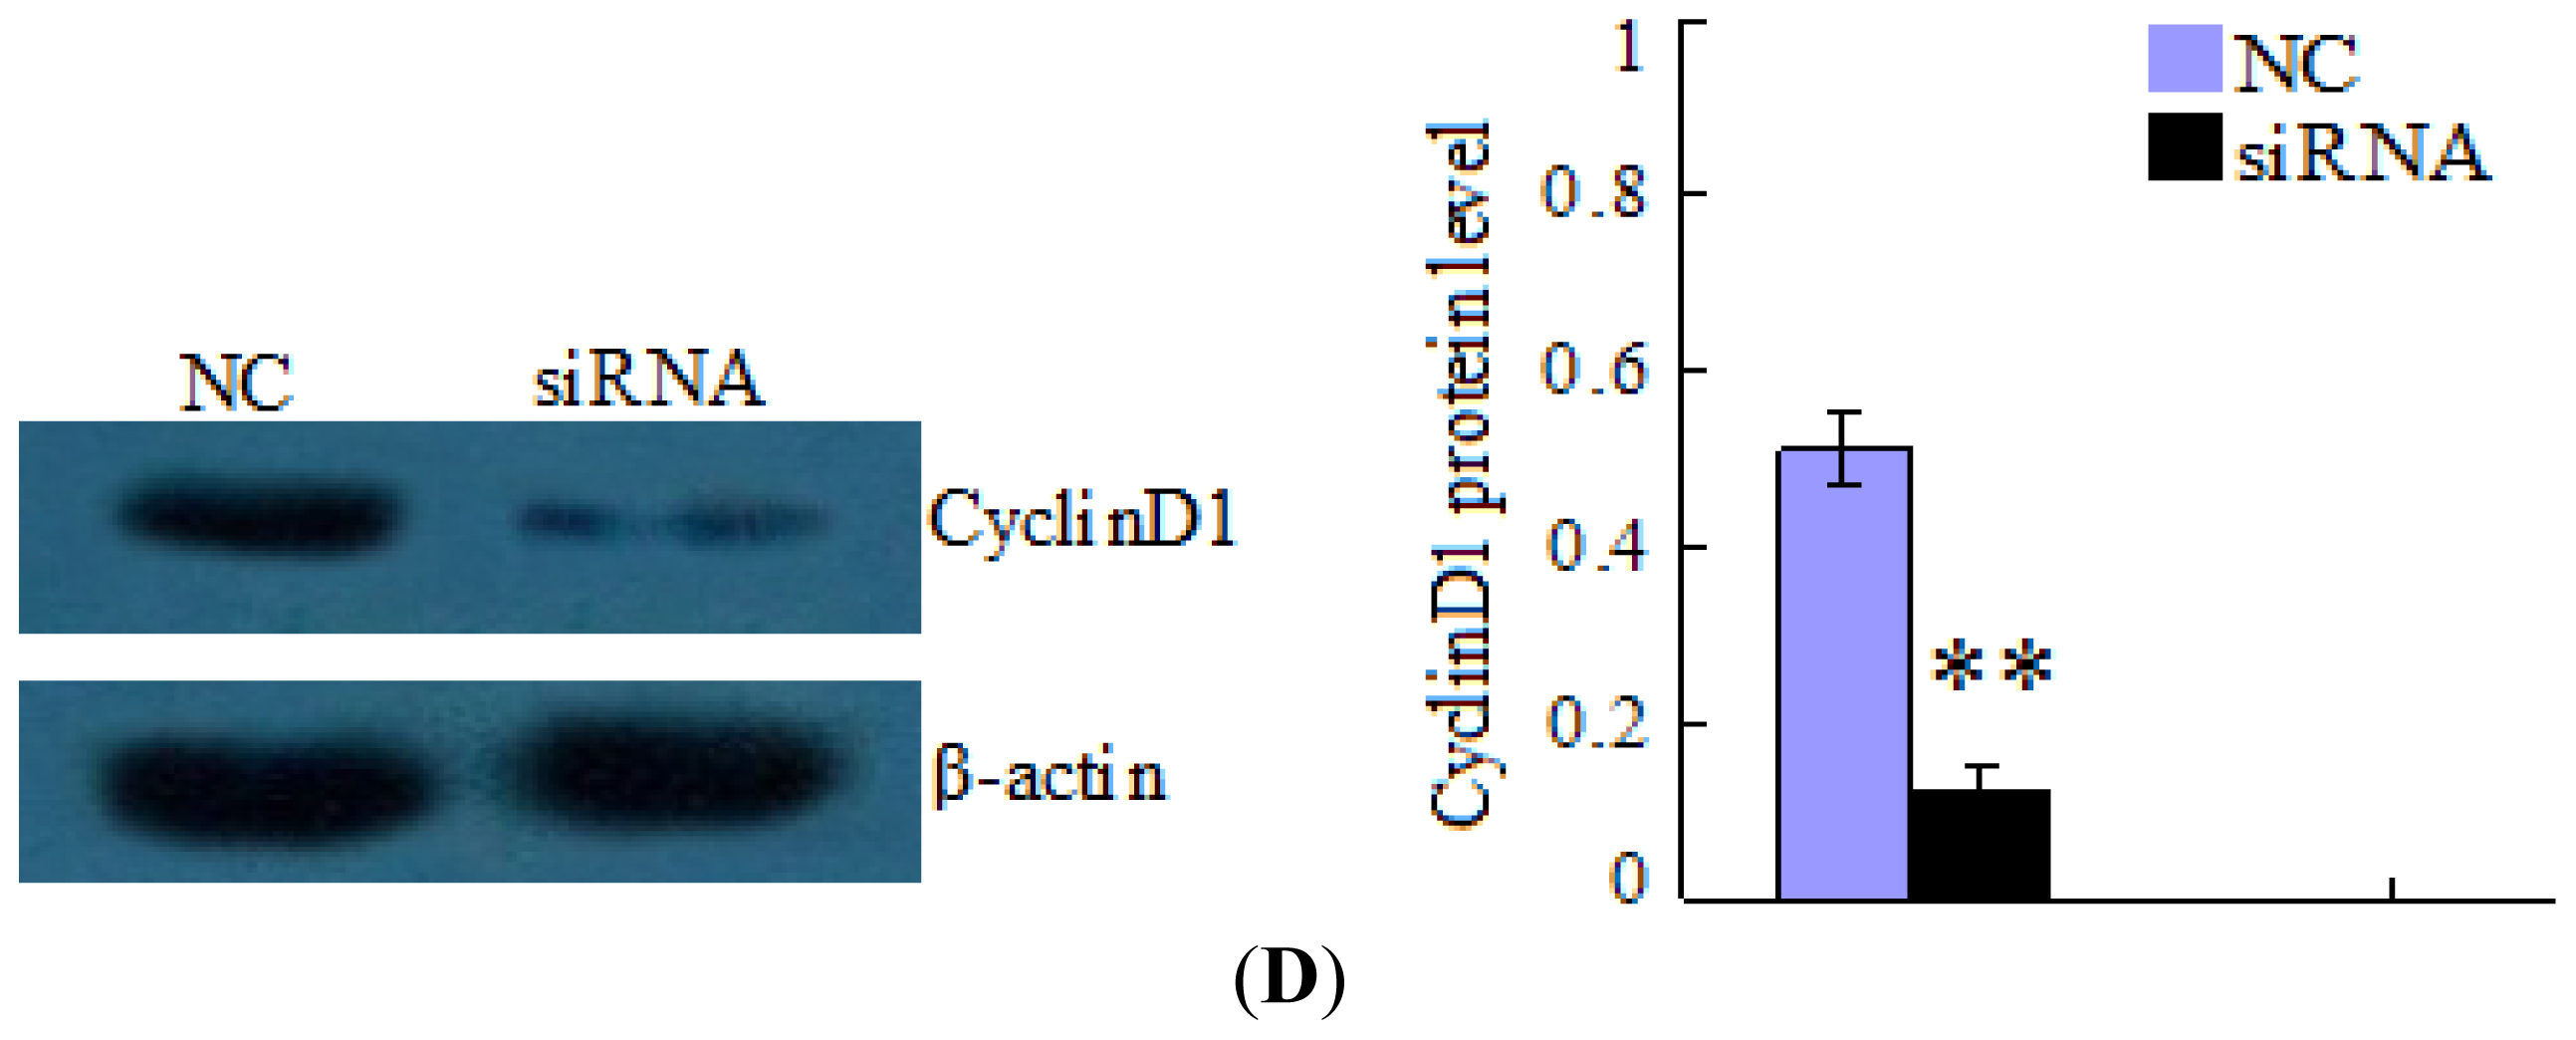
4.5. Inhibition of HBx/CyclinD1 Expression
4.6. Quantitative Real-Time PCR (qRT-PCR) Analysis
4.7. RT-PCR and Western Blot Analysis
4.8. Luciferase Reporter Assay
4.9. EdU Assay
4.10. Cell Cycle Assay
4.11. Statistical Analysis
5. Conclusions
Supplementary Information
ijms-13-08514-s001.pdfAcknowledgment
References
- Boyle, P.; Levin, B. World Cancer Report 2008; International Agency for Research on Cancer: Lyons, France, 2008; pp. 338–343. [Google Scholar]
- Bosch, F.X.; Ribes, J.; Diaz, M.; Cleries, R. Primary liver cancer: Worldwide incidence and trends. Gastroenterology 2004, 127, S5–S16. [Google Scholar]
- Arbuthnot, P.; Kew, M. Hepatitis B virus and hepatocellular carcinoma. Int. J. Exp. Pathol 2001, 82, 77–100. [Google Scholar]
- Benn, J.; Schneider, R.J. Hepatitis B virus HBx protein activates Ras-GTP complex formation and establishes a Ras, Raf, MAP kinase signaling cascade. Proc. Natl. Acad. Sci. USA 1994, 91, 10350–10354. [Google Scholar]
- Elmore, L.W.; Hancoek, A.R.; Chang, S.F.; Wang, X.W.; Chang, S.; Callahan, C.P.; Geller, D.A.; Will, H.; Harris, C.C. Hepatitis B virus X protein and p53 tumor suppressor interactions in the modulation of apoptosis. Proc. Natl. Acad. Sci. USA 1997, 94, 14707–14712. [Google Scholar]
- Diao, J.; Garces, R.; Richardson, C.D. X protein of hepatitis B virus modulates cytokine and growth factor related signal transduction pathways during the course of viral infections and hepatocarcinogenesis. Cytokine Growth Factor Rev 2001, 12, 189–205. [Google Scholar]
- Barbarotto, E.; Schmittgen, T.D.; Calin, G.A. MicroRNAs and cancer: Profile, profile, profile. Int. J. Cancer 2008, 122, 969–977. [Google Scholar]
- Varnholt, H.; Drebber, U.; Schulze, F.; Wedemeyer, I.; Schirmacher, P.; Dienes, H.P.; Odenthal, M. MicroRNA gene expression profile of hepatitis C virus-associated hepatocellular carcinoma. Hepatology 2008, 47, 1223–1232. [Google Scholar]
- Budhu, A.; Jia, H.L.; Forgues, M.; Liu, C.G.; Goldstein, D.; Lam, A.; Zanetti, K.A.; Ye, Q.H.; Qin, L.X.; Croce, C.M.; et al. Identification of metastasis-related microRNAs in hepatocellular carcinoma. Hepatology 2008, 47, 897–907. [Google Scholar]
- Wong, Q.W.; Lung, R.R.; Law, P.T.; Lai, P.B.; Chan, K.Y.; To, K.F.; Wong, N. MicroRNA-223 is commonly repressed in hepatocellular carcinoma and potentiates expression of Stathmin1. Gastroenterology 2008, 135, 257–269. [Google Scholar]
- Fornari, F.; Gramantieri, L.; Ferracin, M.; Veronese, A.; Sabbioni, S.; Calin, G.A.; Grazi, G.L.; Giovannini, C.; Croce, C.M.; Bolondi, L.; Negrini, M. MiR-221 controls CDKN1C/p57 and CDKN1B/p27 expression in human hepatocellular carcinoma. Oncogene 2008, 27, 5651–5661. [Google Scholar]
- Wang, Y.; Lu, Y.; Toh, S.T.; Sung, W.K.; Tan, P.; Chow, P.; Chung, A.Y.; Jooi, L.L.; Lee, C.G. Lethal-7 is down-regulated by the hepatitis B virus x protein and targets signal transducer and activator of transcription 3. J. Hepatol 2010, 53, 57–66. [Google Scholar]
- Hu, Z.L.; Tan, D.M.; Hou, Z.H.; Xie, P.; Liu, G.Z.; Ouyang, Y.; Liu, F.; Liu, H.B. HBx gene deletion mutant (HBx-d382) enhances the proliferation and anchorage-independent growth of L02 cells (in Chinese). World Chin. J. Digestol 2010, 18, 1109–1114. [Google Scholar]
- Chehrehasa, F.; Meedeniya, A.C.; Dwyer, P.; Abrahamsen, G.; Mackay-Sim, A. EdU, a new thymidine analogue for labelling proliferating cells in the nervous system. J. Neurosci. Methods 2009, 177, 122–130. [Google Scholar]
- Krek, A.; Grun, D.; Poy, M.N.; Wolf, R.; Rosenberg, L.; Epstein, E.J.; MacMenamin, P.; da Piedade, I.; Gunsalus, K.C.; Stoffel, M.; Rajewsky, N. Combinatorial microRNA target predictions. Nat. Genet 2005, 37, 495–500. [Google Scholar]
- Slagle, B.L.; Lee, T.H.; Medina, D.; Finegold, M.J.; Butel, J.S. Increased sensitivity to the hepatocarcinogen diethylnitrosamine in transgenic mice carrying the hepatitis B virus X gene. Mol. Carcinog 1996, 15, 261–269. [Google Scholar]
- Rabe, C.; Cheng, B.; Caselmann, W.H. Molecular mechanisms of hepatitis B virus-associated liver cancer. Dig. Dis 2001, 19, 279–287. [Google Scholar]
- Rodriguez, A.; Griffiths-Jones, S.; Ashurst, J.L.; Bradley, A. Identification of mammalian microRNA host genes and transcription units. Genome Res 2004, 14, 1902–1910. [Google Scholar]
- Raghunath, M.; Patti, R.; Bannerman, P.; Lee, C.M.; Baker, S.; Sutton, L.N.; Phillips, P.C.; Damodar Reddy, C. A novel kinase, AATYK induces and promotes neuronal differentiation in a human neuroblastoma (SH-SY5Y) cell line. Brain Res. Mol. Brain Res 2000, 77, 151–162. [Google Scholar]
- Liu, Y.; Zhao, J.J.; Wang, C.M.; Li, M.Y.; Han, P.; Wang, L.; Cheng, Y.Q.; Zoulim, F.; Ma, X.; Xu, D.P. Altered expression profiles of microRNAs in a stable hepatitis B virus-expressing cell line. Chin. Med. J 2009, 122, 10–14. [Google Scholar]
- Huang, X.H.; Wang, Q.; Chen, J.S.; Fu, X.H.; Chen, X.L.; Chen, L.Z.; Li, W.; Bi, J.; Zhang, L.J.; Fu, Q.; et al. Bead-based microarray analysis of microRNA expression in hepatocellular carcinoma: miR-338 is down-regulated. Hepatol. Res 2009, 39, 786–794. [Google Scholar]
- Hulit, J.; Lee, R.J.; Russell, R.G.; Pestell, R.G. ErbB-2-induced mammary tumor growth: The role of cyclinD1 and p27kip1. Biochem. Pharmacol 2002, 64, 827–836. [Google Scholar]
- Montorsi, M.; Maggioni, M.; Falleni, M.; Pellegrini, C.; Donadon, M.; Torzilli, G.; Santambrogio, R.; Spinelli, A.; Coggi, G.; Bosari, S. Survivin gene expression in chronic liver disease and hepatocellular carcinoma. Hepatogastroenterology 2007, 54, 2040–2044. [Google Scholar]
- Plantaz, D.; Mohapatra, G.; Matthay, K.K.; Pellarin, M.; Seeger, R.C.; Feuerstein, B.G. Gain of chromosome 17 is the most frequent abnormality detected in neuroblastoma by comparative genomic hybridization. Am. J. Pathol 1997, 150, 81–89. [Google Scholar]
- Aschrafi, A.; Schwechter, A.D.; Mameza, M.G.; Natera-Naranjo, O.; Gioio, A.E.; Kaplan, B.B. MicroRNA-338 regulates local cytochrome c oxidase IV mRNA levels and oxidative phosphorylation in the axons of sympathetic neurons. J. Neurosci 2008, 28, 12581–12590. [Google Scholar]
- Huang, X.H.; Chen, J.S.; Wang, Q.; Chen, X.L.; Wen, L.; Chen, L.Z.; Bi, J.; Zhang, L.J.; Su, Q.; Zeng, W.T. miR-338-3p Suppresses invasion of liver cancer cell by targeting smoothened. J. Pathol 2011, 225, 463–472. [Google Scholar]
- Ruizi, A.A.; Sánchez, P.; Dahmane, N. Gli and hedgehog in cancer: Tumours, embryos and stem cells. Nat. Rev. Cancer 2002, 2, 361–372. [Google Scholar]
- Fu, M.; Wang, C.; Li, Z.; Sakamaki, T.; Pestell, R.G. Minireview: Cyclin D1: Normal and abnormal functions. Endocrinology 2004, 145, 5439–5447. [Google Scholar]
- Imoto, M.; Doki, Y.; Jiang, W.; Han, E.K.; Weinstein, I.B. Effects of cyclin D1 overexpression on G1 progression-related events. Exp. Cell Res 1997, 236, 173–180. [Google Scholar]
- Murillo, C.A.; Rychahou, P.G.; Evers, B.M. RNAi-mediated inhibition of cyclin D1 decreases colon cancer cell proliferation and MMP protein expression. J. Am. Coll. Surgeons 2004, 199, 11. [Google Scholar]
- Bouchard, M.; Giannakopoulos, S.; Wang, E.H.; Tanese, N.; Schneider, R.J. Hepatitis B virus HBx protein activation of cyclin A-cyclin-dependent kinase 2 complexes and G1 transit via a Src kinase pathway. J. Virol 2001, 75, 4247–4257. [Google Scholar]
- Benn, J.; Schneider, R.J. Hepatitis B virus HBx protein deregulates cell cycle checkpoint controls. Proc. Natl. Acad. Sci. USA 1995, 92, 11215–11219. [Google Scholar]
- Gearhart, T.L.; Bouchard, M.J. The hepatitis B virus X protein modulates hepatocyte proliferation pathways to stimulate viral replication. J. Virol 2010, 84, 2675–2686. [Google Scholar]
- Klein, A.; Guhl, E.; Tzeng, Y.J.; Fuhrhop, J.; Levrero, M.; Graessmann, M.; Graessmann, A. HBx causes cyclin D1 overexpression and development of breast cancer in transgenic animals that are heterozygous for p53. Oncogene 2003, 22, 2910–2919. [Google Scholar]
- Park, S.G.; Chung, C.; Kang, H.; Kim, J.Y.; Jung, G. Up-regulation of cyclin D1 by HBx is mediated by NF-kappaB2/BCL3 complex through kappaB site of cyclin D1 promoter. J. Biol. Chem 2006, 281, 31770–31777. [Google Scholar]
- Jiang, Q.; Feng, M.G.; Mo, Y.Y. Systematic validation of predicted microRNAs for cyclin D1. BMC Cancer 2009, 9. [Google Scholar] [CrossRef]
- Chen, J.; Feilotter, H.E.; Paré, G.C.; Zhang, X.; Pemberton, J.G.; Garady, C.; Lai, D.; Yang, X.; Tron, V.A. MicroRNA-193b Represses Cell Proliferation and Regulates Cyclin D1 in Melanoma. Am. J. Path 2010, 176, 2520–2529. [Google Scholar]
- Feng, M.; Li, Z.; Aau, M.; Wong, C.H.; Yang, X.; Yu, Q. Myc/miR-378/TOB2/cyclin D1 functional module regulates oncogenic transformation. Oncogene 2011, 30, 2242–2251. [Google Scholar]
- Zhang, W.; Kong, G.; Zhang, J.; Wang, T.; Ye, L.; Zhang, X. microRNA-520b Inhibits growth of hepatoma cells by targeting MEKK2 and Cyclin D1. PLoS One 2012, 7. [Google Scholar] [CrossRef]
- Nie, J.; Liu, L.; Zheng, W.; Chen, L.; Wu, X.; Xu, Y.; Du, X.H.; Han, W.D. microRNA-365, Down-regulated in colon cancer, inhibits cell cycle progression and promotes apoptosis of colon cancer cells by probably targeting Cyclin D1 and Bcl-2. Carcinogenesis 2012, 33, 220–225. [Google Scholar]
- Fromowitz, F.B.; Viola, M.V.; Chao, S.; Oravez, S.; Mishriki, Y.; Finkel, G.; Grimson, R.; Lundy, J. ras p21 Expression in the progression of breast cancer. Hum. Pathol 1987, 18, 1268–1275. [Google Scholar]
- Zhu, P.; Tan, D.; Peng, Z.; Liu, F.; Song, L. Polymorphism analyses of hepatitis B virus X gene in hepatocellular carcinoma patients from southern China. Acta Biochim. Biophys. Sin. (Shanghai) 2007, 39, 265–272. [Google Scholar]


© 2012 by the authors; licensee Molecular Diversity Preservation International, Basel, Switzerland. This article is an open-access article distributed under the terms and conditions of the Creative Commons Attribution license (http://creativecommons.org/licenses/by/3.0/).
Share and Cite
Fu, X.; Tan, D.; Hou, Z.; Hu, Z.; Liu, G. miR-338-3p Is Down-Regulated by Hepatitis B Virus X and Inhibits Cell Proliferation by Targeting the 3′-UTR Region of CyclinD1. Int. J. Mol. Sci. 2012, 13, 8514-8539. https://doi.org/10.3390/ijms13078514
Fu X, Tan D, Hou Z, Hu Z, Liu G. miR-338-3p Is Down-Regulated by Hepatitis B Virus X and Inhibits Cell Proliferation by Targeting the 3′-UTR Region of CyclinD1. International Journal of Molecular Sciences. 2012; 13(7):8514-8539. https://doi.org/10.3390/ijms13078514
Chicago/Turabian StyleFu, Xiaoyu, Deming Tan, Zhouhua Hou, Zhiliang Hu, and Guozhen Liu. 2012. "miR-338-3p Is Down-Regulated by Hepatitis B Virus X and Inhibits Cell Proliferation by Targeting the 3′-UTR Region of CyclinD1" International Journal of Molecular Sciences 13, no. 7: 8514-8539. https://doi.org/10.3390/ijms13078514
APA StyleFu, X., Tan, D., Hou, Z., Hu, Z., & Liu, G. (2012). miR-338-3p Is Down-Regulated by Hepatitis B Virus X and Inhibits Cell Proliferation by Targeting the 3′-UTR Region of CyclinD1. International Journal of Molecular Sciences, 13(7), 8514-8539. https://doi.org/10.3390/ijms13078514