The Three Dimensional Quantitative Structure Activity Relationships (3D-QSAR) and Docking Studies of Curcumin Derivatives as Androgen Receptor Antagonists

Abstract
:1. Introduction
2. Material and Methods
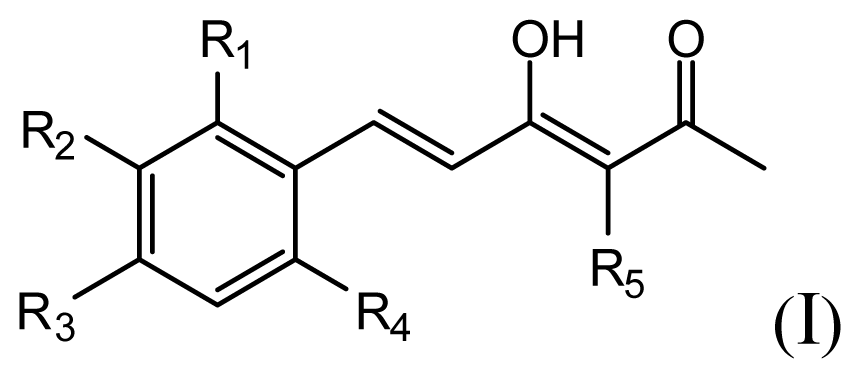
2.1. Data Sets
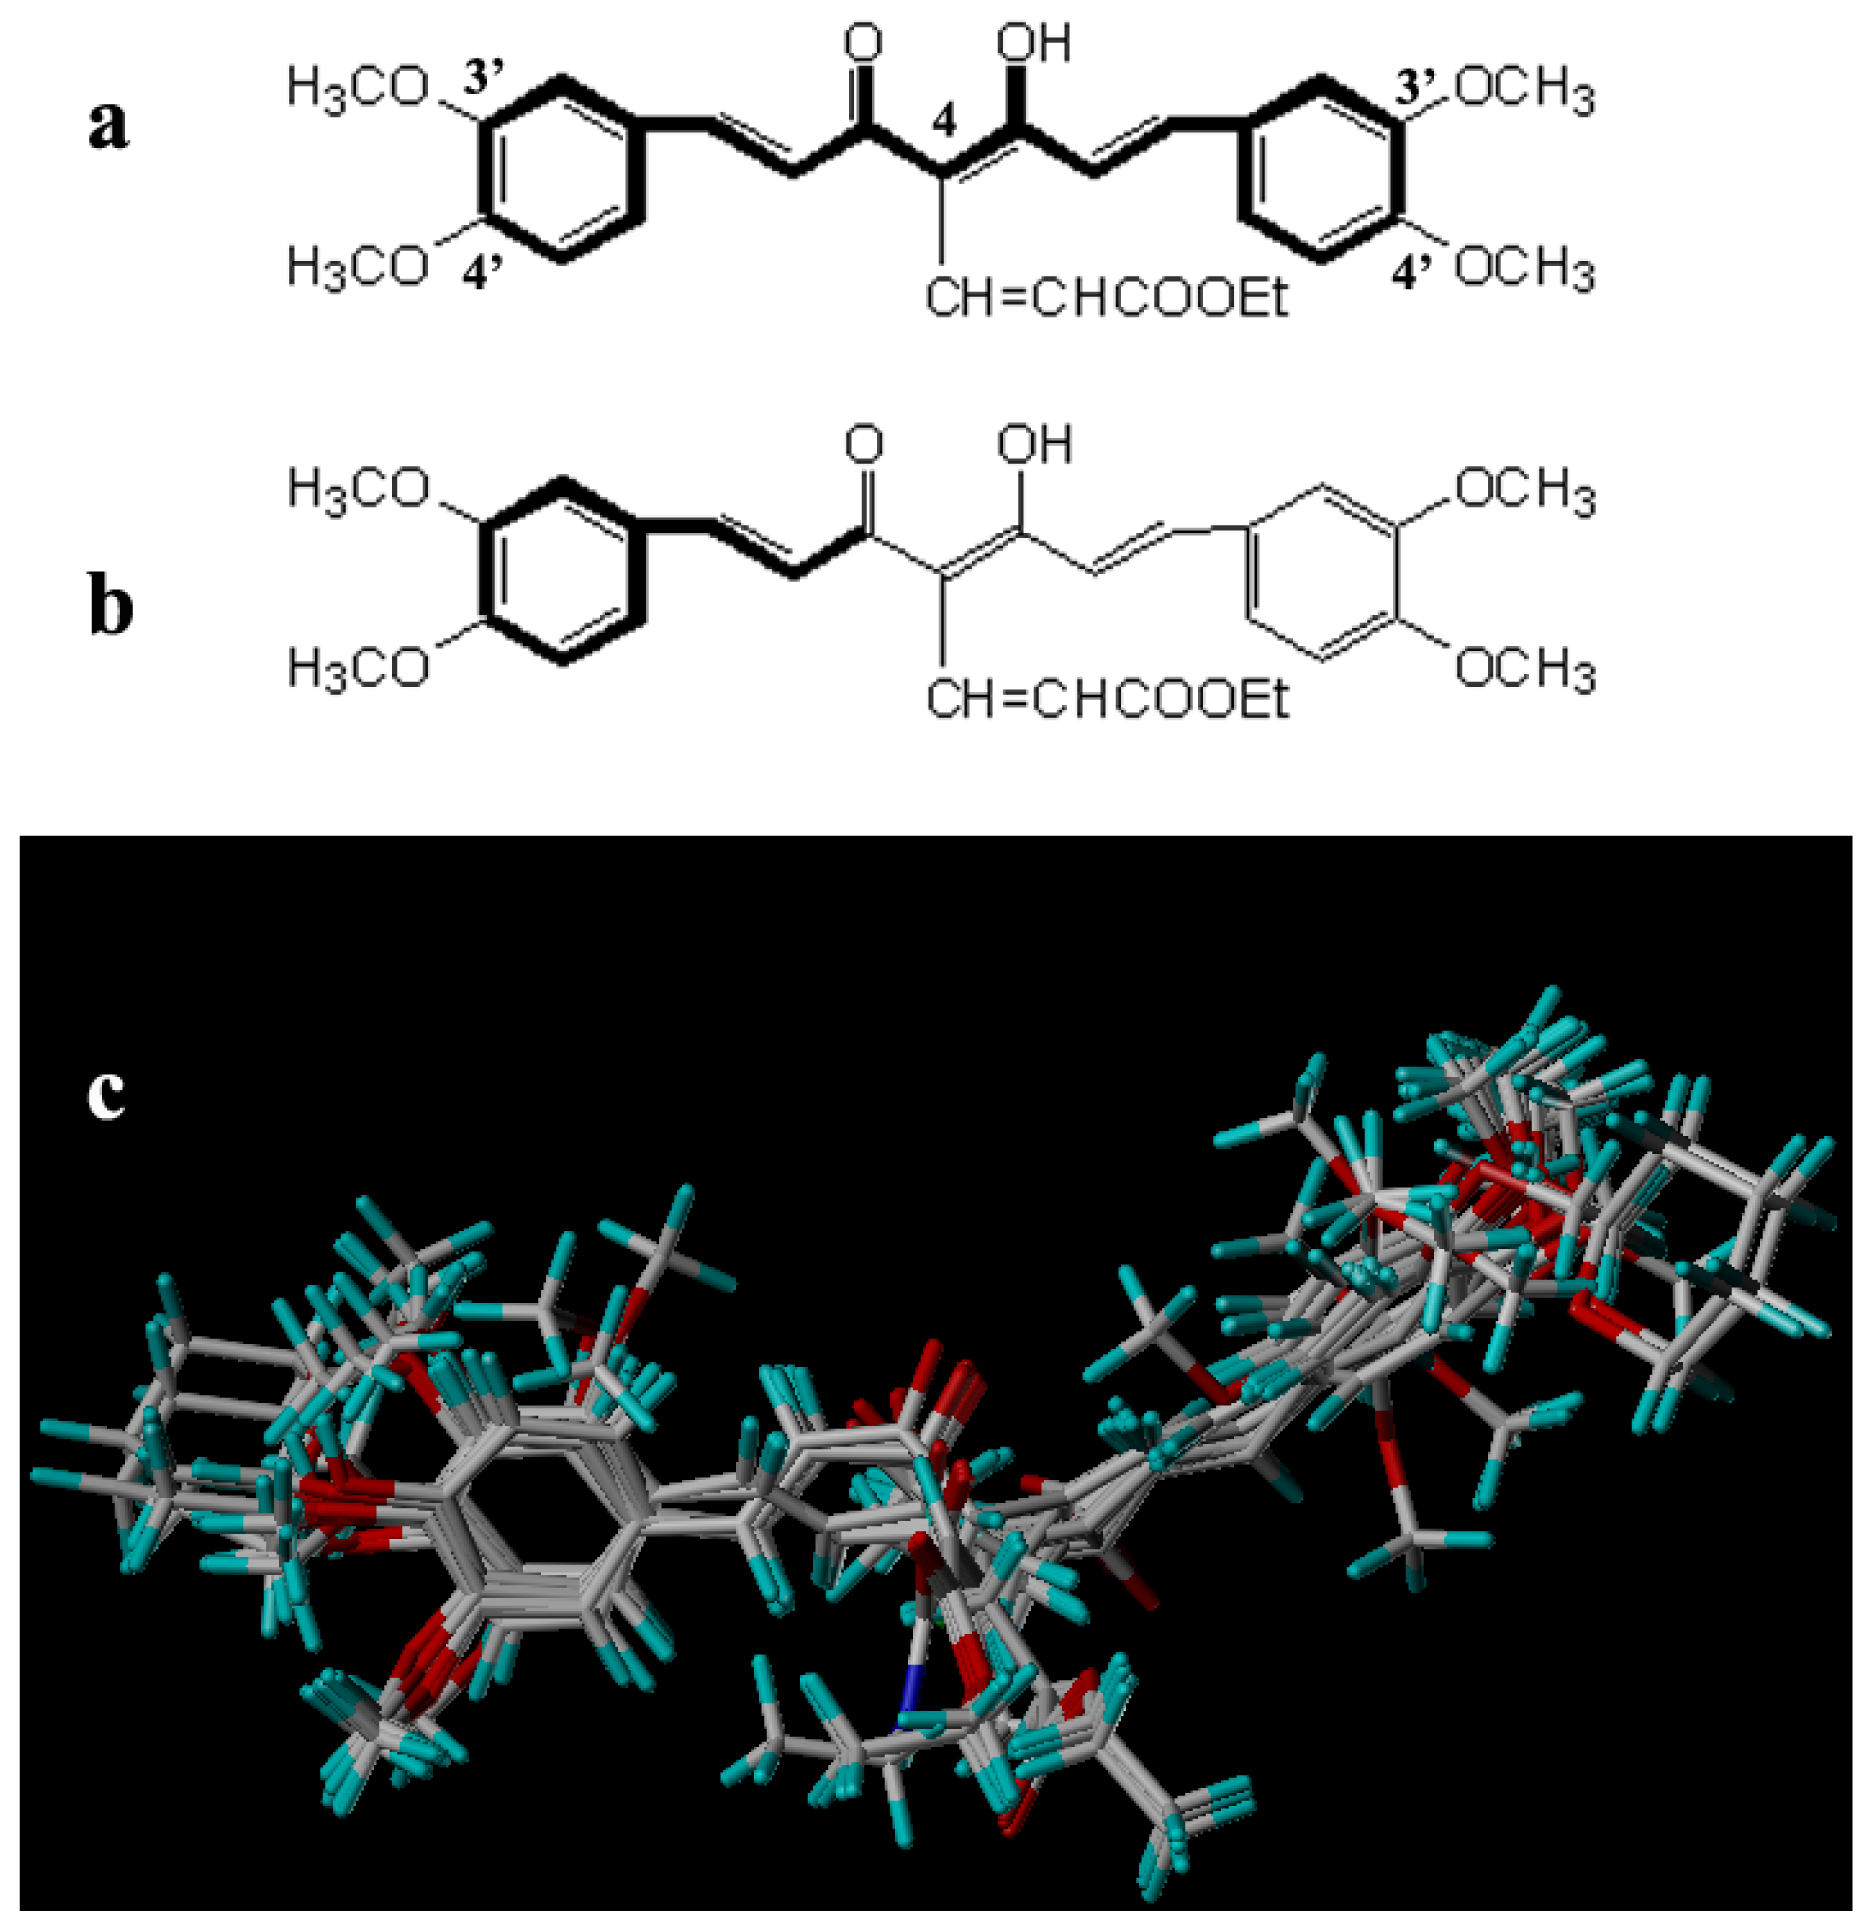
2.2. Molecular Modeling and Alignment
2.3. CoMFA and CoMSIA Field Calculation
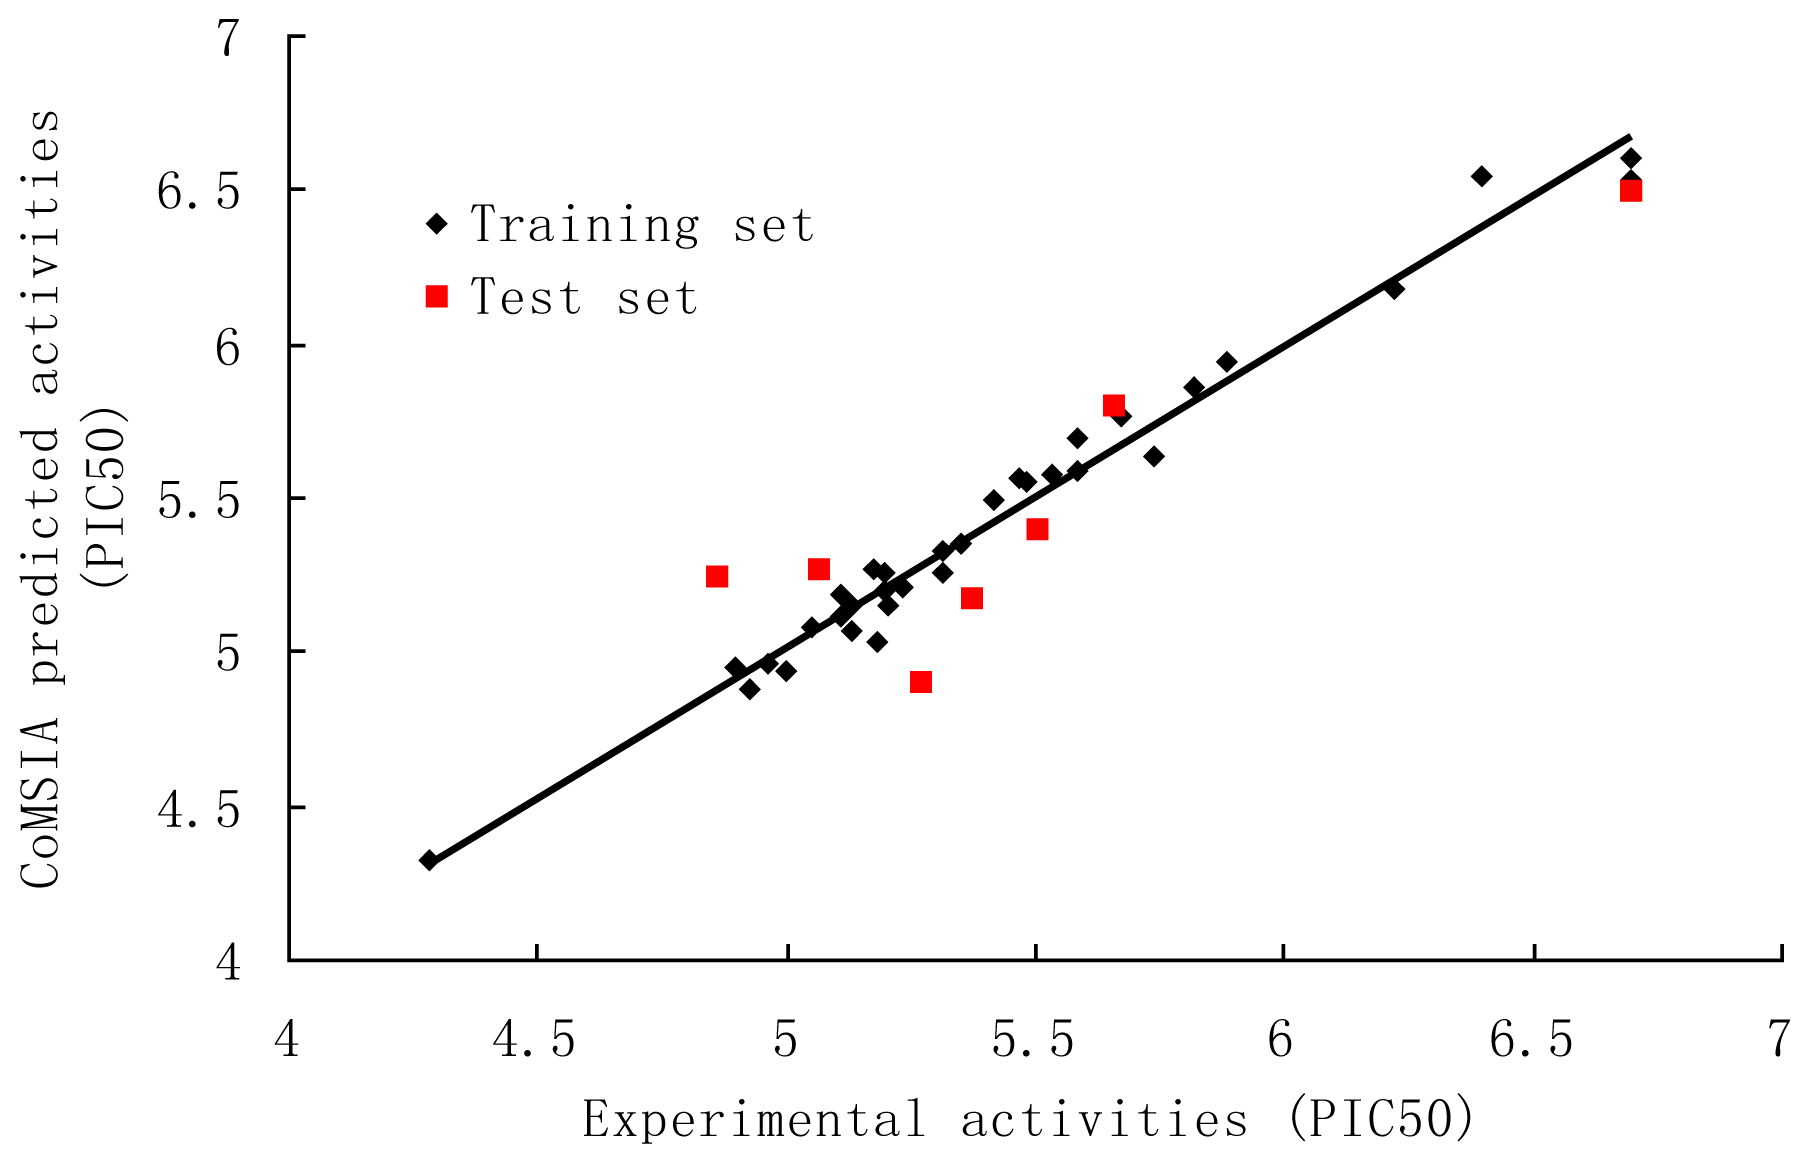
2.4. Partial Least Square Analysis
2.5. Molecular Docking
3. Results and Discussion
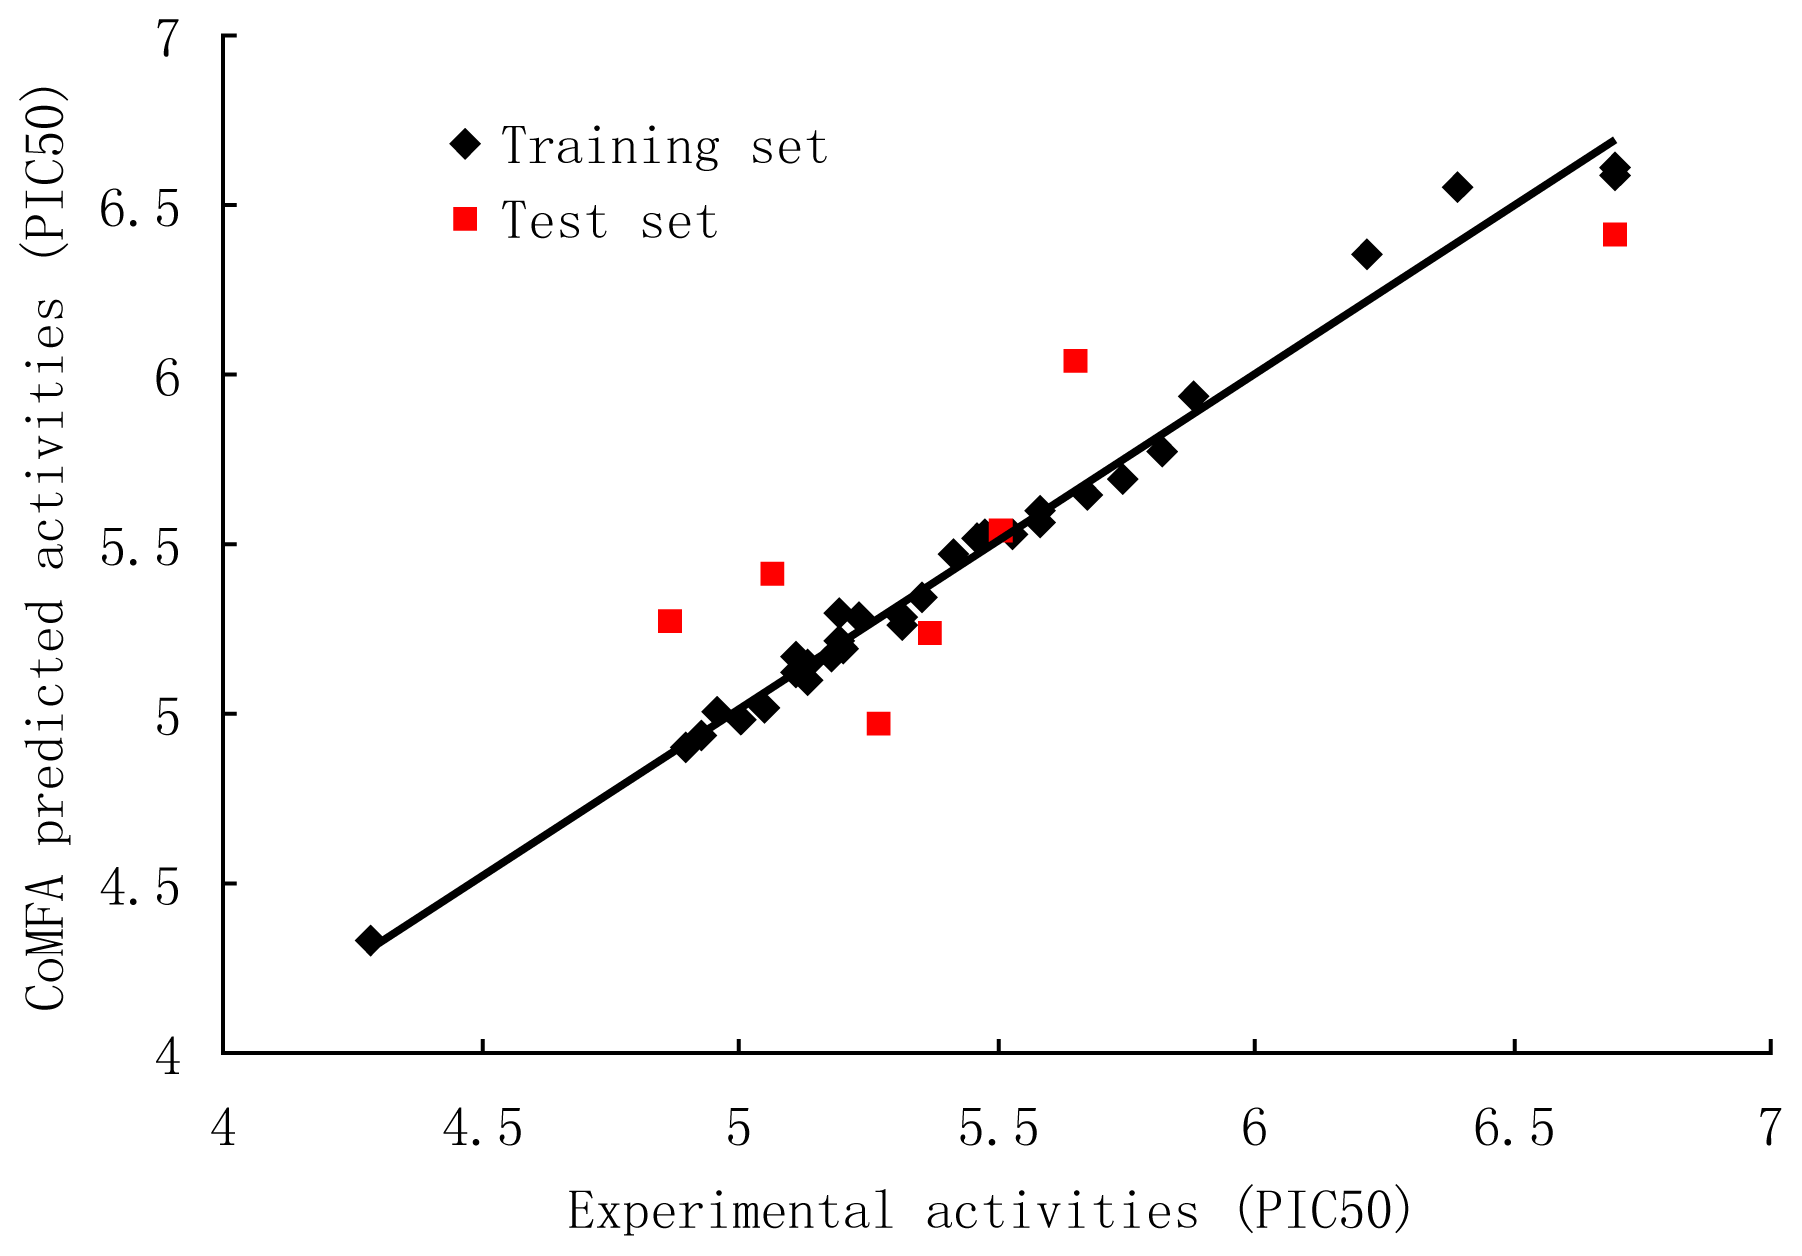
3.1. CoMFA and CoMFA Region Focusing
3.2. CoMSIA
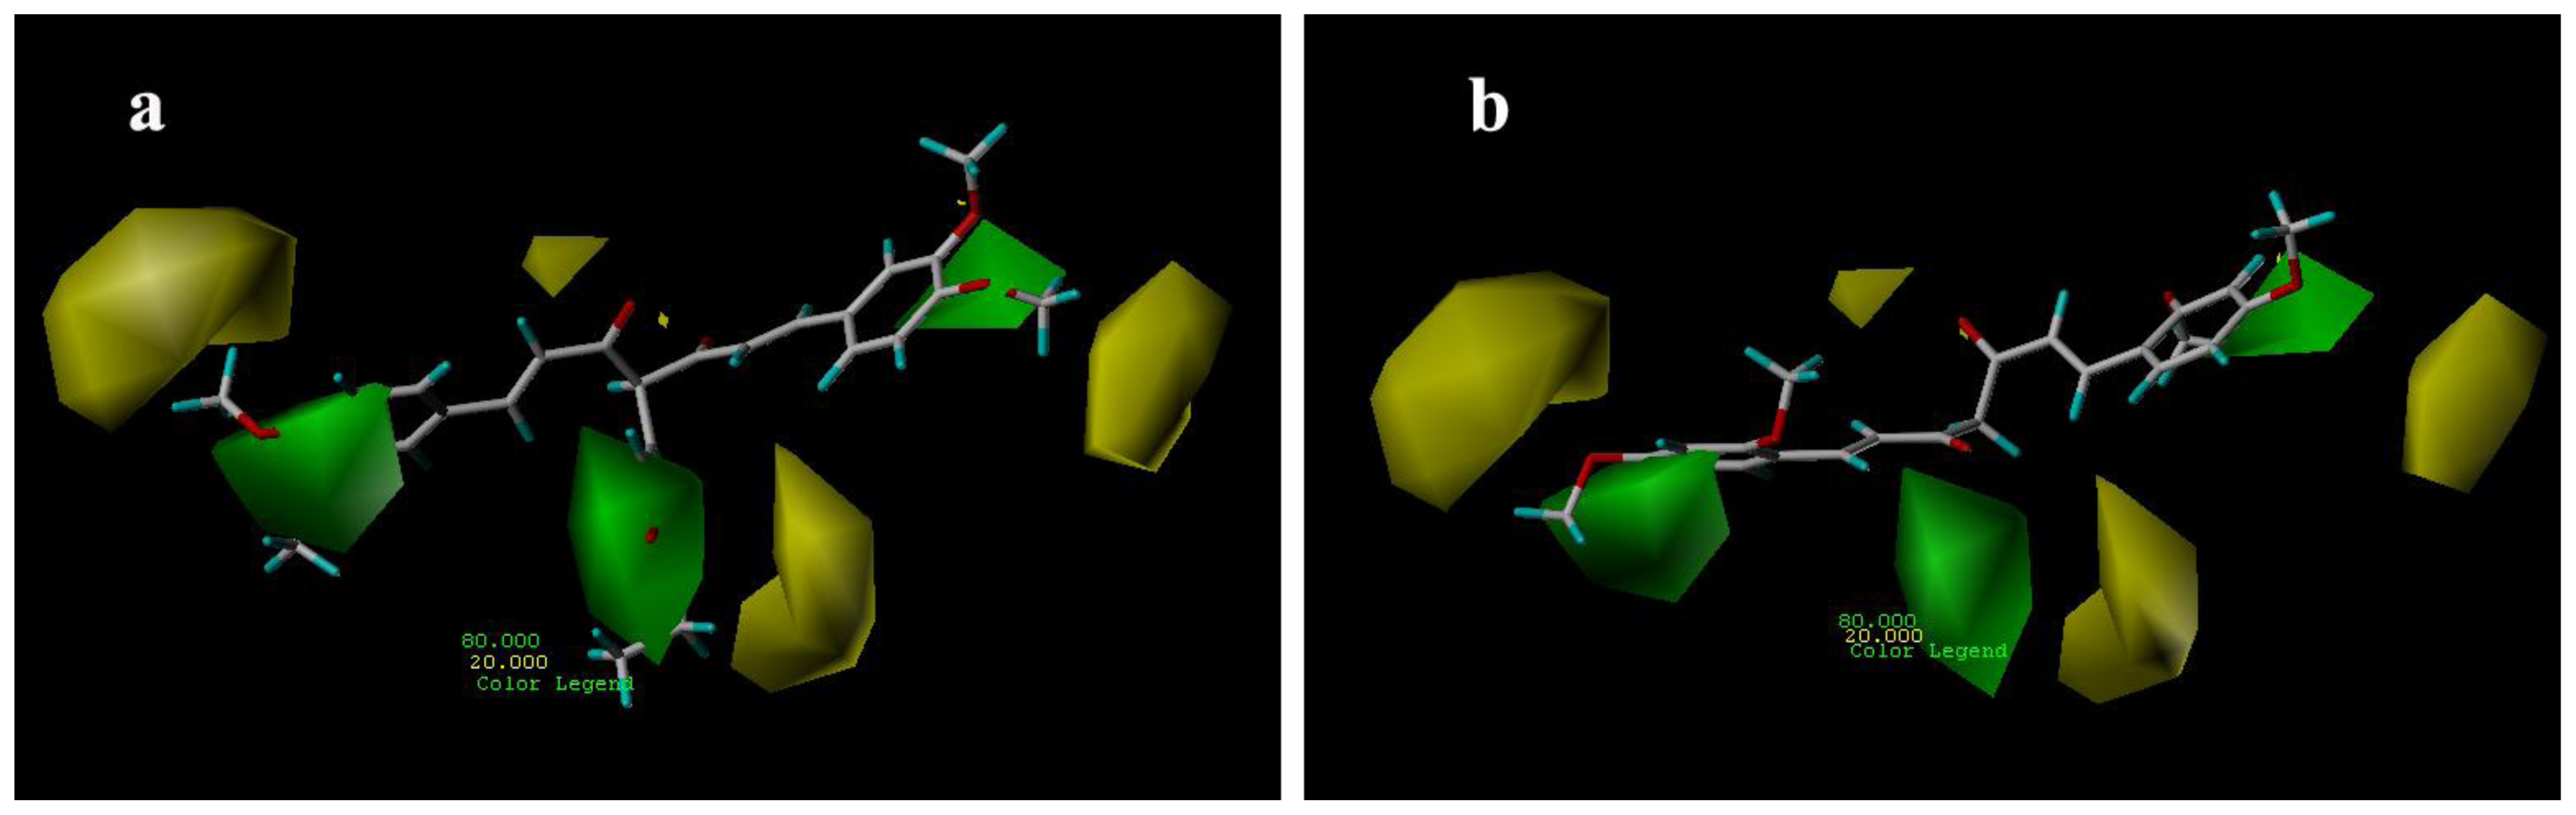
3.3. Contour Maps Analysis
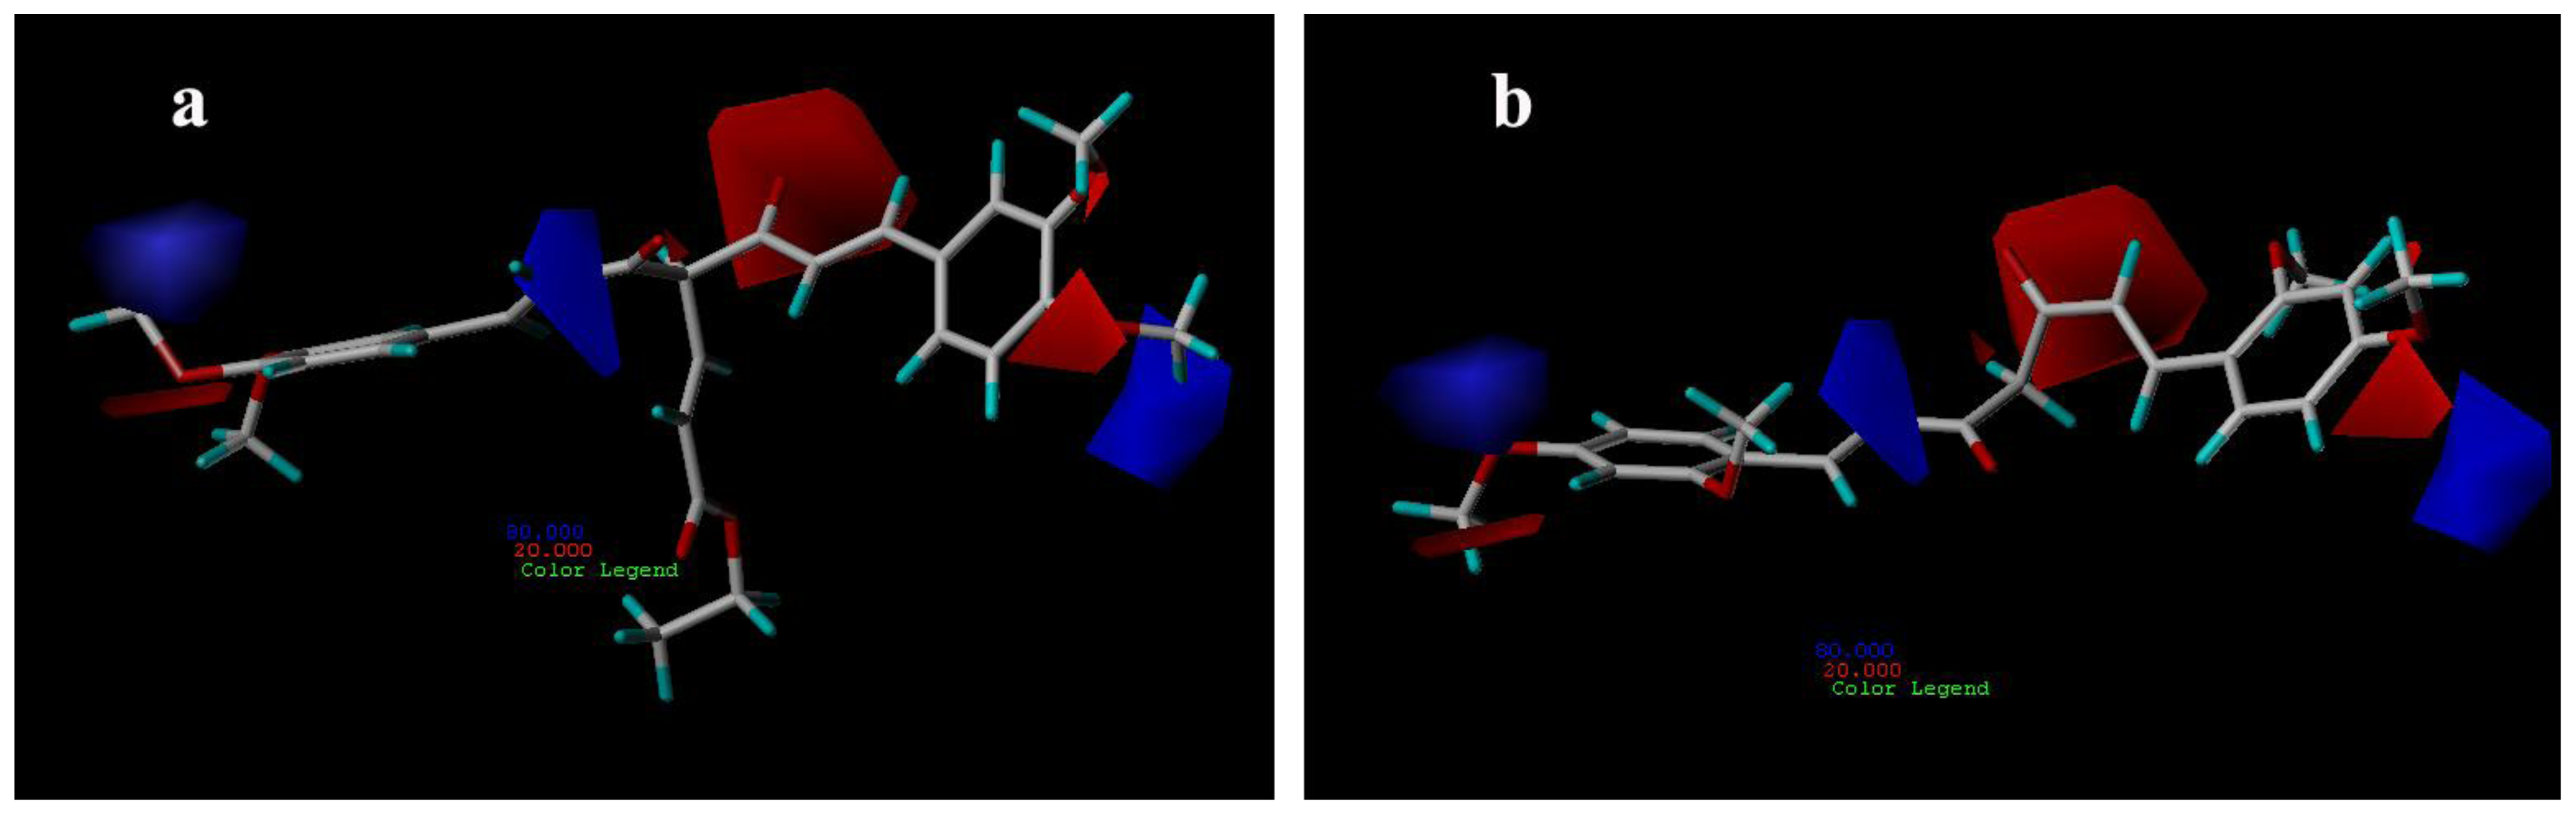
3.3.1. CoMFA Contour Maps
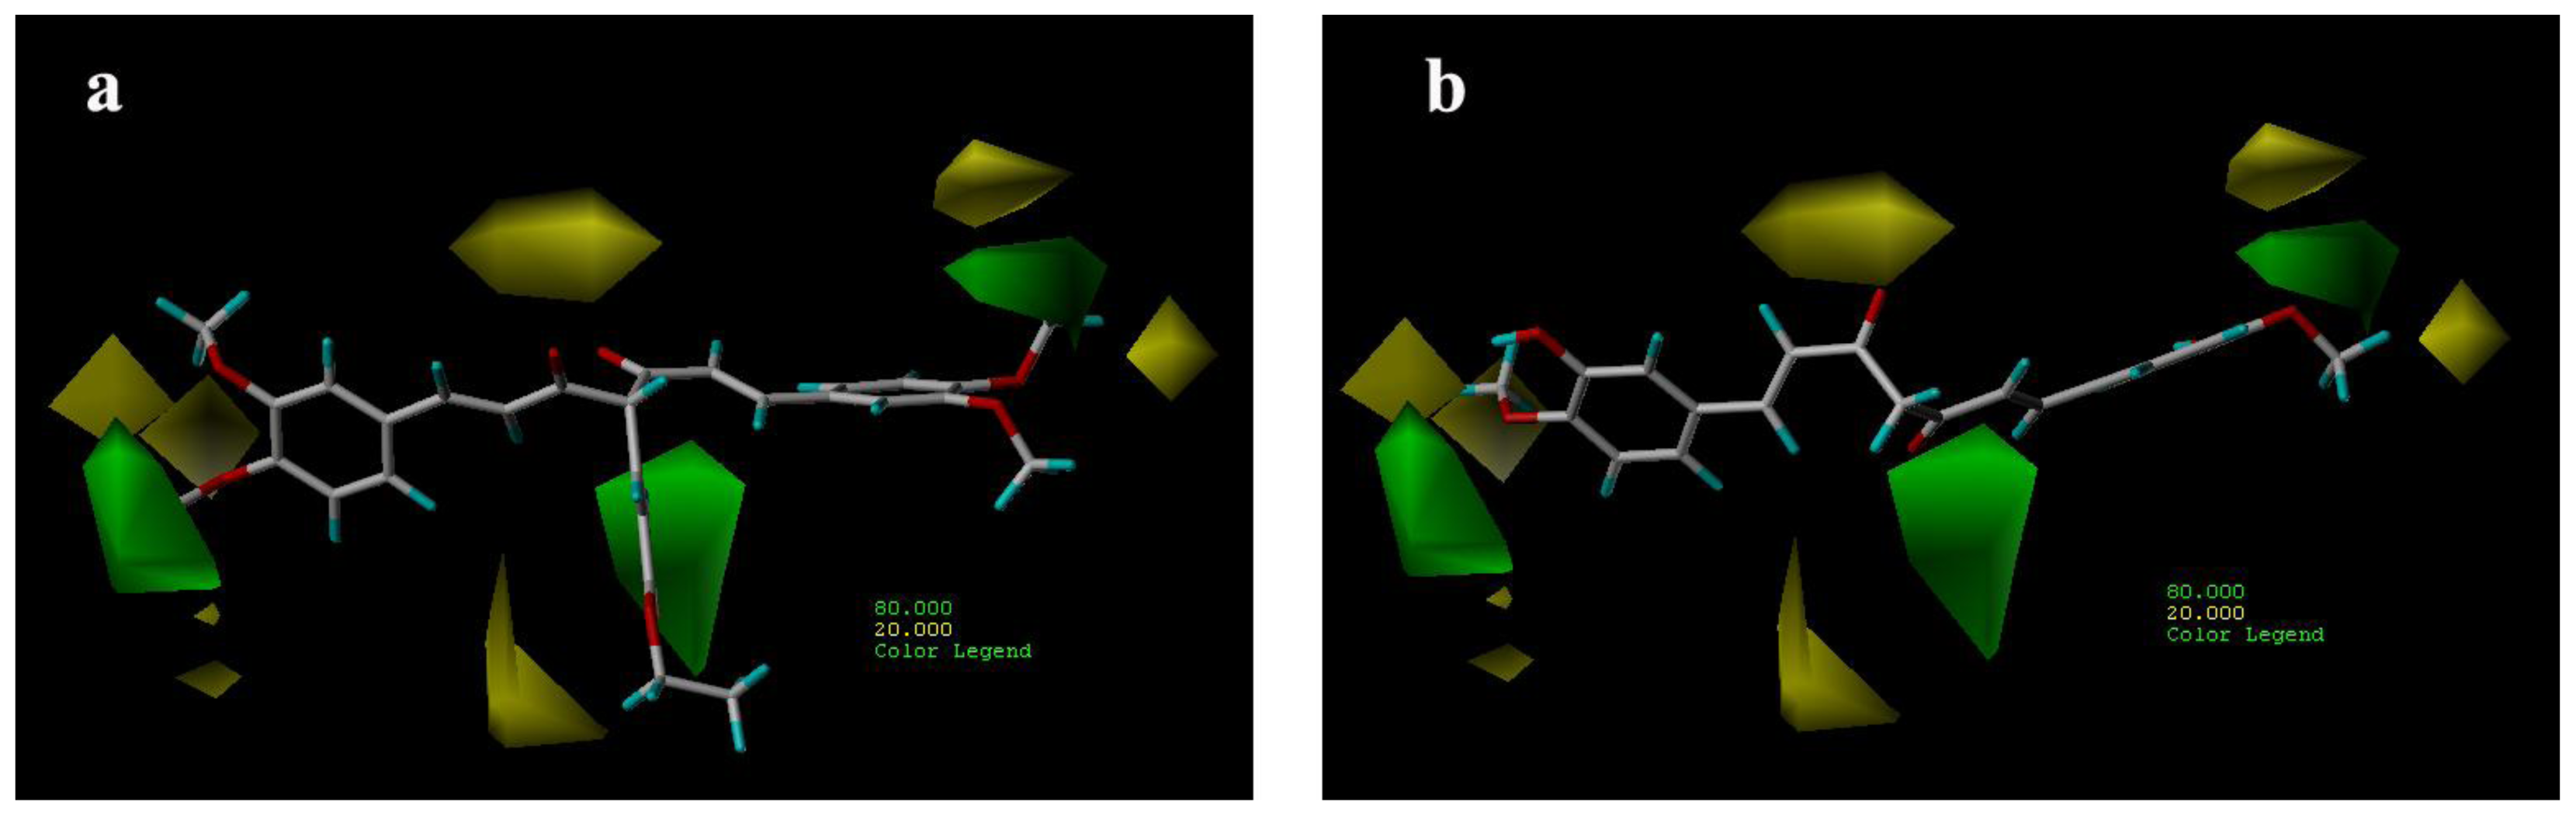
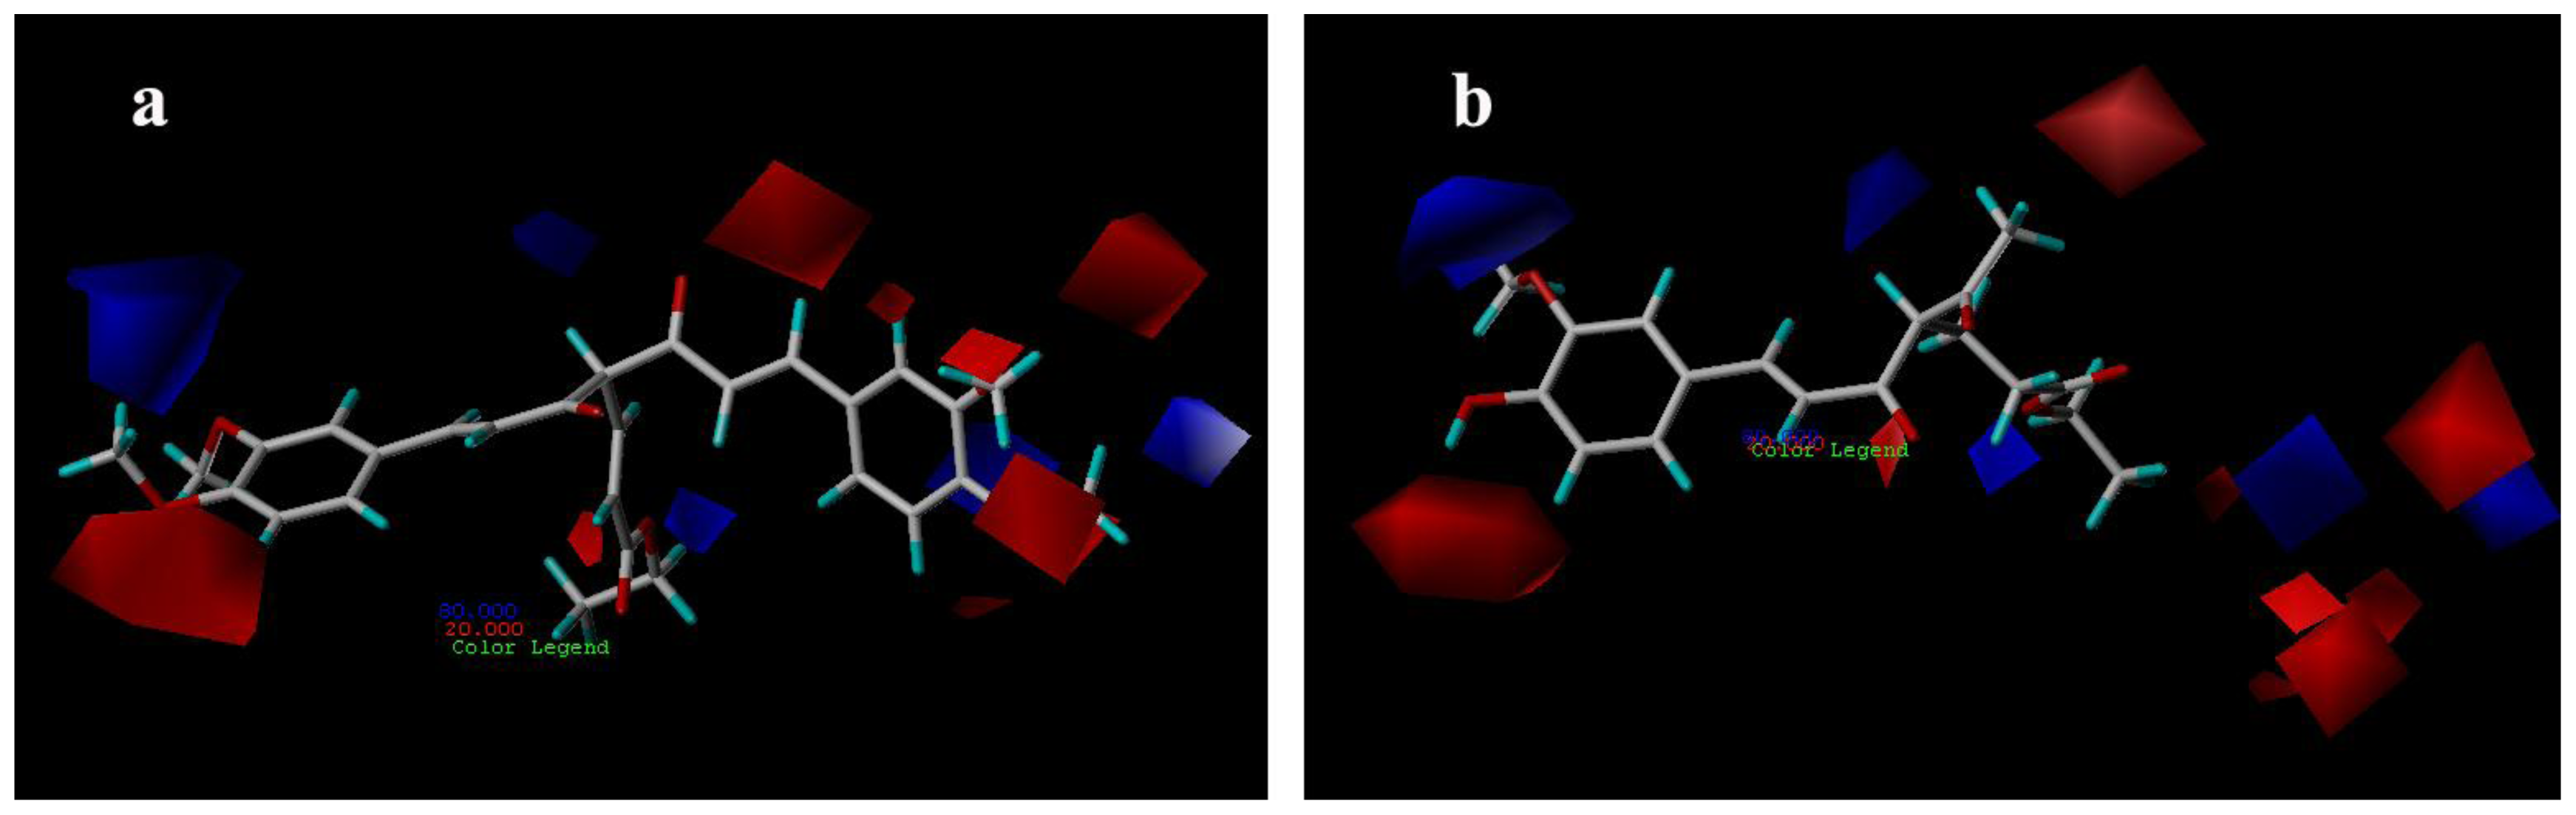
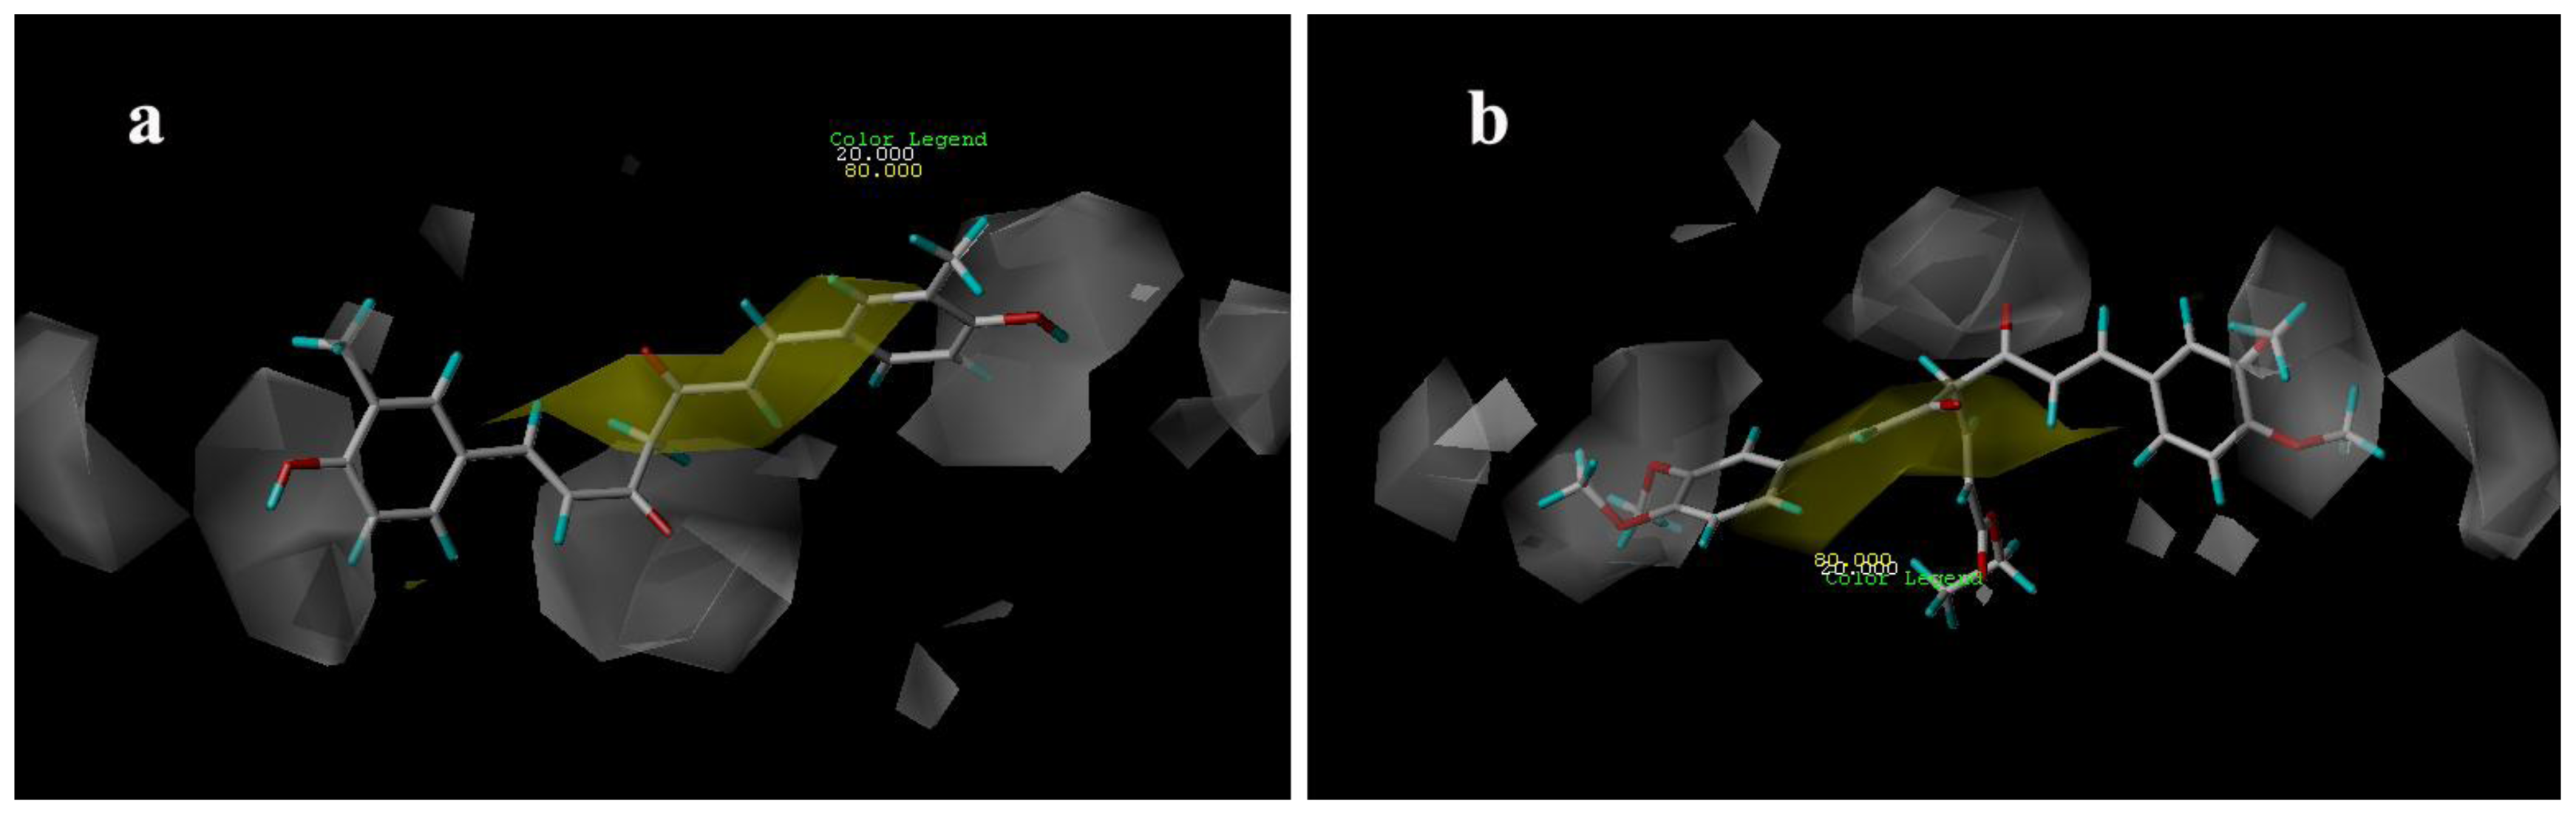
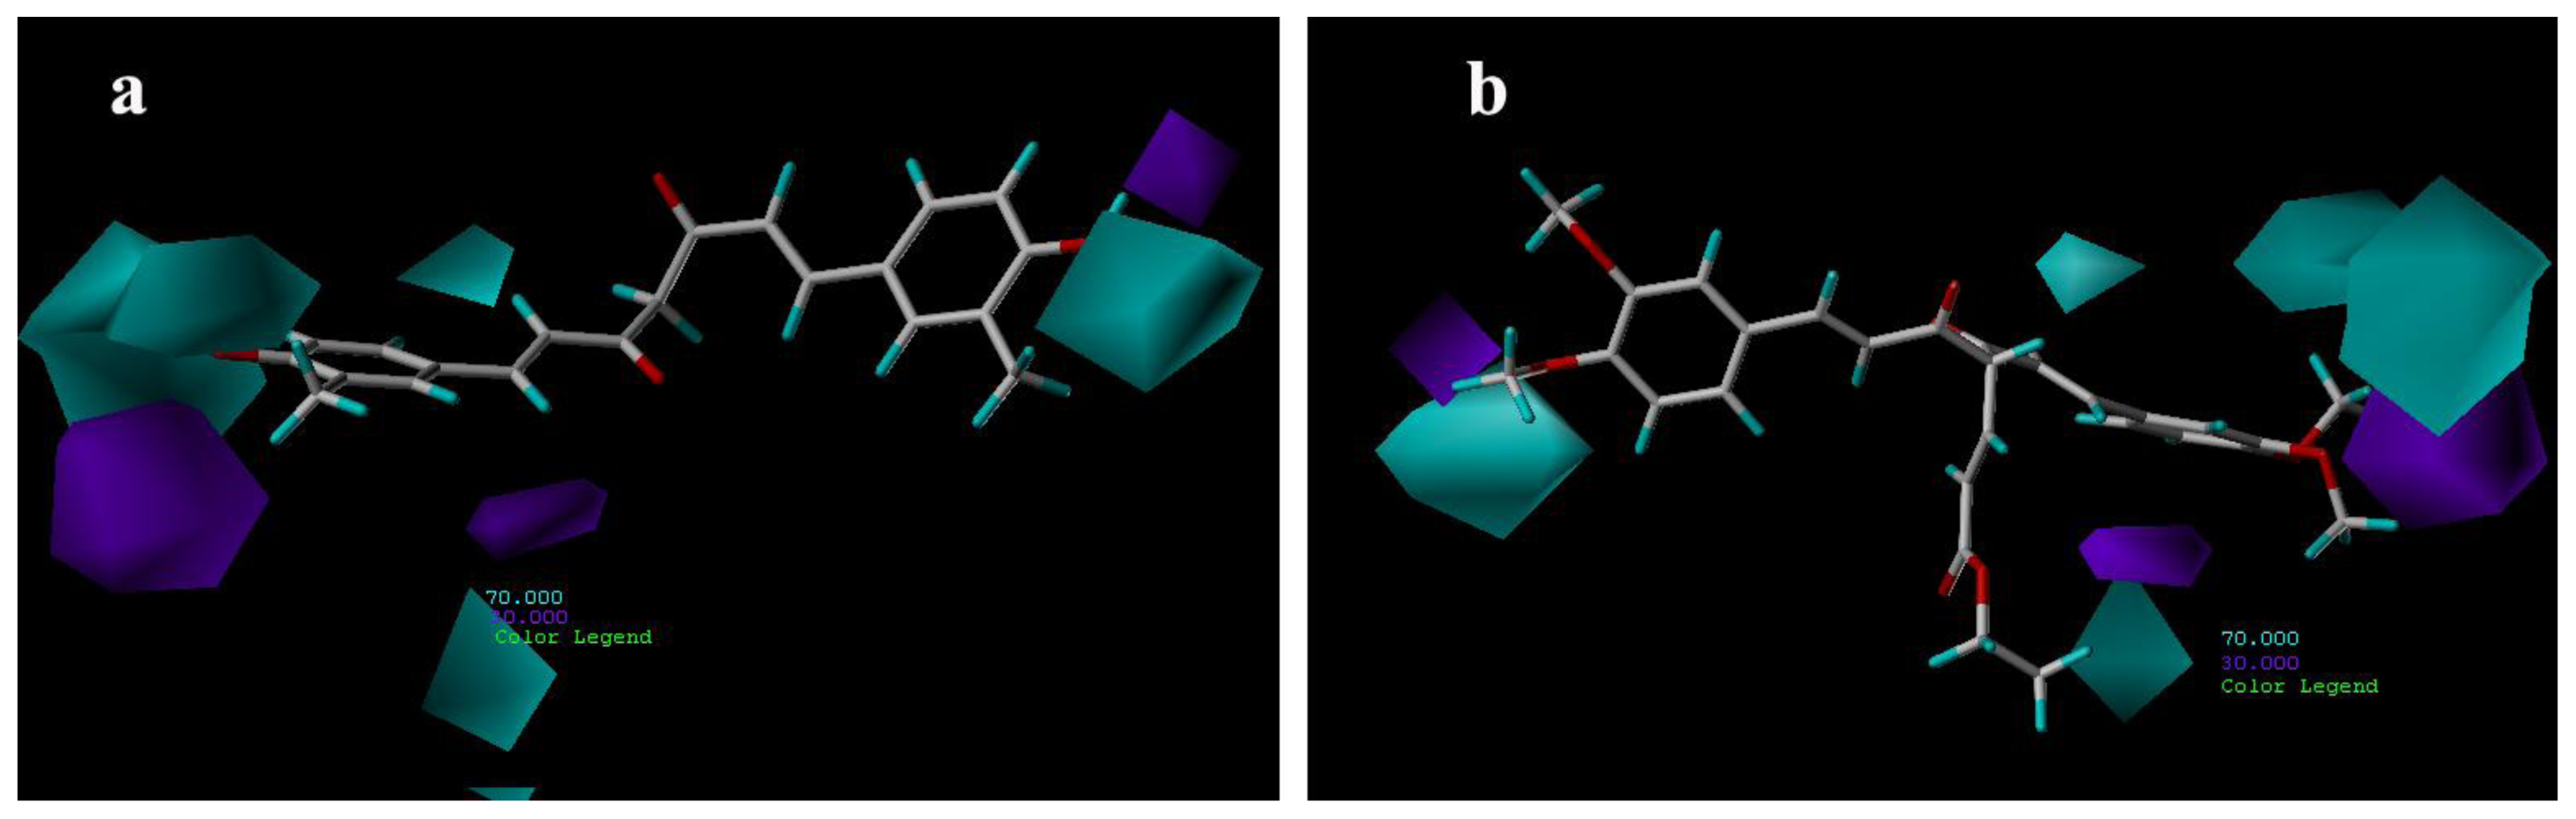
3.3.2. CoMSIA Contour Maps
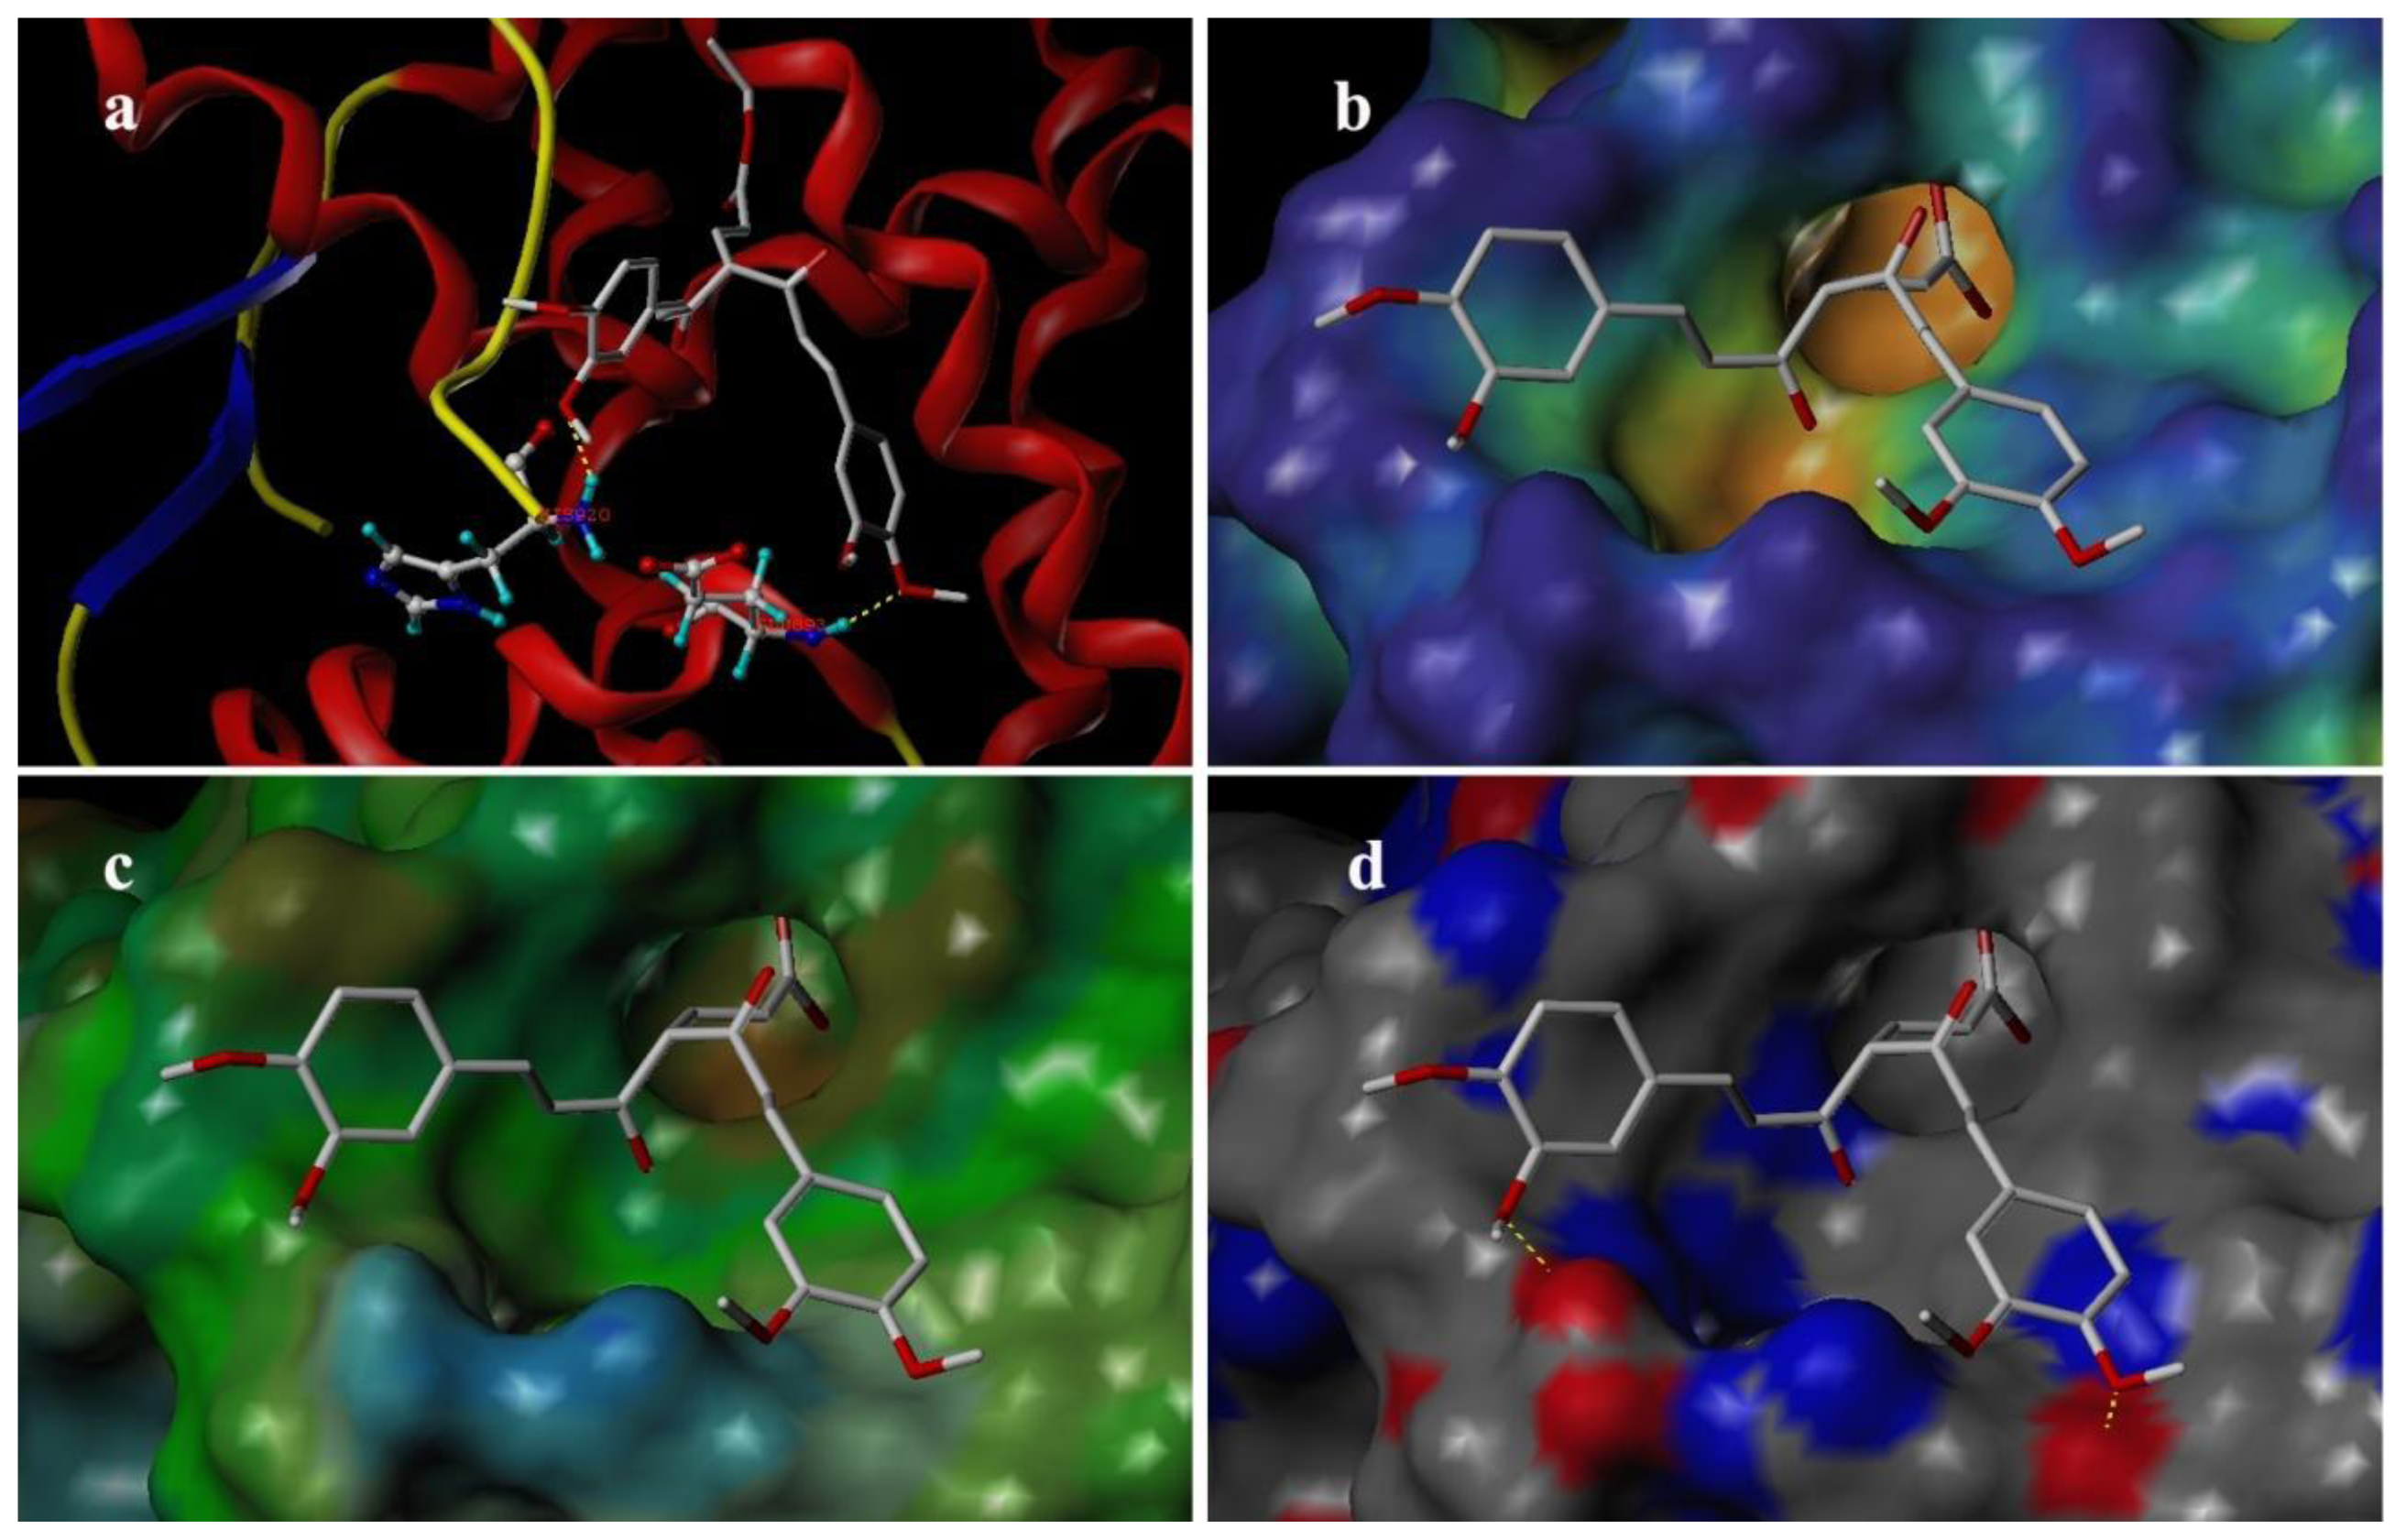
3.4. Docking Analysis
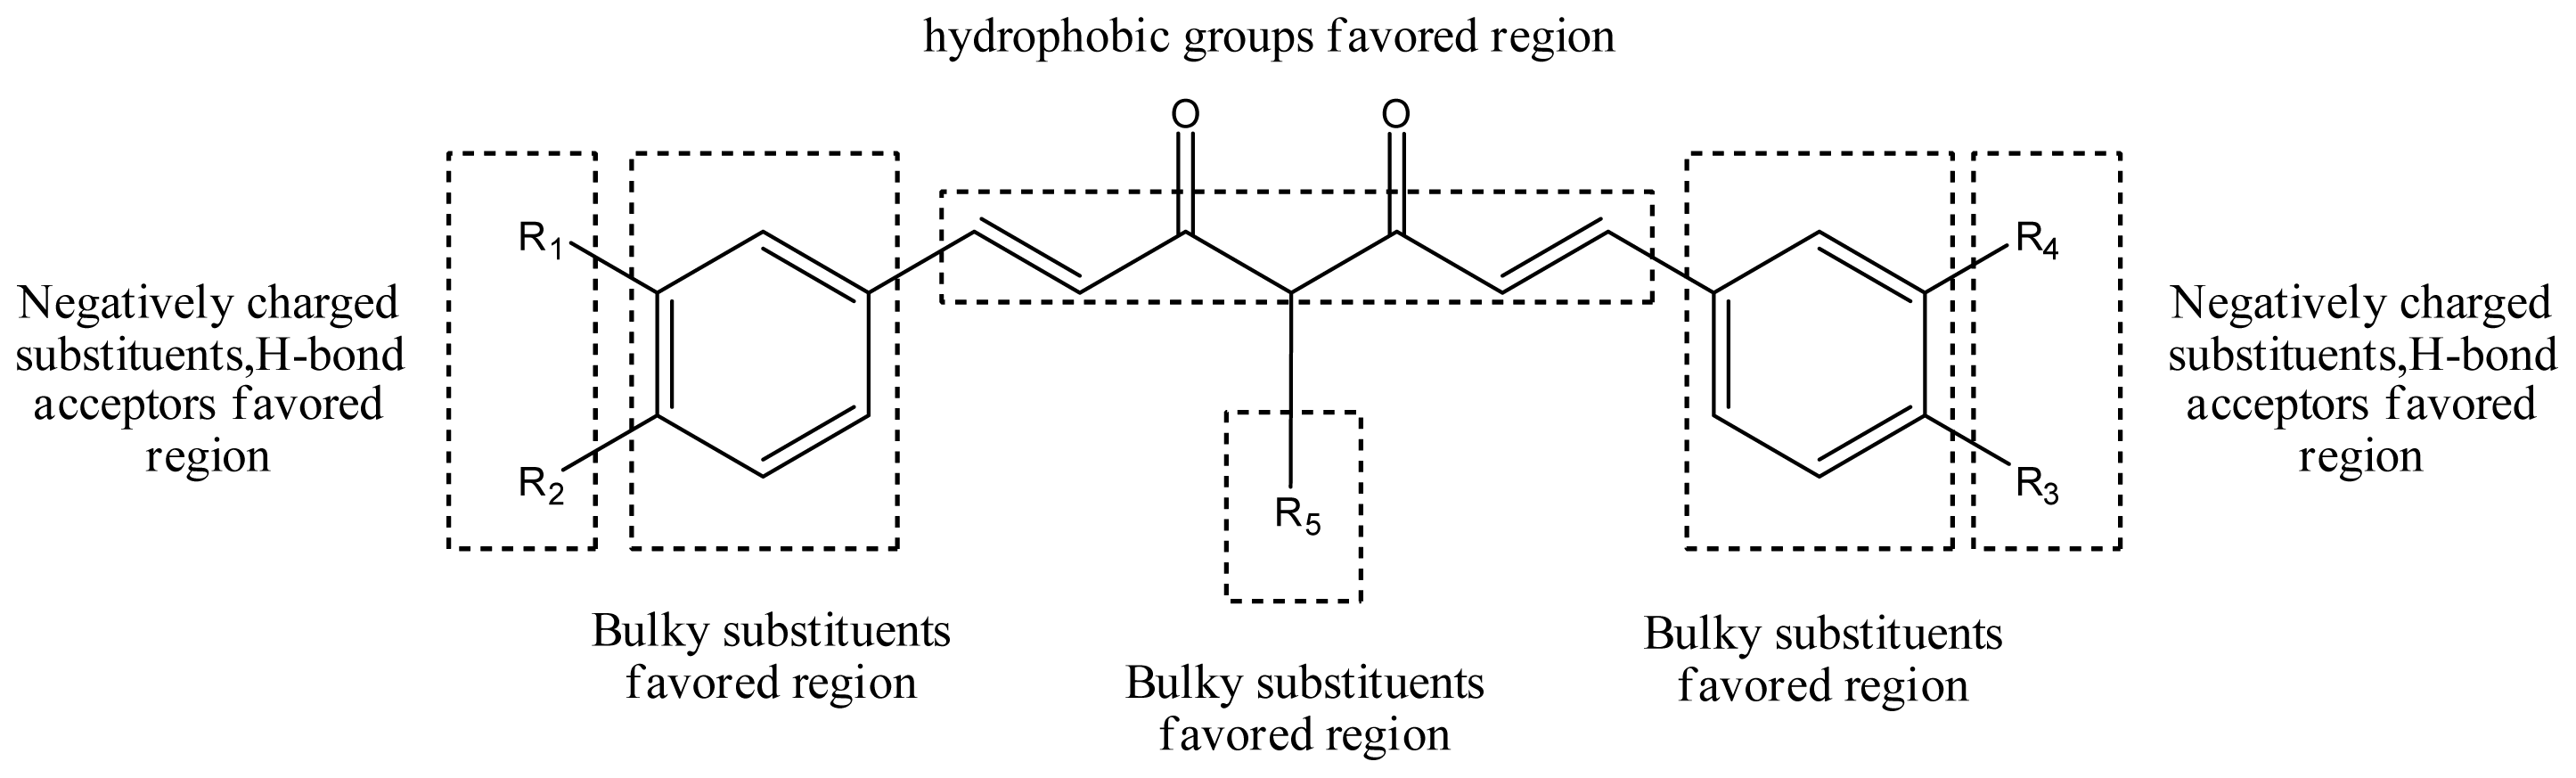
3.5. Summary of Structure-Activity Relationship
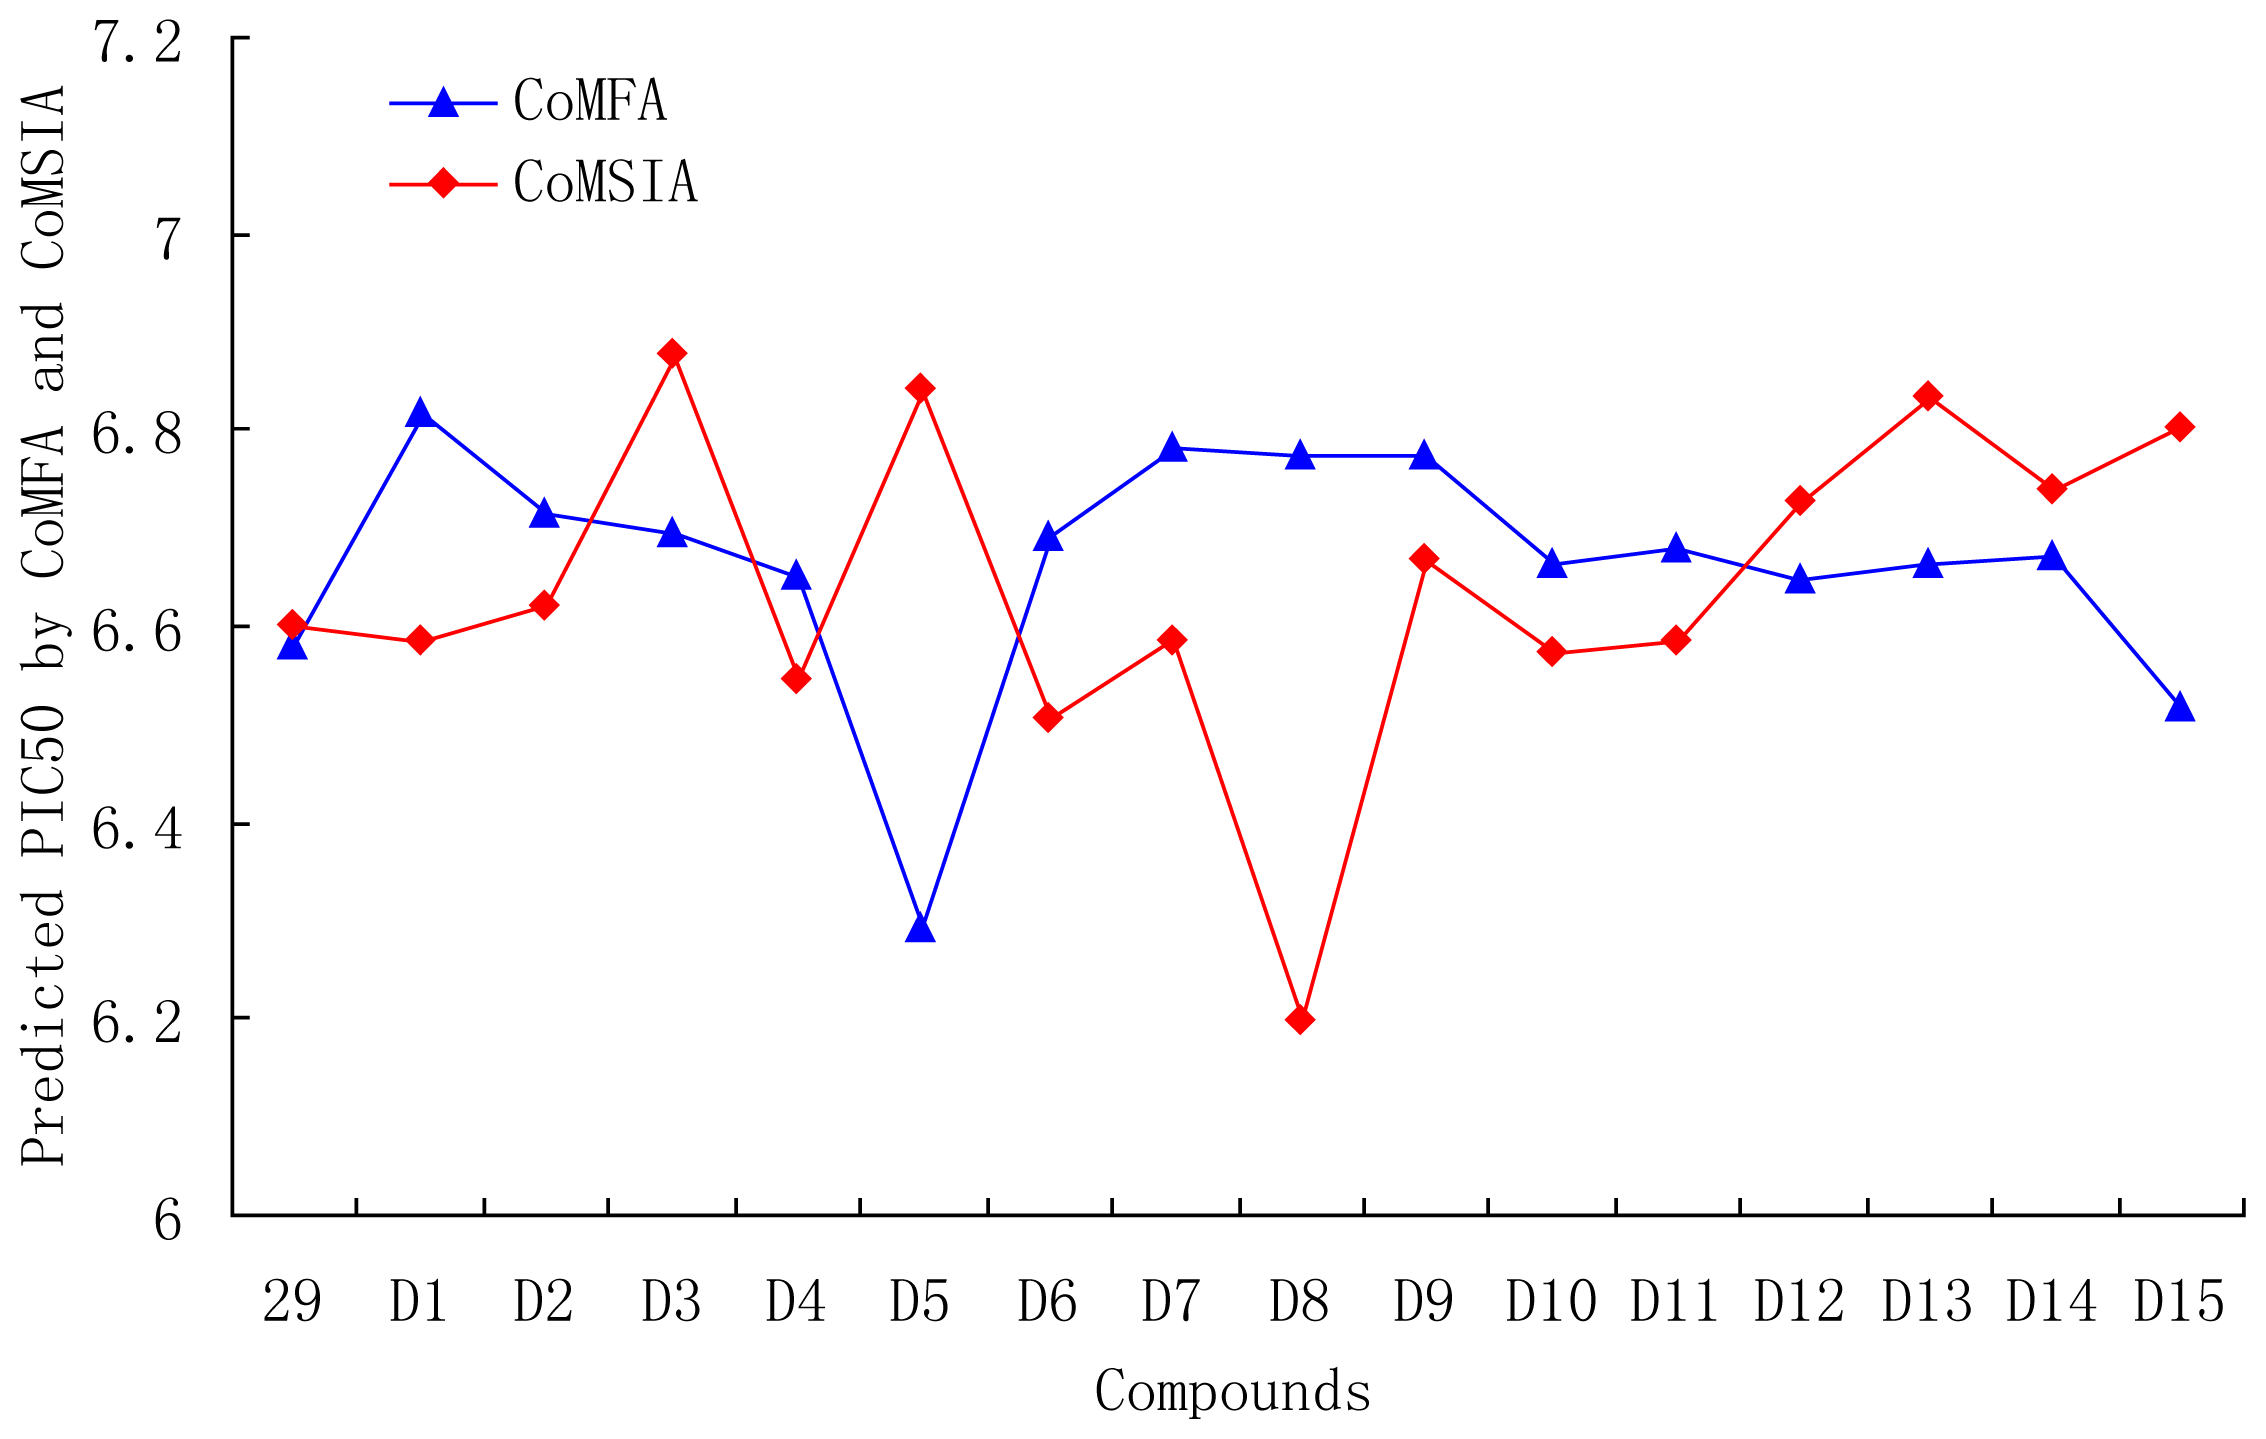
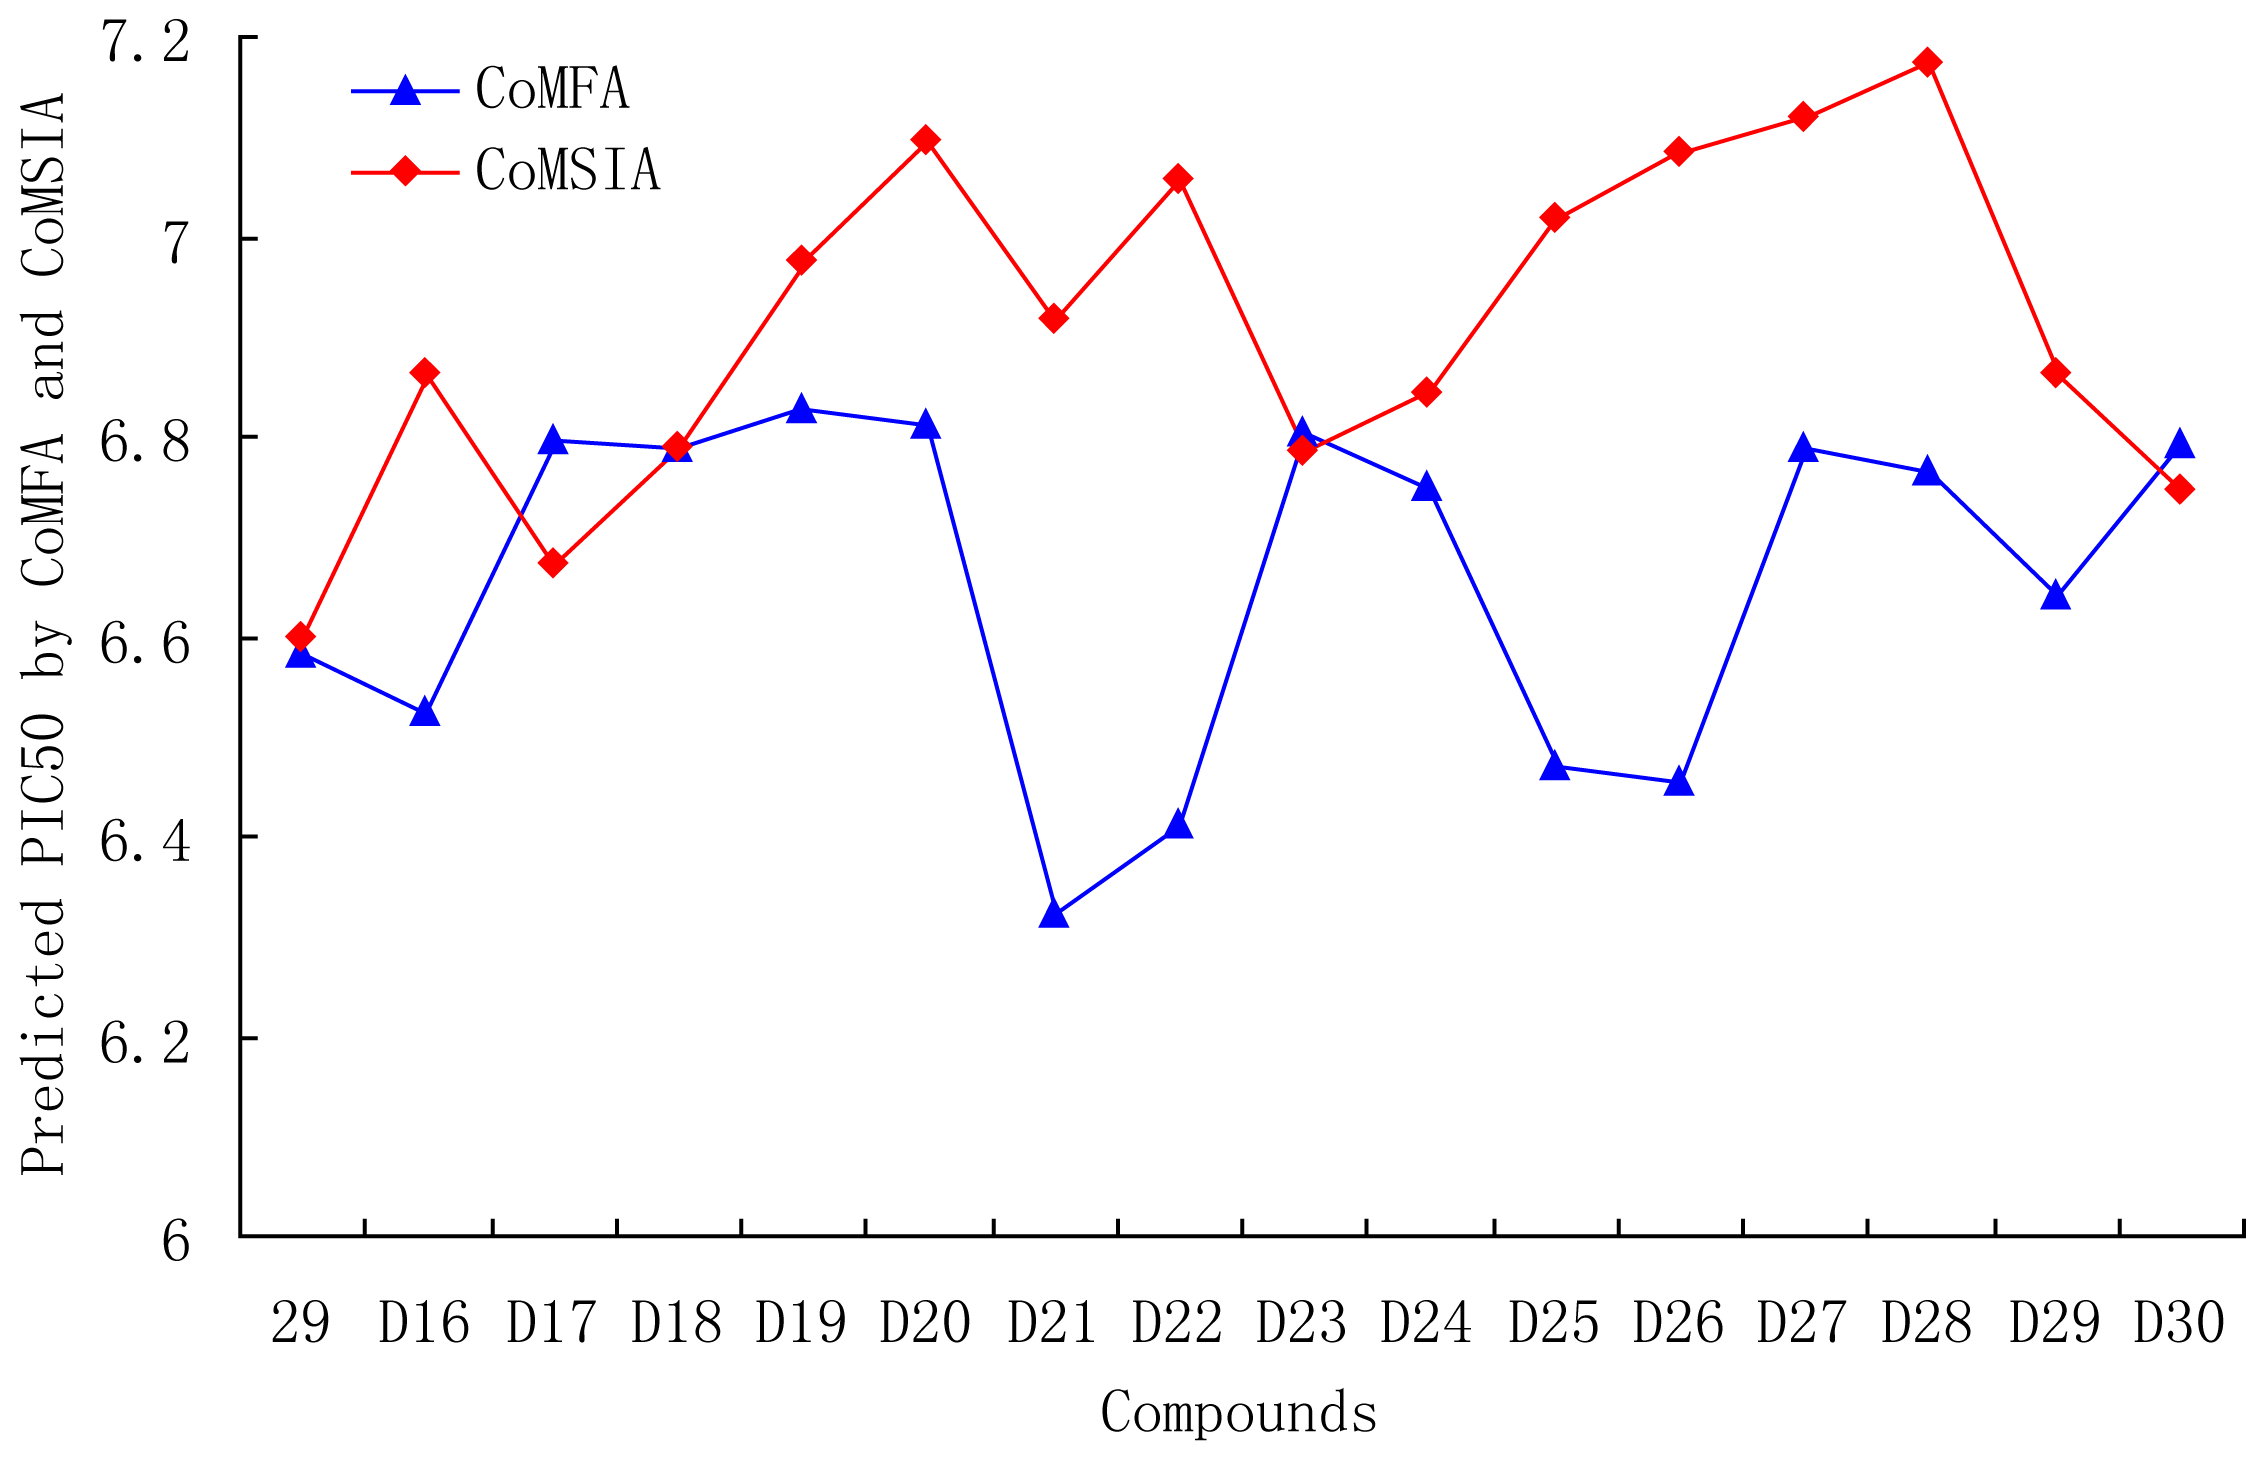
3.6. Designs for New Molecules
4. Conclusion
Acknowledgements
References
- Siegel, R.; Ward, E.; Brawley, O.; Jemal, A. Cancer statistics. CA Cancer J. Clin 2011, 61, 212–236. [Google Scholar]
- Lin, L.; Shi, Q.; Nyarko, A.K.; Bastow, K.F.; Wu, C.; Su, C.; Shih, C.C.Y.; Lee, K. Antitumor agents. 250. Design and synthesis of new curcumin analogues as potential anti-prostate cancer agents. J. Med. Chem 2006, 49, 3963–3972. [Google Scholar]
- Henderson, L.C.; Altimari, J.M.; Dyson, G.; Servinis, L.; Niranjan, B.; Risbridger, G.P. A comparative assessment of α-lipoic acid N-phenylamides as non-steroidal androgen receptor antagonists both on and off gold nanoparticles. Bioorg. Chem 2012, 40, 1–5. [Google Scholar]
- Kirby, M.; Hirst, C.; Crawford, E.D. Characterising the castration-resistant prostate cancer population: A systematic review. Int. J. Clin. Pract 2011, 65, 1180–1192. [Google Scholar]
- Chen, Y.; Sawyers, C.L.; Scher, H.I. Targeting the androgen receptor pathway in prostate cancer. Curr. Opin. Pharmacol 2008, 8, 440–448. [Google Scholar]
- Zhou, J.; Geng, G.; Shi, Q.; Sauriol, F.; Wu, J.H. Design and synthesis of androgen receptor antagonists with bulky side chains for overcoming antiandrogen resistance. J. Med. Chem 2009, 52, 5546–5550. [Google Scholar]
- Estebanez-Perpina, E.; Moore, J.M.R.; Mar, E.; Delgado-Rodrigues, E.; Nguyen, P.; Baxter, J.D.; Buehrer, B.M.; Webb, P.; Fletterick, R.J.; Guy, R.K. The molecular mechanisms of coactivator utilization in ligand-dependent transactivation by the androgen receptor. J. Biol. Chem 2005, 280, 8060–8068. [Google Scholar]
- Markus, A.L. Multi-dimensional QSAR in drug discovery. Drug Discov. Today 2007, 12, 1013–1017. [Google Scholar]
- Cramer, R.D.; Patterson, D.E.; Bunce, J.D. Comparative molecular field analysis (CoMFA). 1. Effect of shape on binding of steroids to carrier proteins. J. Am. Chem. Soc 1988, 110, 5959–5967. [Google Scholar]
- Klebe, G.; Abraham, U.; Mietzner, T. Molecular similarity indices in a comparative analysis (CoMSIA) of drug molecules to correlate and predict their biological activity. J. Med. Chem 1994, 37, 4130–4146. [Google Scholar]
- Yi, P.; Qiu, M. 3D-QSAR and docking studies of aminopyridine carboxamide inhibitors of c-Jun N-terminal kinase-1. Eur. J. Med. Chem 2008, 43, 604–613. [Google Scholar]
- Liao, S.Y.; Qian, L.; Miao, T.F.; Lu, H.L.; Zheng, K.C. CoMFA and docking studies of 2-phenylindole derivatives with anticancer activity. Eur. J. Med. Chem 2009, 44, 2822–2827. [Google Scholar]
- Clark, M.; Cramer, R.D.; van Opdenbosch, N. Validation of the general purpose tripos 5.2 force field. J. Comput. Chem 1989, 10, 982–1012. [Google Scholar]
- Cho, S.J.; Tropsha, A. Cross-validated r2-guided region selection for comparative molecular field analysis: A simple method to achieve consistent results. J. Med. Chem 1995, 38, 1060–1066. [Google Scholar]
- Zhao, X.; Chen, M.; Huang, B.; Ji, H.; Yuan, M. Comparative Molecular Field Analysis (CoMFA) and Comparative Molecular Similarity Indices Analysis (CoMSIA) studies on alpha(1A)- adrenergic receptor antagonists based on pharmacophore molecular alignment. Int. J. Mol. Sci 2011, 12, 7022–7237. [Google Scholar]
- Pirhadi, S.; Ghasemi, J.B. 3D-QSAR analysis of human immunodeficiency virus entry-1 inhibitors by CoMFA and CoMSIA. Eur. J. Med. Chem 2010, 45, 4897–4903. [Google Scholar]
- Vong, R.; Geladi, P.; Wold, S.; Esbensen, K. Source contributions to ambient aerosol calculated by discriminat partial least squares regression (PLS). J. Chemometrics 1988, 2, 281–296. [Google Scholar]
- Srivastava, V.; Gupta, S.P.; Siddiqi, M.I.; Mishra, B.N. 3D-QSAR studies on quinazoline antifolate thymidylate synthase inhibitors by CoMFA and CoMSIA models. Eur. J. Med. Chem 2010, 45, 1560–1571. [Google Scholar]
- Ai, Y.; Wang, S.T.; Sun, P.H.; Song, F.J. Combined 3D-QSAR modeling and molecular docking studies on pyrrole-indolin-2-ones as aurora a kinase inhibitors. Int. J. Mol. Sci 2011, 12, 1605–1624. [Google Scholar]
- Ping, L.; Chen, W.N.; Chen, W.M. Molecular modeling studies on imidazo[4,5-b]pyridine derivatives as Aurora A kinase inhibitors using 3D-QSAR and docking approaches. Eur. J. Med. Chem 2011, 46, 77–94. [Google Scholar]


 | |||||||
|---|---|---|---|---|---|---|---|
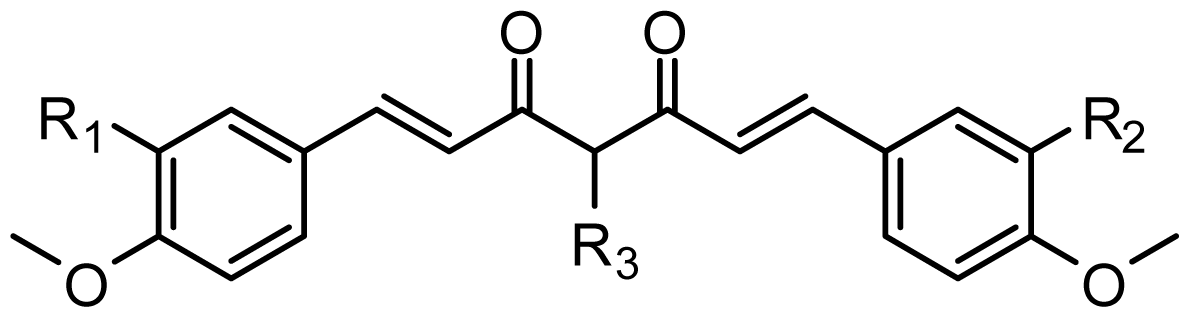
| Compound | R1 | R2 | R3 | R4 | R5 | IC50 (μM) | pIC50 |
| 1 | H | OMe | OH | H | H | 6.2 | 5.208 |
| 2 | H | OMe | OMe | H | H | 6.6 | 5.180 |
| 3 * | H | OH | OMe | H | H | 5.3 | 5.276 |
| 4 | OMe | H | OMe | H | H | 9.9 | 5.004 |
| 5 | OMe | OMe | OMe | H | H | 5.8 | 5.237 |
| 6 | H | OMe | OMe | OMe | H | 12.5 | 4.903 |
| 7 | H | OMe | OH | H | (CH2)2COOEt | 51.5 | 4.288 |
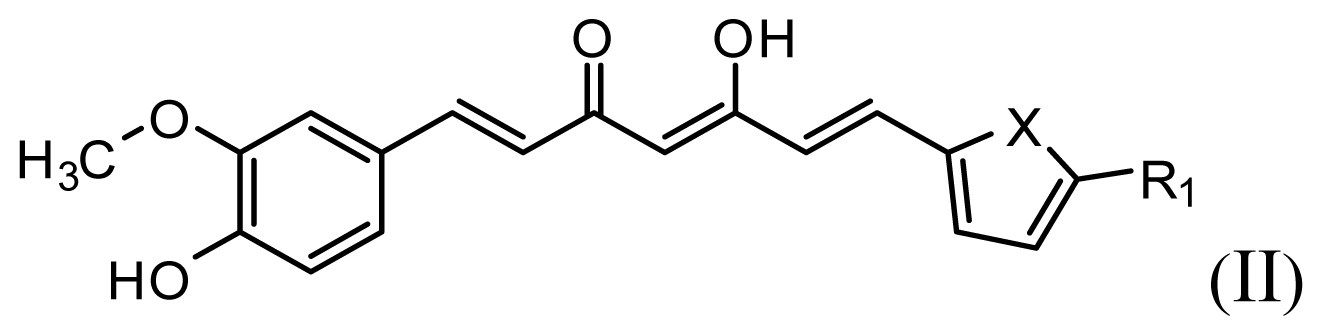 | |||||||
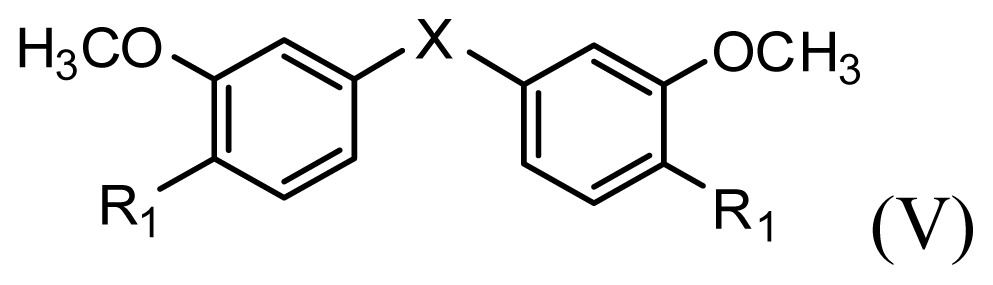
| Compound | R1 | X | IC50 (μM) | pIC50 | |||
| 8 | CH2OH | O | 7.3 | 5.137 | |||
| 9 | H | S | 6.3 | 5.201 | |||
| 10* | H | NH | 13.6 | 4.866 | |||
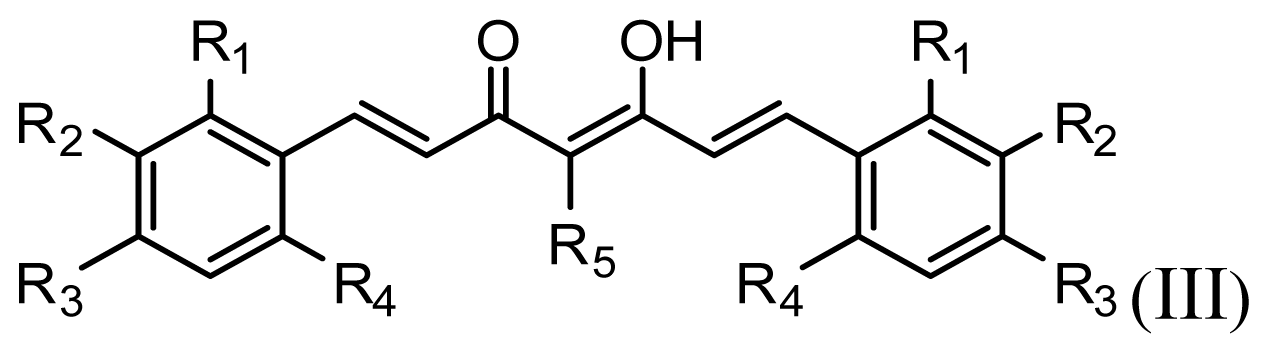 | |||||||
| Compound | R1 | R2 | R3 | R4 | R5 | IC50 (μM) | pIC50 |
| 11 | H | OMe | OH | H | H | 3.8 | 5.420 |
| 12 | H | OMe | OMe | H | H | 1.3 | 5.886 |
| 13 | H | OMe | OH | H | (CH2)2COOEt | 1.5 | 5.824 |
| 14 | H | OH | OMe | H | H | 10.9 | 4.963 |
| 15 | OMe | H | OMe | H | H | 11.8 | 4.928 |
| 16 | OMe | OMe | OMe | H | H | 4.8 | 5.319 |
| 17 | H | OMe | OMe | OMe | H | 2.9 | 5.538 |
| 18* | H | OMe | OTHP | H | (CH2)2COOEt | 4.2 | 5.377 |
| 19 | H | OMe | OEt | H | H | 6.5 | 5.187 |
| 20 |  | 2.6 | 5.585 | ||||
| 21 | H | Me | OH | H | H | 1.8 | 5.745 |
| 22 | H | Me | OMe | H | H | 7.7 | 5.114 |
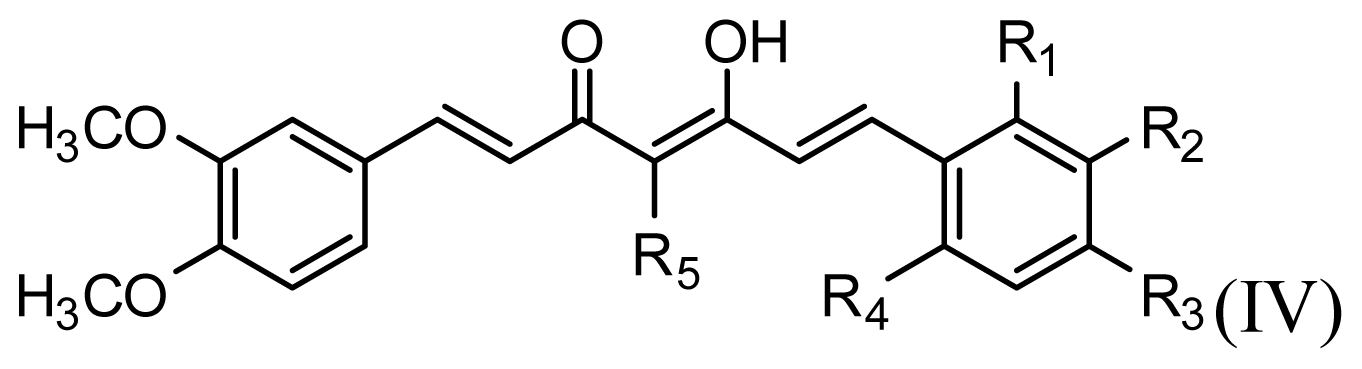 | |||||||
| Compound | R1 | R2 | R3 | R4 | R5 | IC50 (μM) | pIC50 |
| 23 | H | OMe | OH | H | H | 3.3 | 5.481 |
| 24 | H | OH | OMe | H | H | 4.8 | 5.319 |
| 25 | OMe | OMe | OMe | H | H | 7.7 | 5.114 |
| 26* | H | OMe | OMe | OMe | H | 8.6 | 5.066 |
| 27 | H | OMe | OH | H | (CH2)2COOEt | 2.1 | 5.678 |
 | |||||||
| Compound | R1 | X | IC50 (μM) | pIC50 | |||
| 28 * | OH | 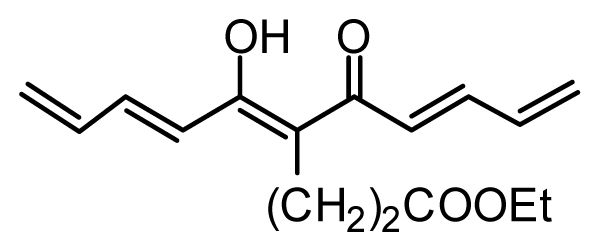 | 3.1 | 5.509 | |||
| 29 | OMe |  | 0.2 | 6.699 | |||
| 30 | OTHP |  | 2.6 | 5.585 | |||
| 31 * | OMe |  | 2.2 | 5.658 | |||
| 32 | OMe | 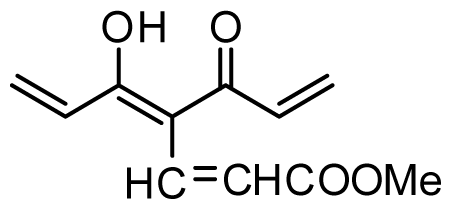 | 0.4 | 6.398 | |||
| 33 | OMe | 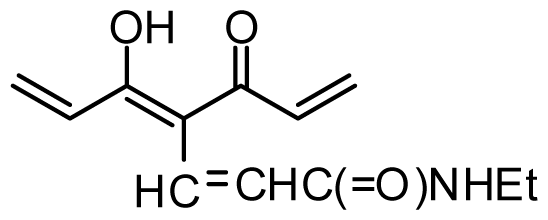 | 0.6 | 6.222 | |||
| 34 * | OMe | 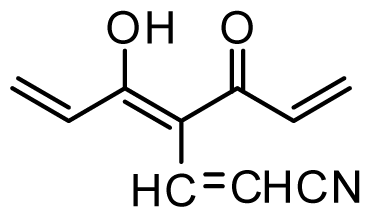 | 0.2 | 6.699 | |||
| 35 | OH | 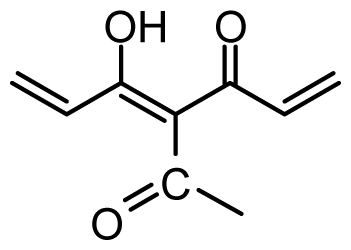 | 8.8 | 5.056 | |||
| 36 | OTHP |  | 7.3 | 5.137 | |||
| 37 | OH | 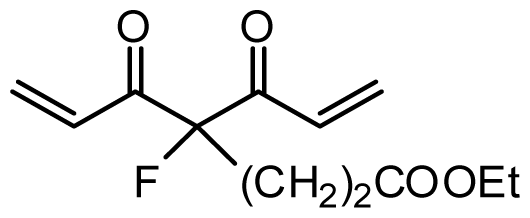 | 6.3 | 5.201 | |||
| 38 | OMe |  | 3.4 | 5.469 | |||
| 39 | OH |  | 4.4 | 5.357 | |||
| 40 | OMe |  | 0.2 | 6.699 | |||
| Component a | q2b | r2ncv c | Fd | SEEe |
|---|---|---|---|---|
| A–CoMFA region focusing model in Gs = 1 in various numbers of components f | ||||
| 1 | 0.306 | 0.533 | 35.367 | 0.357 |
| 2 | 0.396 | 0.738 | 42.156 | 0.272 |
| 3 | 0.501 | 0.893 | 80.916 | 0.176 |
| 4 | 0.590 | 0.955 | 149.067 | 0.116 |
| 5 | 0.629 | 0.978 | 237.429 | 0.083 |
| 6 | 0.658 | 0.988 | 352.278 | 0.063 |
| B–CoMFA model in Gs = 2 in various numbers of components f | ||||
| 1 | 0.209 | 0.395 | 23.191 | 0.395 |
| 2 | 0.273 | 0.688 | 33.010 | 0.297 |
| 3 | 0.399 | 0.881 | 71.577 | 0.186 |
| 4 | 0.432 | 0.940 | 109.490 | 0.135 |
| 5 | 0.526 | 0.976 | 223.159 | 0.086 |
| 6 | 0.564 | 0.986 | 304.611 0.068 | |
| Compound | Predicted Activity (CoMFA) | Predicted Activity (CoMSIA) |
|---|---|---|
| 1 | 5.191 | 5.124 |
| 2 | 5.163 | 5.257 |
| 3* | 4.963 | 4.896 |
| 4 | 4.971 | 4.935 |
| 5 | 5.277 | 5.202 |
| 6 | 4.900 | 4.964 |
| 7 | 4.323 | 4.333 |
| 8 | 5.145 | 5.144 |
| 9 | 5.208 | 5.242 |
| 10 * | 5.264 | 5.243 |
| 11 | 5.463 | 5.495 |
| 12 | 5.929 | 5.925 |
| 13 | 5.763 | 5.850 |
| 14 | 5.003 | 4.960 |
| 15 | 4.929 | 4.879 |
| 16 | 5.281 | 5.325 |
| 17 | 5.522 | 5.567 |
| 18 * | 5.235 | 5.175 |
| 19 | 5.167 | 5.020 |
| 20 | 5.589 | 5.586 |
| 21 | 5.684 | 5.634 |
| 22 | 5.115 | 5.187 |
| 23 | 5.526 | 5.554 |
| 24 | 5.255 | 5.249 |
| 25 | 5.157 | 5.115 |
| 26 * | 5.412 | 5.260 |
| 27 | 5.642 | 5.747 |
| 28 * | 5.540 | 5.389 |
| 29 | 6.580 | 6.606 |
| 30 | 5.559 | 5.697 |
| 31 * | 6.039 | 5.800 |
| 32 | 6.543 | 6.543 |
| 33 | 6.347 | 6.169 |
| 34 * | 6.407 | 6.487 |
| 35 | 5.013 | 5.072 |
| 36 | 5.094 | 5.062 |
| 37 | 5.290 | 5.186 |
| 38 | 5.507 | 5.567 |
| 39 | 5.337 | 5.353 |
| 40 | 6.603 | 6.529 |
| Field Contribution in %
| |||||||||||
|---|---|---|---|---|---|---|---|---|---|---|---|
| Descriptors | ONC | q2 | r2 ncv | r2 pred a | SEE | F | S | E | H | D | A |
| CoMFA | |||||||||||
| SE | 6 | 0.658 | 0.988 | 0.715 | 0.063 | 352.278 | 48.8 | 51.2 | – | – | – |
| CoMSIA b | |||||||||||
| SE | 5 | 0.498 | 0.967 | 0.102 | 156.626 | 27.2 | 72.8 | – | – | – | |
| SHE | 6 | 0.536 | 0.985 | 0.069 | 292.088 | 19.6 | 57.6 | 22.7 | – | – | |
| SED | 6 | 0.519 | 0.983 | 0.075 | 247.310 | 22.3 | 52.0 | – | 25.7 | – | |
| SEA | 5 | 0.404 | 0.965 | 0.105 | 148.070 | 19.7 | 55.0 | – | – | 25.3 | |
| SEHD | 5 | 0.567 | 0.978 | 0.793 | 0.083 | 241.534 | 16.0 | 43.0 | 17.3 | 23.6 | – |
| SEDA | 5 | 0.486 | 0.969 | 0.098 | 170.503 | 15.6 | 38.9 | – | 23.5 | 21.9 | |
| SEHA | 6 | 0.426 | 0.983 | 0.074 | 255.498 | 15.3 | 45.9 | 17.8 | – | 20.9 | |
| SEHDA | 6 | 0.514 | 0.983 | 0.074 | 250.217 | 12.7 | 33.4 | 14.3 | 21.6 | 18.0 | |
 | |||||
|---|---|---|---|---|---|
| Compound ID | Substituent | Predicted pIC50 | |||
| R1 | R2 | R3 | COMFA | COMSIA | |
| 29 | OMe | OMe | CH=CHCOOEt | 6.582 | 6.599 |
| D1 | CN | CN | CH=CHCOOEt | 6.817 | 6.583 |
| D2 | SO3H | SO3H | CH=CHCOOEt | 6.714 | 6.619 |
| D3 | NO2 | NO2 | CH=CHCOOEt | 6.696 | 6.876 |
| D4 | CF3 | CF3 | CH=CHCOOEt | 6.651 | 6.544 |
| D5 | COOH | COOH | CH=CHCOOEt | 6.293 | 6.840 |
| D6 | CHO | CHO | CH=CHCOOEt | 6.691 | 6.506 |
| D7 | Br | Br | CH=CHCOOEt | 6.783 | 6.583 |
| D8 |  |  | CH=CHCOOEt | 6.773 | 6.196 |
| D9 | NO2 | CN | CH=CHCOOEt | 6.774 | 6.666 |
| D10 | B(OH)2 | B(OH)2 | CH=CHCOOEt | 6.664 | 6.571 |
| D11 | CN | CN | CH=CH(CH2)3CH3 | 6.680 | 6.585 |
| D12 | OMe | OMe |  | 6.648 | 6.727 |
| D13 | OMe | OMe |  | 6.662 | 6.832 |
| D14 | OMe | OMe |  | 6.670 | 6.740 |
| D15 | OMe | OMe |  | 6.518 | 6.802 |
| D16 | OMe | OMe |  | 6.526 | 6.864 |
| D17 | CN | CN |  | 6.798 | 6.670 |
| D18 | CN | CN |  | 6.787 | 6.787 |
| D19 | NO2 | NO2 |  | 6.828 | 6.973 |
| D20 | NO2 | NO2 |  | 6.813 | 7.094 |
| D21 | COOH | COOH |  | 6.020 | 6.917 |
| D22 | COOH | COOH |  | 6.112 | 7.058 |
| D23 | CN | CN |  | 6.804 | 6.783 |
| D24 | CN | CN |  | 6.749 | 6.842 |
| D25 | COOH | COOH |  | 6.068 | 7.017 |
| D26 | COOH | COOH |  | 6.053 | 7.084 |
| D27 | NO2 | NO2 |  | 6.789 | 7.119 |
| D28 | NO2 | NO2 |  | 6.765 | 7.172 |
| D29 |  |  |  | 6.641 | 6.863 |
| D30 | Br | Br |  | 6.794 | 6.746 |
© 2012 by the authors; licensee Molecular Diversity Preservation International, Basel, Switzerland. This article is an open-access article distributed under the terms and conditions of the Creative Commons Attribution license (http://creativecommons.org/licenses/by/3.0/).
Share and Cite
Xu, G.; Chu, Y.; Jiang, N.; Yang, J.; Li, F. The Three Dimensional Quantitative Structure Activity Relationships (3D-QSAR) and Docking Studies of Curcumin Derivatives as Androgen Receptor Antagonists. Int. J. Mol. Sci. 2012, 13, 6138-6155. https://doi.org/10.3390/ijms13056138
Xu G, Chu Y, Jiang N, Yang J, Li F. The Three Dimensional Quantitative Structure Activity Relationships (3D-QSAR) and Docking Studies of Curcumin Derivatives as Androgen Receptor Antagonists. International Journal of Molecular Sciences. 2012; 13(5):6138-6155. https://doi.org/10.3390/ijms13056138
Chicago/Turabian StyleXu, Guanhong, Yanyan Chu, Nan Jiang, Jing Yang, and Fei Li. 2012. "The Three Dimensional Quantitative Structure Activity Relationships (3D-QSAR) and Docking Studies of Curcumin Derivatives as Androgen Receptor Antagonists" International Journal of Molecular Sciences 13, no. 5: 6138-6155. https://doi.org/10.3390/ijms13056138
APA StyleXu, G., Chu, Y., Jiang, N., Yang, J., & Li, F. (2012). The Three Dimensional Quantitative Structure Activity Relationships (3D-QSAR) and Docking Studies of Curcumin Derivatives as Androgen Receptor Antagonists. International Journal of Molecular Sciences, 13(5), 6138-6155. https://doi.org/10.3390/ijms13056138