Article

Evaluation of the Adenocarcinoma-Associated Gene AGR2 and the Intestinal Stem Cell Marker LGR5 as Biomarkers in Colorectal Cancer

1
Medical Oncology Department, La Coruña University Hospital, Servicio Galego de Saúde (SERGAS), As Xubias, 84. PC 15006, La Coruña, Spain
2
Translational Cancer Research Lab, Biomedical Research Institute (INIBIC), Carretera del Pasaje, s/n. PC 15006, La Coruña, Spain
3
Pathology Department, La Coruña University Hospital, Servicio Galego de Saúde (SERGAS), As Xubias, 84. PC 15006, La Coruña, Spain
4
Tissue Engineering and Cellular Therapy Lab, INIBIC, Carretera del Pasaje, s/n. PC 15006, La Coruña, Spain
5
Medicine Department, La Coruña University (UDC), Campus de Oza, s/n, PC 15006, La Coruña, Spain
6
Biostatistics and Clinical Epidemiology Unit, La Coruña University Hospital, Servicio Galego de Saúde (SERGAS), As Xubias 84, PC 15006, La Coruña, Spain
*
Author to whom correspondence should be addressed.
Int. J. Mol. Sci. 2012, 13(4), 4367-4387; https://doi.org/10.3390/ijms13044367
Submission received: 1 March 2012 / Revised: 20 March 2012 / Accepted: 23 March 2012 / Published: 5 April 2012
(This article belongs to the Special Issue Advances in Molecular Oncology (special issue))

Abstract

:
We aim to estimate the diagnostic performances of anterior gradient homolog-2 (AGR2) and Leucine-rich repeat-containing-G-protein-coupled receptor 5 (LGR5) in peripheral blood (PB) as mRNA biomarkers in colorectal cancer (CRC) and to explore their prognostic significance. Real-time PCR was used to analyze AGR2 and LGR5 in 54 stages I-IV CRC patients and 19 controls. Both mRNAs were significantly increased in PB from CRC patients compared to controls. The area under the receiver-operating characteristic curves were 0.722 (p = 0.006), 0.376 (p = 0.123) and 0.767 (p = 0.001) for AGR2, LGR5 and combined AGR2/LGR5, respectively. The AGR2/LGR5 assay resulted in 67.4% sensitivity and 94.7% specificity. AGR2 correlated with pT3–pT4 and high-grade tumors. LGR5 correlated with metastasis, R2 resections and high-grade. The progression-free survival (PFS) of patients with high AGR2 was reduced (p = 0.037; HR, 2.32), also in the stage I-III subgroup (p = 0.046). LGR5 indicated a poor prognosis regarding both PFS (p = 0.007; HR, 1.013) and overall survival (p = 0.045; HR, 1.01). High AGR2/LGR5 was associated with poor PFS (p = 0.014; HR, 2.8) by multivariate analysis. Our findings indicate that the assessment of AGR2 and LGR5 in PB might reflect the presence of circulating tumor cells (CTC) and stem cell like CTC in CRC. Increased AGR2 and LGR5 are associated with poor outcomes.

1. Introduction

Colorectal cancer (CRC) is one of the leading causes of cancer-associated morbidity and mortality across the world. The predicted number of deaths in 2011 in the European Union due to CRC was 162,026 [1]. The stage at diagnosis and the possibilities for curative surgery remain the most important prognostic factors.
The development of blood-borne metastasis is ultimately responsible for most CRC-related deaths. Sensitive methods to detect circulating tumor cells (CTC) could serve as prognostic or predictive tools to identify patients at a high risk of disease progression who could be selected for additional treatment [2].
CTC are identified mainly by using antibodies against epithelial antigens or molecular approaches. The PCR amplification of tissue- or tumor-specific mRNA is commonly used to detect circulating or occult metastatic cells. Systematic reviews, meta-analyses and prospective studies [37] provide coherent evidence that the molecular detection of CTC in the peripheral blood (PB) is of strong prognostic significance in patients with CRC.
Our study aimed to evaluate promising CRC-specific mRNAs for multi marker detection of CTC in PB. We previously [8,9] identified anterior gradient homolog-2 (AGR2) and plakophilin-3 as potential CTC markers in gastrointestinal cancer through an in silico profile of gene expression and quantitative real-time reverse-transcription PCR (qRT-PCR). Moreover, AGR2 has been included in the molecular signature that defined CTC in metastatic breast, prostate and colorectal cancers [10,11].
AGR2 encodes a 17 kDa secreted protein, homologue of the Xenopus cement gland gene XAG-2 [12]. Although its functions in humans are poorly understood, recent reports indicate that AGR2 can induce cellular transformation and tumor growth, promote cell survival through inhibition of p53, enhance tumor cell adhesion to the substratum and enhance cell migration [1315].
Recent data [2,10,11,16,17] suggest that CTC encompass a heterogeneous cell population with different tumorigenic capabilities and include cells characterized by an epithelial-mesenchymal plasticity (EMP) with transient loss of epithelial markers. In that sense, the use of different mRNA biomarkers will yield better results in the identification of CTC and rare cell subsets of biological relevance. Thus, it has been hypothesized that only CTC with tumor-initiating properties will eventually complete the metastatic cascade and will develop clinically relevant metastases [18].
The leucine-rich repeat-containing G-protein-coupled receptor 5 (LGR5) also known as G-protein-coupled receptor 49 (GPR49), has been recently reported as a marker for stem cells (SC) in the small intestine and colon [19]. Recently [20,21] it was shown that the LGR5 gene and protein were markedly over expressed in the majority of advanced CRCs and in CRC cell lines derived from metastatic tumors. Moreover, high LGR5 expression has been associated with poor progression-free survival for CRC patients [22].
Thus, we hypothesized that LGR5 mRNA expression in PB of CRC patients could indicate the presence of circulating tumor cells with stem cell properties.
The primary aims of our study were to estimate prospectively the diagnostic accuracy and usefulness of AGR2 mRNA in PB as a surrogate biomarker of CTC and to explore its prognostic significance. Additionally, the blood expression of the intestinal stem-cell (ISC) marker LGR5 was evaluated for correlations with AGR2 and clinical parameters. Our findings revealed that molecular assessment of AGR2 and LGR5 can serve as a marker of CTC and ISC-like CTC in CRC patients, which underscores their potential clinical relevance as predictors of disease outcome.

2. Results and Discussion

2.1. Results

2.1.1. Patients and Clinical Data

Starting in July 2004, 54 patients with histological proven CRC and 19 controls were consecutively recruited for this study. This sample size allowed us to estimate an expected area under the ROC curve of 0.70 with a standard error of 0.065. Ninety per cent of the subjects were included within the first two years. The clinical characteristics of the patients are shown in Table 1.
The mean age was 62.2 years (SEM 1.84; median, 62 years; range, 43 to 74 years) in the control group and 62.7 (SEM 1.30; median, 62.5; range, 31 to 80 years) in the patient group (t test, p = 0.847). The ratio of males to females was similar in the controls (men 63.2%) and the patients (men 61%) (χ2 test, p = 0.875).
PB samples were obtained after R0 or R1 surgery in 16 patients. In 38 patients, blood samples were obtained before neo-adjuvant chemotherapy or in the presence of active metastatic disease, both of which were categorized as R2. In patients with node-negative disease and R0 resection, the mean number of lymph nodes analyzed was 12.8 (SEM 2.7; range 7–21).
Patients with metastatic CRC (n = 38) were grouped into high- (19.4%), intermediate- (36.1%) and low-risk groups (44.4%) using performance status, number of tumor sites, alkaline phosphatase and white blood cell count, as suggested by Köhne et al. [23] Median overall survival (OS) and progression-free survival (PFS) were 98 and 39 weeks, 56 and 26 weeks, and 59 and 14 weeks for the low-, intermediate- and high-risk groups, respectively. The median OS tended to be higher (log-rank p = 0.061) in the low-risk group (98 weeks; 95% CI, 43.1 to 152.9) compared to the combined intermediate/high-risk group (56 weeks; 95% CI, 47.2 to 64.8).
All patients were followed up until death or the end of the study. Disease progression events occurred in 39 patients (72.2%). There were three relapses among stage I–III patients and 36 progressions of metastatic disease. The median PFS was 44 weeks (95% CI, 24.8 to 63.2 weeks). The median OS was 132 weeks (95% CI, 84.4–179.6 weeks), and 34 patients (63%) died of advanced disease. The mean (SEM) follow-up time for the patients still alive at the time of the analysis was 232 (17.8) weeks (median, 232.5 weeks; range, 67 to 335 weeks).

2.1.2. Expression of AGR2 and LGR5 mRNA Transcripts in Blood Samples

AGR2 mRNA was quantified in 62 blood samples (84.9%), including 43 samples obtained from patients with CRC and 19 from controls. The LGR5 mRNA level was quantified in 67 blood samples (90.5%), 48 from CRC patients and 19 from controls. mRNA was insufficient or its quality was inadequate for qRT-PCR in 11 (15.1%) and 6 (8.2%) patients’ samples for AGR2 and LGR5 respectively.
The mean relative AGR2 mRNA expression was 29.1 (SEM 28.2; median 0.77; range, 0.21 to 536.7) in controls and 418.57 (SEM 84.4; median 191.2; range, 0.05 to 1989.5) in cancer patients (t test, p < 0.001). Likewise, the AGR2 level was significantly increased (ANOVA, p = 0.007) in patients with stage IV CRC (mean 492.6; SEM 114) compared with stage I to III patients (mean 305.4; SEM 122.5) and non-cancer controls (mean 29.1; SEM 28.2).
The mean LGR5 mRNA level was 0.21 (SEM 0.03; median 0.18; range, 0 to 0.4) in controls and 11.6 (SEM 4.9; median 0.08; range, 0.01 to 146.9) in patients (t test, p = 0.026). The LGR5 level was significantly increased (ANOVA, p = 0.038) in patients with stage IV CRC (mean 18.40; SEM 7.70) compared with stage I to III patients (mean 0.20; SEM 0.06) and non-cancer controls (mean 0.21; SEM 0.03). There was no correlation between AGR2 and LGR5 blood levels in the patients group (Pearson correlation coefficient −0.009; p = 0.952).
ROC curves of circulating mRNAs were constructed in order to be able to discriminate different groups (Figure 1).
Comparing the relative AGR2 levels in patients and controls, the AUC was 0.722 (95% CI, 0.594–0.849; p = 0.006). According to the ROC curve, a relative level for AGR2 mRNA in the blood of 1.65 was defined as the optimal cutoff value (Youden index) for differentiating patients with CRC from the controls. With this cutoff value for AGR2, the sensitivity and specificity of 62.8% (95% CI, 46.7 to 76.6) and 94.7% (95% CI, 71.9 to 99.7) respectively, were achieved. At this threshold value, AGR2 positivity was associated with CRC diagnostic (p < 0.001).
The ROC curve for LGR5 showed an AUC of 0.376 (95% CI, 0.233–0.520; p = 0.123). A relative blood level of 0.39 was defined as the optimal cutoff point for LGR5. With this cutoff value, the sensitivity and specificity for the LGR5 mRNA assay were 18.8% (95% CI, 9.4 to 33.10) and 100% (95% CI, 79.1 to 99.5) respectively. At this cutoff value, LGR5 positivity tended to associate with CRC diagnostic (p = 0.052).
In CRC patients, relative expression values for AGR2 and/or LGR5 in blood above these cutoff points, defined as the Youden index, were found in 16.7% of stage I–II, in 72.7% of stage III and in 76.9% of stage IV patients (χ2 test; p = 0.016).
AGR2 and LGR5 markers were analyzed in combination by logistic regression. The predicted probabilities of diagnosis generated a ‘combination marker’ ROC curve. The combination (AGR2/LGR5) had an AUC-ROC = 0.767 (95% CI, 0.648–0.886; p = 0.001) which was slightly improved [24] compared to AGR2 alone (p = 0.25). The sensitivity and specificity of the combination were 67.4% (95% CI, 51.3 to 80.5) and 94.7% (95% CI, 71.9 to 99.7) respectively (Figure 1).

2.1.3. Clinic Pathological Characteristics and mRNA Markers in Blood

The clinical and pathological characteristics and the AGR2 and LGR5 mRNA expression in blood from cancer patients are shown in Table 2.
A significant higher relative level of AGR2 blood expression was found in pT3-T4 tumors (p = 0.002) and high-grade lesions (p = 0.023). There was a tendency (p = 0.063) to higher AGR2 levels associated with lymph node metastasis. Increased LGR5 expression was found in patients (Table 2) with stage IV (p = 0.024), R2 resections (p = 0.024) or high-grade tumors (p = 0.024).
Carcinoembryonic antigen (CEA) and carbohydrate antigen 19.9 (CA 19.9) serum levels were increased above the upper limits of normal in 46.3% and 38.9% of the patients, respectively. There were no correlations between AGR2 or LGR5 mRNA levels with CEA or CA 19.9 in serum (Pearson −0.172, −0.155, 0.021 and −0.063 respectively).
To explore the possible influence of recent surgery on the circulation of tumor cells, we analyzed AGR2 and LGR5 levels according to the time interval from operation and blood sampling. The mean time from surgery to blood sampling for mRNA quantification was 52.5 weeks (SEM 8.7 weeks; median, 18 weeks; range, 1 to 202 weeks). The 25th percentile was 6.75 weeks. There was no significant difference in AGR2 and LGR5 levels between time intervals (<6.75 or ≥6.75 weeks) from the last surgery.
In the group of patients with stage IV disease, AGR2 and LGR5 were analyzed according to the prognostic subgroups defined as described previously [19]. The mean (SEM) relative AGR2 levels were 443.1 (229.6) and 518.8 (129.9) for low- and combined intermediate/high-risk groups, respectively (t test, p = 0.759). The median (SEM) relative LGR5 levels were 15.5 (11.7) and 20.6 (10.4) for low- and combined intermediate/high-risk groups, respectively (t test, p = 0.746).

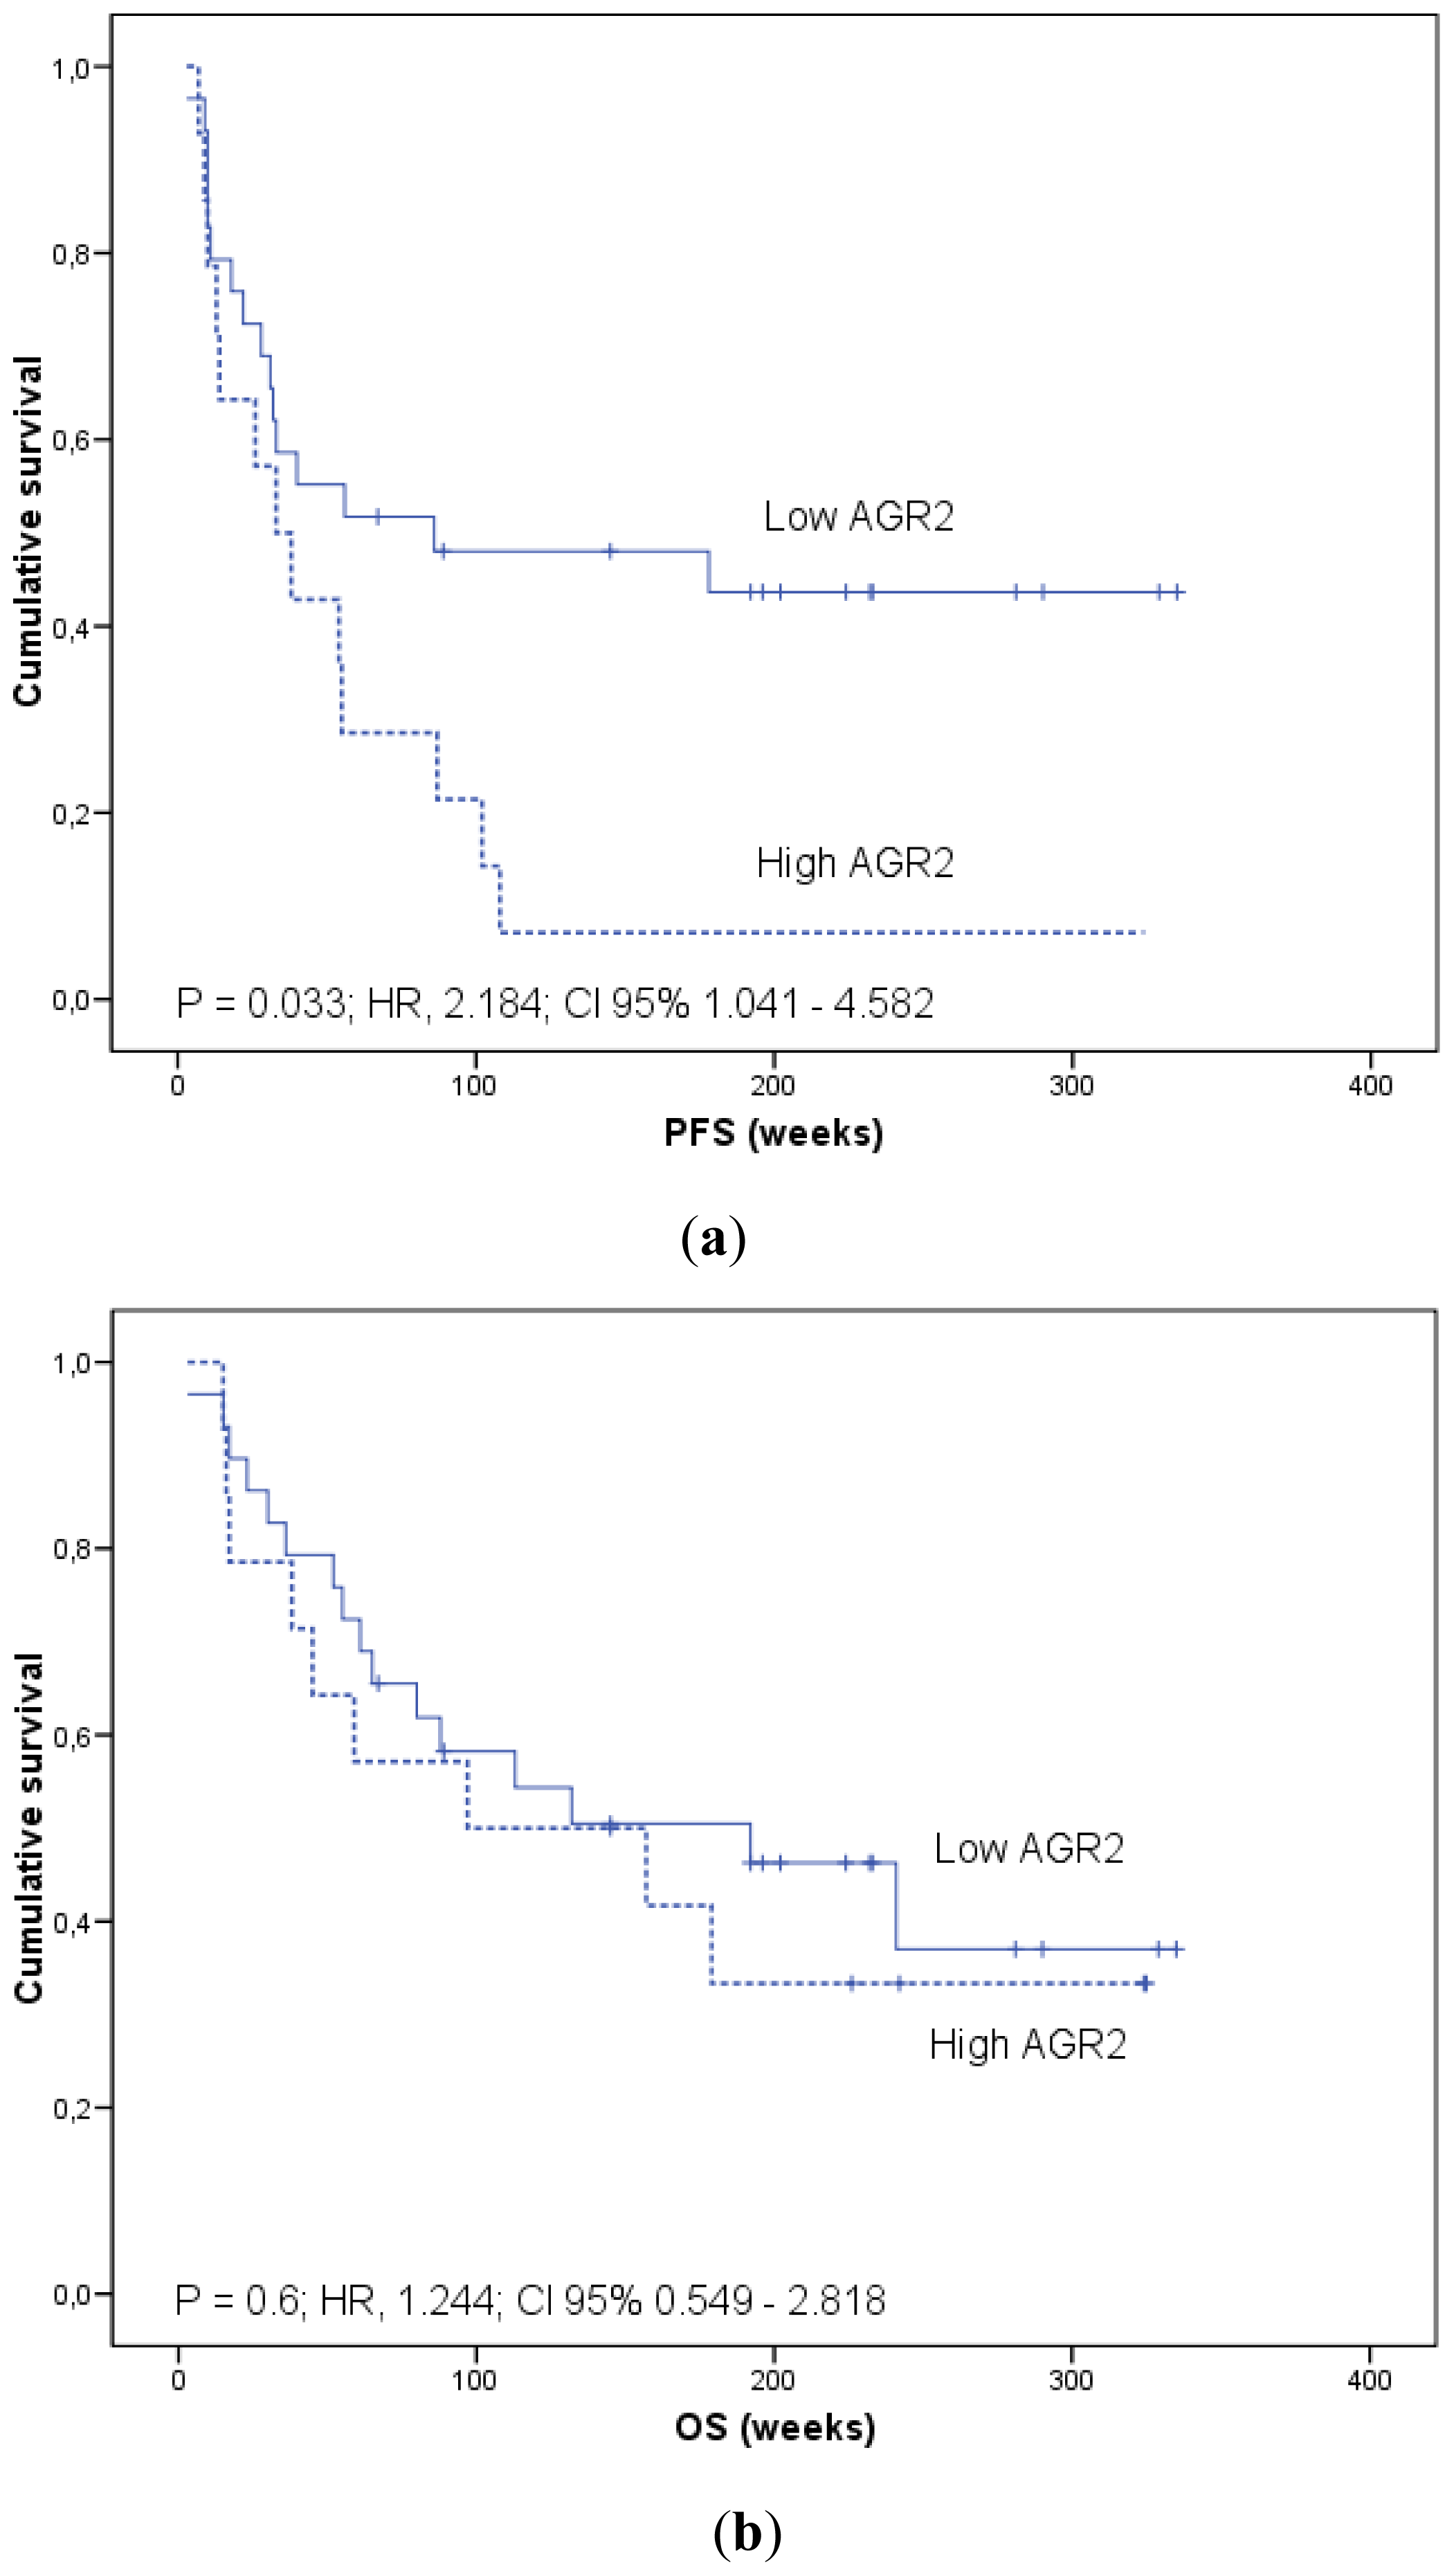
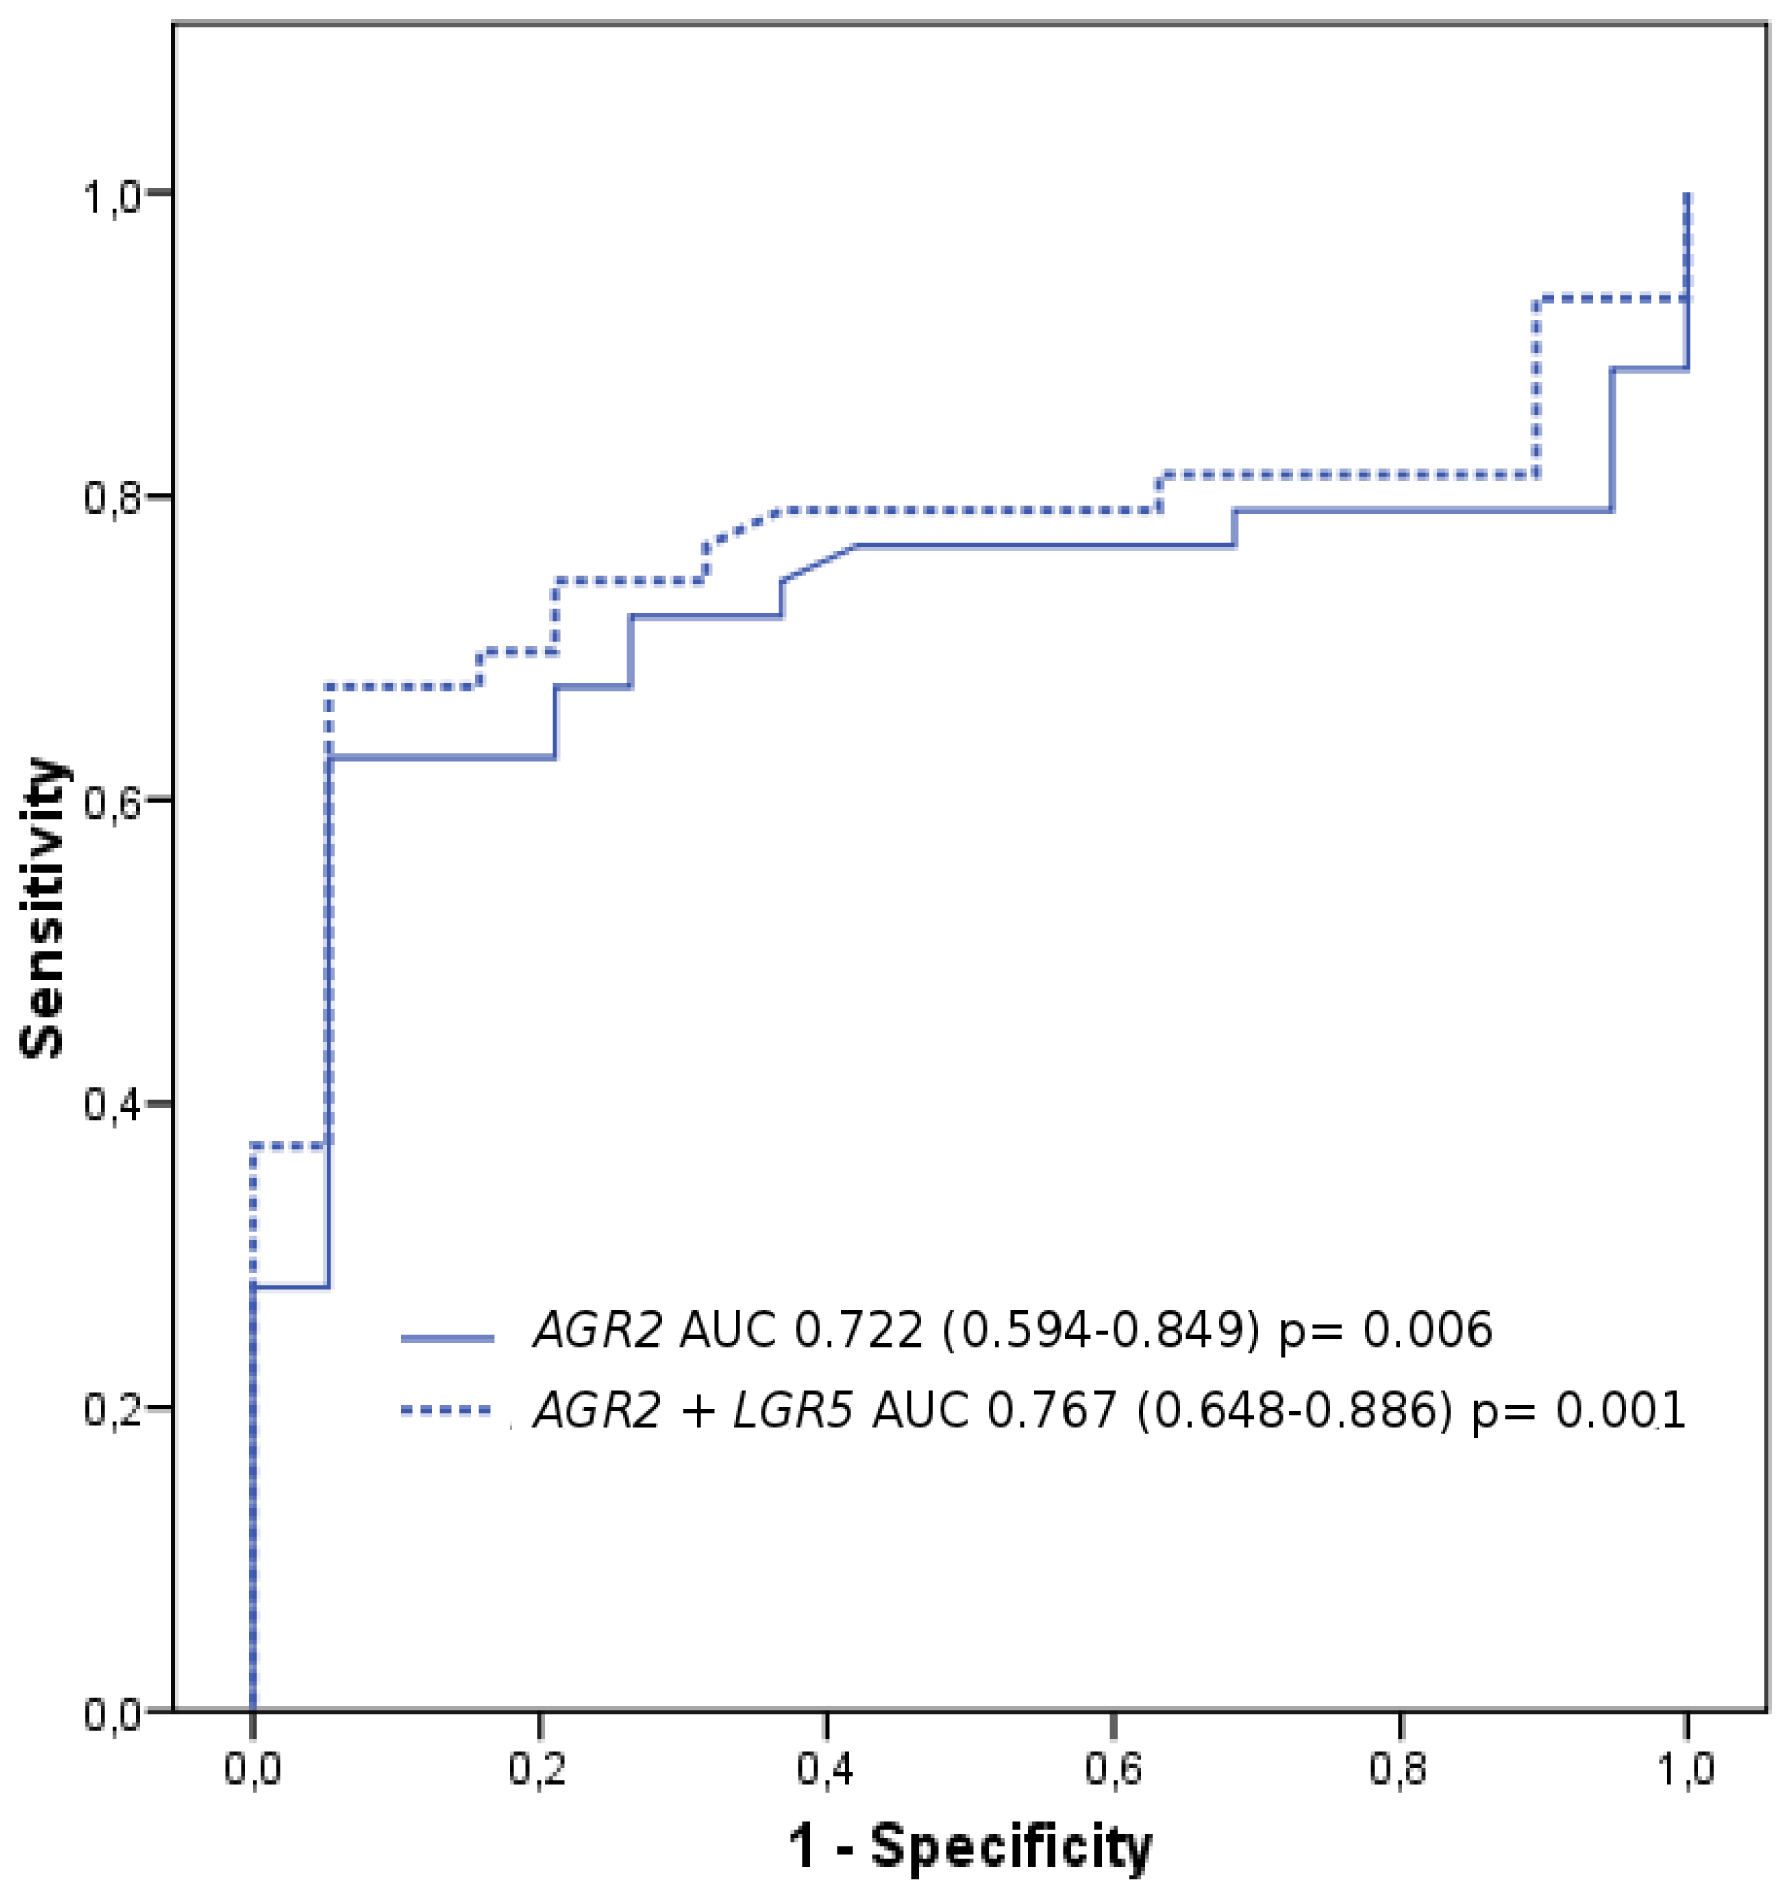
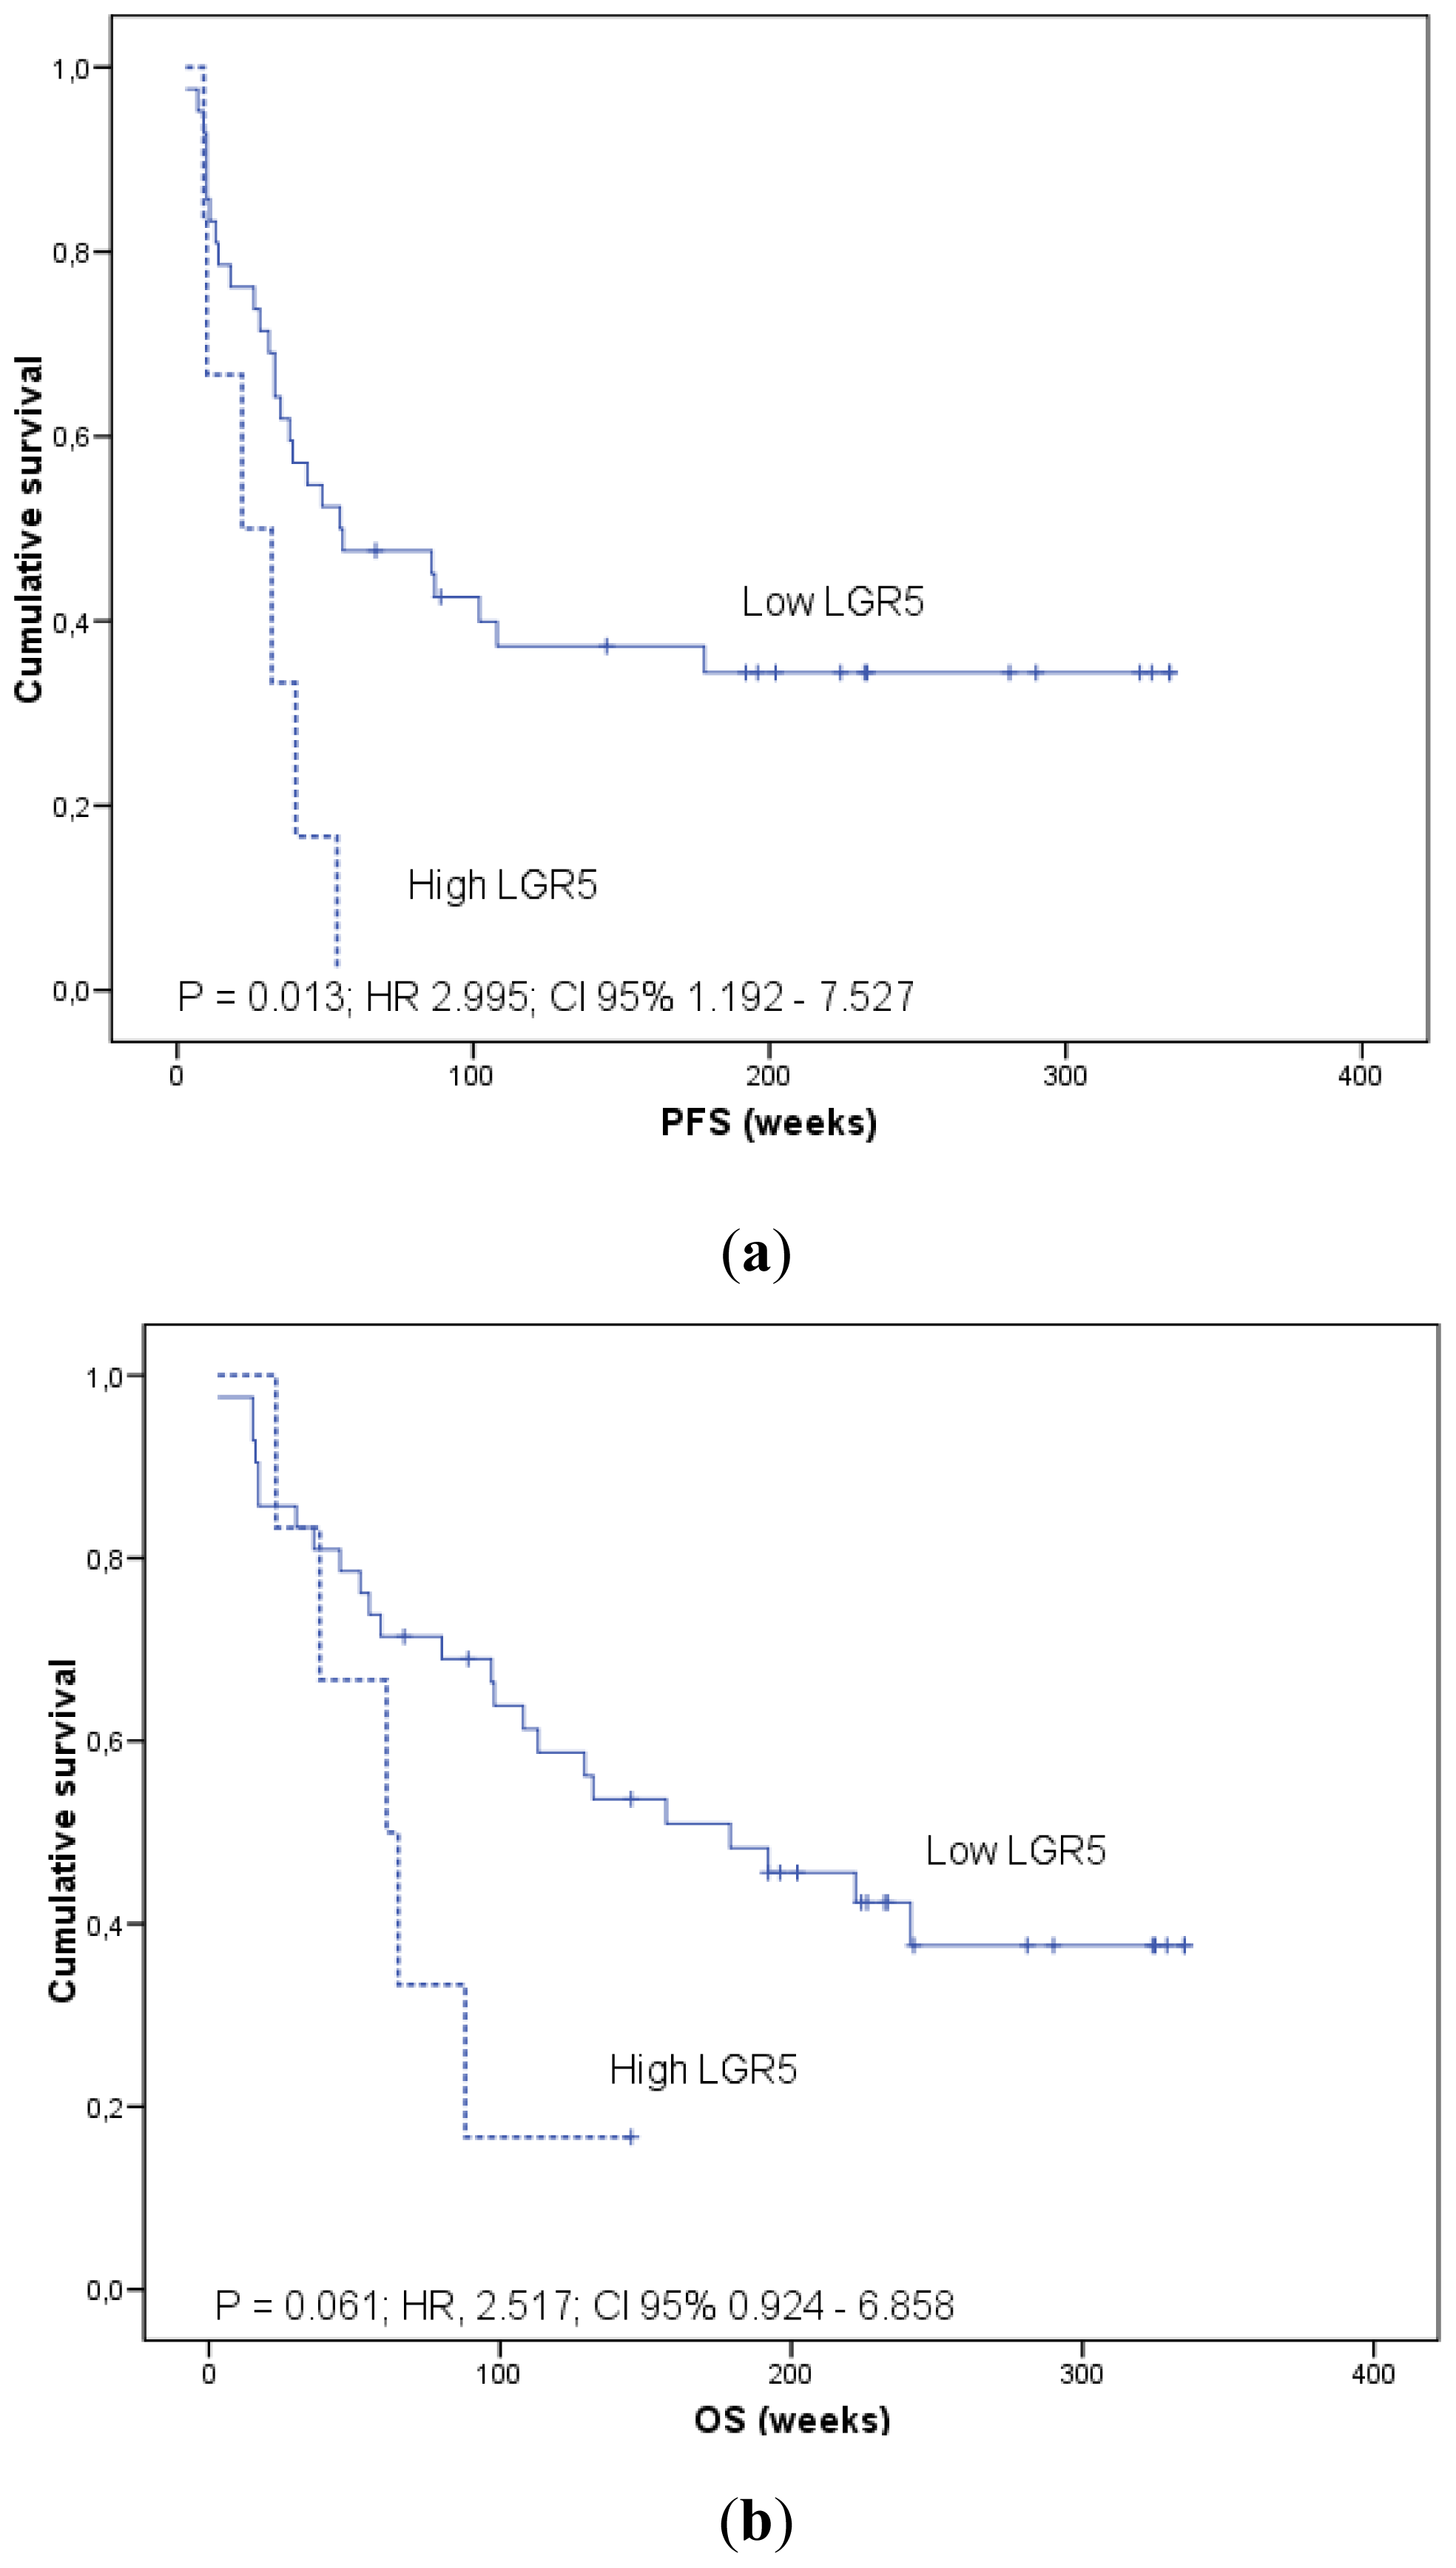
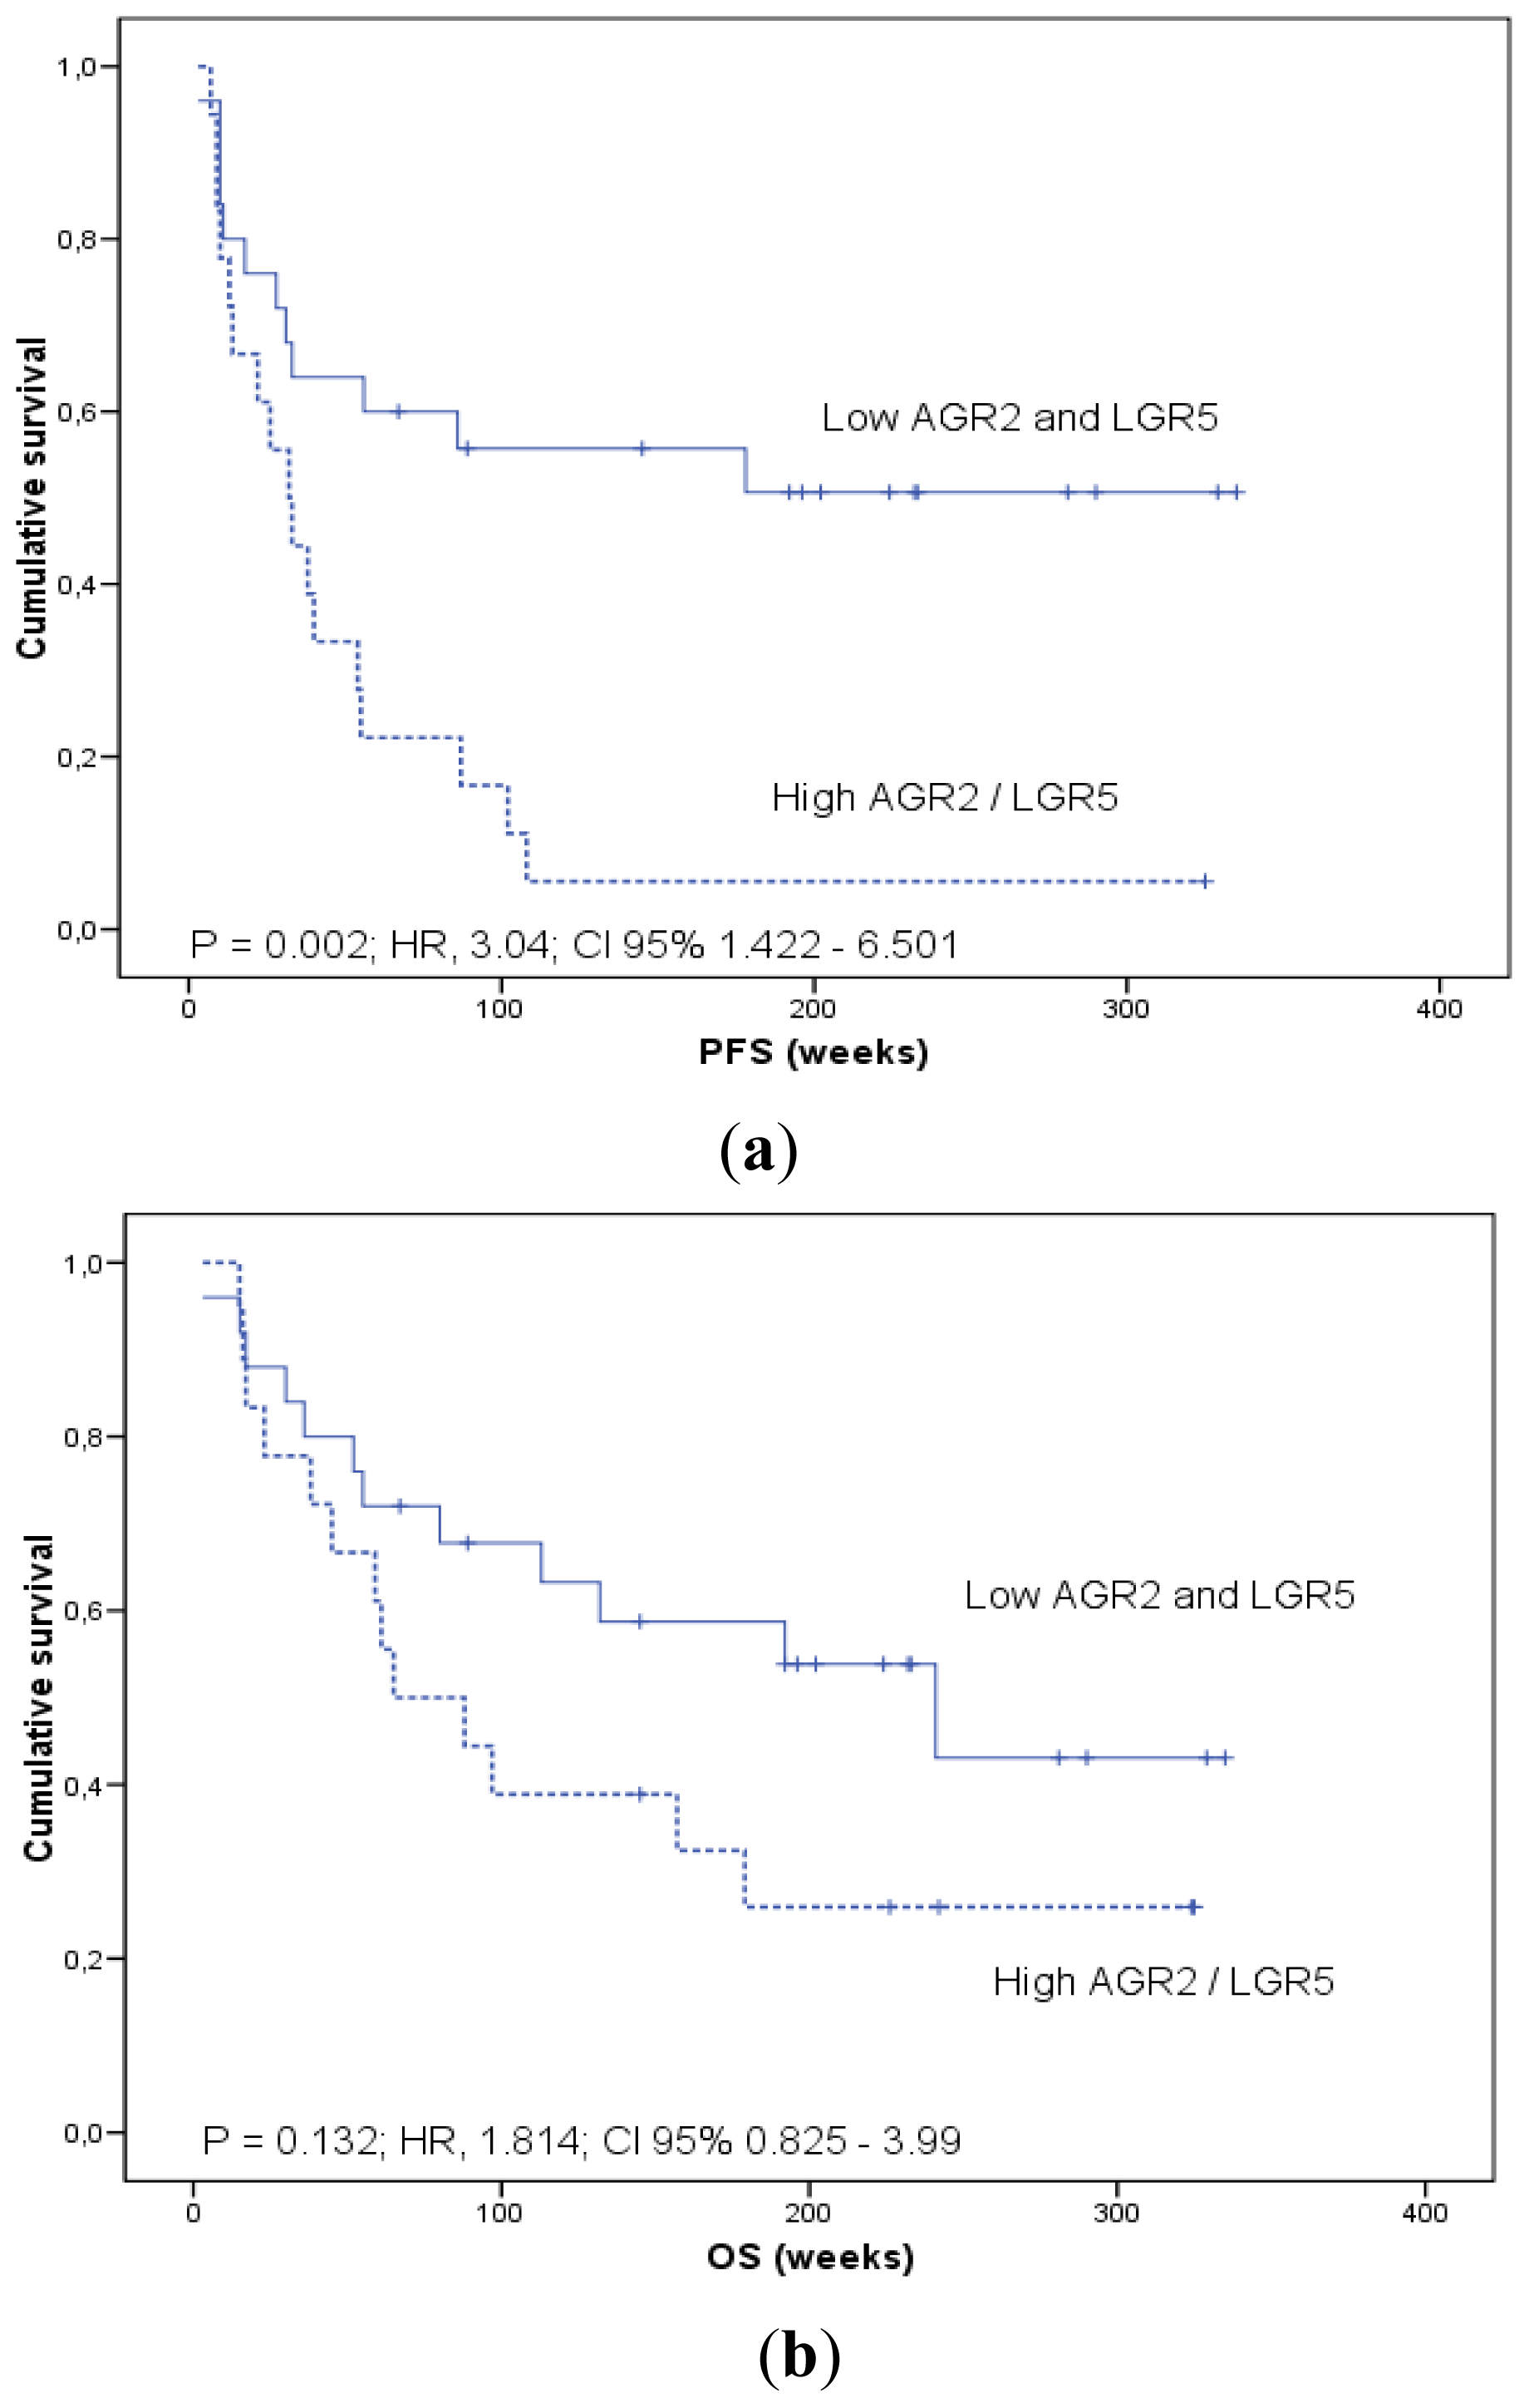
2.1.4. Prognostic Significance of AGR2 and LGR5 in Blood

To analyze the relationships between biomarker expression and outcomes (PFS and OS) we estimated the hazard ratios associated with mRNA levels as continuous variables using Cox regression models [25]. There was a trend for a high risk of disease progression associated with increased AGR2 relative blood expression (HR 1.0; 95% CI, 1.0 to 1.001; p = 0.093). There was no association with the risk of death (HR 1.0; 95% CI, 0.999 to 1.001; p = 0.913). However, in stage I to III patients, the risk of disease progression was higher with increasing AGR2 level (HR 1.002; 95% CI, 1 to 1.004; p = 0.046).
Increasing relative blood expression of LGR5 mRNA as a continuous variable was associated with a higher risk of disease progression (HR 1.013; 95% CI, 1.004 to 1.023; p = 0.007). The risk of death was also higher with increasing levels for LGR5 mRNA in the blood (HR 1.01; 95% CI, 1 to 1.020; p = 0.045).
In addition, in order to generate survival curves, we converted continuous mRNAs expression levels measured on qRT-PCR to a dichotomous variable, using the mean levels of expression in the patients group as a threshold. Kaplan-Meier curves for patients categorized according to AGR2 and LGR5 mRNA expression in blood are shown (Figures 24).
The median PFS for the group with high AGR2 blood expression were 33 weeks (95% CI, 11 to 55) compared with 86 weeks (95% CI, 0 to 305.1) in the group with low AGR2 (log-rank test, p = 0.033). Patients with high AGR2 showed worse OS (median 97 weeks; 95% CI, 0 to 262.9) compared with those with low AGR2 expression (median 192 weeks; 95% CI, 56.6 to 327.4) although this difference was not statistically significant (log-rank test, p = 0.6) (Figure 2).
Analysis of the patients’ outcome according to LGR5 blood expression revealed that the high LGR5 group exhibited significantly worse PFS (median 22 weeks; 95% CI, 0 to 48.4) compared with patients in the low LGR5 group (median 55 weeks; 95% CI, 5.1 to 104.9) (p = 0.013). Although non-significant, there was a trend (p = 0.061) for a better OS in the group of patients with low LGR5 (median 179 weeks; 95% CI, 74.9 to 283.1) compared with the group with increased LGR5 blood levels (median 61 weeks; 95% CI, 28.6 to 93.4) (Figure 3).
High mRNA in PB (combined AGR2 and/or LGR5 transcript above the threshold cutoff) was found in 0, 36.4% and 53.8% of stage I–II, III and IV patients, respectively (χ2 test; p = 0.05).
Patients were divided into favorable mRNA profile (both AGR2 and LGR5 below the mean) and unfavorable mRNA profile (AGR2 and/or LGR5 above the mean). At the time of analysis, the mean and the median PFS in the favorable group were 190.8 weeks (95% CI, 131.2 to 250.4 weeks) and not reached in the unfavorable group. The mean and the median PFS were 54.7 weeks (95% CI, 21.2 to 88.1 weeks) and 32 weeks (95% CI, 17.5 to 46.6 weeks) in the unfavorable mRNA profile group (log-rank test p = 0.002) (Figure 4).
Multivariate Cox regression analyses were performed to determine whether high mRNA in blood were independently statistically predictive of PFS or OS (Table 3).
In testing for the independent prognostic significance of high AGR2/LGR5 expression in a model with pT depth of invasion, lymph node involvement and residual disease (R resection status), the R status (HR of recurrence, 5.8; 95% CI, 1.7 to 19.7; p = 0.005) and the high mRNA blood expression (HR, 2.8; 95% CI, 1.2 to 6.4; p = 0.014) remained associated with PFS (Table 3). In this model, the only factor that retained independent prognostic significance for OS was R2-residual disease (HR of death, 7.338; 95% CI, 1.683 to 31.985; p = 0.008).

2.2. Discussion

Highly sensitive detection of CTC and detailed molecular characterization of rare cancer cell subpopulations may not only provide insights into the biology of early metastatic spreading, but these tools can also potentially indicate substantial predictive or prognostic information. PCR amplification of tumor mRNA is a powerful analytical tool for surrogate detection and characterization of CTC. Real-time RT-PCR allows for quantification of the tumor cell load in the PB and, at least theoretically, the determination of cutoff values of mRNA expression of clinical relevance in cancer patients. However, the sensitivity and specificity of this approach both depend on the expression level of candidate biomarkers in tumor cells as well as their background expression in the blood [26,27].
Evidence is rapidly accumulating that cancers are composed of heterogeneous populations of cells. Thus, one would predict that CTC might be enriched in cancer cells that express those biomarkers indicating the greatest invasive and metastatic capacity, including cancer stem cells (CSC) markers. Hence, the selection of appropriate target mRNAs that may be useful for clinical detection of CTC and CSC remains an important outstanding issue.
The current study was intended to assess the diagnostic performance of quantitative RT-PCR detection of AGR2 in the blood as a surrogate marker of CTC. We then hypothesized that a marker indicative of the phenotype of colonic stem cells, such as LGR5, would improve the detection of biologically and clinically relevant CTC.
We found that AGR2 mRNA was significantly elevated in the blood of patients with CRC compared to controls. ROC analysis suggested that at 94.7% specificity, AGR2 achieved 62.8% sensitivity in distinguishing CRC blood samples from the control group. Furthermore, in CRC patients, blood AGR2 mRNA levels correlated with different pathological prognostic factors, including pT3–pT4 depth of invasion and high-grade tumors.
These results are in line with the current evidence indicating that AGR2 can promote cancer growth, cell survival, migration and anchorage-independent growth and cellular transformation [14,28]. In the clinical setting, AGR2 protein expression in the primary tumor is an independent prognostic indicator of poor outcome in patients with breast [29] and prostate adenocarcinomas [30], and one recent study showed that increased AGR2 protein in plasma is associated with ovarian cancer [31].
However, to the best of our knowledge, no comprehensive report has been published about the potential prognostic relevance of AGR2 in colorectal cancer. Our findings indicate for the first time that the quantitative assessment of AGR2 mRNA in blood might indicate a poor patient outcome in CRC. Remarkably, in stage I to III patients, the risk of disease progression was higher with increasing levels of AGR2 in the blood. Likewise, in CRC patients with high AGR2 blood expression, the PFS was significantly reduced, and there was a numerical but non-significant inferior OS.
A recent study [32] demonstrates that AGR2 induces the expression of the growth-promoting EGFR ligand amphiregulin in human adenocarcinomas. This effect is mechanistically mediated through Yes-associated protein (YAP1) dephosphorylation. Interestingly, YAP1 is also implicated in the regulation of stem cell division through the repression of the Hippo pathway. These data and a previous report [14] show that proliferating and non-proliferating ISCs, as well as transit-amplifying cells from a secretory lineage express AGR2 and suggest additional mechanisms for oncogenic actions for AGR2.
We next explored the expression of the ISC marker LGR5 in the blood of our cohort of controls and CRC patients. We found that LGR5 mRNA was significantly elevated in the blood of patients with colorectal carcinoma compared to controls. However, mean levels of LGR5 mRNA were similar in controls and early stage CRC patients. Nevertheless, there was a significant increase of LGR5 in blood obtained from metastatic CRC patients. When a cutoff point was defined based on the ROC curve, the LGR5 assay achieved only 18.8% sensitivity but 100% specificity in distinguishing CRC and control blood samples. Conversely, LGR5 mRNA in the blood showed a significant correlation with high-grade tumors, metastatic disease and R2 resections. Likewise, LGR5 expression in the blood showed a prognostic value regarding both PFS and OS in CRC patients, as suggested by the Cox regression and Kaplan-Meier analysis. In that sense, our results suggested that LGR5 is expressed only in a rare subset of CTC possibly including cancer stem-like cells. We could speculate that these circulating LGR5-expressing cells might contribute to cancer progression and therapeutic response.
The clinical and biological significances of LGR5 expressing-cells in CRC are poorly understood. A primary tumor profile that encompasses known ISC markers, such as LGR5, has been strongly associated both with CRC stages and the occurrence of tumor relapse and metastasis [33]. LGR5 protein expression had been associated with a poor PFS in CRC patients [22]. In contrast, in a recent report [34] a gene signature defined by methylation silencing of the Wnt-driven ISC marker genes, including LGR5, in CRC tumors was associated with a poor prognosis.
A number of proposed CSC markers, such as CD44 and CD133, have been explored in CTC detection. Recently, Iinuma H. et al. [7] demonstrated in patients with Dukes’ stage B and C CRC that the detection of CEA/Cytokeratins (CK) 19/20/CD133 mRNA in blood was useful for determining which patients were at high risk for recurrence and poor prognosis. However, in the CD133 single-marker analysis, no significant differences in OS and PFS were found [7]. In metastatic CRC, the transcriptional amount of CD133 in blood before resection of hepatic metastases resulted in a high risk of dying of recurrence after apparently curative liver surgery [35]. Nonetheless, CD133 and other putative markers for CRC stem cells such as CD44 are also expressed in a variety of cells including hematopoietic and/or endothelial cells (reviewed Hundt, S. in [27]), a factor that could diminish their specificity. The expression patterns of LRG5 and colon differentiation markers such as cytokeratin−20 are mutually exclusive [33] are of special interest for CTC detection. These facts strengthen the relevance of non-CK mRNA biomarkers for the detection of the most aggressive and specific subpopulations of CTC in CRC patients.
CTC in gastrointestinal cancer patients are increasingly detected when blood is obtained per- or intra-operatively [36]. However, the postoperative sampling time might reflect the most relevant CTC status [4,37]. In our study, blood samples were obtained several weeks after surgery. In order to explore the possible influence of recent surgery on the circulation of tumor cells, AGR2 and LGR5 levels were analyzed according to time intervals between surgery and blood sampling; conversely, no significant differences in biomarker mRNA levels between time intervals were found. From a clinical perspective, assessment of baseline prognostic factors and CTC detection rates may be of interest. In previous studies [38,39] including patients with metastatic CRC, the number of CTC detected using the Cell Search System was associated with high LDH level, liver metastasis and poorer performance status. Hence, we performed an exploratory analysis in the subset of stage IV CRC patients, which showed no association between a positive mRNA result and baseline clinical prognostic subgroups categorized according to performance status, white blood cell count, alkaline phosphatase and number of metastatic sites. In addition, levels of AGR2 and LGR5 were not significantly different either.
The combined AGR2 and LGR5 assay resulted in an increased sensitivity (67.4%; AUC-ROC = 0.767; p = 0.001) to separate cancer patients and controls. Remarkably, and in spite of the limited number of patients, Cox multivariate analysis demonstrated that AGR2/LGR5 mRNA detection was a significant prognostic factor for PFS (HR, 2.8; 95% CI, 1.2 to 6.4; p = 0.014). Thus, the transcriptional amount of AGR2/LGR5 in the PB defined subgroups of CRC patients with significantly different risks of disease progression, improving the so-called biologic specificity [40] of CTC detection.
Our findings indicate a high sensitivity and specificity for AGR2/LGR5 qRT-PCR for the surrogate detection of CTC in PB samples and it could be useful as a prognostic factor in patients with CRC. However, taking into account the design and sample size of the study, the outcome results could only be considered as generating a hypothesis. Additional possible limitations of this study must be considered. Although the inclusion of patients with different stages and residual tumor status could be considered limitations of the study, we suggest that this pragmatic design accurately reflects the patients attending the oncology clinic every day. Thus, the diagnostic performance of mRNA quantification has been estimated in a cohort of patients truly representative of those found in the clinical setting. However, to adequately assess the prognostic role, if any, of AGR2 and LGR5 mRNA levels in the blood, a larger, more homogeneous cohort of patients is clearly needed. Furthermore, a comparative study with immunofluorescence-based methods such as the Cell Search System is warranted.

3. Experimental Section

3.1. Patients

Consecutive patients with CRC from the Medical Oncology Unit at the University Hospital in La Coruña (Galicia, Spain) were included in the study. Inclusion criteria were as follows: A confirmed pathological diagnosis of colorectal adenocarcinoma; stage I–III patients with no prior systemic therapy for cancer; or stage IV patients without previous systemic therapy or with confirmed cancer progression after such treatment. Exclusion criteria were defined as follows: Any other previous malignancy; coagulations disorders; platelet count less than 20.0 × 10⁹ L−1.
The diagnostic work-up included a clinical examination, blood sampling with CA 19.9 and CEA serum determination, endoscopy (when clinically indicated), thoracic radiograph and computed tomography (CT) scanning of the abdomen and pelvis. Chest CT was performed in patients with rectal tumors and stage IV patients. Patients were followed up with imaging every 8 to 12 weeks to monitor disease progression.
Serum CEA (with an upper limit of normal of 5 ng/mL) and CA 19.9 (with an upper limit of normal of 37 U/mL) levels were determined using enzyme immunoassay (Advia Centaur, Siemens Healthcare Diagnostics) according to the manufacturer’s instructions.
PBs for qRT-PCR analyses were obtained after surgery, before neo-adjuvant chemotherapy or in the presence of active, clinically and radiological advanced progressive disease. At least the first 5 mL of blood obtained was discarded to avoid contamination with epidermal cells.
Controls were consecutively recruited from the patients’ family and relatives. We only excluded controls with a previous history of malignant disease. Thus, controls with different chronic but stable diseases (e.g., hypertension, diabetes mellitus or heart disease) were eligible and consecutively recruited. Controls were selected to include a sex and age distribution that was comparable to the patient group.
This study was approved by the Ethics Committee of Clinical Investigation of Galicia (Spain), and written informed consents were obtained from all patients and controls prior to their inclusion in the study.

3.2. Pathological Analysis

Tumors and regional lymph nodes collected during surgery were processed on a routine diagnostic basis. Histological tumor type, depth of invasion and nodal involvement were analyzed, and the disease was staged and graded according to the TNM [41].
Residual disease status at the time of blood sampling was classified as R0 when no residual disease was present after surgery, R1 when microscopic residual disease was found, and R2 in the presence of macroscopic disease. Patients from whom the blood was obtained before the start of neo-adjuvant treatment were categorized as R2.

3.3. Processing of Blood Samples and mRNA Isolation

Peripheral venous blood (10 mL) was collected in EDTA-containing tubes. Samples were stabilized within 1 h after withdrawal in guanidinium-based RNA/DNA reagent (Roche, Germany) at 10% (v/v) without cell and plasma separation. An isolation reagent for blood and bone marrow (Roche, Germany) was used for mRNA extraction according to the manufacturer’s protocol with minor modifications [10]. Purified poly(A) + RNA was further processed for qRT-PCR or stored at −80 °C until use.
The RNA concentration was determined based on UV absorption at 260 nm. The A260/A280 ratio was calculated to assess RNA quality and purity.

3.4. Reverse Transcription and Quantitative Real-Time PCR

Reverse transcription (RT) was performed on 0.02 μg of mRNA using the Superscript First-Strand Synthesis System (Invitrogen Life Technologies, Carlsbad, CA, USA) as described previously [10]. Real-time PCR analysis was performed using the following primers: AGR2-2F, CTGGCCAGAGATACCACAGTC; AGR2-2R, AGTTGGTCACCCCAACCTC; LGR5-F, CAGCGTCTTCACCTCCTAC; LGR5-R, TTTCCCGCAAGACGTAACTC. The AGR2 and LGR5 primers amplified 101 bp and 108 bp of the respective cDNAs. Primer pairs were chosen so that the sequences were located in different exons. Hypoxanthine-guanine phosphoribosyl-transferase 1 (HPRT1) was selected as reference gene, as previously reported [8]. HPRT1 (102 bp) was also used as an internal control to verify the RNA integrity and the efficacy of reverse transcription. Any specimen with inadequate HPRT1 mRNA was excluded from the study.
The PCR reaction consisted of 10 μL of 2× SYBR Green I Master Mix (Roche, Germany), 1.4 μL of forward (F) and reverse (R) primers at 5 μmol/L (Tib MolBiol, Germany), 4 μL of cDNA and PCR-grade water up to a final volume of 20 μL following the manufacturer’s recommendations. Amplifications were performed in a Light Cycler 480 (Roche Applied Science, Penzberg, Germany).
The maximum number of cycles was 50. If after 40 cycles no fluorescent signal was detected on the amplification plots, the marker mRNA was assumed to be absent from the sample.
We verified that the amplifications and the size of each PCR product were specific by melting curve analysis. Data analysis was performed with Light Cycler 480 Relative Quantification software (Roche Applied Science, Penzberg, Germany). Relative levels of expression were calculated by the 2−ΔΔCt method [42]. Each assay was done at least in triplicate. The average value of the replicates was used as the quantitative value for each sample.
Each assay included marker-positive, marker-negative and no-template controls. RNA analyses were performed with no knowledge about clinical or follow-up data.

3.5. Study Design and Statistical Analysis

This project was designed as a prospective early-phase, diagnostic case-control study. The primary aim was to estimate the diagnostic performances of AGR2 and LGR5 in blood as clinical biomarkers [43]. Receiver operating characteristic (ROC) curves were constructed by plotting sensitivity (y-axis) versus 1-specificity (false-positive rate; x-axis), and the area under the curve (AUC) was calculated. The optimal cutoff for mRNAs expression level that separates cancer patients and controls was obtained at the point of the maximum Youden index. Binary logistic regression analyses were used to assess for diagnostic suitability of marker combinations.
Secondary aims included the evaluation of AGR2 and LGR5 mRNA blood levels in CRC patients according to the disease characteristics and clinical outcomes. Parametric tests were used to analyze the potential correlation between mRNA biomarker expression and clinical and pathological features of study subjects.
PFS was measured as the time between the baseline PB sampling for biomarkers analysis and the documentation of the first tumor progression based on clinical and radiological findings or death of any cause. OS was defined as the time from baseline blood sampling to death of any cause. Patients who were alive and progression-free at the time of analysis were censored by using the time between the baseline PB sampling and their most recent follow-up evaluation. The Kaplan-Meier method was used to estimate PFS and OS. Log-rank tests were used to assess the difference between the survival curves. Hazard ratios (HR) were modeled using Cox proportional hazard regression analysis.
All statistical tests were two-sided, with alpha levels lower than 0.05 considered statistically significant. PASW Statistics 18.0 for Windows (version 18.0; IBM Corporation: Armonk, NY, USA, 2010) was used for statistical analysis.
The study design and results are presented in accordance with the REMARK [44] and MIQE guidelines [45].

4. Conclusions

Our findings indicate that the quantitative molecular assessment of AGR2 and LGR5 can serve as a surrogate marker of CTC and ISC-like circulating tumor cells in CRC patients. Elevated AGR2 and LGR5 mRNA levels in the blood are associated with poor outcome in patients with CRC.

Acknowledgments

We wish to thank our patients and their families for their participation in the study. The excellent collaboration of Oncology staff nurses is recognized.
This study was supported by the Universidade da Coruña (grant 5090252501) and “Rede Galega de Investigación sobre Cancro Colorrectal” (REGICC). S. Díaz-Prado and A. Figueroa are supported by IPP.08-07 “Isidro Parga Pondal” research contract from Xunta de Galicia (Spain). M. Blanco-Calvo and M. Haz are supported in part by grants CA07/00232 and CA09/00116 from “Instituto de Salud Carlos III” (Spain). Cancer research in our laboratory is supported by the “Fundación Complejo Hospitalario Universitario La Coruña”.

References

  1. Malvezzi, M.; Arfé, A.; Bertuccio, P.; Levi, F.; La Vecchia, C.; Negri, E. European cancer mortality predictions for the year 2011. Ann. Oncol 2011, 22, 947–956. [Google Scholar]
  2. Bustin, S.A.; Mueller, R. Real-time reverse transcription PCR and the detection of occult disease in colorectal cancer. Mol. Asp. Med 2006, 27, 192–223. [Google Scholar]
  3. Sergeant, G.; Penninckx, F.; Topal, B. Quantitative RT-PCR detection of colorectal tumor cells in peripheral blood—A systematic review. J. Surg. Res 2008, 150, 144–152. [Google Scholar]
  4. Rahbari, N.N.; Aigner, M.; Thorlund, K.; Mollberg, N.; Motschall, E.; Jensen, K.; Diener, M.K.; Büchler, M.W.; Koch, M.; Weitz, J. Meta-analysis shows that detection of circulating tumor cells indicates poor prognosis in patients with colorectal cancer. Gastroenterology 2010, 138, 1714–1726. [Google Scholar]
  5. Tsouma, A.; Aggeli, C.; Lembessis, P.; Zografos, G.N.; Korkolis, D.P.; Pectasides, D.; Skondra, M.; Pissimissis, N.; Tzonou, A.; Koutsilieris, M. Multiplex RT-PCR-based detections of CEA, CK20 and EGFR in colorectal cancer patients. World J. Gastroenterol 2010, 16, 5965–5974. [Google Scholar]
  6. Thorsteinsson, M.; Jess, P. The clinical significance of circulating tumor cells in non-metastatic colorectal cancer. A review. Eur. J. Surg. Oncol 2011, 37, 459–465. [Google Scholar]
  7. Iinuma, H.; Watanabe, T.; Mimori, K.; Adachi, M.; Hayashi, N.; Tamura, J.; Matsuda, K.; Fukushima, R.; Okinaga, K.; Sasako, M.; et al. Clinical significance of circulating tumor cells, including cancer stem-like cells, in peripheral blood for recurrence and prognosis in patients with Dukes’ stage B and C colorectal cancer. J. Clin. Oncol 2011, 29, 1547–1555. [Google Scholar]
  8. Valladares-Ayerbes, M.; Díaz-Prado, S.; Reboredo, M.; Medina, V.; Iglesias-Díaz, P.; Lorenzo-Patiño, M.J.; Campelo, R.G.; Haz, M.; Santamarina, I.; Antón-Aparicio, L.M. Bioinformatics approach to mRNA markers discovery for detection of circulating tumor cells in patients with gastrointestinal cancer. Cancer Detect. Prev 2008, 32, 236–250. [Google Scholar]
  9. Valladares-Ayerbes, M.; Díaz-Prado, S.; Reboredo, M.; Medina, V.; Lorenzo-Patiño, M.J.; Iglesias-Díaz, P.; Haz, M.; Pértega, S.; Santamarina, I.; Blanco, M.; et al. Evaluation of plakophilin-3 mRNA as a biomarker for detection of circulating tumor cells in gastrointestinal cancer patients. Cancer Epidemiol. Biomark. Prev 2010, 19, 1432–1440. [Google Scholar]
  10. Smirnov, D.A.; Zweitzig, D.R.; Foulk, B.W.; Miller, M.C.; Doyle, G.V.; Kenneth, J.P.; Neal, J.M.; Louis, M.W.; Steven, J.C.; Jose, G.M.; et al. Global gene expression profiling of circulating tumor cells. Cancer Res 2005, 65, 4993–4997. [Google Scholar]
  11. Sieuwerts, A.M.; Mostert, B.; Bolt-de Vries, J.; Peeters, D.; de Jongh, F.E.; Stouthard, J.M.L.; Dirix, L.Y.; van Dam, P.A.; Galen, A.V.; de Vanja, W.; et al. mRNA and microRNA expression profiles in circulating tumor cells and primary tumors of metastatic breast cancer patients. Clin. Cancer Res 2011, 17, 3600–3618. [Google Scholar]
  12. Thompson, D.A.; Weigel, R.J. hAG-2, the human homologue of the Xenopus laevis cement gland gene XAG-2, is coexpressed with estrogen receptor in breast cancer cell lines. Biochem. Biophys. Res. Commun 1998, 251, 111–116. [Google Scholar]
  13. Pohler, E.; Craig, A.L.; Cotton, J.; Lawrie, L.; Dillon, J.F.; Ross, P.; Kernohan, N.; Hupp, T.R. The Barrett’s antigen anterior gradient-2 silences the p53 transcriptional response to DNA damage. Mol. Cell Proteomics 2004, 3, 534–547. [Google Scholar]
  14. Wang, Z.; Hao, Y.; Lowe, A.W. The adenocarcinoma-associated antigen, AGR2, promotes tumor growth, cell migration, and cellular transformation. Cancer Res 2008, 68, 492–497. [Google Scholar]
  15. Park, S.W.; Zhen, G.; Verhaeghe, C.; Nakagami, Y.; Nguyenvu, L.T.; Barczak, A.J.; Killeen, N.; Erle, D.J. The protein disulfide isomerase AGR2 is essential for production of intestinal mucus. Proc. Natl. Acad. Sci. USA 2009, 106, 6950–6955. [Google Scholar]
  16. Balic, M.; Lin, H.; Young, L.; Hawes, D.; Giuliano, A; McNamara, G.; Datar, R.H.; Cote, R.J. Most early disseminated cancer cells detected in bone marrow of breast cancer patients have a putative breast cancer stem cell phenotype. Clin. Cancer Res. 2006, 2, 5615–5621. [Google Scholar]
  17. Aktas, B.; Tewes, M.; Fehm, T.; Hauch, S.; Kimmig, R.; Kasimir-Bauer, S. Stem cell and epithelial-mesenchymal transition markers are frequently overexpressed in circulating tumor cells of metastatic breast cancer patients. Breast Cancer Res 2009, 11. [Google Scholar] [CrossRef]
  18. Visvader, J.E.; Lindeman, G.J. Cancer stem cells in solid tumors, accumulating evidence and unresolved questions. Nat. Rev. Cancer 2008, 8, 755–758. [Google Scholar]
  19. Barker, N.; van Es, J.H.; Kuipers, J.; Kujala, P.; van den Born, M.; Cozijnsen, M.; Haegebarth, A.; Korving, J.; Begthel, H.; Peters, P.J.; et al. Identification of stem cells in small intestine and colon by marker gene Lgr5. Nature 2007, 449, 1003–1007. [Google Scholar]
  20. McClanahan, T.; Koseoglu, S.; Smith, K.; Grein, J.; Gustafson, E.; Black, S.; Kirschmeier, P.; Samatar, A. Identification of overexpression of orphan G protein-coupled receptor GPR49 in human colon and ovarian primary tumors. Cancer Biol. Ther 2006, 5, 419–426. [Google Scholar]
  21. Uchida, H.; Yamazaki, K.; Fukuma, M.; Yamada, T.; Hayashida, T.; Hasegawa, H.; Kitajima, M.; Kitagawa, Y.; Sakamoto, M. Overexpression of leucine-rich repeat-containing G protein-coupled receptor 5 in colorectal cancer. Cancer Sci 2010, 101, 1731–1737. [Google Scholar]
  22. Takahashi, H.; Ishii, H.; Nishida, N.; Takemasa, I.; Mizushima, T.; Ikeda, M.; Yokobori, T.; Mimori, K.; Yamamoto, H.; Sekimoto, M.; et al. Significance of Lgr5+ve Cancer Stem Cells in the Colon and Rectum. Ann. Surg. Oncol 2011, 18, 1166–1174. [Google Scholar]
  23. Köhne, C.H.; Cunningham, D.; di Costanzo, F.; Glimelius, B.; Blijham, G.; Aranda, E.; Scheithauer, W.; Rougier, P.; Palmer, M.; Wils, J.; et al. Clinical determinants of survival in patients with 5-fluorouracil-based treatment for metastatic colorectal cancer, results of a multivariate analysis of 3825 patients. Ann. Oncol 2002, 13, 308–317. [Google Scholar]
  24. DeLong, E.R.; DeLong, D.M.; Clarke-Pearson, D.L. Comparing the areas under two or more correlated receiver operating curves, a nonparametric approach. Biometrics 1988, 44, 837–845. [Google Scholar]
  25. Taylor, J.M.G.; Ankerst, D.P.; Andridge, R.R. Validation of biomarker based risk prediction models. Clin. Cancer Res 2008, 14, 5977–5983. [Google Scholar]
  26. Bustin, S.A.; Gyselman, V.G.; Siddiqi, S.; Dorudi, S. Cytokeratin 20 is not a tissue-specific marker for the detection of malignant epithelial cells in the blood of colorectal cancer patients. Int. J. Surg. Invest 2000, 2, 49–57. [Google Scholar]
  27. Hundt, S.; Ulrike, H.; Brenner, H. Blood markers for early detection of colorectal cancer, a systematic review. Cancer Epidemiol. Biomark. Prev 2007, 16, 1935–1953. [Google Scholar]
  28. Liu, D.; Rudland, P.S.; Sibson, D.R.; Platt-Higgins, A.; Barraclough, R. Human homologue of cement gland protein, a novel metastasis inducer associated with breast carcinomas. Cancer Res 2005, 65, 3796–3805. [Google Scholar]
  29. Barraclough, D.L.; Platt-Higgins, A.; de Silva Rudland, S.; Barraclough, R.; Winstanley, J.; West, C.R.; Rudland, P.S. The metastasis-associated anterior gradient 2 protein is correlated with poor survival of breast cancer patients. Am. J. Pathol 2009, 175, 1848–1857. [Google Scholar]
  30. Zhang, Y.; Forootan, S.S.; Liu, D.; Barraclough, R.; Foster, C.S.; Rudland, P.S.; Ke, Y. Increased expression of anterior gradient-2 is significantly associated with poor survival of prostate cancer patients. Prostate Cancer Prostatic Dis 2007, 10, 293–300. [Google Scholar]
  31. Edgell, T.A.; Barraclough, D.L.; Rajic, A.; Dhulia, J.; Lewis, K.J.; Armes, J.E.; Barraclough, R.; Rudland, P.S.; Rice, G.E.; Autelitano, D.J. Increased plasma concentrations of anterior gradient 2 protein are positively associated with ovarian cancer. Clin. Sci. (Lond.) 2010, 118, 717–725. [Google Scholar]
  32. Dong, A.; Gupta, A.; Pai, R.K.; Tun, M.; Lowe, A.W. The human adenocarcinoma-associated gene, AGR2, induces expression of amphiregulin through HIPPO pathway co-activator YAP1 activation. J. Biol. Chem 2011, 286, 18301–18310. [Google Scholar]
  33. Merlos-Suárez, A.; Barriga, F.M.; Jung, P.; Iglesias, M.; Céspedes, M.V.; Rossell, D.; Sevillano, M.; Hernando-Momblona, X.; Silva-Diaz, V.; Muñoz, P.; et al. The intestinal stem cell signature identifies colorectal cancer stem cells and predicts disease relapse. Cell Stem Cell 2011, 8, 511–524. [Google Scholar]
  34. de Sousa, E.; Melo, F.; Colak, S.; Buikhuisen, J.; Koster, J.; Cameron, K.; de Jong, J.H.; Tuynman, J.B.; Prasetyanti, P.R.; Fessler, E.; et al. Methylation of cancer-stem-cell-associated WNT target genes predicts poor prognosis in colorectal cancer patients. Cell Stem Cell 2011, 9, 476–485. [Google Scholar]
  35. Pilati, P.; Mocellin, S.; Bertazza, L.; Galdi, F.; Briarava, M.; Mammano, E.; Tessari, E.; Zavagno, G.; Nitti, D. Prognostic value of putative circulating cancer stem cells in patients undergoing hepatic resection for colorectal liver metastasis. Ann. Surg. Oncol 2012, 19, 402–408. [Google Scholar]
  36. Weitz, J.; Kienle, P.; Lacroix, J.; Willeke, F.; Benner, A.; Lehnert, T.; Herfarth, C.; von Knebel Doeberitz, M. Dissemination of tumor cells in patients undergoing surgery for colorectal cancer. Clin. Cancer Res 1998, 4, 343–348. [Google Scholar]
  37. Peach, G.; Kim, C.; Zacharakis, E.; Purkayastha, S.; Ziprin, P. Prognostic significance of circulating tumor cells following surgical resection of colorectal cancers, a systematic review. Br. J. Cancer 2010, 102, 1327–1334. [Google Scholar]
  38. Cohen, S.J.; Punt, C.J.; Iannotti, N.; Saidman, B.H.; Sabbath, K.D.; Gabrail, N.Y.; Picus, J.; Morse, M.; Mitchell, E.; Miller, M.C.; et al. Relationship of circulating tumor cells to tumor response, progression-free survival, and overall survival in patients with metastatic colorectal cancer. J. Clin. Oncol 2008, 26, 3213–3221. [Google Scholar]
  39. Tol, J.; Koopman, M.; Miller, M.C.; Tibbe, A.; Cats, A.; Creemers, G.J.; Vos, A.H.; Nagtegaal, I.D.; Terstappen, L.W.; Punt, C.J. Circulating tumor cells early predict progression-free and overall survival in advanced colorectal cancer patients treated with chemotherapy and targeted agents. Ann. Oncol 2010, 21, 1006–1012. [Google Scholar]
  40. Wicha, M.S.; Hayes, D.F. Circulating tumor cells, not all detected cells are bad and not all bad cells are detected. J. Clin. Oncol 2011, 29, 1508–1511. [Google Scholar]
  41. Wittekind, C.; Greene, F.L.; Hutter, R.V.P.; Klimpfinger, M.; Sobin, L.H. TNM Atlas, 5th ed; Springer-Verlag: Berlin, Germany, 2005. [Google Scholar]
  42. Livak, K.J.; Schmittgen, T.D. Analysis of relative gene expression data using real-time quantitative PCR and the 2−ΔΔCt method. Methods 2001, 25, 402–408. [Google Scholar]
  43. Pepe, M.S.; Etzioni, R.; Feng, Z.; Potter, J.D.; Thompson, M.L.; Thornquist, M.; Winget, M.; Yasui, Y. Phases of biomarker development for early detection of cancer. J. Natl. Cancer Inst 2001, 93, 1054–1061. [Google Scholar]
  44. McShane, L.M.; Altman, D.G.; Sauerbrei, W.; Taube, S.E.; Gion, M.; Clark, G.M. Statistics subcommittee of the NCI-EORTC working group on cancer diagnostics. Reporting recommendations for tumor marker prognostic studies (REMARK). J. Natl. Cancer Inst 2005, 97, 1180–1184. [Google Scholar]
  45. Bustin, S.A.; Benes, V.; Garson, J.A.; Hellemans, J.; Huggett, J.; Kubista, M.; Mueller, R.; Nolan, T.; Pfaffl, M.W.; Shipley, G.L.; et al. The MIQE guidelines, minimum information for publication of quantitative real-time PCR experiments. Clin. Chem 2009, 55, 611–622. [Google Scholar]
Figure 1. AGR2 and LGR5 ROC curves. mRNA relative levels were quantified in blood obtained from patients with colorectal cancer and from controls. Area under the curve (AUC), 95% confidence interval and p-values are shown.
Ijms 13 04367f1
Figure 2. AGR2 and survival analysis. Kaplan-Meier plots of (a) progression-free survival (PFS) and (b) overall survival (OS) in colorectal cancer patients according to AGR2 mRNA expression in blood. Relative quantification of AGR2 mRNA was calculated by the 2−ΔΔCt method using HPRT as a reference gene. Continuous mRNA levels were converted to a dichotomous variable using the mean levels of expression as a threshold. p estimates by log-rank test. Hazard ratios (HR) were modeled using Cox proportional hazard regression analysis.
Ijms 13 04367f2
Figure 3. LGR5 and survival analysis. Kaplan-Meier plots of (a) progression-free survival (PFS) and (b) overall survival (OS) in colorectal cancer patients according to LGR5 mRNA expression in blood. Relative quantification of LGR5 mRNA was calculated by the 2−ΔΔCt method using HPRT as a reference gene. Continuous mRNA levels were converted to a dichotomous variable using the mean levels of expression as a threshold. p estimates by log-rank test. Hazard ratios (HR) were modeled using Cox proportional hazard regression analysis.
Ijms 13 04367f3
Figure 4. Combined AGR2/LGR5 and survival analysis. Kaplan-Meier plots of (a) progression-free survival (PFS) and (b) overall survival (OS) in colorectal cancer patients according to combined AGR2/LGR5 mRNA profile in blood. Relative quantification of mRNA was calculated by the 2−ΔΔCt method using HPRT as a reference gene. Patients were divided into favorable mRNA profile (both AGR2 and LGR5 below the mean) and unfavorable mRNA profile (AGR2 and/or LGR5 above the mean). p estimates by log-rank test. Hazard ratios (HR) were modeled using Cox proportional hazard regression analysis.
Ijms 13 04367f4
Table 1. Patient baseline and clinical characteristics.
Mean (SD)Range
Age (years)62.7 (9.6)31–80
N%
<60 years2037.0
≥60 years3463.0
Gender
Female2138.9
Male3361.1
Stage
I–II611.1
III1222.2
IV3666.7
pT
pT1–pT2614.1
pT33666.7
pT4814.8
pTx47.4
pN
pN01324.1
pN12648.1
pN21120.4
pNx47.4
M
M01833.3
M13666.7
Residual disease status
R0–R11629.6
R23870.4
Number of Metastatic Sites
01833.3
12546.3
≥21120.4
Location of Metastasis
None1833.3
Liver Only2342.6
Liver and Other1120.4
Non-liver Metastasis23.7
Grade
Low Grade1018.5
High Grade4481.5
Vascular/Perineural Invasion
Unknown611.1
No2444.4
Yes2444.4
Table 2. Distribution of clinical and pathological parameters and levels of AGR2 and LGR5 mRNA in the blood.
ParameterAGR2LGR5

MeanSEMpMeanSEMp
Age (y)0.4590.128
<60497.0142.222.510.0
≥60367.3105.15.05.0
Gender0.0750.203
Male291.187.95.83.9
Female633.7161.522.111.7
Stage0.137*0.204*
I–II1.10.20.30.05
III471.3171.20.10.08
IV492.6113.818.47.7
pT0.002a0.915
pT1–T282.157.510.710.5
pT3–T4453.792.412.55.8
pN0.063*0.309*
Node Negative306.9162.30.260.05
pN1311.780.413.17.01
pN2795.2266.323.916.4
M0.2830.024a
M0305.4122.50.180.06
M1492.6113.818.47.7
R Status0.6710.024a
R0–R1363.2156.10.130.03
R2442.6101.740.37.01
Number of Metastatic sites0.373*0.159*
0305.4122.50.180.06
1407.7145.021.510.6
≥2628.4184.712.39.3
Grade0.023a0.024a
Low grade183.071.90.10.04
High grade480.9102.814.66.1
Vascular/Perineural Invasion0.7510.269
No385.8100.66.66.5
Yes441.2146.118.68.5
AGR2 and LGR5, mean relative expression levels, arbitrary units; SEM: standard error of the median, t-test;
*ANOVA;
ap values of less than 0.05.
Table 3. Progression-free survival and overall survival in relation to clinic and pathological characteristics and blood AGR2/LGR5 mRNA: Multivariate Cox proportional hazard analysis.
WaldHazard Ratio95% CIp
Progression free survival
Depth of invasionpT12/pT3/pT41.0421.4300.7202.8410.307
Lymph NodesNegative/Positive0.8341.7140.5395.4450.361
Residual diseaseR01/R28.0475.8241.72419.680.005
AGR2/LGR5Negative/Positive6.0252.8031.2316.3850.014
Overall survival
Depth of invasionpT12/pT3/pT40.7411.4430.6263.3220.389
Lymph NodesNegative/Positive0.0201.0850.3483.3840.888
Residual diseaseR01/R27.0417.3381.68331.990.008
AGR2/LGR5Negative/Positive1.1581.5940.6823.7240.282
AGR2/LGR5 negative in blood indicate both mRNA markers below the mean; a positive result indicates AGR2 and/or LGR5 above the mean.

