Reconsideration of Dynamic Force Spectroscopy Analysis of Streptavidin-Biotin Interactions

Abstract
:1. Introduction
2. Developed Techniques and Experimental Methods
2.1. For Precise and Deeper Analysis
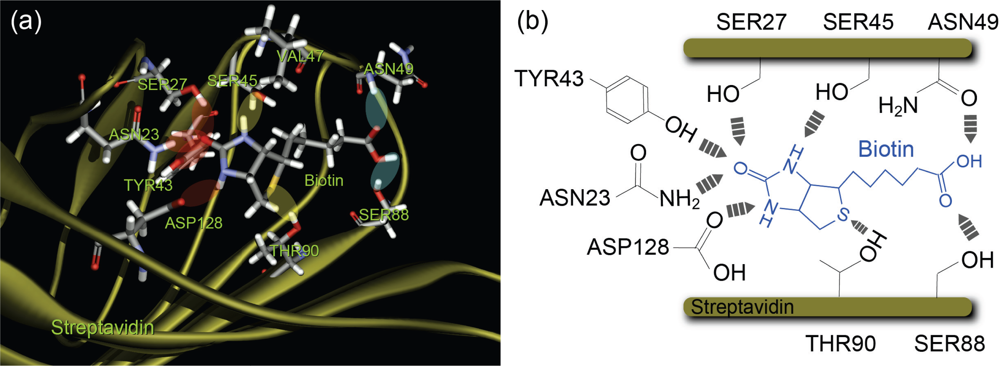
2.2. Structure of Streptavidin Molecule
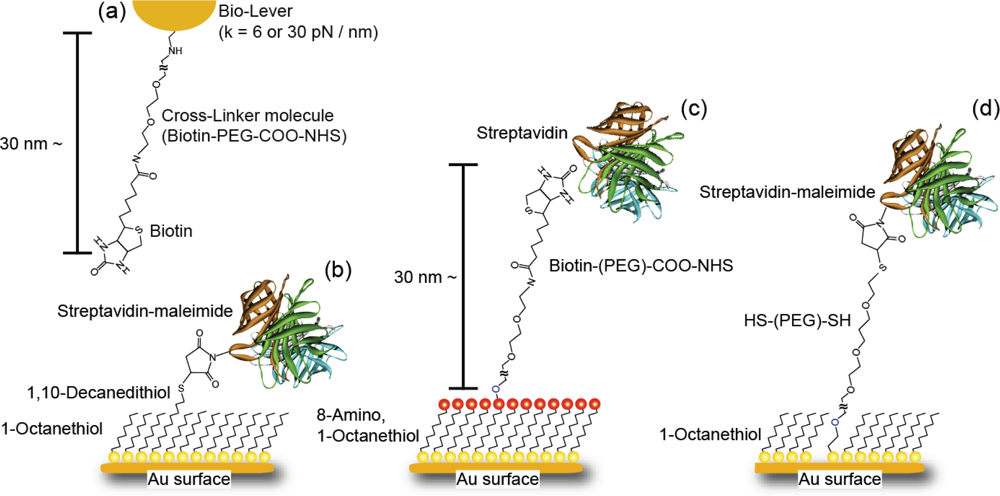
2.3. Cantilever and Sample Preparation
2.4. Measurement Procedures
3. Results and Discussion
3.1. Confirmation of Measurement Conditions
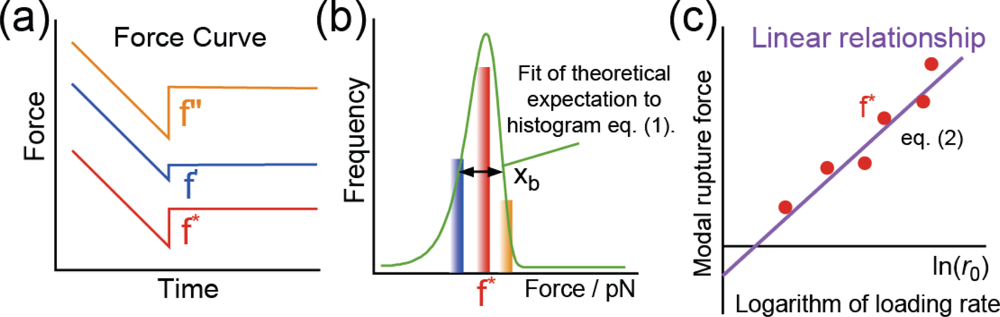
3.2. Rupture Force Distribution and Potential Barrier Position
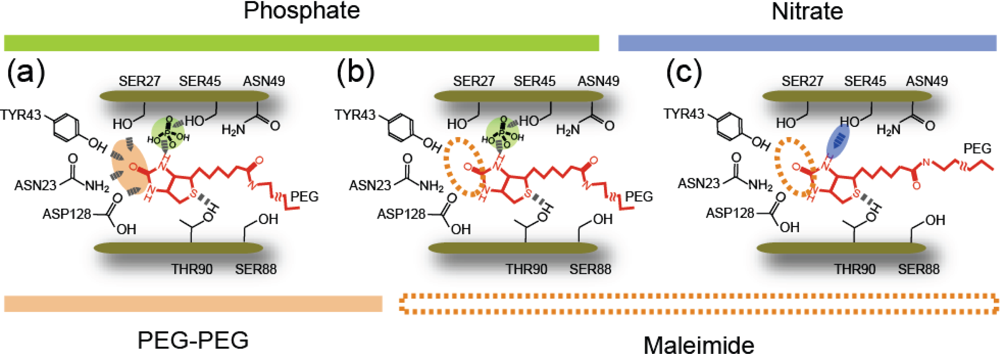
3.3. Analysis of Molecular Interactions–Potential Barrier Position
3.4. Analysis of Molecular Interactions–Lifetime
3.5. Analysis of Molecular Interactions – Reaction Processes
4. Conclusions
Acknowledgments
References and Notes
- Badjić, JD; Balzani, V; Credi, A; Silvi, S; Stoddart, JF. A molecular elevator. Science 2004, 303, 1845–1849. [Google Scholar]
- Kay, ER; Leigh, DA; Zerbetto, F. Synthetic molecular motors and mechanical machines. Angew. Chem.: Int. Ed 2007, 46, 72–192. [Google Scholar]
- Ariga, K; Hill, JP; Endo, H. Developments in molecular recognition and sensing at interfaces. Int. J. Mol. Sci 2007, 8, 864–883. [Google Scholar]
- Vestergaard, M; Kerman, K; Tamiya, E. An overview of label-free electrochemical protein. Sensors 2007, 7, 3442–3458. [Google Scholar]
- Yasuda, S; Okutsu, Y; Suzuki, I; Shinohara, K; Komiyama, M; Takeuchi, O; Shigekawa, H. Single molecular anatomy of host-guest chemistry based on atomic force microscopy study of cyclodextrin-ferrocene molecular interaction. Jpn. J. Appl. Phys 2007, 46, 5614–5616. [Google Scholar]
- Yasuda, S; Suzuki, I; Shinohara, K; Shigekawa, H. Single molecular anatomy of solvophobic effects in host-guest interactions based on surface tension using atomic force microscopy. Phys Rev Lett 2006, 96, 228303:1–228303:4. [Google Scholar]
- Sulchek, TA; Friddle, RW; Langry, K; Lau, EY; Albrecht, H; Ratto, TV; DeNardo, SJ; Colvin, ME; Noy, A. Dynamic force spectroscopy of parallel individual Mucin1–antibody bonds. Proc. Natl. Acad. Sci 2005, 102, 16638–16643. [Google Scholar]
- Neuert, G; Albrecht, C; Pamir, E; Gaub, HE. Dynamic force spectroscopy of the digoxigenin–antibody complex. FEBS Lett 2006, 580, 505–509. [Google Scholar]
- Merkel, R; Nassoy, P; Leung, A; Ritchie, K; Evans, E. Energy landscapes of receptor–ligand bonds explored with dynamic force spectroscopy. Nature 1999, 397, 50–53. [Google Scholar]
- Evans, E. Introductory Lecture Energy landscapes of biomolecular adhesion and receptor anchoring at interfaces explored with dynamic force spectroscopy. Faraday Discuss 1998, 111, 1. [Google Scholar]
- Yuan, C; Chen, A; Kolb, R; Moy, VT. Energy landscape of streptavidin-biotin complexes measured by atomic force microscopy. Biochemistry 2000, 39, 10219–10223. [Google Scholar]
- Patel, AB; Allen, S; Davies, MC; Roberts, CJ; Tendler, SJB; Williams, PM. Influence of architecture on the kinetic stability of molecular assemblies. J. Am. Chem. Soc 2004, 126, 1318–1319. [Google Scholar]
- Piramowicz, MO; Czuba, P; Targosz, M; Burda, K; Szymonski, M. Dynamic force measurements of avidin–biotin and streptavdin–biotin interactions using AFM. Acta Biochim. Polon 2006, 53, 93–100. [Google Scholar]
- Wong, J; Chilkoti, A; Moy, VT. Direct force measurements of the streptavidin–biotin interaction. Biomol. Eng 1999, 16, 45–55. [Google Scholar]
- Taninaka, A; Takeuchi, O; Shigekawa, H. Site-selective anatomy of step-by-step reactions in ligand–receptor bonding processes using dynamic force spectroscopy. Appl Phys Express 2009, 2, 085002:1–085002:3. [Google Scholar]
- Takeuchi, O; Miyakoshi, T; Taninaka, A; Tanaka, K; Cho, D; Fujita, M; Yasuda, S; Jarvis, SP; Shigekawa, H. Dynamic-force spectroscopy measurement with precise force control using atomic-force microscopy probe. J Appl Phys 2006, 100, 074315:1–074315:6. [Google Scholar]
- Oberhauser, AF; Hansma, PK; Vazquez, MC; Fernandez, JM. Stepwise unfolding of titin under force-clamp atomic force microscopy. Proc. Natl. Acad. Sci 2001, 98, 468–472. [Google Scholar]
- Marszalek, PE; Li, H; Oberhauser, AF; Fernandez, JM. Chair-boat transitions in single polysaccharide molecules observed with force-ramp AFM. Proc. Natl. Acad. Sci 2002, 99, 4278–4283. [Google Scholar]
- Evans, E; Ritchie, K. Dynamic strength of molecular adhesion bonds. Biophys. J 1999, 72, 1541–1555. [Google Scholar]
- Evans, E; Ritchie, K. Strength of a weak bond connecting flexible polymer chains. Biophys. J 1999, 76, 2439–2447. [Google Scholar]
- Pierres, A; Touchard, D; Benoliel, A-M; Bongrand, P. Dissecting streptavidin-biotin interaction with a laminar flow chamber. Biophys. J 2002, 82, 3214–3223. [Google Scholar]
- Friedsam, C; Wehle, AK; Kühner, F; Gaub, HE. Dynamic single-molecule force spectroscopy: bond rupture analysis with variable spacer length. J. Phys: Condens. Matter 2003, 15, S1709–S1723. [Google Scholar]
- Pincet, F; Husson, J. The solution to the streptavidin-biotin paradox: The influence of history on the strength of single molecular bonds. Biophys. J 2005, 89, 4374–4381. [Google Scholar]
- Husson, J; Pincet, F. Analyzing single-bond experiments: Influence of the shape of the energy landscape and universal law between the width, depth, and force spectrum of the bond. Phys Rev E 2008, 77, 026108:1–026108:14. [Google Scholar]
- Strunz, T; Oroszlan, K; Schumakovitch, I; Güntherodt, H-J; Hegner, M. Model energy landscapes and the force-induced dissociation of ligand-receptor bonds. Biophys. J 2000, 79, 1206–1212. [Google Scholar]
- Björnham, O; Schedin, S. Methods and estimations of uncertainties in single-molecule dynamic force spectroscopy. Eur. Biophys. J 2009, 38, 911–922. [Google Scholar]
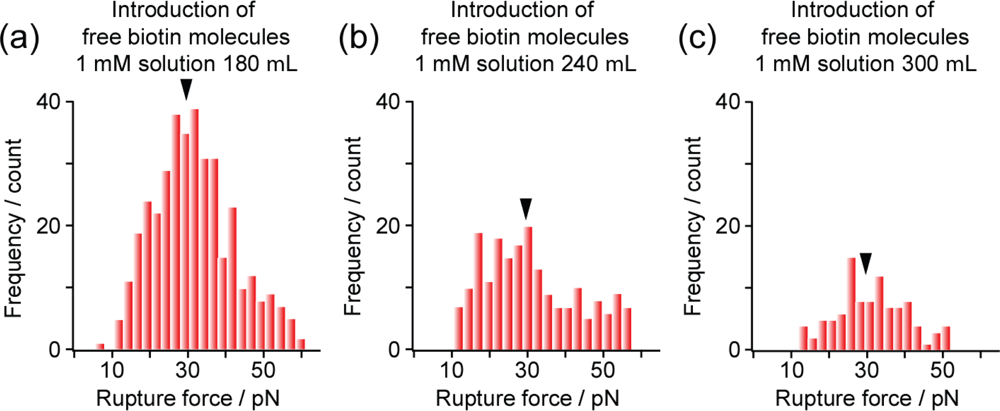
- We investigated the sampling rate dependence of the DFS analysis. Particularly for avidin-biotin bonding, the shape of the histogram of rupture force was severely deformed at the sampling rate of 1 kHz in comparison with that at the sampling rate of 100 kHz.
- Weber, PC; Ohlendorf, DH; Wendoloski, JJ; Salemme, FR. Structural origins of high-affinity biotin binding to streptavidin. Science 1989, 243, 85–88. [Google Scholar]
- Katz, BA. Binding of biotin to streptavidin stabilizes intersubunit salt bridges between Asp61 and His87 at low pH. J. Mol. Biol 1997, 274, 776–800. [Google Scholar]
- Grubmüller, H; Heymann, B; Tavan, P. Ligand binding: Molecular mechanics calculation of the streptavidin-biotin rupture force. Science 1996, 271, 997–999. [Google Scholar]
- Zhou, J; Zhang, L; Yongsheng, L; Tsao, H-K; Sheng, Y-J; Jiang, S. Unbinding of the streptavidin-biotin complex by atomic force microscopy: A hybrid simulation study. J Chem Phys 2006, 125, 104905:1–104905:7. [Google Scholar]


| Method | Surface spacer molecule and length | Tip cross-linker and length | Solution | Potential barrier xb1/nm | Potential barrier xb2/nm | k1/s−1 | k2/s−1 | Reference |
|---|---|---|---|---|---|---|---|---|
| BFP | PEG (30 nm) | PEG (30 nm) | PBS (pH 6.8) | 0.5 | 0.12 | 6.14 ×10⁻⁵ | 2.9 | [9] |
| AFM | Agarose polymer (-) | BSA (3 nm∼) | PBS (pH 7.2) | 0.49 | 0.05 | 1.67 ×10⁻⁵ | 2.09 | [11] |
| AFM | BSA (3 nm∼) | BSA (3 nm∼) | - | 0.6 | 0.14 | 0.2 | 54 | [12] |
| AFM | poly-L-lysine (-) | Glutaraldehyde (1 nm) | PBS (pH 7.2) | 0.081 | 0.024 | 0.56 | 2.98 | [13] |
| pH | condition | Buffer solution | Potential barrier position (xb) | |||
|---|---|---|---|---|---|---|
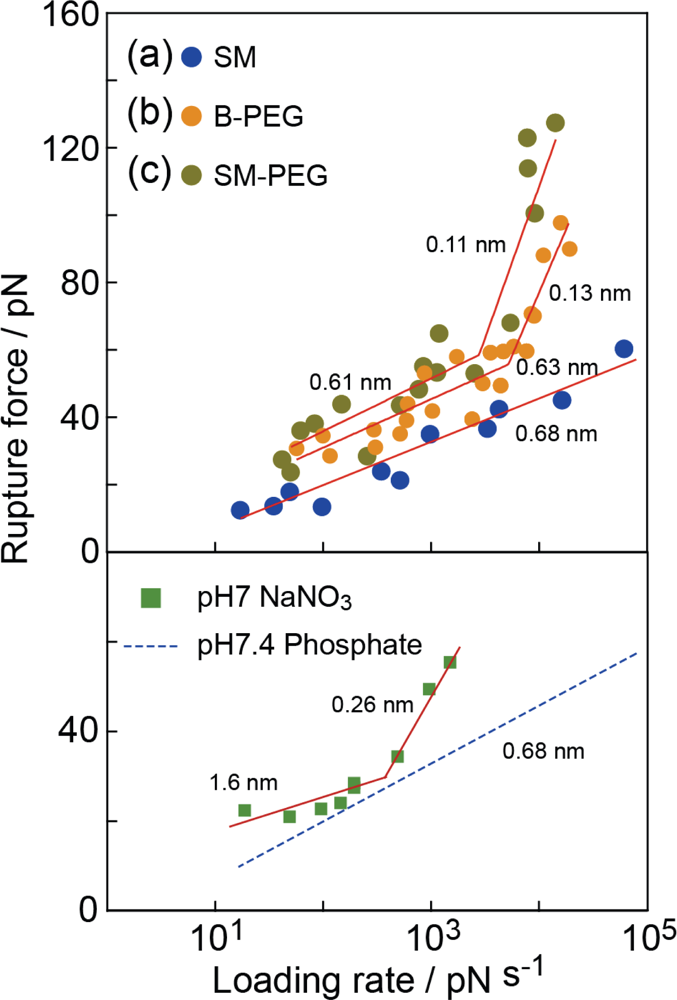
| pH7.4 | SM | Phosphate | - | - | 0.68 nm | - |
| pH7 | SM[15] | NaNO3 | - | 0.26 nm | - | 1.6 nm |
| pH7.4 | B-PEG [15] | Phosphate | 0.13 nm | - | 0.63 nm | - |
| pH7.4 | SM-PEG | Phosphate | 0.11 nm | - | 0.61 nm | - |
| pH6.8 | R. Merkel et al.[9,10] | Phosphate | 0.12 nm | - | 0.50 nm | - |
| Bond type | Direct bond | Direct bond | Salt bridge | - | ||
| Amino acid residue | ASP128, TYR43, ASN23 | SER27, SER45 | SER27, SER45 | - | ||
| Barrier positions by MD[ 31] | 0.10 nm | 0.26 nm | - | - | ||
| Reaction area | inner | middle | - | - | ||
© 2010 by the authors; licensee Molecular Diversity Preservation International, Basel, Switzerland. This article is an open-access article distributed under the terms and conditions of the Creative Commons Attribution license (http://creativecommons.org/licenses/by/3.0/).
Share and Cite
Taninaka, A.; Takeuchi, O.; Shigekawa, H. Reconsideration of Dynamic Force Spectroscopy Analysis of Streptavidin-Biotin Interactions. Int. J. Mol. Sci. 2010, 11, 2134-2151. https://doi.org/10.3390/ijms11052134
Taninaka A, Takeuchi O, Shigekawa H. Reconsideration of Dynamic Force Spectroscopy Analysis of Streptavidin-Biotin Interactions. International Journal of Molecular Sciences. 2010; 11(5):2134-2151. https://doi.org/10.3390/ijms11052134
Chicago/Turabian StyleTaninaka, Atsushi, Osamu Takeuchi, and Hidemi Shigekawa. 2010. "Reconsideration of Dynamic Force Spectroscopy Analysis of Streptavidin-Biotin Interactions" International Journal of Molecular Sciences 11, no. 5: 2134-2151. https://doi.org/10.3390/ijms11052134
APA StyleTaninaka, A., Takeuchi, O., & Shigekawa, H. (2010). Reconsideration of Dynamic Force Spectroscopy Analysis of Streptavidin-Biotin Interactions. International Journal of Molecular Sciences, 11(5), 2134-2151. https://doi.org/10.3390/ijms11052134